Attached files
| file | filename |
|---|---|
| 8-K - 8-K - PCB BANCORP | d630545d8k.htm |

Exhibit 99.1 2018 Annual Shareholders’ Meeting September 27, 2018 1Exhibit 99.1 2018 Annual Shareholders’ Meeting September 27, 2018 1
Safe Harbor Statement This presentation (and oral statements made regarding the subject of this presentation) contains certain “forward- looking statements” that are based on various facts and derived utilizing numerous important assumptions and are subject to known and unknown risks, uncertainties and other factors that may cause our actual results, performance or achievements to be materially different from any future results, performance or achievements expressed or implied by such forward-looking statements. Forward-looking statements include information about our future financial performance, business and growth strategy, projected plans and objectives, as well as projections of macroeconomic and industry trends, which are inherently unreliable due to the multiple factors that impact economic trends, and any such variations may be material. Statements preceded by, followed by or that otherwise include the words “believes,” “expects,” “anticipates,” “intends,” “projects,” “estimates,” “plans” and similar expressions or future or conditional verbs such as “will,” “should,” “would,” “may” and “could” are generally forward-looking in nature and not historical facts, although not all forward-looking statements include the foregoing. Forward-looking statements are based on management’s current expectations and involve risks and uncertainties that could cause actual results to differ materially from the Company’s historical results or those described in our forward-looking statements. Pacific City Financial Corporation disclaims any obligation to update any forward-looking statement. This presentation contains certain non-GAAP financial measures intended to supplement, not substitute for, comparable GAAP measures. Reconciliations of non-GAAP financial measures to GAAP financial measures are provided at the end of this presentation. Numbers in the presentation may not sum due to rounding. 2 your Partner • Choice • BankSafe Harbor Statement This presentation (and oral statements made regarding the subject of this presentation) contains certain “forward- looking statements” that are based on various facts and derived utilizing numerous important assumptions and are subject to known and unknown risks, uncertainties and other factors that may cause our actual results, performance or achievements to be materially different from any future results, performance or achievements expressed or implied by such forward-looking statements. Forward-looking statements include information about our future financial performance, business and growth strategy, projected plans and objectives, as well as projections of macroeconomic and industry trends, which are inherently unreliable due to the multiple factors that impact economic trends, and any such variations may be material. Statements preceded by, followed by or that otherwise include the words “believes,” “expects,” “anticipates,” “intends,” “projects,” “estimates,” “plans” and similar expressions or future or conditional verbs such as “will,” “should,” “would,” “may” and “could” are generally forward-looking in nature and not historical facts, although not all forward-looking statements include the foregoing. Forward-looking statements are based on management’s current expectations and involve risks and uncertainties that could cause actual results to differ materially from the Company’s historical results or those described in our forward-looking statements. Pacific City Financial Corporation disclaims any obligation to update any forward-looking statement. This presentation contains certain non-GAAP financial measures intended to supplement, not substitute for, comparable GAAP measures. Reconciliations of non-GAAP financial measures to GAAP financial measures are provided at the end of this presentation. Numbers in the presentation may not sum due to rounding. 2 your Partner • Choice • Bank
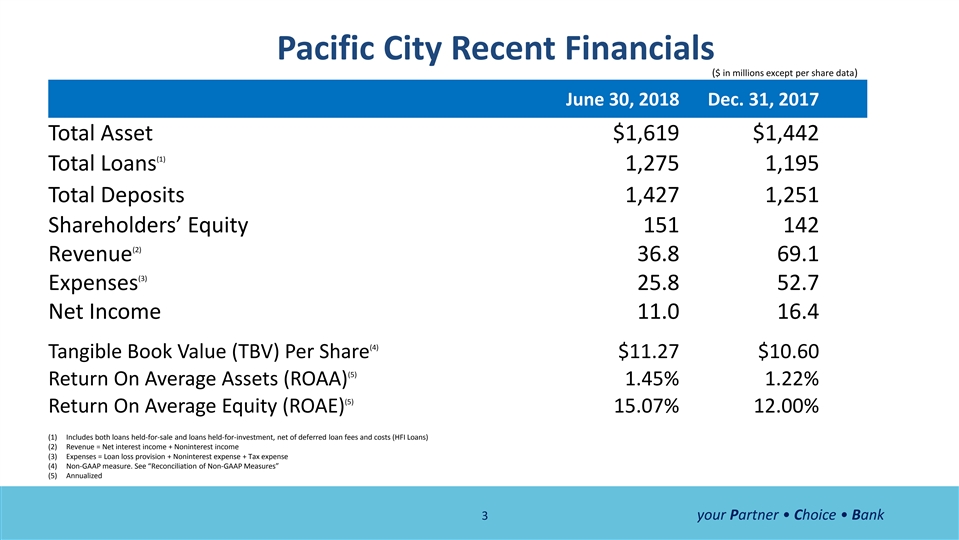
Pacific City Recent Financials ($ in millions except per share data) June 30, 2018 Dec. 31, 2017 Total Asset $1,619 $1,442 (1) Total Loans 1,275 1,195 Total Deposits 1,427 1,251 Shareholders’ Equity 151 142 (2) Revenue 36.8 69.1 (3) Expenses 25.8 52.7 Net Income 11.0 16.4 (4) Tangible Book Value (TBV) Per Share $11.27 $10.60 (5) Return On Average Assets (ROAA) 1.45% 1.22% (5) Return On Average Equity (ROAE) 15.07% 12.00% (1) Includes both loans held-for-sale and loans held-for-investment, net of deferred loan fees and costs (HFI Loans) (2) Revenue = Net interest income + Noninterest income (3) Expenses = Loan loss provision + Noninterest expense + Tax expense (4) Non-GAAP measure. See “Reconciliation of Non-GAAP Measures” (5) Annualized 3 your Partner • Choice • BankPacific City Recent Financials ($ in millions except per share data) June 30, 2018 Dec. 31, 2017 Total Asset $1,619 $1,442 (1) Total Loans 1,275 1,195 Total Deposits 1,427 1,251 Shareholders’ Equity 151 142 (2) Revenue 36.8 69.1 (3) Expenses 25.8 52.7 Net Income 11.0 16.4 (4) Tangible Book Value (TBV) Per Share $11.27 $10.60 (5) Return On Average Assets (ROAA) 1.45% 1.22% (5) Return On Average Equity (ROAE) 15.07% 12.00% (1) Includes both loans held-for-sale and loans held-for-investment, net of deferred loan fees and costs (HFI Loans) (2) Revenue = Net interest income + Noninterest income (3) Expenses = Loan loss provision + Noninterest expense + Tax expense (4) Non-GAAP measure. See “Reconciliation of Non-GAAP Measures” (5) Annualized 3 your Partner • Choice • Bank
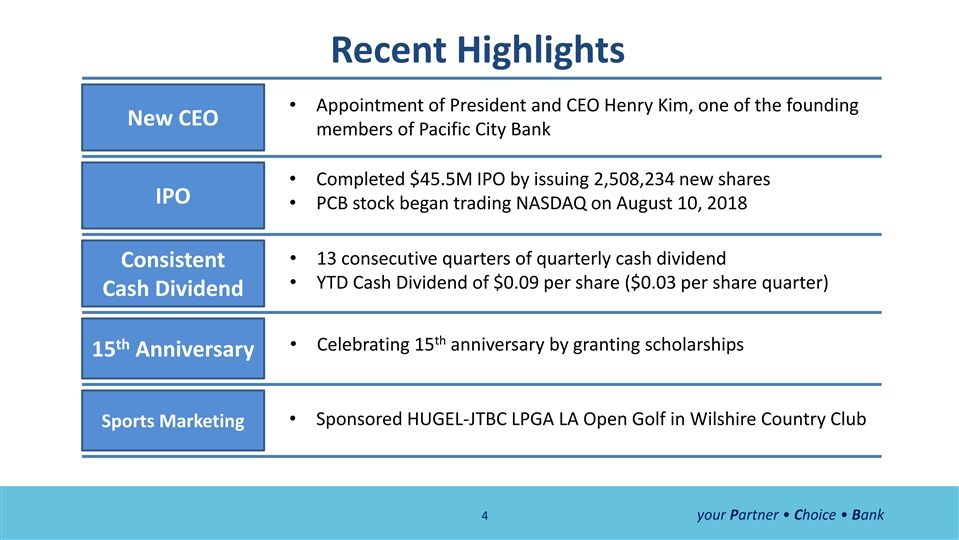
Recent Highlights • Appointment of President and CEO Henry Kim, one of the founding New CEO members of Pacific City Bank • Completed $45.5M IPO by issuing 2,508,234 new shares IPO • PCB stock began trading NASDAQ on August 10, 2018 • 13 consecutive quarters of quarterly cash dividend Consistent • YTD Cash Dividend of $0.09 per share ($0.03 per share quarter) Cash Dividend th th • Celebrating 15 anniversary by granting scholarships 15 Anniversary • Sponsored HUGEL-JTBC LPGA LA Open Golf in Wilshire Country Club Sports Marketing 4 your Partner • Choice • BankRecent Highlights • Appointment of President and CEO Henry Kim, one of the founding New CEO members of Pacific City Bank • Completed $45.5M IPO by issuing 2,508,234 new shares IPO • PCB stock began trading NASDAQ on August 10, 2018 • 13 consecutive quarters of quarterly cash dividend Consistent • YTD Cash Dividend of $0.09 per share ($0.03 per share quarter) Cash Dividend th th • Celebrating 15 anniversary by granting scholarships 15 Anniversary • Sponsored HUGEL-JTBC LPGA LA Open Golf in Wilshire Country Club Sports Marketing 4 your Partner • Choice • Bank
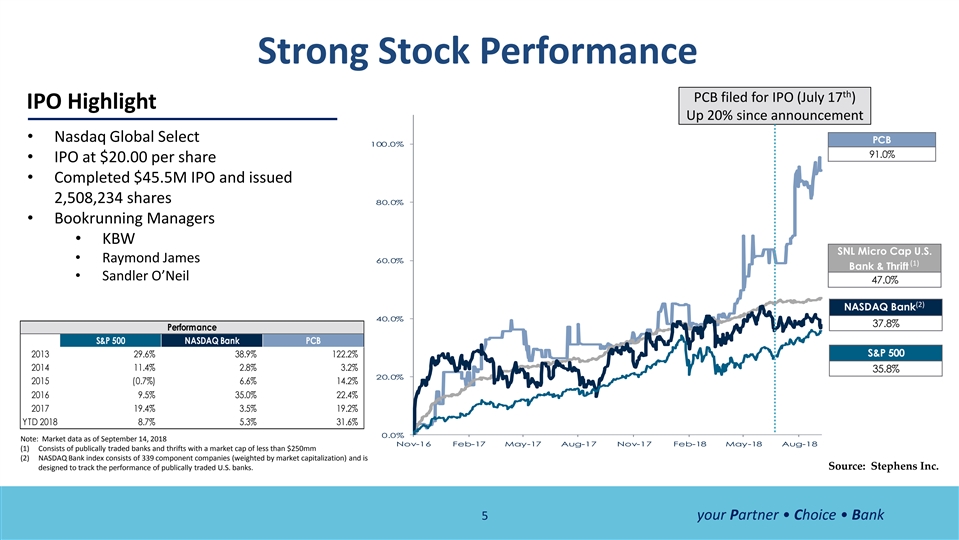
Strong Stock Performance th PCB filed for IPO (July 17 ) IPO Highlight Up 20% since announcement • Nasdaq Global Select PCB 100.0% 91.0% • IPO at $20.00 per share • Completed $45.5M IPO and issued 2,508,234 shares 80.0% • Bookrunning Managers • KBW SNL Micro Cap U.S. • Raymond James 60.0% (1) (1) Bank & Thrift • Sandler O’Neil 47.0% (2) (2) NASDAQ Bank 40.0% 37.8% Performance S&P 500 NASDAQ Bank PCB 2013 29.6% 38.9% 122.2% S&P 500 2014 11.4% 2.8% 3.2% 35.8% 20.0% 2015 (0.7%) 6.6% 14.2% 2016 9.5% 35.0% 22.4% 2017 19.4% 3.5% 19.2% YTD 2018 8.7% 5.3% 31.6% 0.0% Note: Market data as of September 14, 2018 Nov-16 Feb-17 May-17 Aug-17 Nov-17 Feb-18 May-18 Aug-18 (1) Consists of publically traded banks and thrifts with a market cap of less than $250mm (2) NASDAQ Bank index consists of 339 component companies (weighted by market capitalization) and is designed to track the performance of publically traded U.S. banks. Source: Stephens Inc. 5 your Partner • Choice • BankStrong Stock Performance th PCB filed for IPO (July 17 ) IPO Highlight Up 20% since announcement • Nasdaq Global Select PCB 100.0% 91.0% • IPO at $20.00 per share • Completed $45.5M IPO and issued 2,508,234 shares 80.0% • Bookrunning Managers • KBW SNL Micro Cap U.S. • Raymond James 60.0% (1) (1) Bank & Thrift • Sandler O’Neil 47.0% (2) (2) NASDAQ Bank 40.0% 37.8% Performance S&P 500 NASDAQ Bank PCB 2013 29.6% 38.9% 122.2% S&P 500 2014 11.4% 2.8% 3.2% 35.8% 20.0% 2015 (0.7%) 6.6% 14.2% 2016 9.5% 35.0% 22.4% 2017 19.4% 3.5% 19.2% YTD 2018 8.7% 5.3% 31.6% 0.0% Note: Market data as of September 14, 2018 Nov-16 Feb-17 May-17 Aug-17 Nov-17 Feb-18 May-18 Aug-18 (1) Consists of publically traded banks and thrifts with a market cap of less than $250mm (2) NASDAQ Bank index consists of 339 component companies (weighted by market capitalization) and is designed to track the performance of publically traded U.S. banks. Source: Stephens Inc. 5 your Partner • Choice • Bank
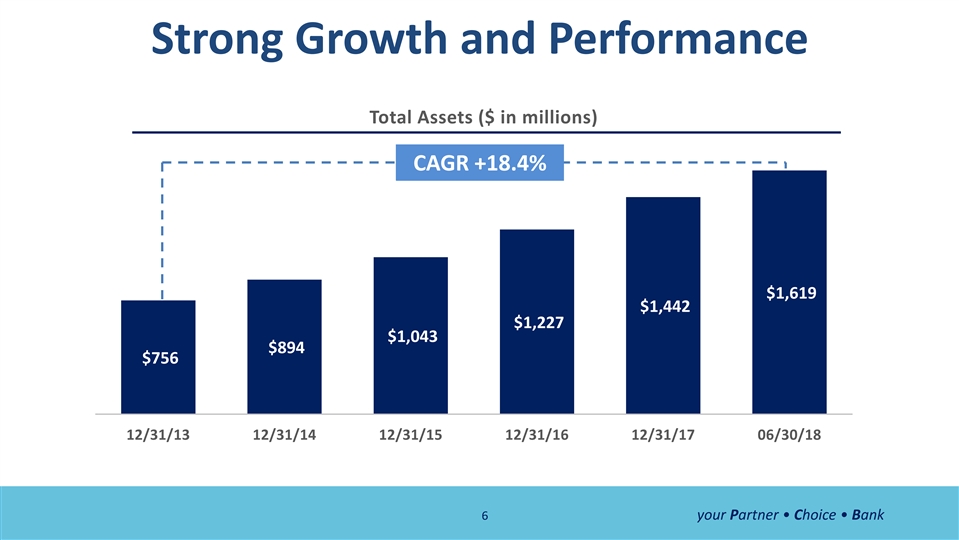
Strong Growth and Performance Total Assets ($ in millions) CAGR +18.4% $1,619 $1,442 $1,227 $1,043 $894 $756 12/31/13 12/31/14 12/31/15 12/31/16 12/31/17 06/30/18 6 your Partner • Choice • BankStrong Growth and Performance Total Assets ($ in millions) CAGR +18.4% $1,619 $1,442 $1,227 $1,043 $894 $756 12/31/13 12/31/14 12/31/15 12/31/16 12/31/17 06/30/18 6 your Partner • Choice • Bank
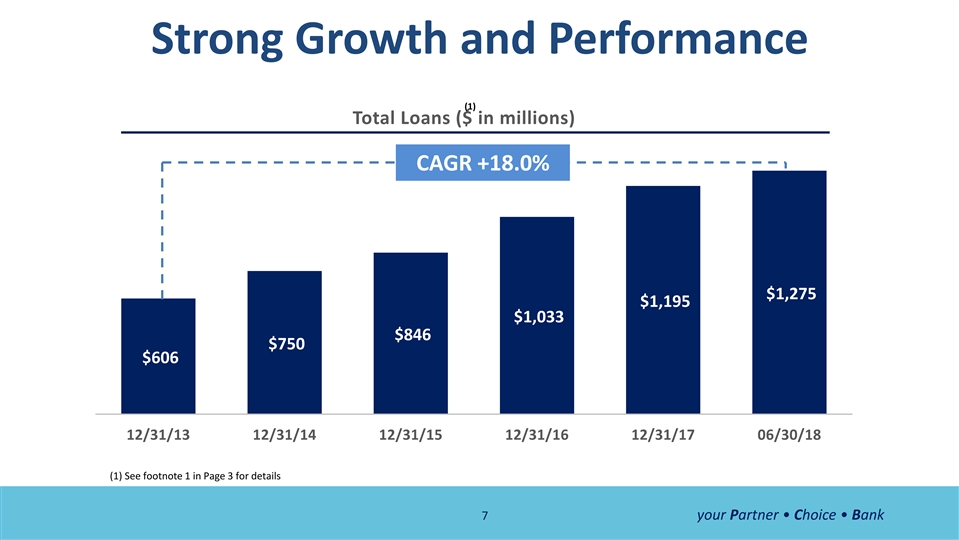
Strong Growth and Performance (1) Total Loans ($ in millions) CAGR +18.0% $1,275 $1,195 $1,033 $846 $750 $606 12/31/13 12/31/14 12/31/15 12/31/16 12/31/17 06/30/18 (1) See footnote 1 in Page 3 for details 7 your Partner • Choice • BankStrong Growth and Performance (1) Total Loans ($ in millions) CAGR +18.0% $1,275 $1,195 $1,033 $846 $750 $606 12/31/13 12/31/14 12/31/15 12/31/16 12/31/17 06/30/18 (1) See footnote 1 in Page 3 for details 7 your Partner • Choice • Bank
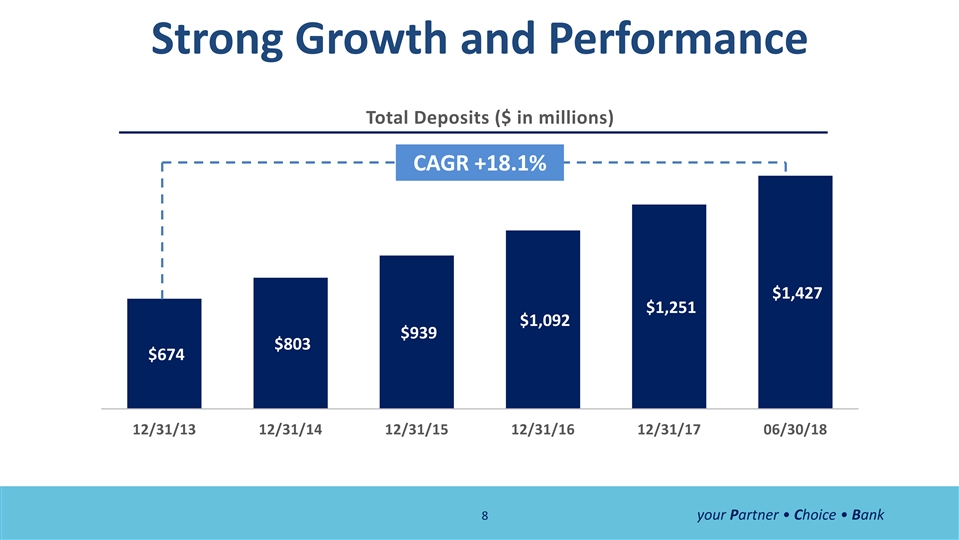
Strong Growth and Performance Total Deposits ($ in millions) CAGR +18.1% $1,427 $1,251 $1,092 $939 $803 $674 12/31/13 12/31/14 12/31/15 12/31/16 12/31/17 06/30/18 8 your Partner • Choice • BankStrong Growth and Performance Total Deposits ($ in millions) CAGR +18.1% $1,427 $1,251 $1,092 $939 $803 $674 12/31/13 12/31/14 12/31/15 12/31/16 12/31/17 06/30/18 8 your Partner • Choice • Bank
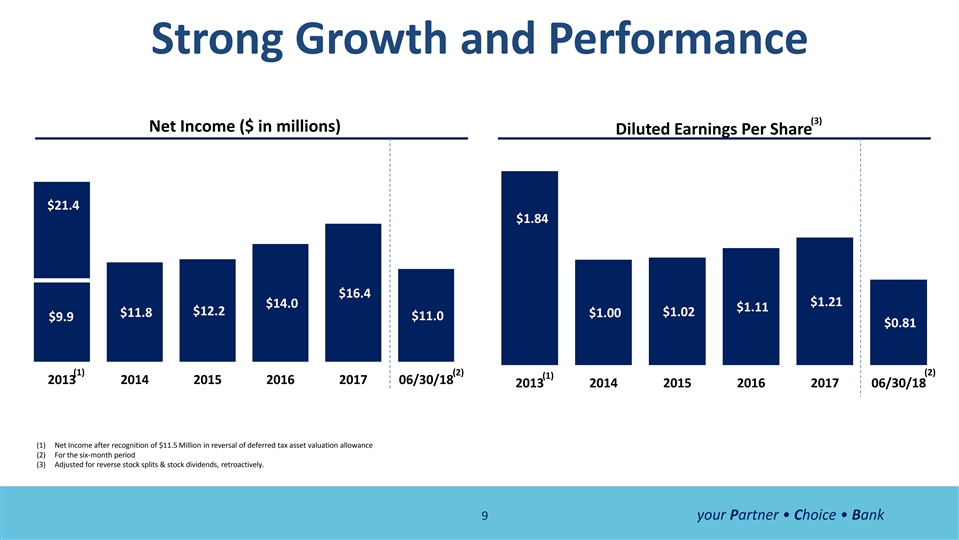
Strong Growth and Performance (3) Net Income ($ in millions) Diluted Earnings Per Share $21.4 $1.84 $16.4 $1.21 $14.0 $1.11 $12.2 $1.02 $11.8 $1.00 $11.0 $9.9 $0.81 (1) (2) (2) (1) 2013 2014 2015 2016 2017 06/30/18 2013 2014 2015 2016 2017 06/30/18 (1) Net Income after recognition of $11.5 Million in reversal of deferred tax asset valuation allowance (2) For the six-month period (3) Adjusted for reverse stock splits & stock dividends, retroactively. 9 your Partner • Choice • BankStrong Growth and Performance (3) Net Income ($ in millions) Diluted Earnings Per Share $21.4 $1.84 $16.4 $1.21 $14.0 $1.11 $12.2 $1.02 $11.8 $1.00 $11.0 $9.9 $0.81 (1) (2) (2) (1) 2013 2014 2015 2016 2017 06/30/18 2013 2014 2015 2016 2017 06/30/18 (1) Net Income after recognition of $11.5 Million in reversal of deferred tax asset valuation allowance (2) For the six-month period (3) Adjusted for reverse stock splits & stock dividends, retroactively. 9 your Partner • Choice • Bank
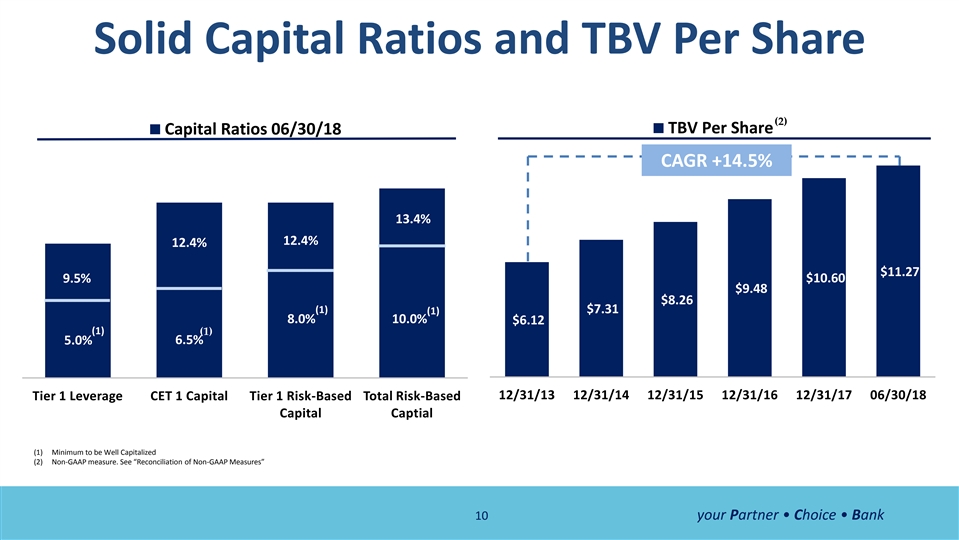
Solid Capital Ratios and TBV Per Share (2) TBV Per Share Capital Ratios 06/30/18 CAGR +14.5% 13.4% 12.4% 12.4% $11.27 $10.60 9.5% $9.48 $8.26 (1) $7.31 (1) 8.0% 10.0% $6.12 (1) (1) 6.5% 5.0% 12/31/13 12/31/14 12/31/15 12/31/16 12/31/17 06/30/18 Tier 1 Leverage CET 1 Capital Tier 1 Risk-Based Total Risk-Based Capital Captial (1) Minimum to be Well Capitalized (2) Non-GAAP measure. See “Reconciliation of Non-GAAP Measures” 10 your Partner • Choice • BankSolid Capital Ratios and TBV Per Share (2) TBV Per Share Capital Ratios 06/30/18 CAGR +14.5% 13.4% 12.4% 12.4% $11.27 $10.60 9.5% $9.48 $8.26 (1) $7.31 (1) 8.0% 10.0% $6.12 (1) (1) 6.5% 5.0% 12/31/13 12/31/14 12/31/15 12/31/16 12/31/17 06/30/18 Tier 1 Leverage CET 1 Capital Tier 1 Risk-Based Total Risk-Based Capital Captial (1) Minimum to be Well Capitalized (2) Non-GAAP measure. See “Reconciliation of Non-GAAP Measures” 10 your Partner • Choice • Bank
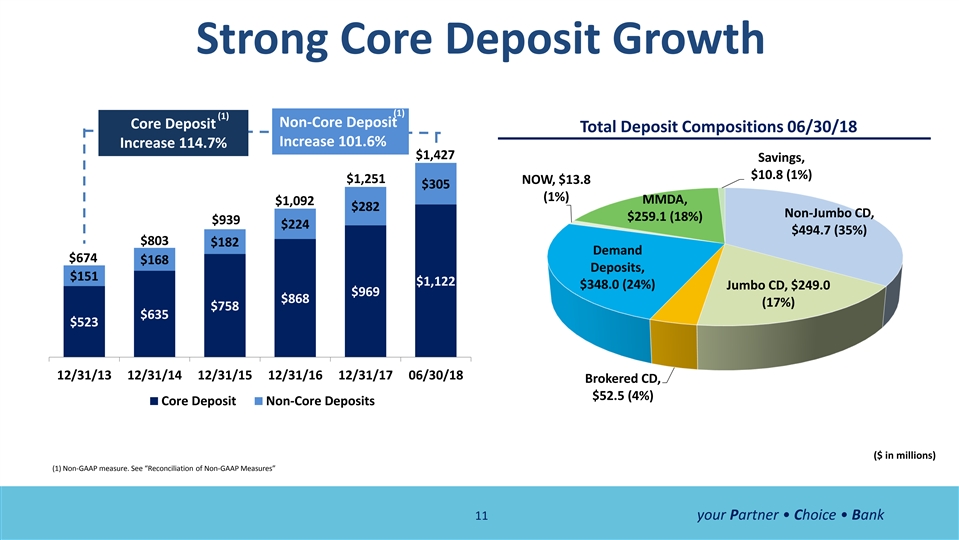
Strong Core Deposit Growth (1) (1) Non-Core Deposit Core Deposit Total Deposit Compositions 06/30/18 Increase 101.6% Increase 114.7% $1,427 Savings, $10.8 (1%) $1,251 NOW, $13.8 $305 (1%) MMDA, $1,092 $282 Non-Jumbo CD, $259.1 (18%) $939 $224 $494.7 (35%) $803 $182 Demand $674 $168 Deposits, $151 $1,122 $348.0 (24%) Jumbo CD, $249.0 $969 $868 (17%) $758 $635 $523 12/31/13 12/31/14 12/31/15 12/31/16 12/31/17 06/30/18 Brokered CD, $52.5 (4%) Core Deposit Non-Core Deposits ($ in millions) (1) Non-GAAP measure. See “Reconciliation of Non-GAAP Measures” 11 your Partner • Choice • BankStrong Core Deposit Growth (1) (1) Non-Core Deposit Core Deposit Total Deposit Compositions 06/30/18 Increase 101.6% Increase 114.7% $1,427 Savings, $10.8 (1%) $1,251 NOW, $13.8 $305 (1%) MMDA, $1,092 $282 Non-Jumbo CD, $259.1 (18%) $939 $224 $494.7 (35%) $803 $182 Demand $674 $168 Deposits, $151 $1,122 $348.0 (24%) Jumbo CD, $249.0 $969 $868 (17%) $758 $635 $523 12/31/13 12/31/14 12/31/15 12/31/16 12/31/17 06/30/18 Brokered CD, $52.5 (4%) Core Deposit Non-Core Deposits ($ in millions) (1) Non-GAAP measure. See “Reconciliation of Non-GAAP Measures” 11 your Partner • Choice • Bank
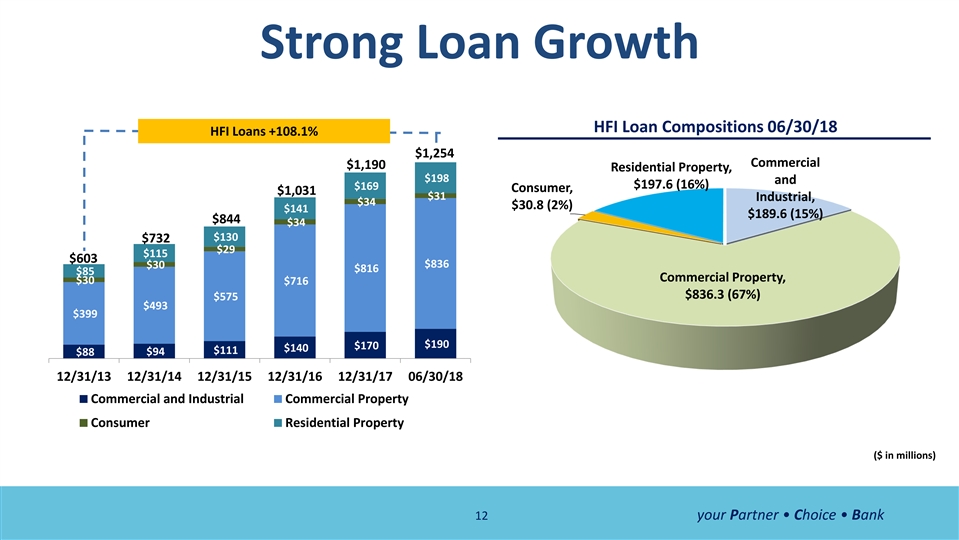
Strong Loan Growth HFI Loan Compositions 06/30/18 HFI Loans +108.1% $1,254 Commercial $1,190 Residential Property, $198 and $197.6 (16%) $169 Consumer, $1,031 $31 Industrial, $34 $30.8 (2%) $141 $189.6 (15%) $844 $34 $130 $732 $29 $115 $603 $836 $30 $816 $85 Commercial Property, $30 $716 $836.3 (67%) $575 $493 $399 $190 $170 $140 $111 $94 $88 12/31/13 12/31/14 12/31/15 12/31/16 12/31/17 06/30/18 Commercial and Industrial Commercial Property Consumer Residential Property ($ in millions) 12 your Partner • Choice • BankStrong Loan Growth HFI Loan Compositions 06/30/18 HFI Loans +108.1% $1,254 Commercial $1,190 Residential Property, $198 and $197.6 (16%) $169 Consumer, $1,031 $31 Industrial, $34 $30.8 (2%) $141 $189.6 (15%) $844 $34 $130 $732 $29 $115 $603 $836 $30 $816 $85 Commercial Property, $30 $716 $836.3 (67%) $575 $493 $399 $190 $170 $140 $111 $94 $88 12/31/13 12/31/14 12/31/15 12/31/16 12/31/17 06/30/18 Commercial and Industrial Commercial Property Consumer Residential Property ($ in millions) 12 your Partner • Choice • Bank
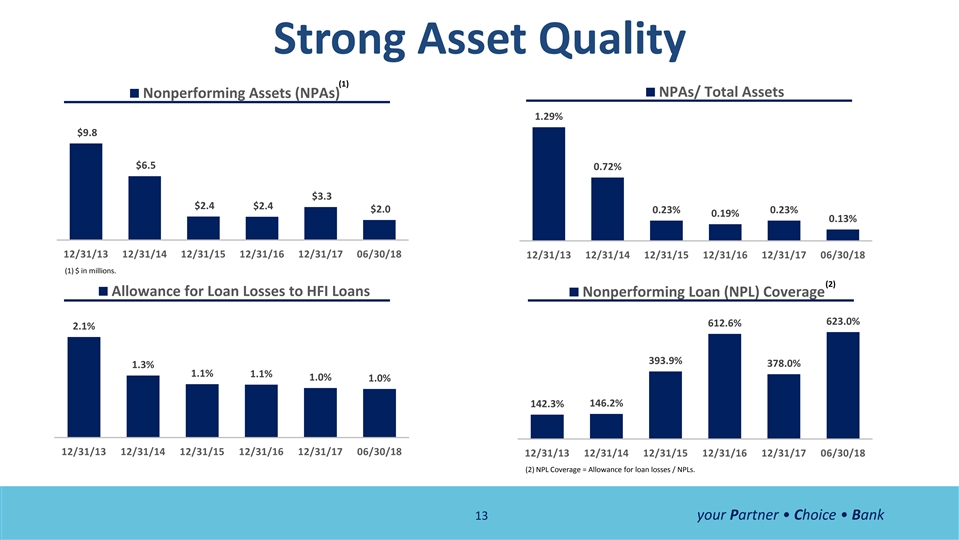
Strong Asset Quality (1) NPAs/ Total Assets Nonperforming Assets (NPAs) 1.29% $9.8 $6.5 0.72% $3.3 $2.4 $2.4 $2.0 0.23% 0.23% 0.19% 0.13% 12/31/13 12/31/14 12/31/15 12/31/16 12/31/17 06/30/18 12/31/13 12/31/14 12/31/15 12/31/16 12/31/17 06/30/18 (1) $ in millions. (2) Allowance for Loan Losses to HFI Loans Nonperforming Loan (NPL) Coverage 623.0% 612.6% 2.1% 393.9% 378.0% 1.3% 1.1% 1.1% 1.0% 1.0% 142.3% 146.2% 12/31/13 12/31/14 12/31/15 12/31/16 12/31/17 06/30/18 12/31/13 12/31/14 12/31/15 12/31/16 12/31/17 06/30/18 (2) NPL Coverage = Allowance for loan losses / NPLs. 13 your Partner • Choice • BankStrong Asset Quality (1) NPAs/ Total Assets Nonperforming Assets (NPAs) 1.29% $9.8 $6.5 0.72% $3.3 $2.4 $2.4 $2.0 0.23% 0.23% 0.19% 0.13% 12/31/13 12/31/14 12/31/15 12/31/16 12/31/17 06/30/18 12/31/13 12/31/14 12/31/15 12/31/16 12/31/17 06/30/18 (1) $ in millions. (2) Allowance for Loan Losses to HFI Loans Nonperforming Loan (NPL) Coverage 623.0% 612.6% 2.1% 393.9% 378.0% 1.3% 1.1% 1.1% 1.0% 1.0% 142.3% 146.2% 12/31/13 12/31/14 12/31/15 12/31/16 12/31/17 06/30/18 12/31/13 12/31/14 12/31/15 12/31/16 12/31/17 06/30/18 (2) NPL Coverage = Allowance for loan losses / NPLs. 13 your Partner • Choice • Bank
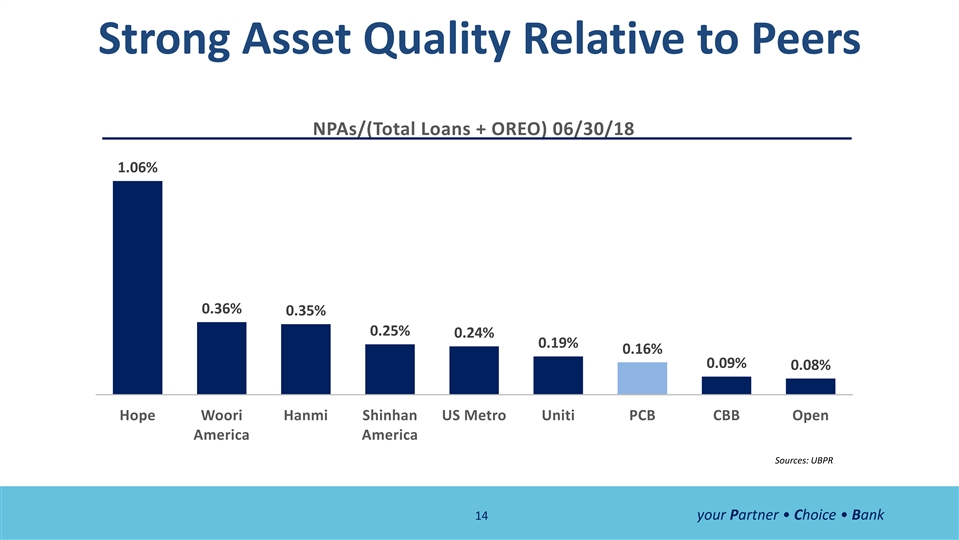
Strong Asset Quality Relative to Peers NPAs/(Total Loans + OREO) 06/30/18 1.06% 0.36% 0.35% 0.25% 0.24% 0.19% 0.16% 0.09% 0.08% Hope Woori Hanmi Shinhan US Metro Uniti PCB CBB Open America America Sources: UBPR 14 your Partner • Choice • BankStrong Asset Quality Relative to Peers NPAs/(Total Loans + OREO) 06/30/18 1.06% 0.36% 0.35% 0.25% 0.24% 0.19% 0.16% 0.09% 0.08% Hope Woori Hanmi Shinhan US Metro Uniti PCB CBB Open America America Sources: UBPR 14 your Partner • Choice • Bank
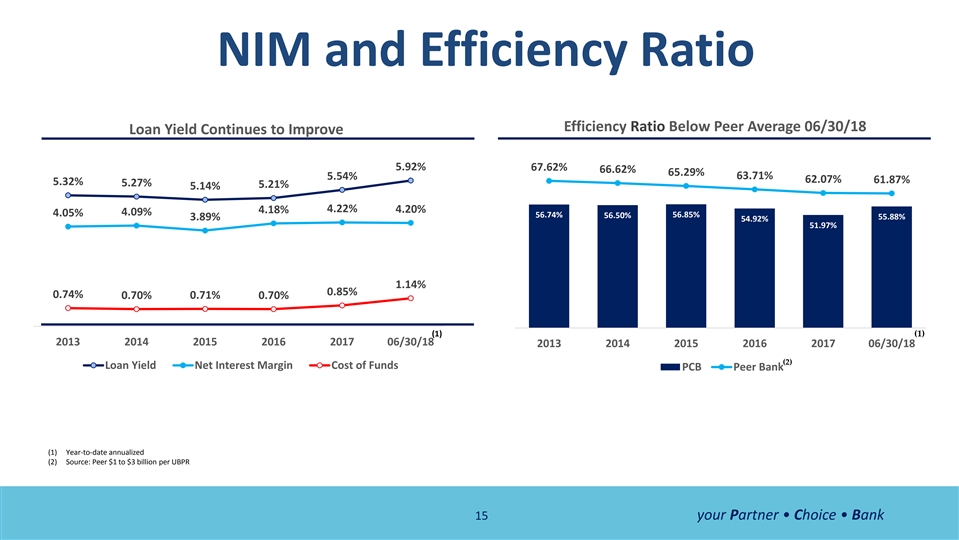
NIM and Efficiency Ratio Efficiency Ratio Below Peer Average 06/30/18 Loan Yield Continues to Improve 5.92% 67.62% 66.62% 65.29% 63.71% 5.54% 62.07% 61.87% 5.32% 5.27% 5.21% 5.14% 4.22% 4.18% 4.20% 4.05% 4.09% 56.85% 56.74% 56.50% 3.89% 55.88% 54.92% 51.97% 1.14% 0.85% 0.74% 0.70% 0.71% 0.70% (1) (1) 2013 2014 2015 2016 2017 06/30/18 2013 2014 2015 2016 2017 06/30/18 (2) Loan Yield Net Interest Margin Cost of Funds PCB Peer Bank (1) Year-to-date annualized (2) Source: Peer $1 to $3 billion per UBPR 15 your Partner • Choice • BankNIM and Efficiency Ratio Efficiency Ratio Below Peer Average 06/30/18 Loan Yield Continues to Improve 5.92% 67.62% 66.62% 65.29% 63.71% 5.54% 62.07% 61.87% 5.32% 5.27% 5.21% 5.14% 4.22% 4.18% 4.20% 4.05% 4.09% 56.85% 56.74% 56.50% 3.89% 55.88% 54.92% 51.97% 1.14% 0.85% 0.74% 0.70% 0.71% 0.70% (1) (1) 2013 2014 2015 2016 2017 06/30/18 2013 2014 2015 2016 2017 06/30/18 (2) Loan Yield Net Interest Margin Cost of Funds PCB Peer Bank (1) Year-to-date annualized (2) Source: Peer $1 to $3 billion per UBPR 15 your Partner • Choice • Bank
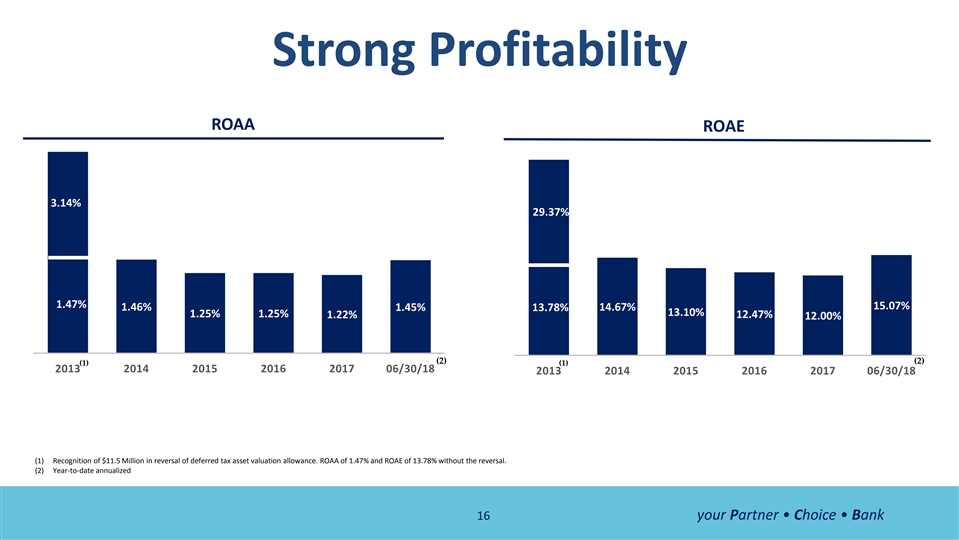
Strong Profitability ROAA ROAE 3.14% 29.37% 1.47% 15.07% 1.46% 1.45% 13.78% 14.67% 13.10% 1.25% 1.25% 1.22% 12.47% 12.00% (2) (2) (1) (1) 2013 2014 2015 2016 2017 06/30/18 2013 2014 2015 2016 2017 06/30/18 (1) Recognition of $11.5 Million in reversal of deferred tax asset valuation allowance. ROAA of 1.47% and ROAE of 13.78% without the reversal. (2) Year-to-date annualized 16 your Partner • Choice • BankStrong Profitability ROAA ROAE 3.14% 29.37% 1.47% 15.07% 1.46% 1.45% 13.78% 14.67% 13.10% 1.25% 1.25% 1.22% 12.47% 12.00% (2) (2) (1) (1) 2013 2014 2015 2016 2017 06/30/18 2013 2014 2015 2016 2017 06/30/18 (1) Recognition of $11.5 Million in reversal of deferred tax asset valuation allowance. ROAA of 1.47% and ROAE of 13.78% without the reversal. (2) Year-to-date annualized 16 your Partner • Choice • Bank
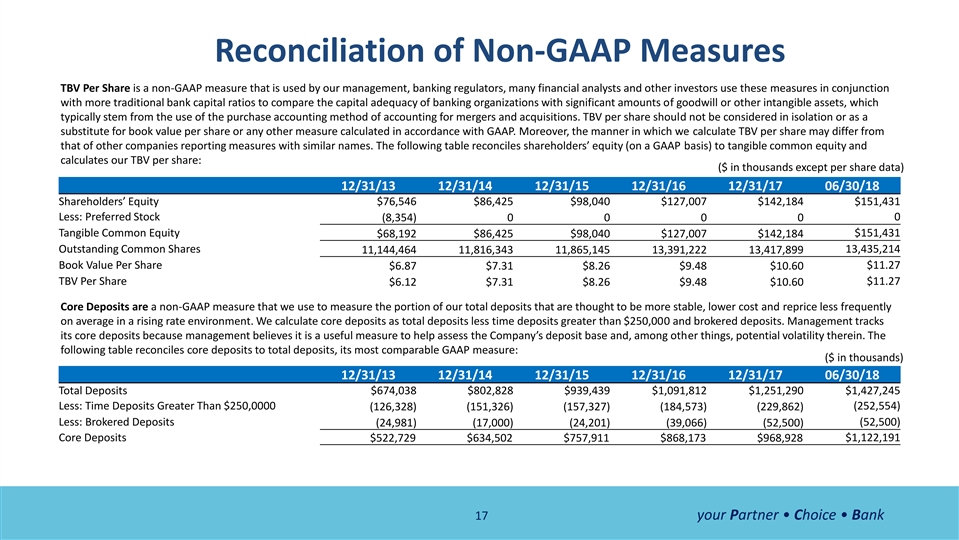
Reconciliation of Non-GAAP Measures TBV Per Share is a non-GAAP measure that is used by our management, banking regulators, many financial analysts and other investors use these measures in conjunction with more traditional bank capital ratios to compare the capital adequacy of banking organizations with significant amounts of goodwill or other intangible assets, which typically stem from the use of the purchase accounting method of accounting for mergers and acquisitions. TBV per share should not be considered in isolation or as a substitute for book value per share or any other measure calculated in accordance with GAAP. Moreover, the manner in which we calculate TBV per share may differ from that of other companies reporting measures with similar names. The following table reconciles shareholders’ equity (on a GAAP basis) to tangible common equity and calculates our TBV per share: ($ in thousands except per share data) 12/31/13 12/31/14 12/31/15 12/31/16 12/31/17 06/30/18 Shareholders’ Equity $76,546 $86,425 $98,040 $127,007 $142,184 $151,431 Less: Preferred Stock (8,354) 0 0 0 0 0 Tangible Common Equity $68,192 $86,425 $98,040 $127,007 $142,184 $151,431 Outstanding Common Shares 13,435,214 11,144,464 11,816,343 11,865,145 13,391,222 13,417,899 Book Value Per Share $11.27 $6.87 $7.31 $8.26 $9.48 $10.60 TBV Per Share $11.27 $6.12 $7.31 $8.26 $9.48 $10.60 Core Deposits are a non-GAAP measure that we use to measure the portion of our total deposits that are thought to be more stable, lower cost and reprice less frequently on average in a rising rate environment. We calculate core deposits as total deposits less time deposits greater than $250,000 and brokered deposits. Management tracks its core deposits because management believes it is a useful measure to help assess the Company’s deposit base and, among other things, potential volatility therein. The following table reconciles core deposits to total deposits, its most comparable GAAP measure: ($ in thousands) 12/31/13 12/31/14 12/31/15 12/31/16 12/31/17 06/30/18 Total Deposits $674,038 $802,828 $939,439 $1,091,812 $1,251,290 $1,427,245 Less: Time Deposits Greater Than $250,0000 (126,328) (151,326) (157,327) (184,573) (229,862) (252,554) Less: Brokered Deposits (52,500) (24,981) (17,000) (24,201) (39,066) (52,500) Core Deposits $1,122,191 $522,729 $634,502 $757,911 $868,173 $968,928 17 your Partner • Choice • BankReconciliation of Non-GAAP Measures TBV Per Share is a non-GAAP measure that is used by our management, banking regulators, many financial analysts and other investors use these measures in conjunction with more traditional bank capital ratios to compare the capital adequacy of banking organizations with significant amounts of goodwill or other intangible assets, which typically stem from the use of the purchase accounting method of accounting for mergers and acquisitions. TBV per share should not be considered in isolation or as a substitute for book value per share or any other measure calculated in accordance with GAAP. Moreover, the manner in which we calculate TBV per share may differ from that of other companies reporting measures with similar names. The following table reconciles shareholders’ equity (on a GAAP basis) to tangible common equity and calculates our TBV per share: ($ in thousands except per share data) 12/31/13 12/31/14 12/31/15 12/31/16 12/31/17 06/30/18 Shareholders’ Equity $76,546 $86,425 $98,040 $127,007 $142,184 $151,431 Less: Preferred Stock (8,354) 0 0 0 0 0 Tangible Common Equity $68,192 $86,425 $98,040 $127,007 $142,184 $151,431 Outstanding Common Shares 13,435,214 11,144,464 11,816,343 11,865,145 13,391,222 13,417,899 Book Value Per Share $11.27 $6.87 $7.31 $8.26 $9.48 $10.60 TBV Per Share $11.27 $6.12 $7.31 $8.26 $9.48 $10.60 Core Deposits are a non-GAAP measure that we use to measure the portion of our total deposits that are thought to be more stable, lower cost and reprice less frequently on average in a rising rate environment. We calculate core deposits as total deposits less time deposits greater than $250,000 and brokered deposits. Management tracks its core deposits because management believes it is a useful measure to help assess the Company’s deposit base and, among other things, potential volatility therein. The following table reconciles core deposits to total deposits, its most comparable GAAP measure: ($ in thousands) 12/31/13 12/31/14 12/31/15 12/31/16 12/31/17 06/30/18 Total Deposits $674,038 $802,828 $939,439 $1,091,812 $1,251,290 $1,427,245 Less: Time Deposits Greater Than $250,0000 (126,328) (151,326) (157,327) (184,573) (229,862) (252,554) Less: Brokered Deposits (52,500) (24,981) (17,000) (24,201) (39,066) (52,500) Core Deposits $1,122,191 $522,729 $634,502 $757,911 $868,173 $968,928 17 your Partner • Choice • Bank

“Thank You!” 18“Thank You!” 18