Attached files
| file | filename |
|---|---|
| 8-K - 8-K - VALMONT INDUSTRIES INC | a18-30102_18k.htm |
17th Annual D.A. Davidson Diversified Industrials and Services Conference September 20, 2018

Forward-looking Statement Disclosure These slides contain (and the accompanying oral discussion will contain) “forward-looking statements” within the meaning of the Private Securities Litigation Reform Act of 1995. Such statements involve known and unknown risks, uncertainties and other factors that could cause the actual results of the Company to differ materially from the results expressed or implied by such statements, including general economic and business conditions, conditions affecting the industries served by the Company and its subsidiaries, conditions affecting the Company’s customers and suppliers, competitor responses to the Company’s products and services, the overall market acceptance of such products and services, the integration of acquisitions and other factors disclosed in the Company’s periodic reports filed with the Securities and Exchange Commission. Consequently such forward-looking statements should be regarded as the Company’s current plans, estimates and beliefs. The Company does not undertake and specifically declines any obligation to publicly release the results of any revisions to these forward-looking statements that may be made to reflect any future events or circumstances after the date of such statements or to reflect the occurrence of anticipated or unanticipated events. 2 | September 2018 | Valmont Industries, Inc.

STEVE KANIEWSKI PRESIDENT & CHIEF EXECUTIVE OFFICER 3 | September 2018 | Valmont Industries, Inc.
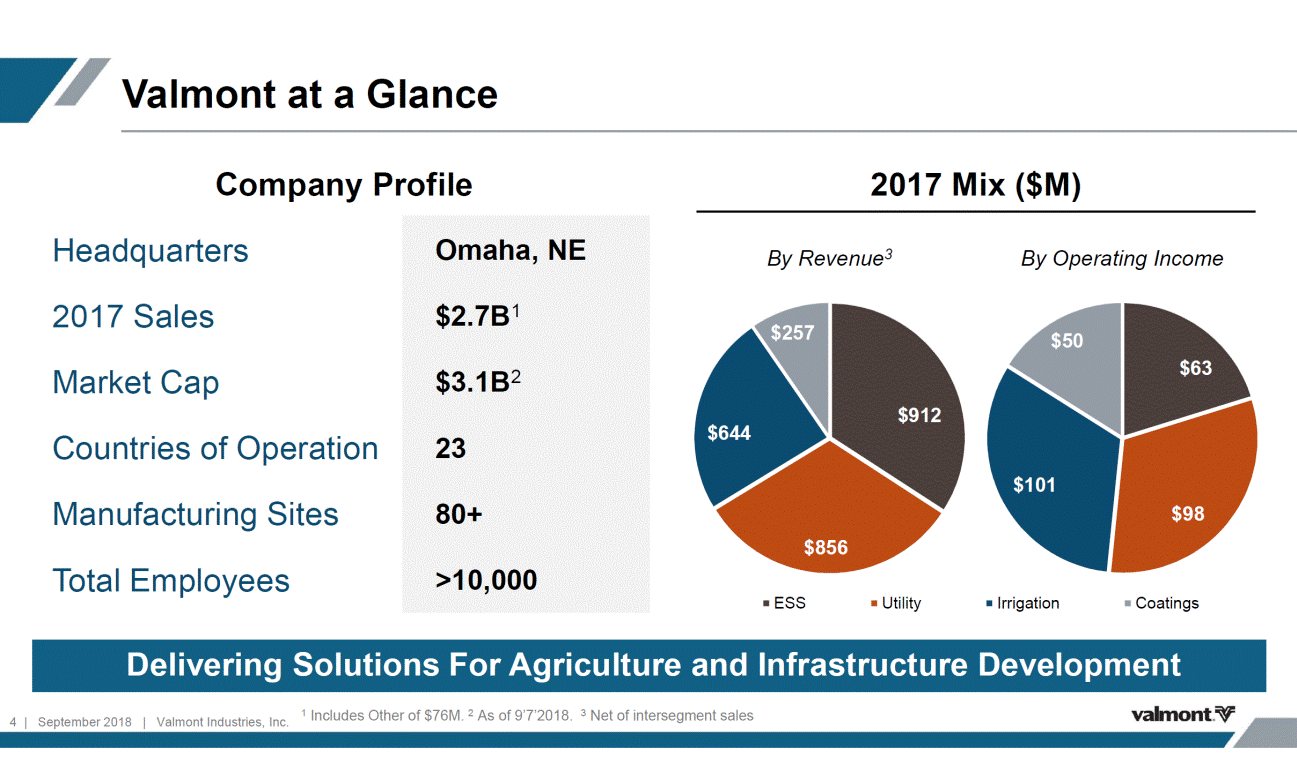
Valmont at a Glance Company Profile 2017 Mix ($M) Headquarters By Revenue3 By Operating Income 2017 Sales Market Cap Countries of Operation Manufacturing Sites Total Employees ESS Utility Irrigation Coatings 1 Includes Other of $76M. 2 As of 9’7’2018. 3 Net of intersegment sales 4 | September 2018 | Valmont Industries, Inc. Delivering Solutions For Agriculture and Infrastructure Development Omaha, NE $2.7B1 $3.1B2 23 80+ >10,000
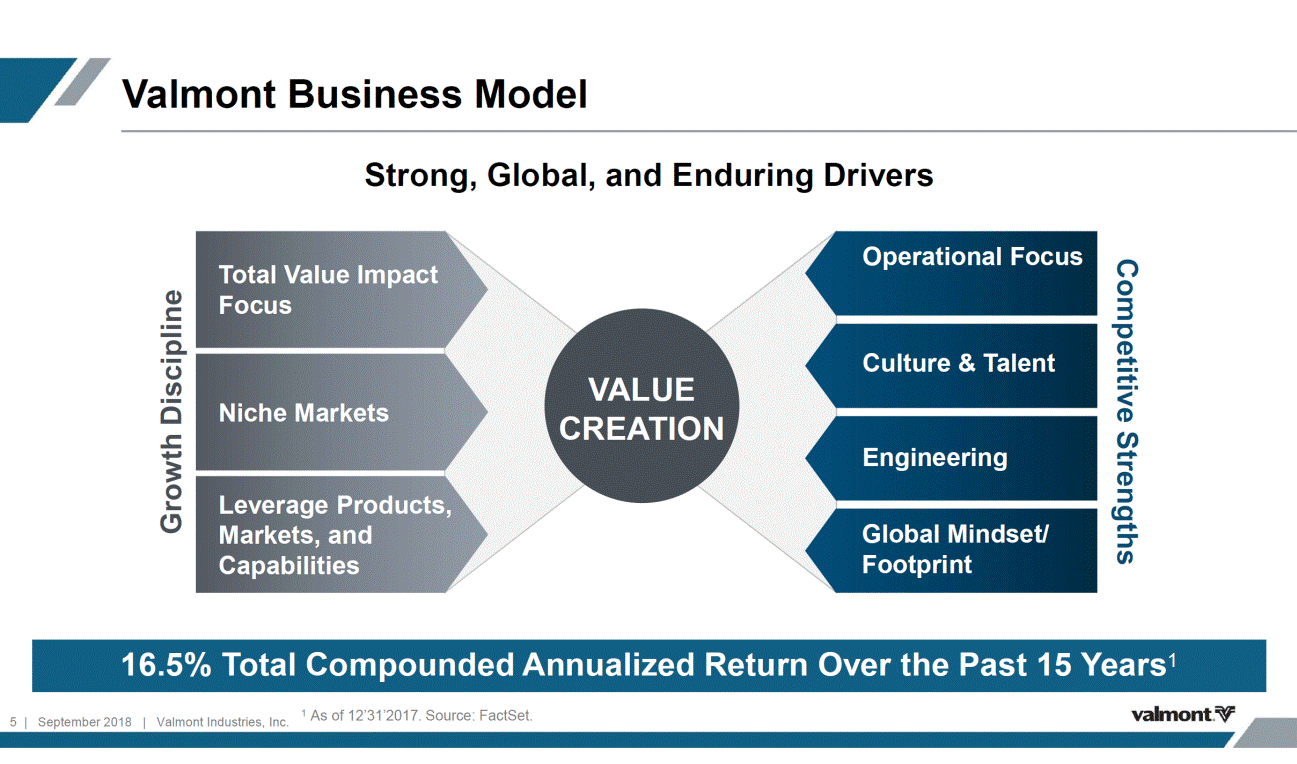
Valmont Business Model Strong, Global, and Enduring Drivers Operational Focus Total Value Impact Focus Culture & Talent VALUE CREATION Niche Markets Engineering Leverage Products, Markets, and Capabilities Global Mindset/ Footprint 1 As of 12’31’2017. Source: FactSet. 5 | September 2018 | Valmont Industries, Inc. Competitive Strengths Growth Discipline 16.5% Total Compounded Annualized Return Over the Past 15 Years1
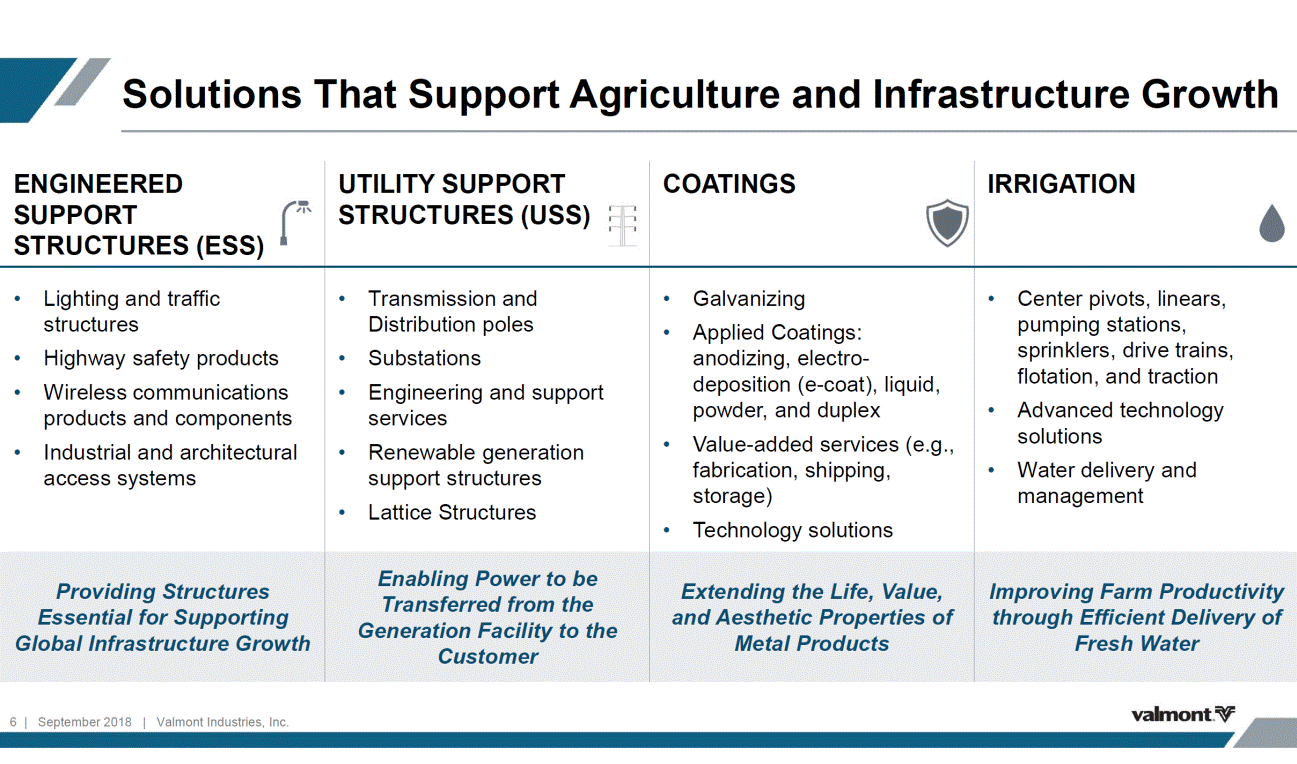
Solutions That Support Agriculture and Infrastructure Growth sprinklers, drive trains, • Advanced technology • Water delivery and through Efficient Delivery of 6 | September 2018 | Valmont Industries, Inc. ENGINEERED SUPPORT STRUCTURES (ESS) UTILITY SUPPORT STRUCTURES (USS) COATINGS IRRIGATION • Lighting and traffic structures • Highway safety products • Wireless communications products and components • Industrial and architectural access systems Providing Structures Essential for Supporting Global Infrastructure Growth • Transmission and Distribution poles • Substations • Engineering and support services • Renewable generation support structures • Lattice Structures Enabling Power to be Transferred from the Generation Facility to the Customer • Galvanizing • Applied Coatings: anodizing, electro-deposition (e-coat), liquid, powder, and duplex • Value-added services (e.g., fabrication, shipping, storage) • Technology solutions Extending the Life, Value, and Aesthetic Properties of Metal Products • Center pivots, linears, pumping stations, flotation, and traction solutions management Improving Farm Productivity Fresh Water
Expanding Our Total Addressable Market for ESS AREAS OF OPPORTUNITY $11B GEOGRAPHIC EXPANSION ENCIES ODUCTS VICES 7 | September 2018 | Valmont Industries, Inc. Highway Safety Smart Pole Solutions Architectural Components Telecommunications Products & Components Sign Structures

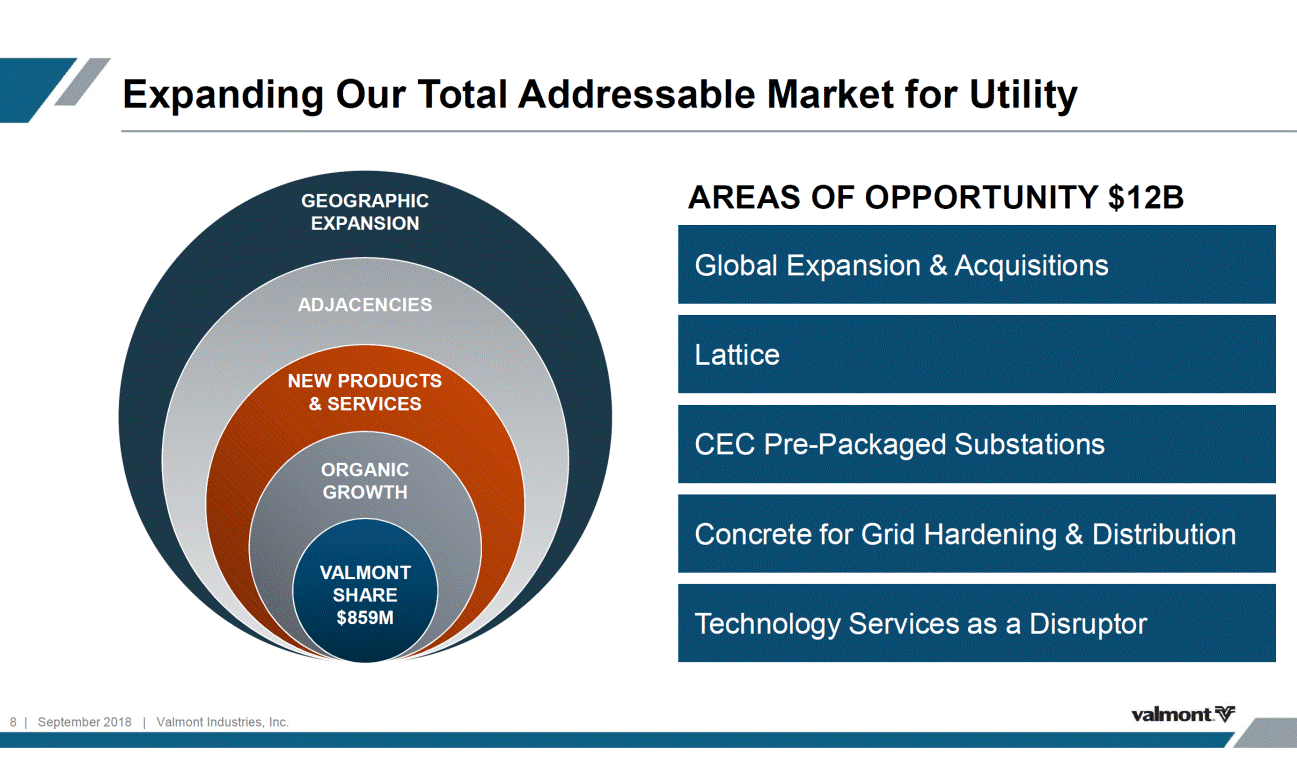
Expanding Our Total Addressable Market for Utility AREAS OF OPPORTUNITY $12B GEOGRAPHIC EXPANSION ENCIES ODUCTS VICES 8 | September 2018 | Valmont Industries, Inc. Technology Services as a Disruptor Concrete for Grid Hardening & Distribution CEC Pre-Packaged Substations Lattice Global Expansion & Acquisitions
Expanding Our Total Addressable Market for Coatings AREAS OF OPPORTUNITY $3B GEOGRAPHIC EXPANSION ENCIES ODUCTS VICES 9 | September 2018 | Valmont Industries, Inc. Value-Added Services Applied Coatings Acquisitions and New Construction

Expanding Our Total Addressable Market for Irrigation AREAS OF OPPORTUNITY $11B GEOGRAPHIC EXPANSION ENCIES ODUCTS VICES 10 | September 2018 | Valmont Industries, Inc. Enhanced Technology Solutions Focus on Higher Value Crops Full Service Water Management for Ag International Growth

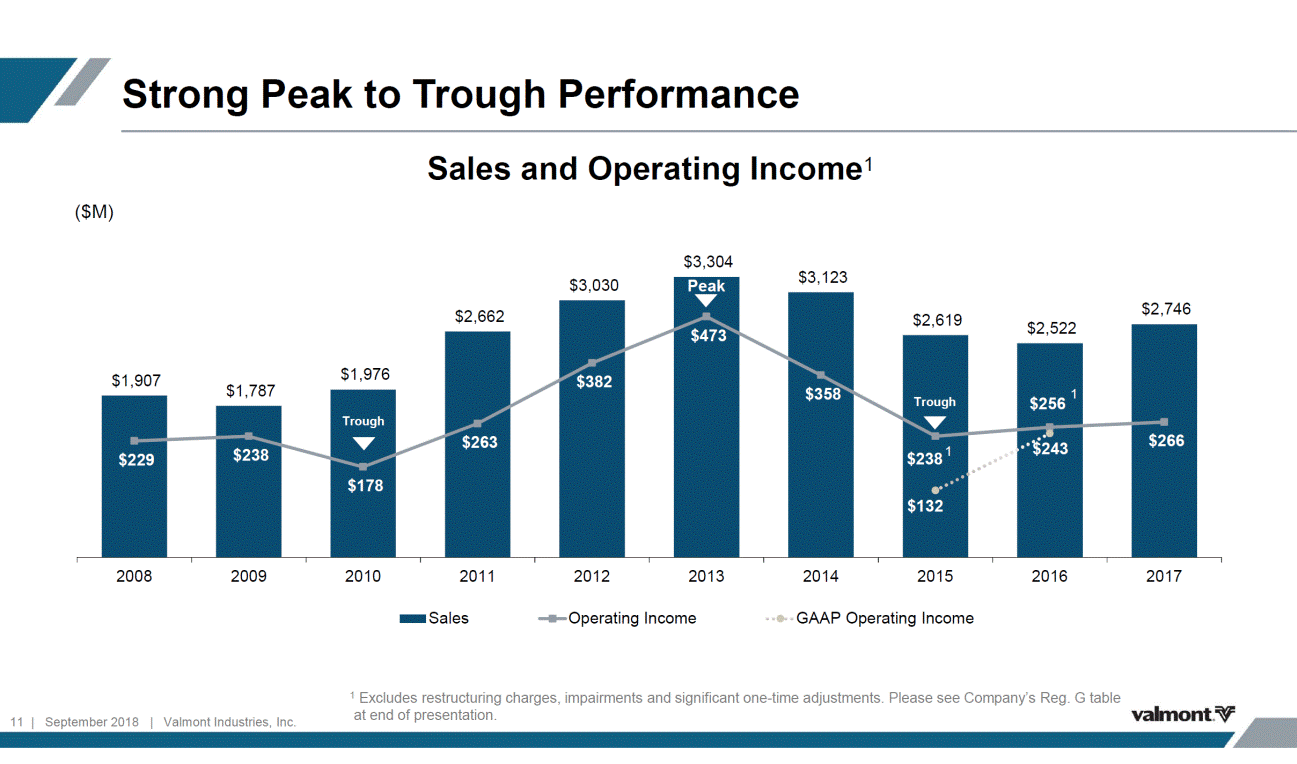
Strong Peak to Trough Performance Sales and Operating Income1 ($M) $600 $3,304 $3,500 $3,123 $3,000 $500 $2,500 $400 $2,000 1 $256 gh $300 $1,500 $243 $200 $1,000 $100 $500 $-$- 2008 2009 2010 2011 2012 2013 2014 2015 2016 2017 Sales Operating Income GAAP Operating Income 1 Excludes restructuring charges, impairments and significant one-time adjustments. Please see Company’s Reg. G table at end of presentation. 11 | September 2018 | Valmont Industries, Inc. $3,030 Peak $473 $2,746 $358 $2,619 $2,662 $382 $2,522 $266 $1,907 $1,787 $1,976 $263 Trou $238 $132 1 Trough $178 $ 29 $238
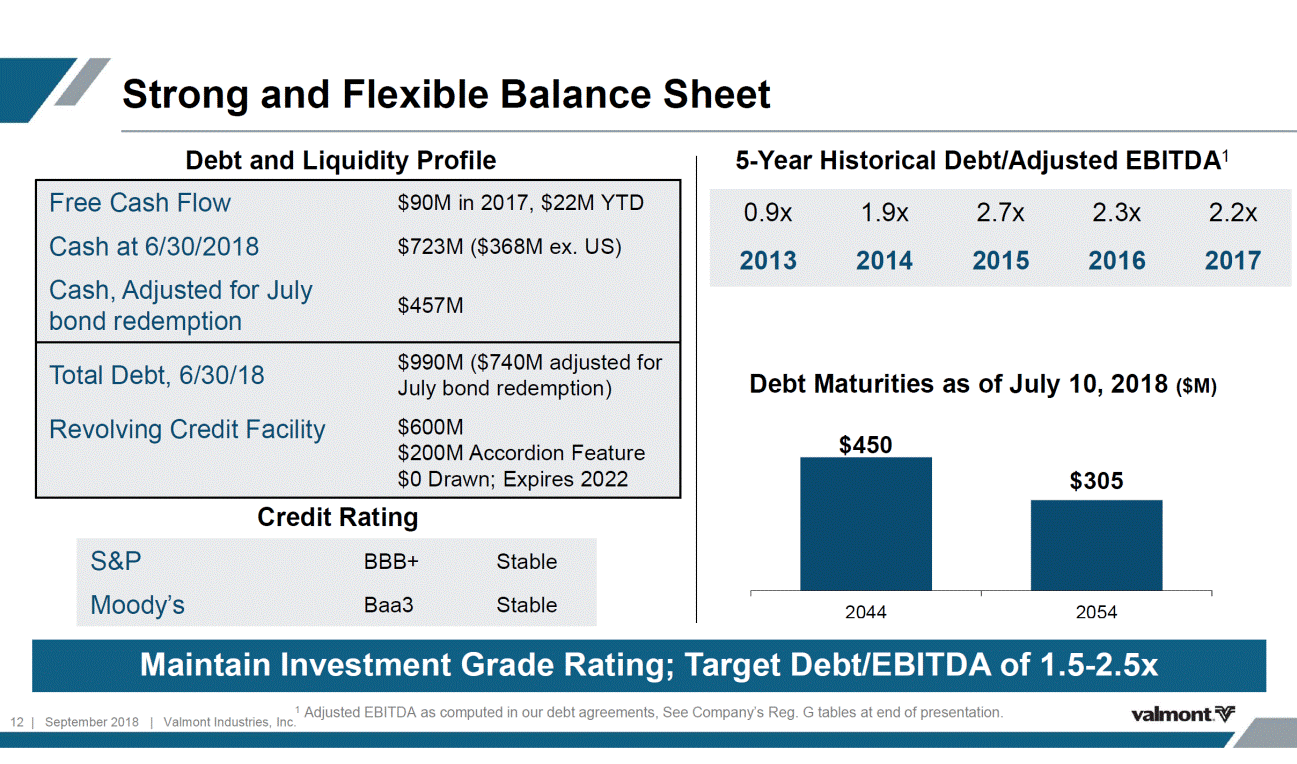
Strong and Flexible Balance Sheet 5-Year Historical Debt/Adjusted EBITDA1 Debt and Liquidity Profile 0.9x 2013 1.9x 2014 2.7x 2015 2.3x 2016 2.2x 2017 $457M Debt Maturities as of July 10, 2018 ($M) July bond redemption) $450 Credit Rating 2044 2054 1 Adjusted EBITDA as computed in our debt agreements, See Company’s Reg. G tables at end of presentation. 12 | September 2018 | Valmont Industries, Inc. Maintain Investment Grade Rating; Target Debt/EBITDA of 1.5-2.5x S&P BBB+ Stable Moody’sBaa3Stable $305 Free Cash Flow$90M in 2017, $22M YTD Cash at 6/30/2018$723M ($368M ex. US) Cash, Adjusted for July bond redemption Total Debt, 6/30/18$990M ($740M adjusted for Revolving Credit Facility$600M $200M Accordion Feature $0 Drawn; Expires 2022
Capital Allocation Priorities • Working capital investment to support sales growth Support Growth & Operations of Existing Businesses • Capital expenditures $65M – $75M annually • Strategic fit – leverage. Four completed in 2018 YTD. Acquisitions • Clear path to returns exceeding cost of capital within 3 years • Dividends – targeted payout ratio of 15% of earnings Return Cash to Shareholders • Opportunistic share repurchase; $88M remaining on authorization on June 30, 2018 13 | September 2018 | Valmont Industries, Inc.

Long-Term Company Targets 1 5% organic. Acquisitions over time are necessary to achieve top end of range. 14 | September 2018 | Valmont Industries, Inc. Target Goal Revenue Growth1 5% – 10% > 10% > 10% > 1.0x Net Earnings > 12% EPS Growth ROIC FCF Conversion Operating Margin

THANK YOU 15 | September 2018 | Valmont Industries, Inc.
APPENDIX 16 | September 2018 | Valmont Industries, Inc.
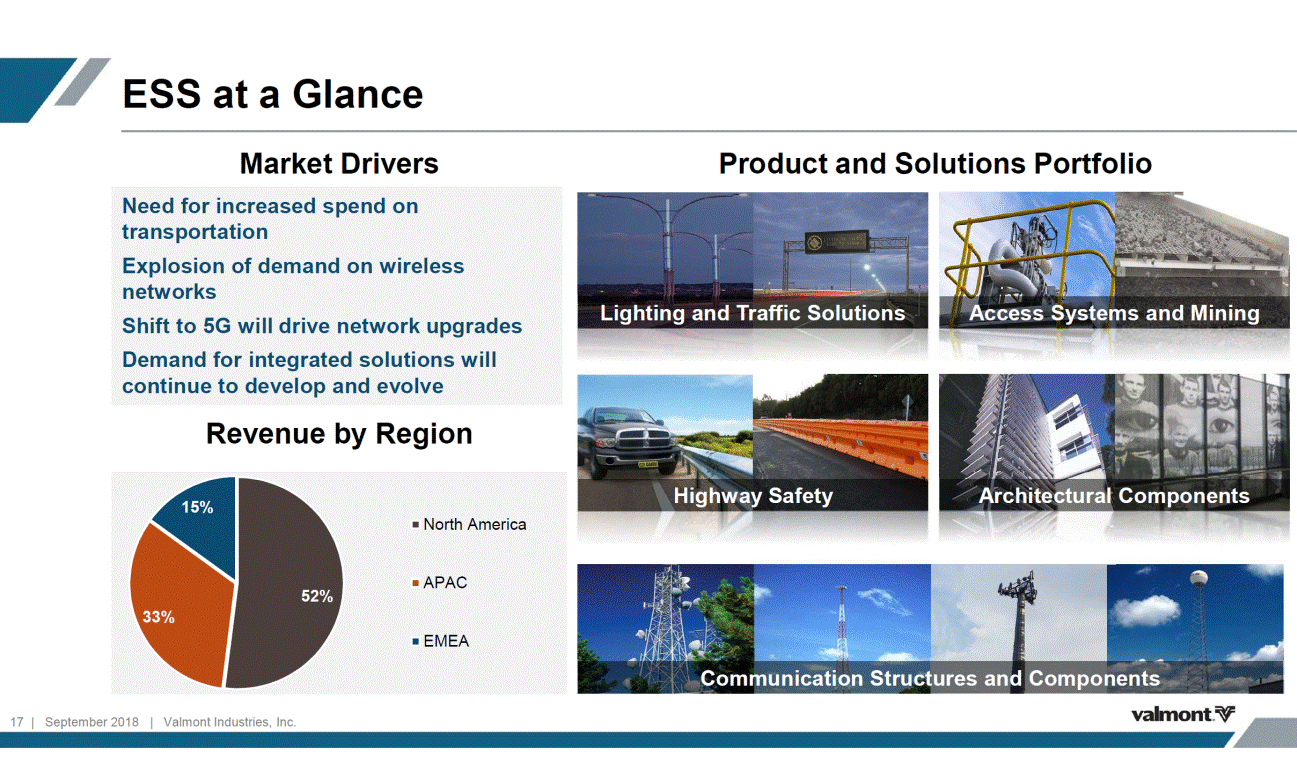
ESS at a Glance Market Drivers Product and Solutions Portfolio Lighting and Traffic Solutions Access Systems and Mining Revenue by Region Highway Safety Architectural Components Communication Structures and Components 17 | September 2018 | Valmont Industries, Inc. North America APAC EMEA Need for increased spend on transportation Explosion of demand on wireless networks Shift to 5G will drive network upgrades Demand for integrated solutions will continue to develop and evolve
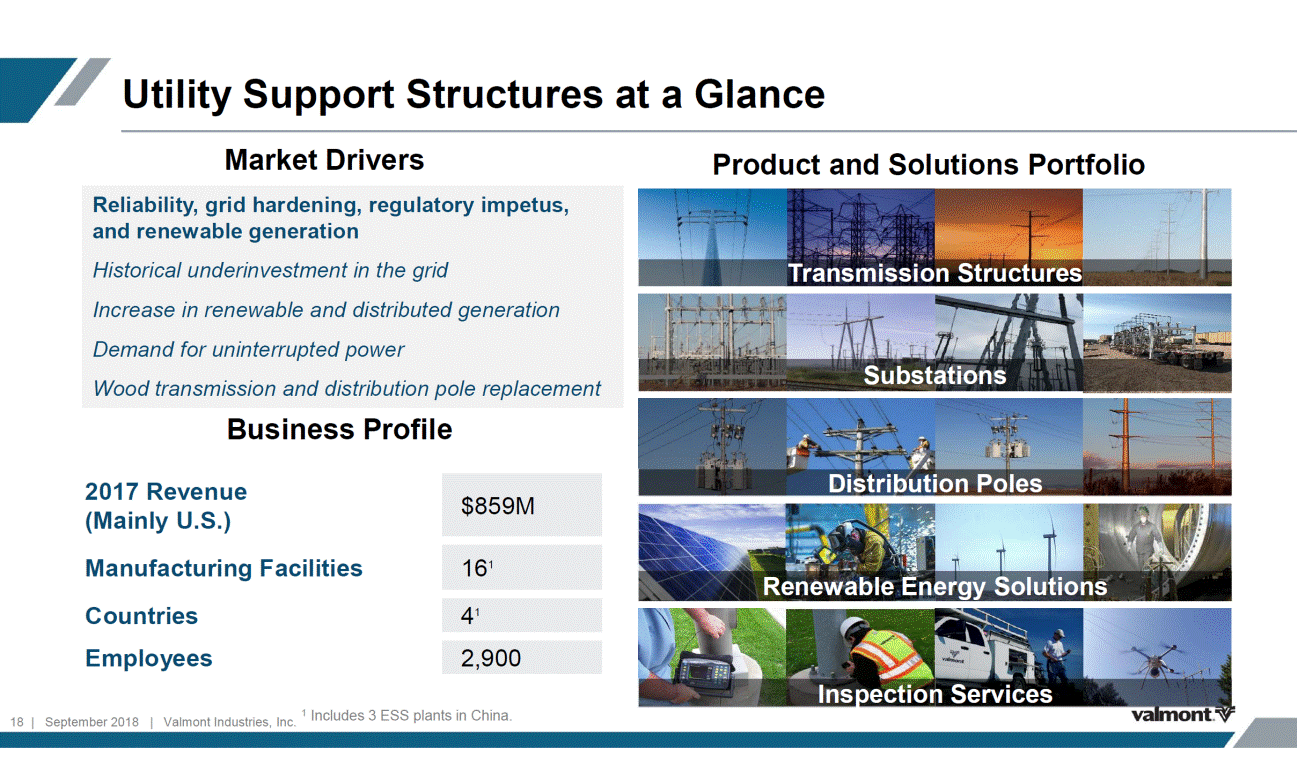
Utility Support Structures at a Glance Market Drivers Product and Solutions Portfolio Transmission Structures Substations Business Profile Distribution Poles 2017 Revenue (Mainly U.S.) Manufacturing Facilities Countries Employees Renewable Energy Solutions Inspection Services 1 Includes 3 ESS plants in China. 18 | September 2018 | Valmont Industries, Inc. $859M 161 41 2,900 Reliability, grid hardening, regulatory impetus, and renewable generation Historical underinvestment in the grid Increase in renewable and distributed generation Demand for uninterrupted power Wood transmission and distribution pole replacement
Coatings at a Glance Market Drivers Product and Solutions Portfolio Galvanizing Revenue by Region Applied Coatings Value-Added Services 19 | September 2018 | Valmont Industries, Inc. North America APAC Coatings demand typically correlated to industrial production Infrastructure investments promote coatings demand Cost of corrosion is a major financial burden on economies

Irrigation at a Glance | Valley® Market Drivers Product and Solutions Portfolio Center Pivots & Machines1 Control Panels Business Profile Remote Telemetry Valley SchedulingTM 2017 Revenue Facilities (Mfg., Warehouse, & Distribution) Countries Employees Global Dealerships Variable Rate Irrigation Water Management 1 Consists of linear, corner and towable center pivots and machines. 2 ~50% split U.S. and International. 20 | September 2018 | Valmont Industries, Inc. $652M 21 8 1,600 >500 Dealers2 Long-term: Constraints on fresh water resources and demand on food production Governments’ desire to become more self-sufficient in food production Large installed base of machines creates replacement opportunity Short-term: Commodity prices, net farm income and availability of farm labor

Leading With Innovative Products and Solutions PyraMAX™ Atmosphere™ Façade Valley SchedulingTM ICON™ Smart Panels AgSense and BaseStation3™ Valley Irrigation Exchange Drone Inspection CEC Substation Coatings Connector GalvTrac™ 21 | September 2018 | Valmont Industries, Inc.

2018 Acquisitions YTD 22 | September 2018 | Valmont Industries, Inc.

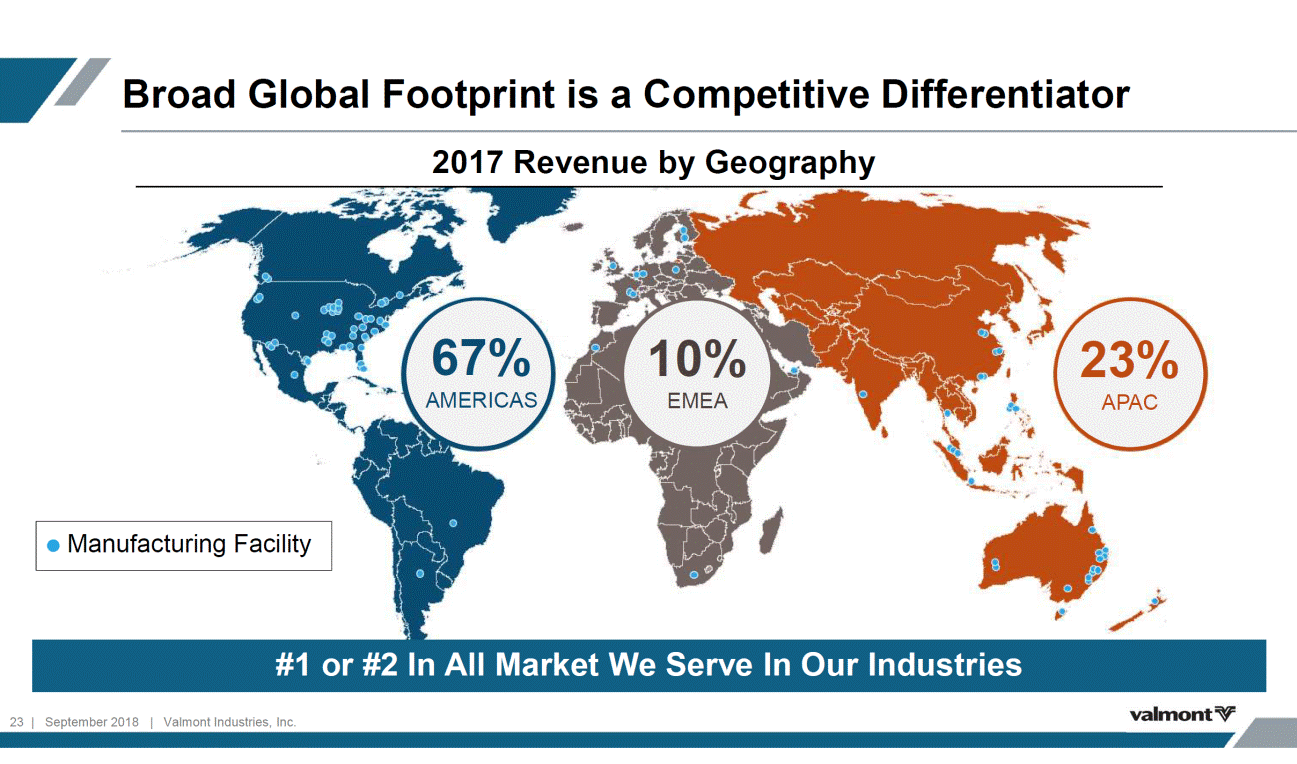
Broad Global Footprint is a Competitive Differentiator 2017 Revenue by Geography 67% AMERICAS 10% EMEA 23% APAC 23 | September 2018 | Valmont Industries, Inc. #1 or #2 In All Market We Serve In Our Industries Manufacturing Facility
Continuing to Create Long-Term Shareholder Value Total Shareholder Return1 (As of 12/31/17) 19.4% 18.6% 16.5% 12.5% 5.2% 1-Year 3-Year 5-Year 7-Year 10-Year 15-Year 20-Year VMI S&P 500 1 Source: FactSet. 24 | September 2018 | Valmont Industries, Inc. 13.4% 11.4% 9.1% 7.4% 6.2% 5.0% 10.5% 10.3% 7.7%

Fiscal 2017 Results 1 Please refer to Company’s Reg G table at end of document. 25 | September 2018 | Valmont Industries, Inc. Total Sales (in thousands)2017 2016 Yr-Yr Change Engineered Support Structures $ 938,102 859,115 318,891 652,430 76,300 (98,871) $ 2,745,967 $ 906,719 3.5% Utility Support Structures 736,364 16.7% Coatings 289,481 10.2% Irrigation 575,204 13.4% Other 83,110 (8.2%) Intersegment Sales (69,202) Total $ 2,521,676 9.0% GAAP Operating Income $ 266,432 $ 243,504 9.4% GAAP Net Earnings $ 116,240 $ 173,232 (32.9%) GAAP Earnings Per Share $ 5.11 $ 7.63 (33.0%) Adjusted Operating Income1 $ 266,432 $ 255,929 4.1% Adjusted Net Earnings1 $ 158,412 $ 145,767 8.7% Adjusted Earnings Per Share1 $ 6.97 $ 6.42 8.6%

2018 Results Through June 30, 2018 1 Please see Reg G reconciliation of non-GAAP financial measures to GAAP measures at end of the document. 26 | September 2018 | Valmont Industries, Inc. NET SALES U.S. Dollars in millions except per share amounts 2018 2017 Percent Change Engineered Support Structures $475.7 $441.8 7.7% Utility Support Structures 407.6 410.9 (0.8%) Coatings 176.5 153.2 15.2% Irrigation 350.9 355.5 (1.3%) Other 23.1 40.7 (43.2%) Intersegment Sales (52.7) (51.9) NM Net Sales $1,381.1 $1,350.2 2.3% Operating Income $127.6 $143.1 (10.8%) Adjusted Operating Income1 $139.0 $143.1 (2.9%) Net Income (loss) $72.2 $84.6 (14.7%) Adjusted Net Income1 $87.3 $84.6 3.2% Diluted Earnings (loss) Per Share (EPS) $3.18 $3.73 (14.7%) Adjusted Diluted (EPS) 1 $3.84 $3.73 2.9%

Elevating Our Commitment to Corporate Sustainability Aggregating global data for improved measurement Green Teams in every facility Reductions in electricity consumption and landfill waste Elevating sustainability throughout our organization Enhanced global data analytics and metrics track sustainability goals Strengthening reporting Supplier sustainability commitment to establish and 27 | September 2018 | Valmont Industries, Inc. Increasing Our Dedication to Corporate Responsibility Over Time FUTURE Self-Sustaining Program Disseminating Throughout the Organization
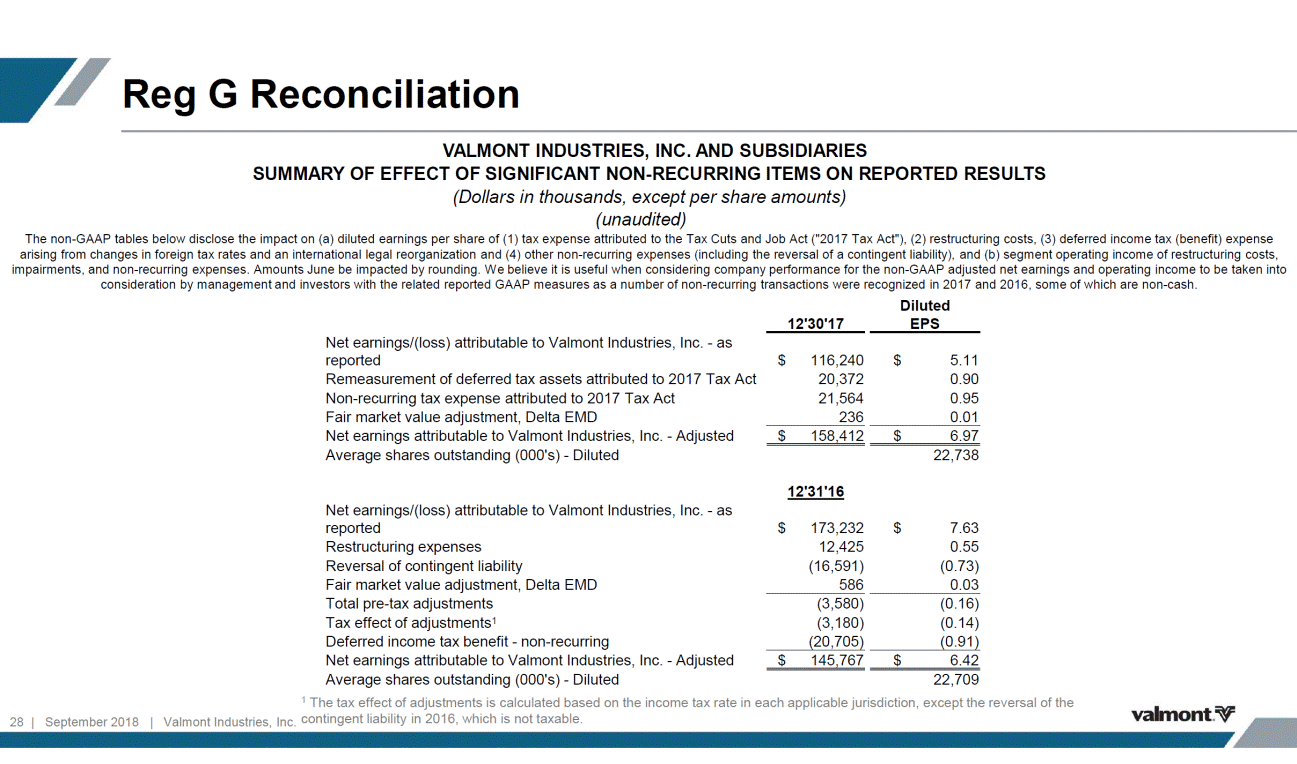
Reg G Reconciliation VALMONT INDUSTRIES, INC. AND SUBSIDIARIES SUMMARY OF EFFECT OF SIGNIFICANT NON-RECURRING ITEMS ON REPORTED RESULTS (Dollars in thousands, except per share amounts) (unaudited) The non-GAAP tables below disclose the impact on (a) diluted earnings per share of (1) tax expense attributed to the Tax Cuts and Job Act ("2017 Tax Act"), (2) restructuring costs, (3) deferred income tax (benefit) expense arising from changes in foreign tax rates and an international legal reorganization and (4) other non-recurring expenses (including the reversal of a contingent liability), and (b) segment operating income of restructuring costs, impairments, and non-recurring expenses. Amounts June be impacted by rounding. We believe it is useful when considering company performance for the non-GAAP adjusted net earnings and operating income to be taken into consideration by management and investors with the related reported GAAP measures as a number of non-recurring transactions were recognized in 2017 and 2016, some of which are non-cash. Diluted 12'30'17 EPS Net earnings/(loss) attributable to Valmont Industries, Inc. - as reported Remeasurement of deferred tax assets attributed to 2017 Tax Act Non-recurring tax expense attributed to 2017 Tax Act Fair market value adjustment, Delta EMD Net earnings attributable to Valmont Industries, Inc. - Adjusted Average shares outstanding (000's) - Diluted $ 116,240 20,372 21,564 $ 5.11 0.90 0.95 236 0.01 $ 158,412 $ 6.97 22,738 12'31'16 Net earnings/(loss) attributable to Valmont Industries, Inc. - as reported Restructuring expenses Reversal of contingent liability Fair market value adjustment, Delta EMD Total pre-tax adjustments Tax effect of adjustments1 Deferred income tax benefit - non-recurring Net earnings attributable to Valmont Industries, Inc. - Adjusted Average shares outstanding (000's) - Diluted $ 173,232 12,425 (16,591) $ 7.63 0.55 (0.73) 586 0.03 (3,580) (3,180) (0.16) (0.14) (20,705) (0.91) $ 145,767 $ 6.42 22,709 1 The tax effect of adjustments is calculated based on the income tax rate in each applicable jurisdiction, except the reversal of the Valmont Industries, Inc. contingent liability in 2016, which is not taxable. 28 | September 2018 |
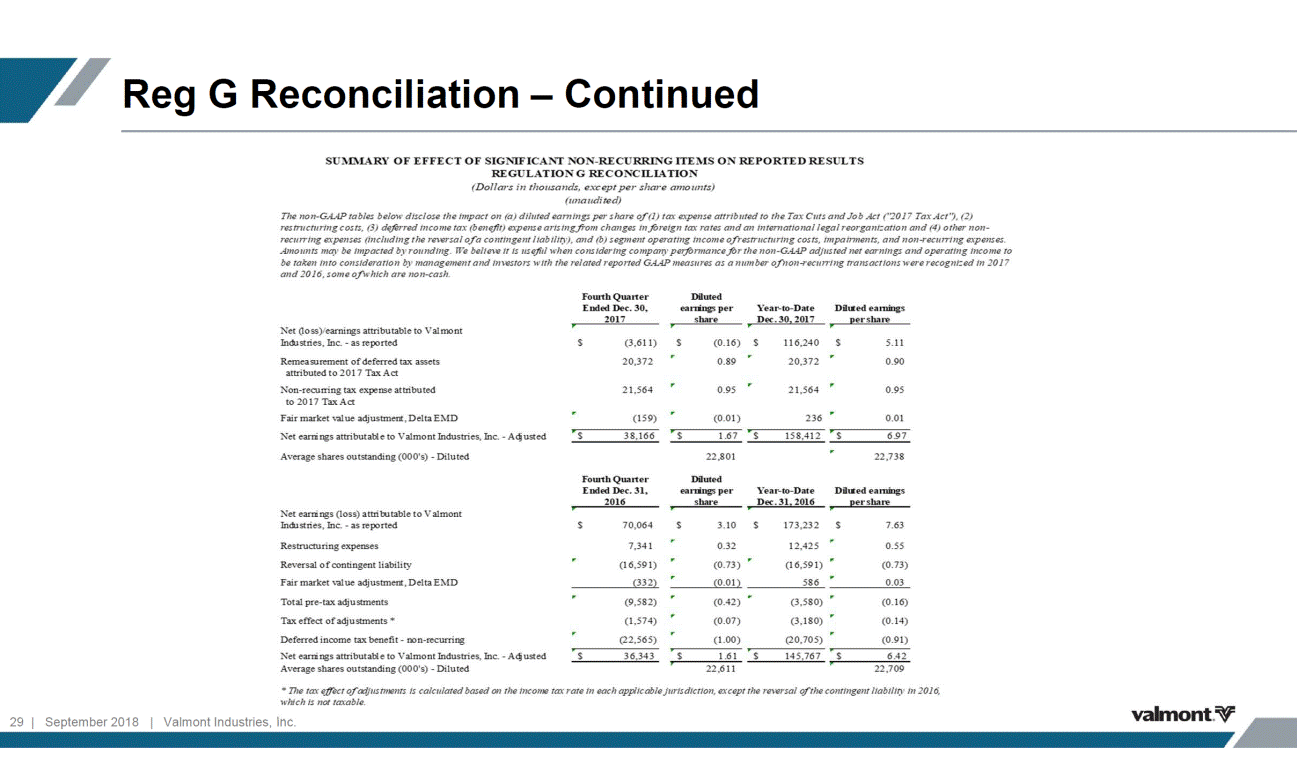
Reg G Reconciliation – Continued 29 | September 2018 | Valmont Industries, Inc.
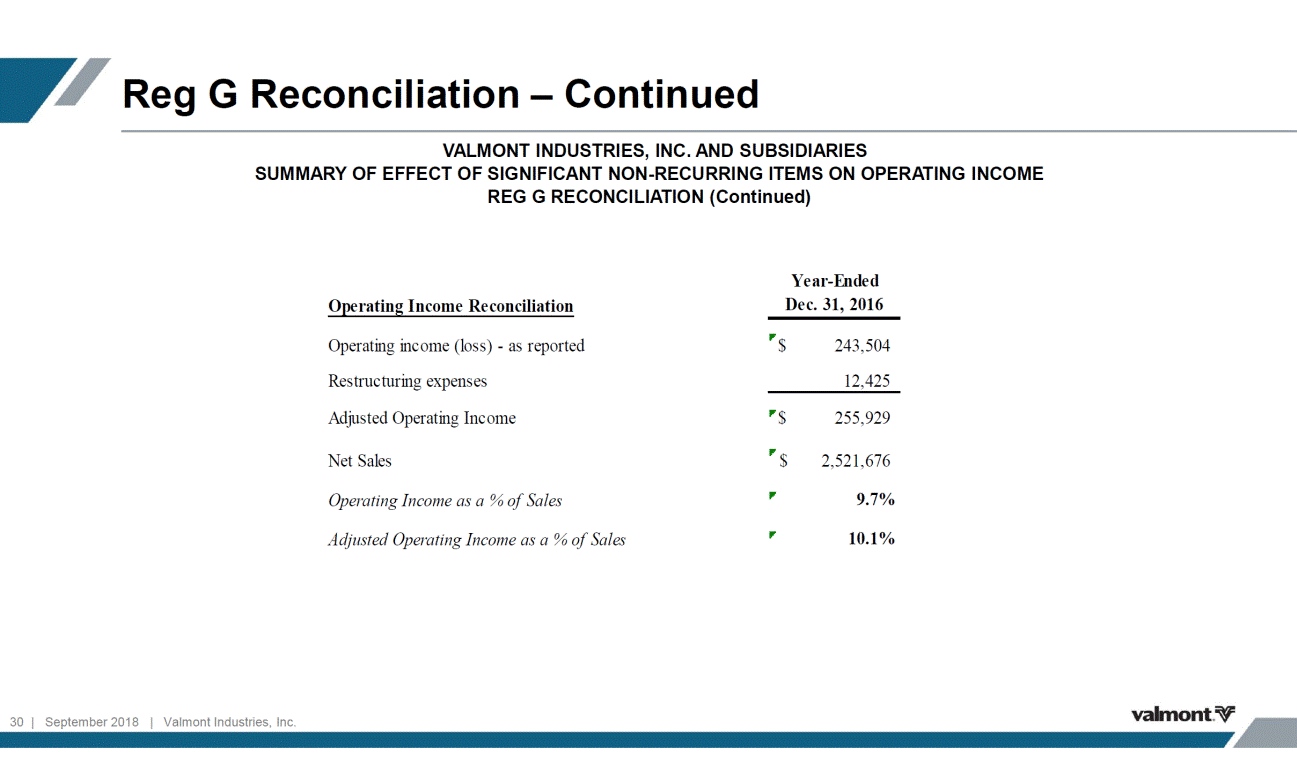
Reg G Reconciliation – Continued VALMONT INDUSTRIES, INC. AND SUBSIDIARIES SUMMARY OF EFFECT OF SIGNIFICANT NON-RECURRING ITEMS ON OPERATING INCOME REG G RECONCILIATION (Continued) Year-Ended Dec. 31, 2016 Ope rating Income Re conciliation Operating income (loss) - as reported Restructuring expenses Adjusted Operating Income $ 243,504 12,425 $ 255,929 Net Sales $ 2,521,676 Operating Income as a % of Sales 9.7% Adjusted Operating Income as a % of Sales 10.1% 30 | September 2018 | Valmont Industries, Inc.
Reg G Reconciliation – Continued 13 Weeks Ended June 30, 2018 13 Weeks Ended July 1, 2017 26 Weeks Ended June 30, 2018 26 Weeks Ended July 1, 2017 Operating Income Reconciliation Operating income - as reported $ 63,670 $ 78,450 $ 127,630 $ 143,106 Restructuring expenses 7,019 - 11,419 - Adjusted Operating Income 70,689 78,450 139,049 143,106 Operating loss/(income) from divested grinding media business 334 (1,859) 913 (3,945) Adjusted Operating Income, from ongoing operations $ 71,023 $ 76,591 $ 139,962 $ 139,161 Net Sales - as reported Net sales from divested business $ 682,405 (4,681) $ 712,737 (21,072) $ 1,381,089 (23,080) $ 1,350,210 (40,666) Adjusted Net Sales $ 677,724 $ 691,665 $ 1,358,009 $ 1,309,544 Operating Income as a % of Sales Adjusted operating income from ongoing operations, as a % of Adjusted Sales 9.3% 11.0% 9.2% 10.6% 10.5% 11.1% 10.3% 10.6% 31 | September 2018 | Valmont Industries, Inc.

Reg G Reconciliation – Continued 32 | September 2018 | Valmont Industries, Inc. VALMONT INDUSTRIES, INC. AND SUBSIDIARIES SUMMARY OF EFFECT OF SIGNIFICANT NON-RECURRING ITEMS ON REPORTED RESULTS REGULATION G RECONCILIATION (Dollars in thousands, except per share amounts) (unaudited) The non-GAAP tables below disclose the i mpact on (a) di luted earni ngs per share of (1) restructuring costs related to the plan announced i n February 2018 and (2) the loss from di vesti ture of its gri nding medi a busi ness, (b) operati ng income of restructuring costs and the di vesti ture of gri ndi ng media busi ness, and (c) segment operati ng i ncome of restructuring costs. Amounts may be i mpacted by roundi ng. We beli eve it is useful when consideri ng company performance for the non-GAAP adjusted net earnings and operating income to be taken into consi deration by management and investors with the related reported GAAP measures. 13 Weeks Diluted 26 Weeks Diluted Ended June earnings per Ended June earnings per 30, 2018 share 30, 2018 share Net earnings attributable to Valmont Industries, Inc. - as reported $ 32,960 $ 1.46 $ 72,241 $ 3.18 Restructuring expenses - pre-tax 7,019 0.31 11,419 0.50 Loss from divestiture of grinding media business, pre-tax 6,084 0.27 6,084 0.27 T otal Adjustments 13,103 0.58 17,503 0.77 T ax effect of adjustments * (1,354) (0.06) (2,429) (0.11) Net earnings attributable to Valmont Industries, Inc. - Adjusted $ 44,709 $ 1.98 $ 87,315 $ 3.84 Average shares outstanding (000's) - Diluted 22,573 22,684 * T he tax effect of adjustments is calculated based on the income tax rate in each applicable jurisdiction,

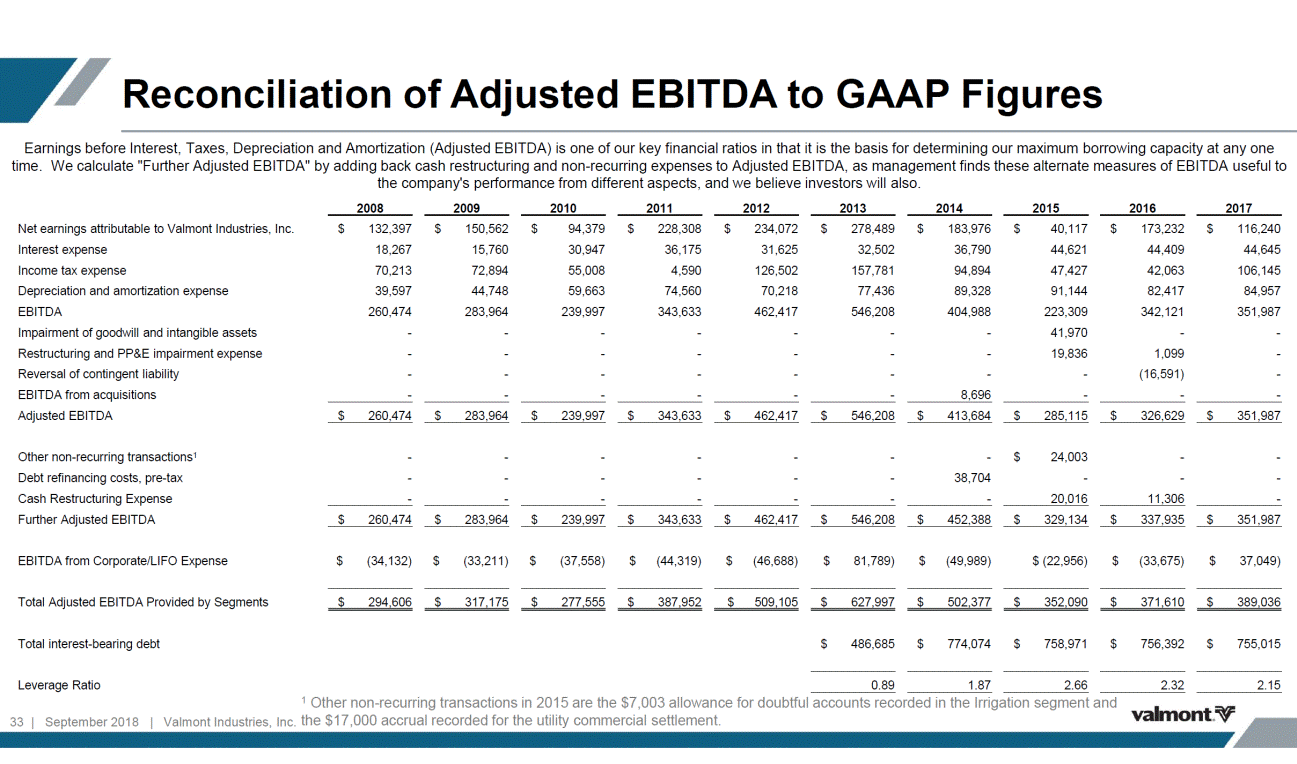
Reconciliation of Adjusted EBITDA to GAAP Figures Earnings before Interest, Taxes, Depreciation and Amortization (Adjusted EBITDA) is one of our key financial ratios in that it is the basis for determining our maximum borrowing capacity at any one time. We calculate "Further Adjusted EBITDA" by adding back cash restructuring and non-recurring expenses to Adjusted EBITDA, as management finds these alternate measures of EBITDA useful to the company's performance from different aspects, and we believe investors will also. 2008 2009 2010 2011 2012 2013 2014 2015 2016 2017 Net earnings attributable to Valmont Industries, Inc. Interest expense Income tax expense Depreciation and amortization expense EBITDA Impairment of goodwill and intangible assets Restructuring and PP&E impairment expense Reversal of contingent liability EBITDA from acquisitions Adjusted EBITDA $ 132,397 18,267 70,213 39,597 260,474 - - - $ 150,562 15,760 72,894 44,748 283,964 - - - $ 94,379 30,947 55,008 59,663 239,997 - - - $ 228,308 36,175 4,590 74,560 343,633 - - - $ 234,072 31,625 126,502 70,218 462,417 - - - $ 278,489 32,502 157,781 77,436 546,208 - - - $ 183,976 36,790 94,894 89,328 404,988 - - - $ 40,117 44,621 47,427 91,144 223,309 41,970 19,836 - $ 173,232 44,409 42,063 82,417 342,121 - 1,099 (16,591) $ 116,240 44,645 106,145 84,957 351,987 - - - - - - - - - 8,696 - - - $ 260,474 $ 283,964 $ 239,997 $ 343,633 $ 462,417 $ 546,208 $ 413,684 $ 285,115 $ 326,629 $ 351,987 Other non-recurring transactions1 Debt refinancing costs, pre-tax Cash Restructuring Expense Further Adjusted EBITDA - - - - - - - - - - - - - - - - - - - 38,704 - $ 24,003 - - - 11,306 - - - 20,016 $ 260,474 $ 283,964 $ 239,997 $ 343,633 $ 462,417 $ 546,208 $ 452,388 $ 329,134 $ 337,935 $ 351,987 EBITDA from Corporate/LIFO Expense $ (34,132) $ (33,211) $ (37,558) $ (44,319) $ (46,688) $ 81,789) $ (49,989) $ (22,956) $ (33,675) $ 37,049) Total Adjusted EBITDA Provided by Segments $ 294,606 $ 317,175 $ 277,555 $ 387,952 $ 509,105 $ 627,997 $ 502,377 $ 352,090 $ 371,610 $ 389,036 Total interest-bearing debt $ 486,685 $ 774,074 $ 758,971 $ 756,392 $ 755,015 Leverage Ratio 0.89 1.87 2.66 2.32 2.15 1 Other non-recurring transactions in 2015 are the $7,003 allowance for doubtful accounts recorded in the Irrigation segment and 33 | September 2018 | Valmont Industries, Inc. the $17,000 accrual recorded for the utility commercial settlement.
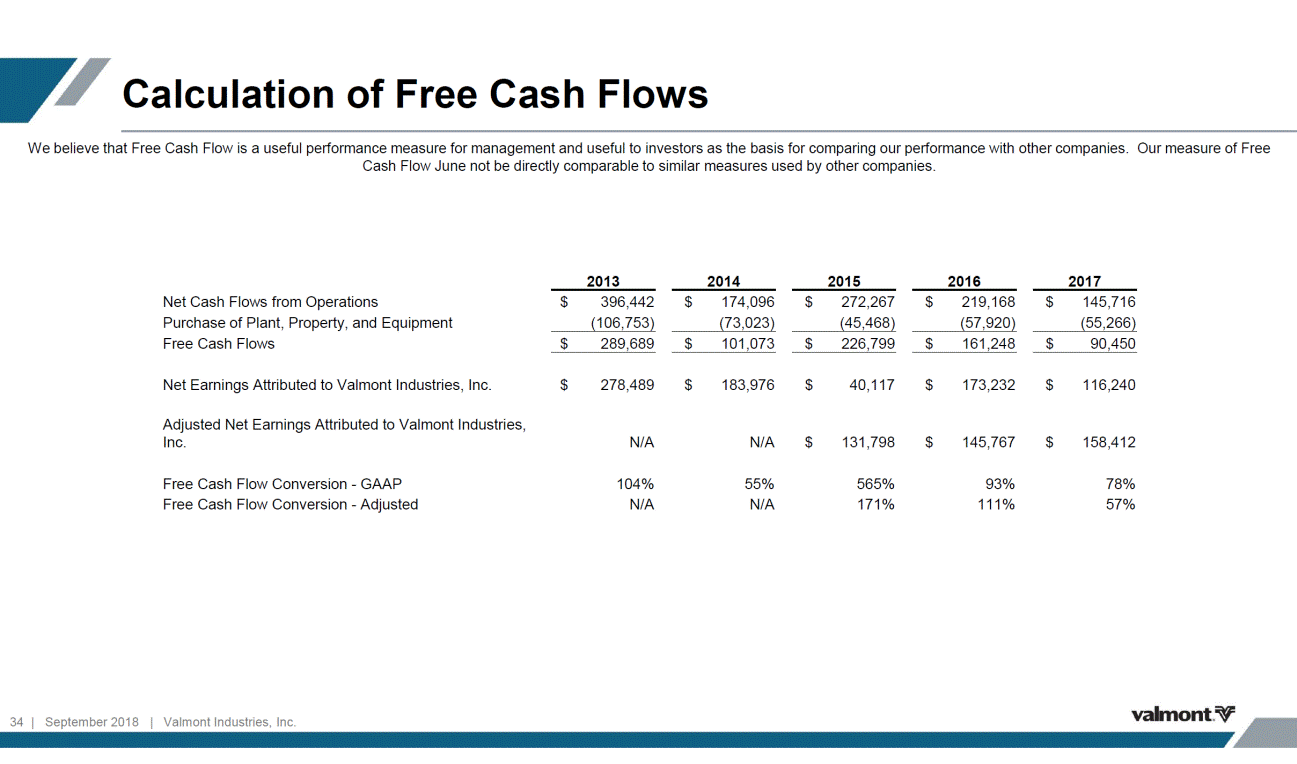
Calculation of Free Cash Flows We believe that Free Cash Flow is a useful performance measure for management and useful to investors as the basis for comparing our performance with other companies. Our measure of Free Cash Flow June not be directly comparable to similar measures used by other companies. 2013 2014 2015 2016 2017 Net Cash Flows from Operations Purchase of Plant, Property, and Equipment Free Cash Flows $ 396,442 $ 174,096 $ 272,267 $ 219,168 $ 145,716 (106,753) (73,023) (45,468) (57,920) (55,266) $ 289,689 $ 101,073 $ 226,799 $ 161,248 $ 90,450 Net Earnings Attributed to Valmont Industries, Inc. $ 278,489 $ 183,976 $ 40,117 $ 173,232 $ 116,240 Adjusted Net Earnings Attributed to Valmont Industries, Inc. N/A N/A $ 131,798 $ 145,767 $ 158,412 Free Cash Flow Conversion - GAAP Free Cash Flow Conversion - Adjusted 104% N/A 55% N/A 565% 171% 93% 111% 78% 57% 34 | September 2018 | Valmont Industries, Inc.
