Attached files
| file | filename |
|---|---|
| 8-K - 8-K - SI Financial Group, Inc. | a8-kinvestorslidepresentat.htm |

Investors’ Meeting September 20, 2018

Forward Looking Statements This presentation may contain forward-looking statements, which can be identified by the use of words such as “believes,” “expects,” “anticipates,” “estimates” or similar expressions. These forward-looking statements include, but are not limited to: statements of our goals, intentions and expectations; statements regarding our business plans, prospects, growth and operating strategies; statements regarding the asset quality of our loan and investment portfolios; and estimates of our risks and future costs and benefits. These forward-looking statements, which are based on our current beliefs and expectations, are subject to significant risks and uncertainties. Actual results may differ materially from those contemplated by the forward-looking statements due to, among others, the following factors: general economic conditions, either nationally or in our market areas, that are different than expected; changes in the interest rate environment that reduce our margins or reduce the fair value of financial instruments; increased competitive pressures among financial services companies; changes in consumer spending, borrowing and savings habits; legislative, regulatory or tax changes that adversely affect our business; adverse changes in the securities and credit markets; and changes in accounting policies and practices, as may be adopted by bank regulatory agencies or the Financial Accounting Standards Board. Additional factors that may affect our results are discussed in Item 1A “Risk Factors” in our Annual Report on Form 10-K and in other reports filed with the Securities and Exchange Commission. Any forward-looking statements made by us speak only as of the date hereof. Any of the forward-looking statements that we make in this presentation may later prove incorrect because of inaccurate assumptions, the factors illustrated above or other factors that we cannot foresee. Because of these and other uncertainties, our actual future results may be materially different from the results indicated by these forward-looking statements. We do not undertake, and specifically disclaim any obligation, to revise any forward-looking statements contained in this presentation. 2

Market Summary Issuer: June 30, 2017 June 30, 2018 Listing /Ticker Symbol: Nasdaq Global Market / "SIFI" Market Price Per Share: $16.10 $14.75 Shares Outstanding: 12,226,345 12,032,734 Market Capitalization: $196.8 million $177.5 million Tangible Book Value Per Share: (1) $12.41 $12.60 Price to Tangible Book Value: 129.73% 117.06% Dividend Yield: (2) 1.24% 1.63% (1) See Appendix - Non-GAAP Financial Measures (2) Quarterly dividend increased to $0.06 in January 2018 3

Company Overview

An Overview of SI Financial Headquartered in Willimantic, CT Average deposit size per branch has increased to $52 million at June 30, 2018 from $38 million in 2013 Established in 1842 Total assets as of June 30, 2018: $1.60 billion Sold wealth management unit in May 2017 Dayville Canterbury Lebanon Lisbon Groton 5 Source: S&P Global Market Intelligence

Business Strategy Community oriented focus with a full range of financial products and services Prudently diversify the asset mix and geographic concentration by selectively increasing the percentage of commercial business, multi-family and commercial real estate loans locally and throughout New England - Added 5 commercial lenders since April 2017 - Expanded cash management and business development staff since September 2017 Continue conservative underwriting practices and maintain a high quality loan portfolio Increase core deposits by emphasizing exceptional customer service and cross-selling and expanding our relationship-focused business lending Supplement fee income through mortgage banking and commercial-related fees 6

Financial Highlights

Improving Profitability Core Income & Core ROAA ($MM) $12.0 0.75% 0.61% $10.0 0.58% 0.60% $9.2 $8.0 0.41% 0.45% $6.0 0.33% 0.31% $6.3 0.30% $4.0 $4.8 $4.4 $4.3 0.15% $2.0 0.08% $0.9 $0.0 0.00% 2013Y(1) 2014Y 2015Y 2016Y(1) 2017Y(1) YTD2018(1)(2) (1) Core income excludes nonrecurring items. See Appendix – Non-GAAP Financial Measures (2) Represents the six months ended June 30, 2018. 8

Improving Profitability Net Interest Margin (%) 3.50% 3.11% 2.97% 3.01% 2.98% 3.00% 2.93% 2.89% 2.50% 2.00% 1.50% 1.00% 0.50% 0.00% 2013Y 2014Y 2015Y 2016Y 2017Y YTD2018 (1) (1) Annualized based on the six months ended June 30, 2018. 9

Improving Profitability Efficiency Ratio (%) 96.1% 84.1% 82.2% 73.6% 71.9% 68.5% 2013Y 2014Y 2015Y 2016Y 2017Y YTD2018 (1) (1) Annualized based on the six months ended June 30, 2018. 10

Consistent Loan Growth Total Gross Loans ($MM) Acquisition of Newport $1,400 Bancorp, Inc. $1,271 $1,234 $1,250 $1,177 $59 $58 $1,200 $61 $62 $1,056 $1,053 $298 $58 $312 $1,000 $55 $334 $313 $265 $266 $800 $697 $47 $482 $539 $385 $422 $600 $286 $298 $217 $400 $202 $450 $431 $200 $417 $417 $397 $376 $231 $0 2012Y 2013Y 2014Y 2015Y 2016Y 2017Y 06/30/2018 Residential RE Commerical RE Commerical & Industrial (1) Consumer & Other (2) (1) Commercial & industrial loans include construction loans (2) Includes deferred loan origination costs/fees and loans held for sale 11

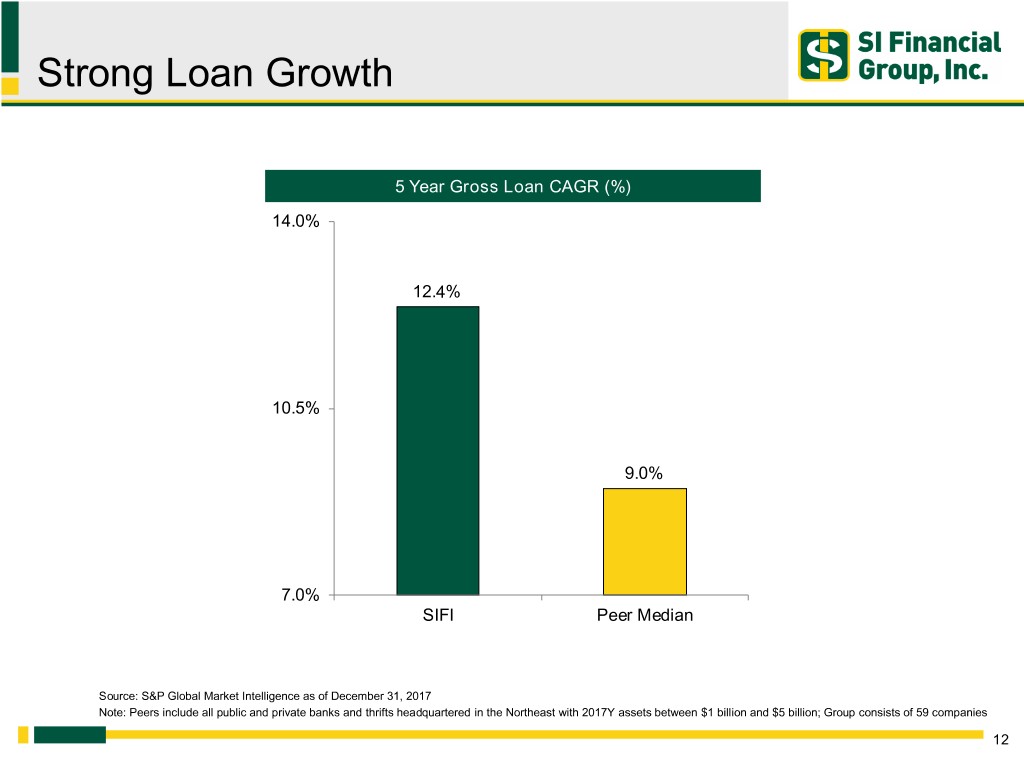
Strong Loan Growth 5 Year Gross Loan CAGR (%) 14.0% 12.4% 10.5% 9.0% 7.0% SIFI Peer Median Source: S&P Global Market Intelligence as of December 31, 2017 Note: Peers include all public and private banks and thrifts headquartered in the Northeast with 2017Y assets between $1 billion and $5 billion; Group consists of 59 companies 12

Consistent Deposit Growth Deposits ($MM) $1,400 Acquisition of Newport Bancorp, Inc. CAGR: 11.7% $1,208 $1,226 $1,200 $1,131 $1,058 $223 $1,011 $221 $985 $202 $1,000 $164 $139 $146 $800 $705 $447 $454 $394 $436 $351 $90 $378 $600 $277 $400 $540 $549 $495 $487 $500 $493 $200 $338 $0 2012Y 2013Y 2014Y 2015Y 2016Y 2017Y 06/30/2018 NOW/Savings/MMDA Time Demand Deposits 13

Strong Deposit Growth 5 Year Deposit CAGR (%) 2017 Noninterest Bearing Deposits / Total Deposits (%) 12.00% 20.0% 11.4% 18.3% 10.9% 9.00% 15.0% 14.8% 6.00% 10.0% SIFI Peer Top Quartile SIFI Peer Top Quartile Source: S&P Global Market Intelligence as of December 31, 2017 Note: Peers include all public and private banks and thrifts headquartered in the Northeast with 2017Y assets between $1 billion and $5 billion; Group consists of 59 companies 14

Strong Asset Quality • Savings Institute has maintained high asset quality with solid reserve coverage • Aggressive early recognition of nonperforming loans Nonperforming Loans / Total Loans (%) 1.20% 0.90% 0.66% 0.63% 0.56% 0.60% 0.51% 0.48% 0.44% 0.30% 0.00% 2013Y 2014Y 2015Y 2016Y 2017Y 06/30/2018 Net Charge-offs / Average Loans (%) 0.25% 0.20% 0.15% 0.10% 0.10% 0.06% 0.05% 0.04% 0.02% 0.01% 0.02% 0.00% 2013Y 2014Y 2015Y 2016Y 2017Y 06/30/2018 15

Financial Strength – June 30, 2018 Capital available for growth Possible repurchases • The Company’s Board of Directors approved a stock repurchase program authorizing the repurchase of up to 5%, or 612,122 shares, of its common stock. As of June 30, 2018, 215,000 shares have been repurchased under the plan. Minimum Well Ratio Required Capitalized Total Risk-Based Capital 15.66% 8.00% 10.00% Tier 1 Risk-Based Capital 14.44% 6.00% 8.00% Tier 1 Capital 10.32% 4.00% 5.00% Common Equity Tier 1 Capital 13.73% 4.50% 6.50% 16

Appendix – Non-GAAP Financial Measures

Non-GAAP Financial Measures Tangible Book Value Per Share: 6/30/2017 6/30/2018 Book value per share $ 13.82 $ 13.98 Effect of intangible assets per share (1.41) (1.38) Tangible book value per share $ 12.41 $ 12.60 Tangible Common Equity: Equity $ 169,022 $ 168,257 Less: Intangible assets (17,193) (16,592) Tangible common equity $ 151,829 $ 151,665 6 Ms Ended Core Income: 12/31/2013 12/31/2016 12/31/2017 06/30/2018 Reported net income (loss) $ (855) $ 11,310 $ 5,242 $ 5,359 Merger expenses 1,721 - - - Net gain on sale of investment in affiliate - (5,060) - (540) Revaluation of deferred tax asset - - 3,969 - Core income $ 866 $ 6,250 $ 9,211 $ 4,819 18 Dollars in thousands, except per share amounts.
