Attached files
| file | filename |
|---|---|
| 8-K - CURRENT REPORT - Western New England Bancorp, Inc. | wneb-8k_091918.htm |
Western New England Bancorp, Inc. 8-K
Exhibit 99.1

Investor Presentation September 2018
We may, from time to time, make written or oral “forward - looking statements” within the meaning of the Private Securities Litigation Reform Act of 1995 , including statements contained in our filings with the Securities and Exchange Commission (the “SEC”), our reports to shareholders and in other communications by us . This presentation contains “forward - looking statements,” which may be identified by the use of such words as “believe,” “expect,” “anticipate,” “should,” “planned,” “estimated,” and “potential . ” Examples of forward looking statements include, but are not limited to, estimates with respect to our financial condition, results of operations and business that are subject to various factors which could cause actual results to differ materially from these estimates . These factors include, but are not limited to : • changes in the interest rate environment that reduce margins ; • the effect on our operations of governmental legislation and regulation, including changes in accounting regulation or standards, the nature and timing of the adoption and effectiveness of new requirements under the Dodd - Frank Act Wall Street Reform and Consumer Protection Act of 2010 , Basel guidelines, capital requirements and other applicable laws and regulations ; • the highly competitive industry and market area in which we operate ; • general economic conditions, either nationally or regionally, resulting in, among other things, a deterioration in credit quality ; • changes in business conditions and inflation ; • changes in credit market conditions ; • The inability to realize expected cost savings or achieve other anticipated benefits in connection with business combinations and other acquisitions ; • changes in the securities markets which affect investment management revenues ; • increases in Federal Deposit Insurance Corporation deposit insurance premiums and assessments ; • changes in technology used in the banking business ; • the soundness of other financial services institutions which may adversely affect our credit risk ; • certain of our intangible assets may become impaired in the future ; • our controls and procedures may fail or be circumvented ; • new lines of business or new products and services, which may subject us to additional risks ; • changes in key management personnel which may adversely impact our operations ; • severe weather, natural disasters, acts of war or terrorism and other external events which could significantly impact our business ; and • other factors detailed from time to time in our SEC filings . Although we believe that the expectations reflected in such forward - looking statements are reasonable, actual results may differ materially from the results discussed in these forward - looking statements . You are cautioned not to place undue reliance on these forward - looking statements, which speak only as of the date hereof . We do not undertake any obligation to republish revised forward - looking statements to reflect events or circumstances after the date hereof or to reflect the occurrence of unanticipated events, except to the extent required by law . Forward - Looking Statements
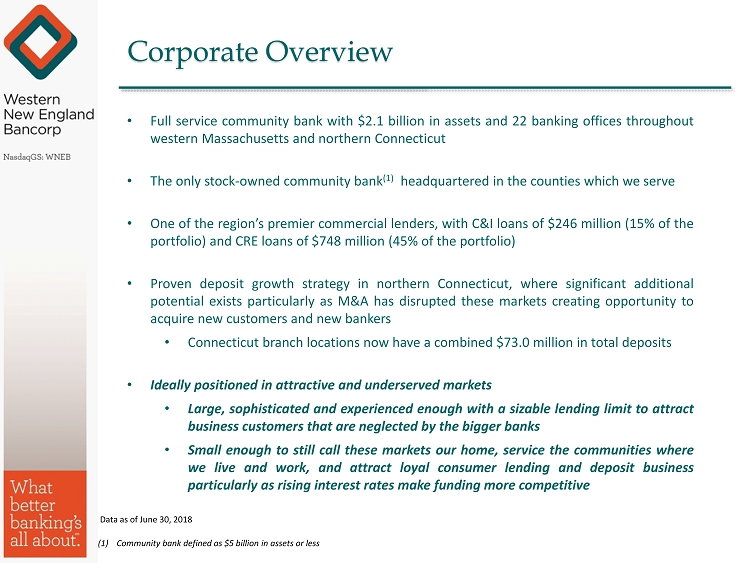
Corporate Overview • Full service community bank with $ 2 . 1 billion in assets and 22 banking offices throughout western Massachusetts and northern Connecticut • The only stock - owned community bank ( 1 ) headquartered in the counties which we serve • One of the region’s premier commercial lenders, with C&I loans of $ 246 million ( 15 % of the portfolio) and CRE loans of $ 748 million ( 45 % of the portfolio) • Proven deposit growth strategy in northern Connecticut, where significant additional potential exists particularly as M&A has disrupted these markets creating opportunity to acquire new customers and new bankers • Connecticut branch locations now have a combined $ 73 . 0 million in total deposits • Ideally positioned in attractive and underserved markets • Large, sophisticated and experienced enough with a sizable lending limit to attract business customers that are neglected by the bigger banks • Small enough to still call these markets our home, service the communities where we live and work, and attract loyal consumer lending and deposit business particularly as rising interest rates make funding more competitive Data as of June 30, 2018 (1) Community bank defined as $5 billion in assets or less
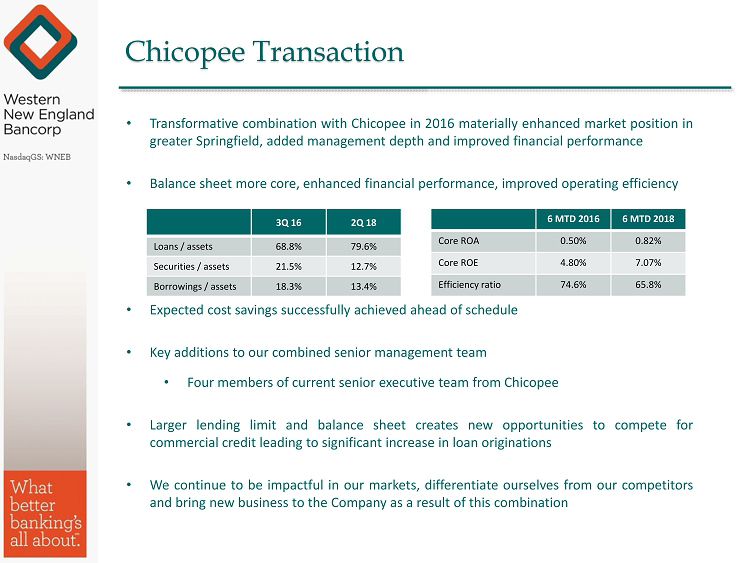
Chicopee Transaction • Transformative combination with Chicopee in 2016 materially enhanced market position in greater Springfield, added management depth and improved financial performance • Balance sheet more core, enhanced financial performance, improved operating efficiency • Expected cost savings successfully achieved ahead of schedule • Key additions to our combined senior management team • Four members of current senior executive team from Chicopee • Larger lending limit and balance sheet creates new opportunities to compete for commercial credit leading to significant increase in loan originations • We continue to be impactful in our markets, differentiate ourselves from our competitors and bring new business to the Company as a result of this combination 3Q 16 2Q 18 Loans / assets 68.8% 79.6% Securities / assets 21.5% 12.7% Borrowings / assets 18.3% 13.4% 6 MTD 2016 6 MTD 2018 Core ROA 0.50% 0.82% Core ROE 4.80% 7.07% Efficiency ratio 74.6% 65.8%

________ Source: Western Mass EDC website; deposit market share data from FDIC website as of June 30, 2018 Note: Two Westfield branches are located in Hartford County, CT and two are located in Hampshire county, MA outside of Springfield MSA Springfield MSA Total population 641,390 Median household income $56,824 Average household income $78,425 • Springfield is New England’s fourth largest city • Hartford - Springfield area is deemed Knowledge Corridor with over 170 , 000 students attending 29 universities and colleges • More than 5 , 500 businesses – top industries include health care, education, retail trade • MGM Springfield, a 125 , 000 square foot casino and 2 million square foot complex, was a $ 960 million investment adding 2 , 000 construction jobs and 3 , 000 casino jobs Deposits in 2018 # of Market Market Rank Institution (ST) Branches ($000) Share (%) 1 Bank of America Corp. (NC) 12 2,130,987 13.65 2 Peoples Bancorp MHC (MA) 20 1,936,959 12.41 3 Toronto - Dominion Bank 19 1,791,244 11.47 4 Western New England Bancorp (MA) 22 1,488,234 9.53 5 Berkshire Hills Bancorp Inc. (MA) 16 1,189,369 7.62 6 Florence Bancorp MHC (MA) 11 1,161,130 7.44 7 United Financial Bancorp (CT) 16 1,100,182 7.05 8 Hometown Financial Group MHC (MA) 10 1,079,865 6.92 9 KeyCorp (OH) 8 1,013,496 6.49 10 Country Bank for Savings (MA) 9 804,690 5.15 Total for Institutions In Market 193 15,613,987
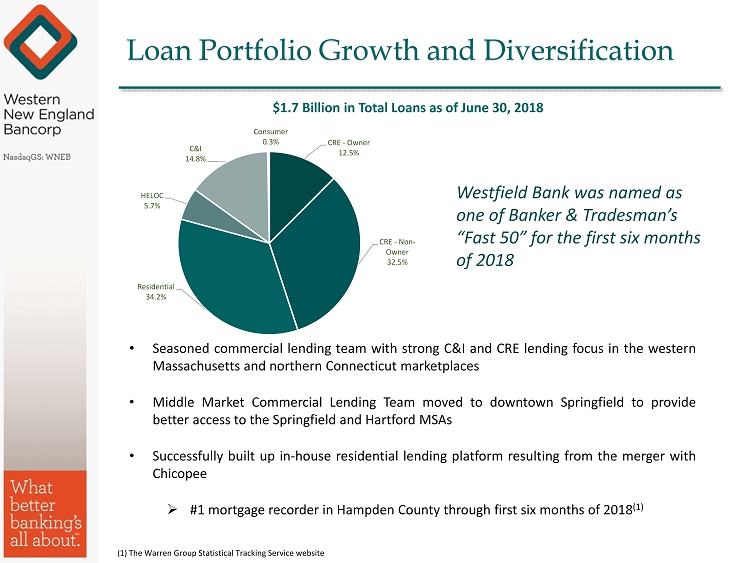
Loan Portfolio Growth and Diversification CRE - Owner 12.5% CRE - Non - Owner 32.5% Residential 34.2% HELOC 5.7% C&I 14.8% Consumer 0.3% • Seasoned commercial lending team with strong C&I and CRE lending focus in the western Massachusetts and northern Connecticut marketplaces • Middle Market Commercial Lending Team moved to downtown Springfield to provide better access to the Springfield and Hartford MSAs • Successfully built up in - house residential lending platform resulting from the merger with Chicopee » # 1 mortgage recorder in Hampden County through first six months of 2018 ( 1 ) ( 1) The Warren Group Statistical Tracking Service website $1.7 Billion in Total Loans as of June 30, 2018 Westfield Bank was named as one of Banker & Tradesman’s “Fast 50” for the first six months of 2018

Deposit Diversification Int - bearing DDA 6% DDA 20% Savings 9% MMA 27% Time > $250,000 9% Time < $250,000 29% $1.6 Billion in Total Deposits as of June 30, 2018
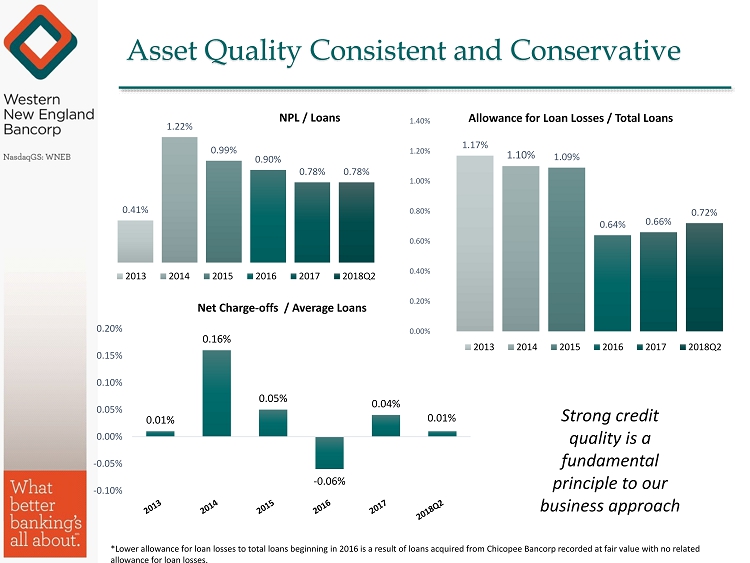
Asset Quality Consistent and Conservative 0.41% 1.22% 0.99% 0.90% 0.78% 0.78% 2013 2014 2015 2016 2017 2018Q2 NPL / Loans 0.01% 0.16% 0.05% - 0.06% 0.04% 0.01% -0.10% -0.05% 0.00% 0.05% 0.10% 0.15% 0.20% Net Charge - offs / Average Loans 1.17% 1.10% 1.09% 0.64% 0.66% 0.72% 0.00% 0.20% 0.40% 0.60% 0.80% 1.00% 1.20% 1.40% Allowance for Loan Losses / Total Loans 2013 2014 2015 2016 2017 2018Q2 Strong credit quality is a fundamental principle to our business approach *Lower allowance for loan losses to total loans beginning in 2016 is a result of loans acquired from Chicopee Bancorp recorde d a t fair value with no related allowance for loan losses.
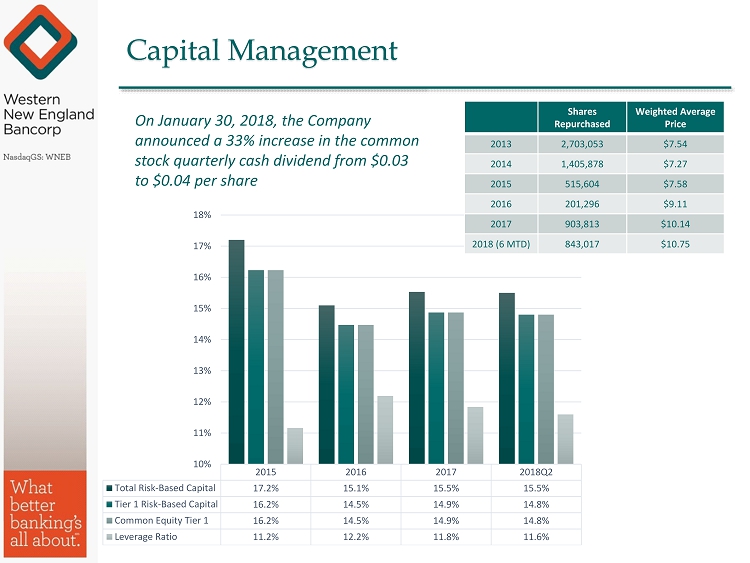
Capital Management 2015 2016 2017 2018Q2 Total Risk-Based Capital 17.2% 15.1% 15.5% 15.5% Tier 1 Risk-Based Capital 16.2% 14.5% 14.9% 14.8% Common Equity Tier 1 16.2% 14.5% 14.9% 14.8% Leverage Ratio 11.2% 12.2% 11.8% 11.6% 10% 11% 12% 13% 14% 15% 16% 17% 18% Shares Repurchased Weighted Average Price 2013 2,703,053 $7.54 2014 1,405,878 $7.27 2015 515,604 $7.58 2016 201,296 $9.11 2017 903,813 $10.14 2018 (6 MTD) 843,017 $10.75 On January 30, 2018, the Company announced a 33% increase in the common stock quarterly cash dividend from $0.03 to $0.04 per share
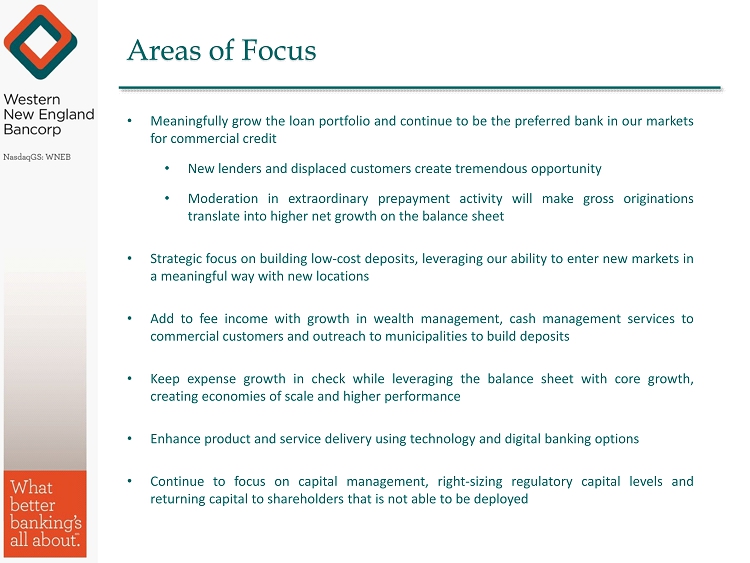
Areas of Focus • Meaningfully grow the loan portfolio and continue to be the preferred bank in our markets for commercial credit • New lenders and displaced customers create tremendous opportunity • Moderation in extraordinary prepayment activity will make gross originations translate into higher net growth on the balance sheet • Strategic focus on building low - cost deposits, leveraging our ability to enter new markets in a meaningful way with new locations • Add to fee income with growth in wealth management, cash management services to commercial customers and outreach to municipalities to build deposits • Keep expense growth in check while leveraging the balance sheet with core growth, creating economies of scale and higher performance • Enhance product and service delivery using technology and digital banking options • Continue to focus on capital management, right - sizing regulatory capital levels and returning capital to shareholders that is not able to be deployed
11 Appendix: Financial Information

Enhancing Profitability 0.53% 0.48% 0.42% 0.54% 0.72% 0.82% 0.00% 0.10% 0.20% 0.30% 0.40% 0.50% 0.60% 0.70% 0.80% 0.90% Core ROAA 4.04% 4.18% 4.10% 4.94% 5.97% 7.07% 0.00% 1.00% 2.00% 3.00% 4.00% 5.00% 6.00% 7.00% 8.00% Core ROAE $0.34 $0.34 $0.33 $0.41 $0.50 $0.29 $0.00 $0.10 $0.20 $0.30 $0.40 $0.50 $0.60 Core EPS

Improving Net Interest Margin 2.58% 2.60% 2.53% 2.70% 3.12% 3.19% 2.00% 2.20% 2.40% 2.60% 2.80% 3.00% 3.20% 3.40%
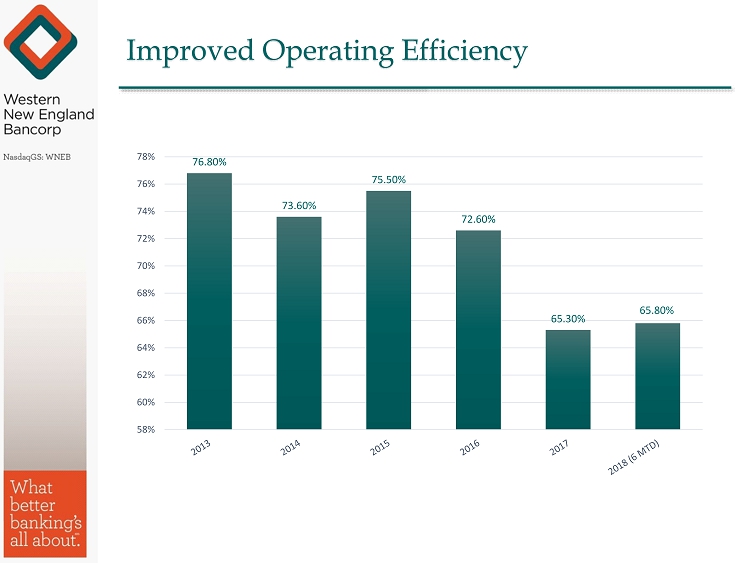
Improved Operating Efficiency 76.80% 73.60% 75.50% 72.60% 65.30% 65.80% 58% 60% 62% 64% 66% 68% 70% 72% 74% 76% 78%
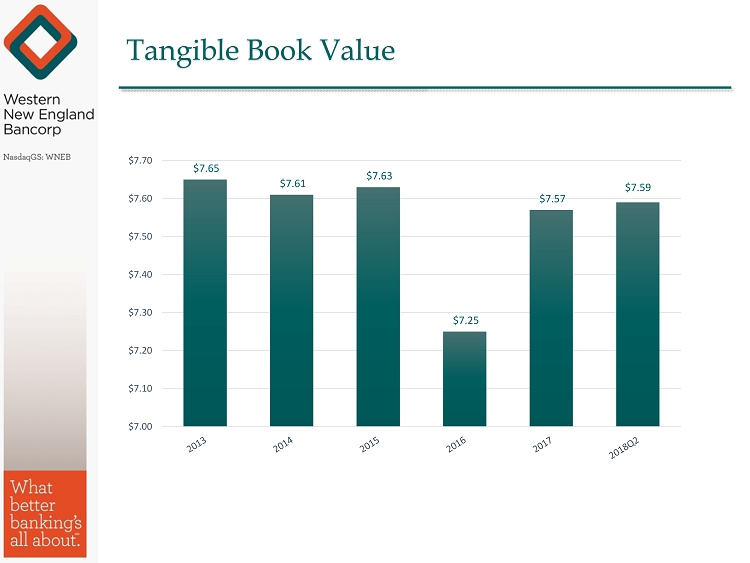
Tangible Book Value $7.65 $7.61 $7.63 $7.25 $7.57 $7.59 $7.00 $7.10 $7.20 $7.30 $7.40 $7.50 $7.60 $7.70

2 nd Quarter 2018 2Q2018 1Q2018 2Q2017 EPS $0.18 $0.12 $0.12 “Adjusted” EPS $0.17 $0.12 $0.12 Earnings per Share 2Q2018 1Q2018 2Q2017 ROAA 0.98% 0.69% 0.73% “Adjusted” ROAA 0.95% 0.69% 0.70% Return on Average Assets Return on Average Equity 2Q2018 1Q2018 2Q2017 ROAE 8.63% 5.82% 6.05% “Adjusted” ROAE 8.38% 5.79% 5.90% 2Q2018 1Q2018 2Q2017 Net Interest Margin 3.27% 3.12% 3.11% “Adjusted” Net Interest Margin 3.08% 3.07% 3.04% Net Interest Margin The following were excluded to calculate the “adjusted” results for the periods indicated as management believes this more accurately reflects the Company’s results of operations in the overall evaluation of its performance : 2 nd Quarter 2018 : Excludes $ 909 , 000 in purchase adjustments due to Chicopee merger and $ 715 , 000 gain on bank - owned life insurance death benefit . 1 st Quarter 2018 : Excludes $ 235 , 000 in purchase accounting adjustments due to the Chicopee merger . 2 nd Quarter 2017 : Excludes $ 341 , 000 in purchase accounting adjustments due to the Chicopee merger, tax benefits and merger costs recorded during the period .
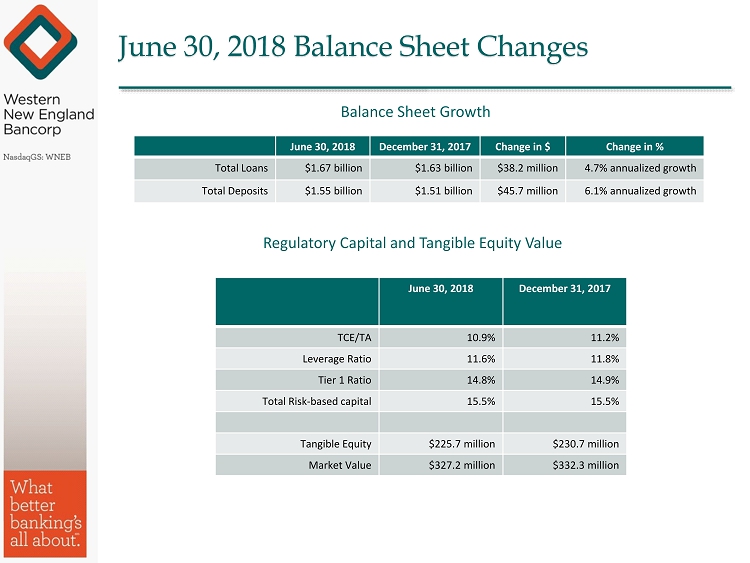
June 30, 2018 Balance Sheet Changes June 30, 2018 December 31, 2017 Change in $ Change in % Total Loans $1.67 billion $1.63 billion $38.2 million 4.7% annualized growth Total Deposits $1.55 billion $1.51 billion $45.7 million 6.1% annualized growth Balance Sheet Growth June 30, 2018 December 31, 2017 TCE/TA 10.9% 11.2% Leverage Ratio 11.6% 11.8% Tier 1 Ratio 14.8% 14.9% Total Risk - based capital 15.5% 15.5% Tangible Equity $225.7 million $230.7 million Market Value $327.2 million $332.3 million Regulatory Capital and Tangible Equity Value

Reconciliation of Non - GAAP to GAAP Financial Measures Three Months Ended Six Months Ended June 30, March 31, June 30, June 30, June 30, 2018 2018 2017 2018 2017 (Dollars in thousands, except per share data) Net Income: Net income, as presented $5,138 $3,519 $3,756 $8,657 $8,859 Merger related expenses, net of tax (1) - - 82 - 379 Tax benefit impact (2) (150) (15) (174) (165) (1,806) Core net income, exclusive of merger related expenses and tax benefits impact $4,988 $3,504 $3,664 $8,492 $7,432 Diluted EPS: Diluted earnings per share, as presented $0.18 $0.12 $0.12 $0.29 $0.30 Merger related expense impact, net of tax (1) - - 0.01 - 0.01 Tax benefits impact (2) (0.01) - (0.01) - (0.06) Core diluted EPS, exclusive of merger related expense and tax benefits impact $0.17 $0.12 $0.12 $0.29 $0.25 Return on Average Assets: Return on average assets, as presented 0.98% 0.69% 0.73% 0.84% 0.86% Merger related expense impact, net of tax (1) - - 0.01 - 0.05 Tax benefits impact (2) (0.03) - (0.04) (0.02) (0.18) Core return on average assets, exclusive of merger related expense and tax benefits impact 0.95% 0.69% 0.70% 0.82% 0.73% Return on Average Equity: Return on average equity, as presented 8.63% 5.82% 6.05% 7.21% 7.26% Merger related expense impact, net of tax (1) - - 0.13 - 0.35 Tax benefits impact (2) (0.25) (0.03) (0.28) (0.14) (1.48) Core return on average equity, exclusive of merger related expense and tax benefits impact 8.38% 5.79% 5.90% 7.07% 6.13% (1) Assumed tax rate for deductible expenses of 33.0% for the three and six months ended June 30, 2017. (2) Tax benefit impact of the reversal of a deferred tax valuation allowance, stock option exercises and bank - owned life insurance d eath benefits.