Attached files
| file | filename |
|---|---|
| 8-K - FORM 8-K - Grom Social Enterprises, Inc. | grom_8k.htm |
Exhibit 99.1

• Corporate Presentation • September 2018

Page 2 Disclaimer / Forward Looking Statements Disclaimer This document is based on information provided by Grom Social Enterprises, Inc. (OTC:GRMM) (the “Company”) and other sources that the Company believes are reliable. Nothing in this document is, or may be relied upon as, a promise or representation by the Company as to the past or the future information or results. This is not an offer or the solicitation of an offer to buy any securities of the Company, and readers should not construe the contents of this document as investment, lega l or tax advice. The information contained in this document is made as of the date hereof, and does not reflect any events tha t may occur subsequent to the date hereof. The Company undertakes no duty or obligation to update or revise the information included in this presentation. Forward Looking Statements This presentation includes forward - looking statements that are made pursuant to the "safe harbor" provisions of the private securities litigation reform act of 1995. Forward - looking statements reflect our current views with respect to future events and involve inherent risks and uncertainties which could cause actual results to differ materially from our historical experience an d present expectations or projections as a result of various factors, including those risks and uncertainties described in the ris k factors and in management’s discussion and analysis of financial condition and results of operations sections of our annual report on form 10 - k and subsequently filed quarterly reports on form 10 - q, filed with the Securities and Exchange Commission. One can find many (but not all) of these statements by looking for terms such as "believe," "expect," “hope,” ”project,” "may ," "will," "should," “would,” "could," "seek," "intend," "plan," "estimate," "anticipate" and similar terms. all statements othe r t han statements of historical facts included in this presentation, including statements regarding our strategies, prospects, finan cia l condition, operations, costs, plans and objectives are forward - looking statements. We urge you to consider those risks and uncertainties in evaluating our forward - looking statements. We caution readers not to place undue reliance upon any such forward - looking statements, which represent our estimates and assumptions only as of the date hereof. Except as required by law, we undertake no obligation to update any forward - looking statement, whether written or oral, that may be made from time to time, whether as a result of new information, future developments or otherwise. We anticipate that subsequent events and developments will cause our views to change.

Page 3 • Company Overview • Operating Subsidiaries – Revenues • Executive Management Team
Page 4 Company Overview Grom Social Enterprises, Inc. (OTC:GRMM) is a media, technology and entertainment company that focuses on delivering content to children between the ages of 5 – 16 in a safe and secure environment that can be monitored by parents or other guardians. ▪ The Company delivers its content through mobile and desktop environments including (web portal and several Apps) that entertain children, allow kids to interact with their peers, while teaching good digital citizenship. ▪ The Company has several operating subsidiaries: ▪ Top Draw Animation - an award winning animation company which produces 2D animated content for both Grom Social and some of the largest media companies in the world. ▪ Grom Social - allows users to view innovative and creative content, chat with friends, get relevant news, and play proprietary games. It has grown to ~17M (1) users all over the world. ▪ Grom Educational Services / Netspective - provides web filtering services to an additional 2M children across 3,700 schools and libraries. Corporate Profile Headquarters Boca Raton, FL Stock Symbol OTCQB:GRMM Market Cap. (2) $31.9 Million Shares Outstanding (2) ~127.5 Million Share Price (2) $0.25 Insider Ownership (2) 25% (2) As of September 14 th , 2018 (1) Since inception, the Company has had ~17M users, which are defined as any child between the ages of 5 and 16 or adult who has logged on to a Grom Social platform.
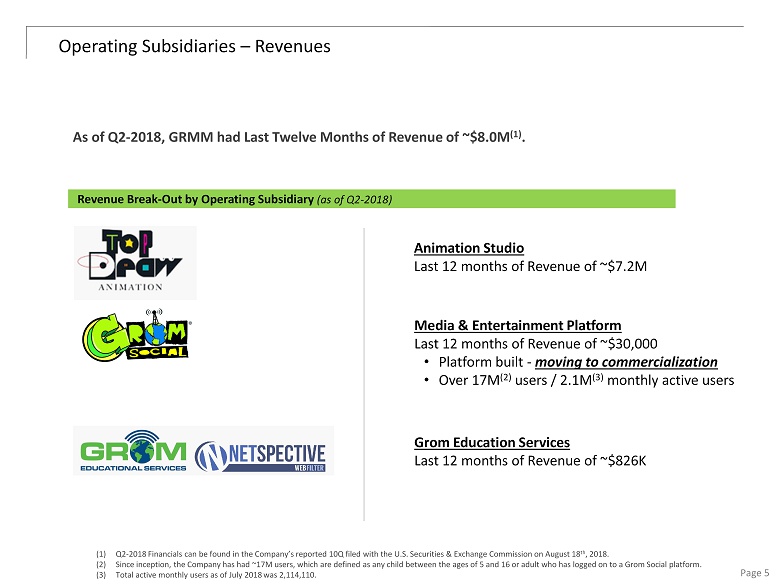
Page 5 Operating Subsidiaries – Revenues Animation Studio Last 12 months of Revenue of ~$7.2M Media & Entertainment Platform Last 12 months of Revenue of ~$30,000 • Platform built - moving to commercialization • Over 17M (2) users / 2.1M (3) monthly active users Grom Education Services Last 12 months of Revenue of ~$826K As of Q2 - 2018, GRMM had Last Twelve Months of Revenue of ~$8.0M (1) . Revenue Break - Out by Operating Subsidiary (as of Q2 - 2018) (1) Q2 - 2018 Financials can be found in the Company’s reported 10Q filed with the U.S. Securities & Exchange Commission on August 18 th , 2018. (2) Since inception, the Company has had ~17M users, which are defined as any child between the ages of 5 and 16 or adult who has lo gged on to a Grom Social platform. (3) Total active monthly users as of July 2018 was 2,114,110.

Page 6 Executive Management Team Darren Marks – Chairman / CEO / President ▪ Former President of DNA Brands, Inc., a beverage distributor and formerly a public company quoted on the OTCBB. Former Director of Illumination America, Inc., a publicly traded LED lighting company. Former Cofounder of Sims Communications, Inc. a telecommunications company that formerly traded on the NASDAQ, where he was responsible for the creation, design, and funding of a national telecommunications program for clients such as Alamo Rental Car and the American Automobile Association. Mr. Marks attended the University of Florida/Santa Fe Community College from 1986 to 1988. Melvin Leiner – Vice Chairman / CFO ▪ Co - founder of DNA Brands, Inc., a beverage distributer and formerly a public company quoted on the OTCBB. Former Director of Illumination America, Inc., a publicly traded LED lighting company. Former Cofounder, and CEO of Sims Communications, Inc., a telecommunications company that went public with an IPO on NASDAQ in 1995. Mr. Leiner attended Marshall College where he studied business. Wayne Dearing – EVP of Global Finance ▪ Has served as managing Director of TD Holdings LTD, the parent company of Top Draw, animation a company he founded. Mr. Dearing previously served as financial and operations leader of Hanna - Barbera Australia and Hanna - Barbera Asia. He previously was General Manager of multiple division of Broadcom Australia, which at the time was one of Australia’s largest independent media companies.
Page 7 • Changing TV Consumption Patterns • Safety Concerns Online

Page 8 Children’s Entertainment Consumption Patterns Are Changing Over the last decade, there has been a major change in the way children consume media content. ▪ Kids and Young Adults no longer watch traditional television, but instead get their entertainment online, either on their desktop, or on their mobile devices (smart - phones or tablets). Q1-2011 Q1-2012 Q1-2013 Q1-2014 Q1-2015 Q1-2016 Q1-2017 Q1-2018 26:28 24:44 23:24 21:49 18:04 16:18 14:31 10:09 Young Americans Turn Their Back on TV Weekly Time Americans Aged 18 – 24 Spend Watching Traditional TV (hh:mm) (1) (1) Statista Charts (traditional TV includes all live and DVR time shifted TV viewing)

Page 9 Are Kids Safe Online? Many parents worry about the content of what their young children are consuming online, and how they can efficiently monitor this activity to keep kids safe. ▪ Who are they communicating with? Is the media content age appropriate? Is the media content consistent with the parents’ values?
Page 10 • Top Draw Animation • Grom Social • Grom Educational Service / Netspective • MamaBear App

Page 11 Top Draw Animation Top Draw Animation (TDA) is an award winning producer of top - quality animation and is one of the leading producers of 2D animation for television markets around the world. ▪ TDA is recognized by producers and broadcasters as a provider of quality television animation and currently provides services to many high - profile properties ▪ Recent Awards Won o 2016 Pixie Awards Winner o 2018 Sidney Design Awards ▪ TDA employs over 500 cartoonists in studios in the Philippines. ▪ Has state - of - the - art studios in Manila that span 30,000 sqft. ▪ Has produced more than 250 half hours of 2D animation in 2017; has accumulated production of +2,000 half hours under the Top Draw banner. ▪ TDA has been in business since 1999. ▪ As of Q2 - 2018, the TDA division of GRMM has Last Twelve Month Revenues of $7.2M

Page 12 Top Draw Animation – Blue Chip Clients TDA has some of the largest media companies as its clients, including: ▪ Disney Television Animation ▪ Warner Bros. ▪ Hasbro ▪ Nickelodeon ▪ Cartoon Network ▪ Netflix ▪ DHX Media (Canada) ▪ Slap Happy Cartoons (Canada) The Company is currently working on some high - profile cartoon properties (1) . The Hollow (Netflix) Monster Beach (Cartoon Network) My Little Pony (DHX Media) Penn Zero (Disney Television Animation) George of the Jungle (DHX Media) The Tom & Jerry Show (Slap Happy Cartoons) (1) The listed cartoon series are a small sample set of the current scope of TDA’s current roster of media projects.

Page 13 Top Draw Animation – Growth Catalysts Global consumers are displaying a growing appetite for engaging, high - definition visual experiences. Some of the catalyst for growth in animation are: ▪ increase in targeted broadcasting hours by cable and satellite TV (more hours means need for more content) ▪ Penetration of mobile devices along with the growing popularity of streaming video (which is the fastest growing segment distribution channel for animation) More of the animation production process is taking place outside of US/Europe. ▪ Production work is going to where there is high expertise, and comparatively lower regional low labor costs. The future of animation includes growth segments in augmented reality and virtual reality. Top Draw Animation – Future Revenues TDA has forecastable revenue numbers. ▪ Because of the nature of its business, TDA contracts with its media clients several quarters in advance. ▪ It has a pipeline of cartoon series projects (and its associated revenue) that has visibility of ~12 months into the future.

Page 14 Grom Social Grom Social is a new children’s media destination for the 21 st century. ▪ We feature a broad offering of content including videos, games and educational offerings to engage and entertain kids between the ages of 5 - 16. ▪ We connect kids around the world with the ability to chat and interact online – a SAFE social network “by kids for kids”. ▪ We promote good digital citizenship and take a stand against bullying.

Page 15 Grom Social Stats & Analytics User Data Total Users (1) 17,009,835 Total Active Monthly Users (2) 2,114,110 Average Child Online Duration (3) 53.2 Minutes Average Parent Online Duration (3) 4.3 Minutes Bounce Rate (4) 29.3% Device Usage (5) Mobile 58.2% Desktop 33.6% Tablet 8.2% Gender Breakdown (5) Male 51.0% Female 48.0% Most Popular Sections (5) (1) Grom Chat (6) Grom Action Sports (2) Grom TV (7) Grom Fitness (3) Grom Games Center (8) Grom Education (4) Grom Entertainment (9) Gromtogrophy (5) Creative Grom (10) Grom Pets Geographical Breakdown (5) United States 27.6% India 14.9% Brazil 11.5% Indonesia 10.9% Canada 9.8% 1) Total users (incl. parents) on all platforms since inception a/o August 27 th , 2018. 2) Total active monthly users as of July 2018. 3) Average daily usage for July 2018. 4) Device usage, gender breakdown, most popular sections and geographical breakdown as are as of July 2018. 5) Bounce Rate is as % of visitors to a website who navigate away from the site after viewing only one page. 6) Data obtained from Google Data Analytics, and Joomla Content Management System. 4.0 4.1 4.6 4.8 5.0 5.3 5.7 6.1 6.5 6.8 7.6 10.2 11.5 12.8 14.0 14.6 15.3 16.2 16.7 17.0 3.0 5.0 7.0 9.0 11.0 13.0 15.0 17.0 19.0 21.0 Jan-17 Feb-17 Mar-17 Apr-17 May-17 Jun-17 Jul-17 Aug-17 Sep-17 Oct-17 Nov-17 Dec-17 Jan-18 Feb-18 Mar-18 Apr-18 May-18 Jun-18 Jul-18 Aug-18 Total Users (Since Inception) | January 2017 – Present | Millions (6)

Page 16 Grom Social – Industry User Values Grom Social has spent the last several years building a robust platform that is safe, can attract kids through the right content, and has steadily grown its users . ▪ As of August 2018 Grom Social had approximately ~17M total million users since inception. ▪ As of August 2018 – the Company had ~2.1M Monthly Active Users ▪ Grom Social is releasing its Next - Generation App in Q4 - 2018 Current User Value of Popular Sites (1) Twitter $77.0 Groupon $52.3 Snapchat $51.4 Zynga $38.5 Yelp $22.4 (1) Current User Value was determined by taking the market capitalization of the company, and dividing it by the number of Monthly Active Users. Market capitalizations were derived from S&P Capital IQ market data as of August 25 th , 2018. The monthly average user data was obtained from each Company’s latest quarterly financials. Companies selected are a collection of different technology companies that had a “user - engagement” feature.
Page 17 Grom Educational Services / Netspective Grom Educational Services is the division which offers the NetSpective WebFilter. ▪ The NetSpective WebFilter provides protection and security for schools and students meeting and exceeding Children’s Internet Protection Act (CIPA) requirements for technology protection measures and internet safety policies which include filtering and monitoring the online activities of minors/students. ▪ This product is being used by two million children across 3,700 schools and libraries. ▪ Company had LTM Revenues of ~$826K

Page 18 • Ownership / Capitalization Table

Page 19 Capitalization / Ownership Table Insiders own a significant portion of the equity of the Company. ▪ 25% of the Company’s Common Stock is held by the management team / directors. Ownership Table (as of August 19 th , 2018) Holder # of Shares % Of Common Stock Outstanding Fully Diluted Shares (#) Fully Diluted Shares (%) Darren Marks (Chairman / CEO) (1) 14,995,381 11.8% 24,377,881 (2) 14.1% Mel Leiner (Vice Chairman / CFO) (1) 9,313,136 7.3% 18,695,636 (2) 10.8% Wayne Dearing (EVP Global Finance) 4,154,349 3.3% 4,154,349 2.5% Dr. Thomas Rutherford (Director) 2,864,475 2.2% 3,698,475 (2) 2.2% Robert Stevens (Director) 250,000 0.2% 250,000 0.2% Norman Rosenthal (Director) 291,700 0.2% 291,700 0.2% Total Insiders 31,869,041 25.0% 51,468,041 28.2% Public Float 95,626,358 75.0% 112,252,268 68.6% TOTAL 127,495,399 100.0% 163,720,309 100.0% Capitalization Table (as of August 19 th , 2018) Security Common Stock Equivalent Held Weighted Avg. Conversion / Strike Common Stock 127,495,399 Convertible Debt 4,538,087 $0.64 Stock Options 30,904,913 $0.50 Warrants 781,910 $1.36 Fully Diluted Shares Outstanding 163,720,309 (1) Includes shares held in family trusts. (2) Includes shares underlying stock options.