Attached files
| file | filename |
|---|---|
| 8-K - 8-K - TRUIST FINANCIAL CORP | form8k-discmaterials_0918.htm |

Barclays Global Financial Services Conference Kelly S. King, Chairman and CEO September 13, 2018

To make the world a better place to live by: . Helping our CLIENTS achieve economic success and financial security; . Creating a place where our ASSOCIATES can learn, grow and be fulfilled in their work; . Making the COMMUNITIES in which we work better places to be; and thereby: . Optimizing the long-term return to our SHAREHOLDERS, while providing a safe and sound investment. 2 2

Well-Positioned for the Future . Diversification produces stable, consistent and growing earnings . Differentiated businesses driving top-tier operating performance . “Disrupt or Die” – investing in our company . Achieving targeted cost savings / intense focus on expenses . Client first mentality . Strong, conservative credit culture . Achieving positive operating leverage . Committed to a strong and consistently growing dividend and a strong TSR . Vision, Mission and Values 3

BB&T Corporation: A Growing Franchise 8th Largest U.S. Financial Institution1 # of Deposits1 Deposit State Branches3 ($bn) Rank North Carolina2 319 $29.6 2 Virginia 303 23.2 4 Florida 288 18.0 7 Pennsylvania 232 13.7 6 Georgia 141 12.0 5 Maryland 152 10.0 6 South Carolina 99 8.1 3 Texas 115 6.3 14 Kentucky 93 5.7 4 West Virginia 63 5.3 1 Alabama 75 3.9 6 Tennessee 42 2.7 8 New Jersey 28 2.0 16 District of 12 1.3 9 Columbia Indiana 2 NM NM Ohio 3 NM NM Total # of Branches 1,967 1 Based on FDIC deposit market share data as of 06/30/2017 3 Branch totals as of 06/30/2018 4 2 Excludes home office deposits Source: FactSet, FDIC, S&P Global
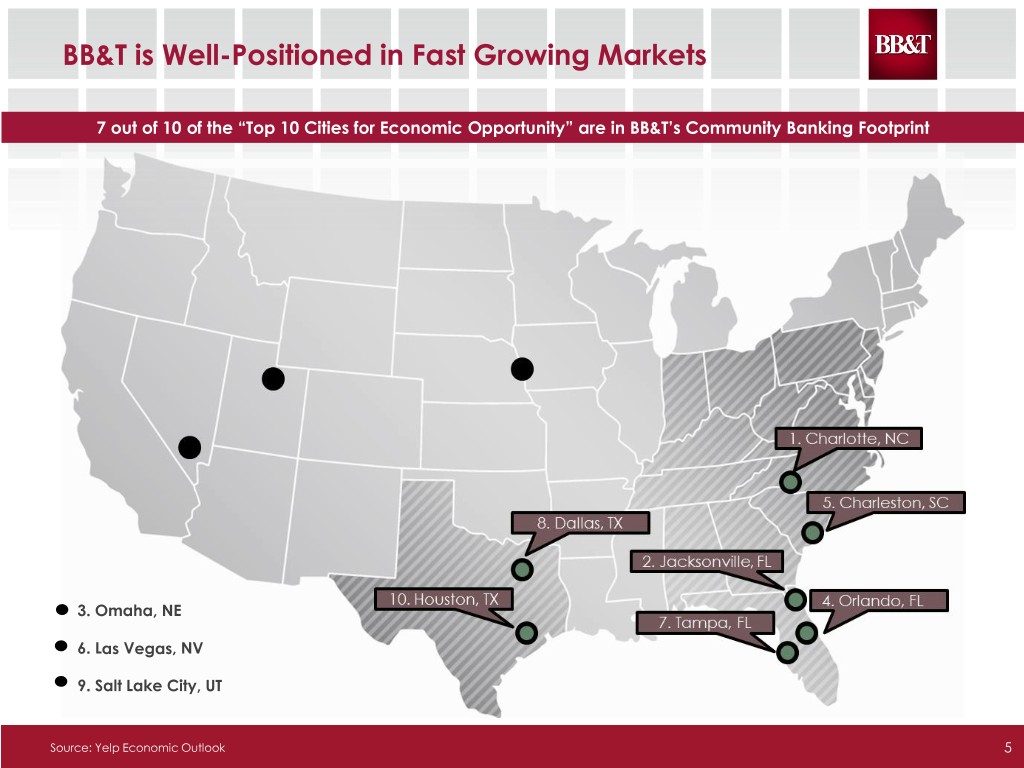
BB&T is Well-Positioned in Fast Growing Markets 7 out of 10 of the “Top 10 Cities for Economic Opportunity” are in BB&T’s Community Banking Footprint 3. Omaha, NE 6. Las Vegas, NV 9. Salt Lake City, UT Source: Yelp Economic Outlook 5

Diversification Drives Revenue and Productivity Superior Performance… PPNR/average assets 10-year average (3Q08 – 2Q18) Revenue Diversification by Segment* 1.9% Insurance Holdings & Community 1.6% Premium Bank – Retail 1.6% Finance 44% 17% BB&T National Largest Peers 4 Banks …With Less Volatility PPNR/average assets 10-year standard deviation (3Q08 – 2Q18) Financial Services & Commercial Finance 0.6% 17% 0.4% 0.3% Community Bank - Commercial National Largest 4 22% BB&T Peers Banks * Based on segment revenues, excluding other, treasury and corporate for the year-to-date period ended 06/30/2018 National peer group: CFG, CMA, FITB, HBAN, KEY, MTB, PNC, RF, STI, USB, WFC and ZION 6 Largest 4 BHCs: BAC, C, JPM, WFC

Our Differentiating Businesses Diversification and Execution 7

2018 Represents an Inflection Point 8
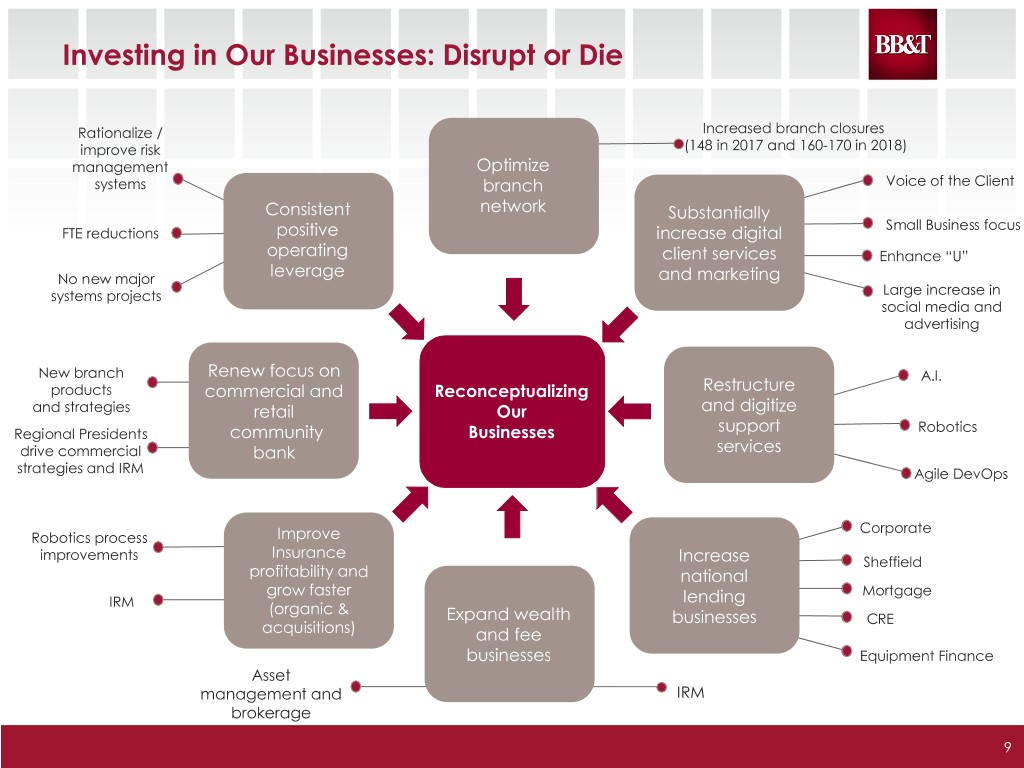
Investing in Our Businesses: Disrupt or Die Rationalize / Increased branch closures improve risk (148 in 2017 and 160-170 in 2018) management Optimize systems branch Voice of the Client Consistent network Substantially Small Business focus FTE reductions positive increase digital operating client services Enhance “U” No new major leverage and marketing systems projects Large increase in social media and advertising New branch Renew focus on A.I. products commercial and Reconceptualizing Restructure and strategies retail Our and digitize Robotics Regional Presidents community Businesses support drive commercial bank services strategies and IRM Agile DevOps Corporate Robotics process Improve improvements Insurance Increase Sheffield profitability and national grow faster lending Mortgage IRM (organic & Expand wealth businesses CRE acquisitions) and fee businesses Equipment Finance Asset management and IRM brokerage 9

Insurance Transformation Designed to unlock significant value in Insurance Corporate partnership Ensure continued ability to be nimble and flexible Wholesale Leverage scale and shared Invest in Data and Analytics to services with BB&T drive value for Insureds, brokers Retail and carriers Pursue integrated retail operating Develop an integrated go to model with the Regions Insurance market approach by focusing on Group acquisition client needs and clear communication with our clients Increase value added services for customers Continue to build depth and breath of products and services Align talent strategy with goal of to provide a one stop shop providing most efficient and high solution for our clients quality service Execute on a hiring/talent Continue to build our EB business management strategy to fuel organic growth Execute on a hiring/talent management strategy to fuel organic growth 10

End-to-End Commercial Credit Redesign Produce a redesign of the commercial lending process to simplify and improve client and associate experiences Scope: . Front, middle and back office operations . Origination, portfolio management and servicing processes Project Timeline: 2018 2019 Q3 Q4 Q1 Q2 Q3 Q4 Functional & Org Coverage Coverage E2E Operating Design E2E Model Model Credit Model DoD High-Level Definition Baseline Design Implementation Design Early Wins & Tech Design BB&T’s Governance Process E2E - ( 11

Transformation in Technology . BB&T’s Data & Technology Services (D&TS) is becoming more business line focused, and transforming to support a more technology-enabled business. . Increased focus on process . Realignment of department improvements and Transformed in direct support of business automation Organizational units Structure Enhanced New Delivery Productivity/ Model Maintain Quality $ Driving Out Cost & . Deployment of Lean Inefficiency with management principles to Lean management . Adoption of Agile and Dev/Ops reduce waste, transform principles capabilities 12

FTE Reduction and Facility/Branch Optimization Total FTEs Corporate and Non-Bank Business Locations 38,000 37,481 37,406 37,397 37,500 37,213 37,000 36,484 36,500 35,908 36,000 35,782 35,500 35,000 3/31/2017 6/30/2017 9/30/2017 3/31/2018 6/30/2018 12/31/2016 12/31/2017 Total Total 12/31/2016 06/30/2018 Changes 12/31/2016 06/30/2018 Changes FTEs 37,481 35,782 1,699 Corporate locations 198 178 20 Financial centers 2,197 1,967 230 Non-bank businesses 557 5601 +3 Total 2,952 2,705 247 1 Includes the acquisition of Regions Insurance Group 13

Long-term Performance Advantage Efficiency Ratio 70.0% 65.8% 65.2% 65.0% 63.4% 62.5% 62.3% 63.1% 61.6% 60.0% 59.5% 59.8% 60.0% 59.2% 58.1% 58.0% 59.7% 57.4% 55.0% 2014 2015 2016 2017 1H18 BBT GAAP BBT Adjusted Peers Adjusted Source: S&P Global and company reports Peers include CFG, CMA, FITB, HBAN, KEY, MTB, PNC, RF, STI, USB, WFC and ZION 14 See non-GAAP reconciliations included in the attached Appendix
Strategic Advantages 15

Enterprise “Voice of the Client” Program Launched enterprise-wide VOC program in 2018 that provides near real-time aggregate and granular client feedback on a digital platform across multiple lines and multiple channels. VOC program enables dynamic data analytics that is leveraged to support the ongoing delivery of the “Perfect Client Experience”. . Provides near real-time reporting tools for up-to-the minute insights . Constantly gather client feedback and allows client care specialist to immediately respond to unresolved client opportunities . Delivers persistent and dynamic feedback for coaching associates . Aggregates and analyzes collected feedback . Delivers transformative client insights to quickly and effectively identify emerging trends . Ensures our relentless pursuit of client experience distinction 16

Client First Solutions Established Client First Council with the Chief Client Experience Officer as the Executive Sponsor Six Sigma like team dedicated daily to discover, uncover and dissolve multi-channel client and associate challenges related to the client experience Driven to eliminate client friction and effort by incorporating immediate needed changes or enhancements with policy, process, and/or product Extreme enterprise level focus across all business lines Continuous improvements driving towards client experience distinction 17

Virtual Banking Center (VBC) VBC Objective: Enhance and deepen client relationships to improve client retention, expand household product penetration, ultimately resulting in increased revenue generation. Service to Sales Model The Virtual Banking Center Servicing clients who are a Interacting with digital Financial Checkups are used (VBC) proactively reaches longer distance from the centric clients and to inquire, discover and solve out by phone or digitally to branch (i.e. West Texas) educating non-digital client’s financial needs by engage clients who prefer to centric clients on how to providing the right financial interact with us through our interact with digital products solutions to ultimately virtual channels (i.e. OLB client not using improve the client’s financial BillPay) well-being 18
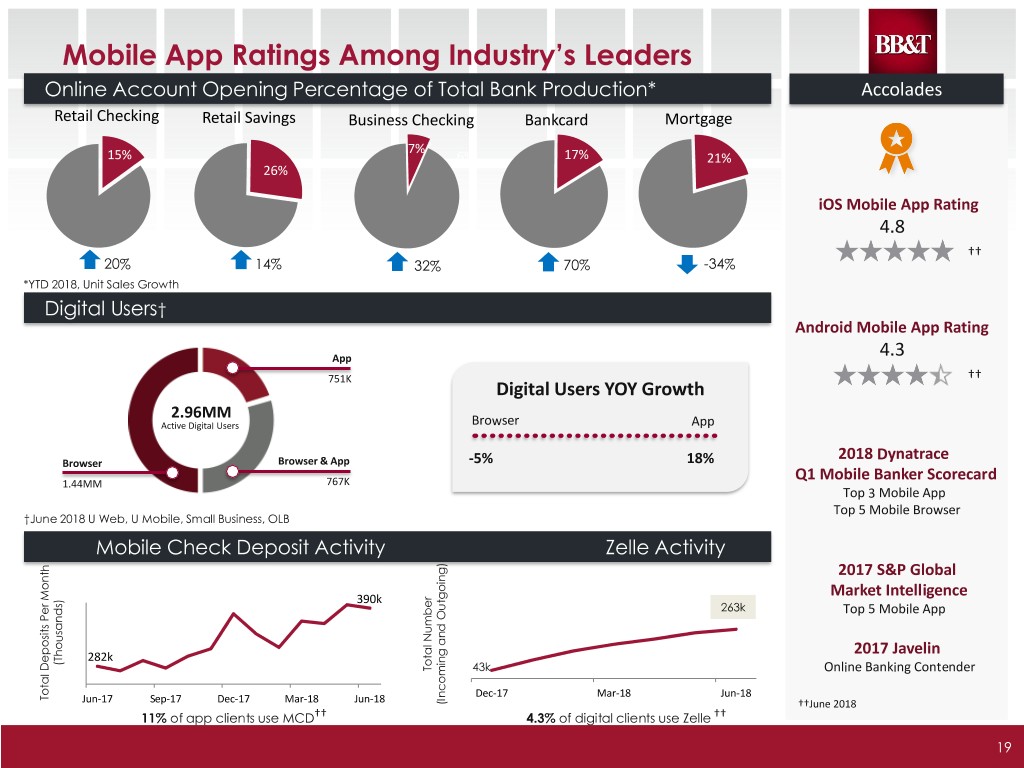
Mobile App Ratings Among Industry’s Leaders Online Account Opening Percentage of Total Bank Production* Accolades Retail Checking Retail Savings Business Checking Bankcard Mortgage 7%7% 15% 6% 17%19% 21%21% 26%27% iOS Mobile App Rating 4.8 †† 20% 14% 32% 70% -34% *YTD 2018, Unit Sales Growth YOY Digital Users† Android Mobile App Rating App 4.3 751K †† Digital Users YOY Growth 2.96MM Active Digital Users Browser App 2018 Dynatrace Browser Browser & App -5% 18% Q1 Mobile Banker Scorecard 1.44MM 767K Top 3 Mobile App Top 5 Mobile Browser †June 2018 U Web, U Mobile, Small Business, OLB Mobile Check Deposit Activity Zelle Activity 2017 S&P Global Market Intelligence 390k 263k Top 5 Mobile App 282k 2017 Javelin (Thousands) Total NumberTotal 43k Online Banking Contender Dec-17 Mar-18 Jun-18 Total DepositsTotalMonth Per Jun-17 Sep-17 Dec-17 Mar-18 Jun-18 Outgoing)and (Incoming ††June 2018 11% of app clients use MCD†† 4.3% of digital clients use Zelle †† 19

The BB&T Leadership Institute A Unique Home for a Unique Program . 60,000 square foot facility . 11 acres adjacent to the BB&T Triad Corporate Center in Greensboro . 48 rooms for overnight guests . 8 training and development rooms 20

The Leadership Institute Offers Solutions . Leadership Development – Mastering Leadership Dynamics™ – Leadership Dynamics in Practice™ – Mastering Organizational Dynamics™ – High Performance Leadership – Leadership Excellence Program – Personal Executive Development . Engagement – Engagement Surveys and Consulting – Engagement Programs – Enhancing Employee Well-Being . Talent Consulting – Succession Planning – Performance Measurement and Calibration – Optimizing Behaviors for High Performance . Change – Organizational Change Consulting . Teams – Team Optimization Process 21

Our Commitments 22

Committed to Our Associates A Strong Total Compensation Package BB&T consistently has the lowest turnover in our peer group Workers With Pension Coverage by Type of Plan 100% 1983 75% 71% 68% 1992 62% 2001 “Fewer than one in 10 corporate 2013 retirement plans match 5% of employees’ contributions dollar- 50% 44% 40% for-dollar, according to the Plan Sponsor Council of America” – WALL STREET JOURNAL 26% 25% 23% 17% 16% 16% 12% 13% 0% Defined benefit only Defined contribution - Both 401(k) plans - only BB&T’s 6 on 6 plan is better than what >90% of US company 401(k) participants receive Source: Center for Retirement Research at Boston College 23 Authors’ calculations based on U.S. Board of Governors of the Federal Reserve System. Survey of Consumer Finances (various years). Washington, DC.

Committed to Our Communities Lighthouse Project . Since 2009 we have completed more than 10,000 community service projects, provided more than 500,000 volunteer hours, and helped change the lives of more than 15 million people 24

Committed to Our Shareholders Top Tier Dividend Yield Dividend Yield as of 08/31/2018 4.00% 3.45% 3.50% 3.23% 3.14% 2.94% 3.00% 2.88% 2.72% 2.65% 2.62% 2.46% 2.45% 2.50% 2.26% 2.25% 2.22% 2.00% 1.50% 1.00% 0.50% 0.00% HBAN KEY BBT WFC RF STI PNC CFG CMA FITB MTB ZION USB Source: Nasdaq IR 25
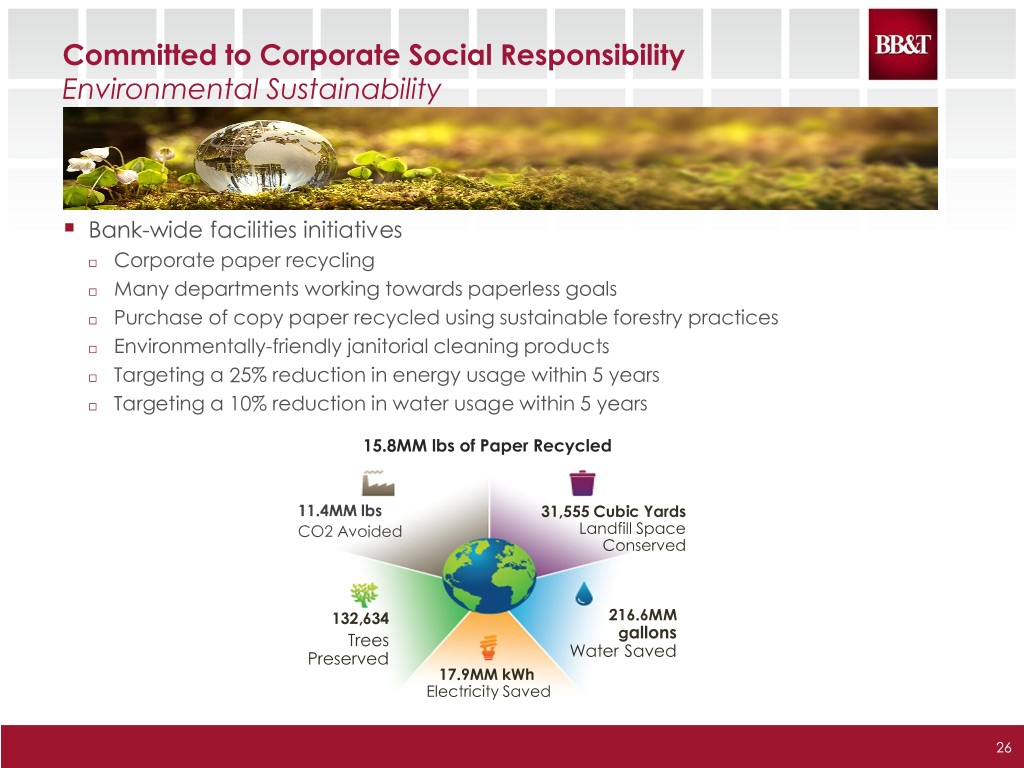
Committed to Corporate Social Responsibility Environmental Sustainability . Bank-wide facilities initiatives Corporate paper recycling Many departments working towards paperless goals Purchase of copy paper recycled using sustainable forestry practices Environmentally-friendly janitorial cleaning products Targeting a 25% reduction in energy usage within 5 years Targeting a 10% reduction in water usage within 5 years 15.8MM lbs of Paper Recycled 11.4MM lbs 31,555 Cubic Yards CO2 Avoided Landfill Space Conserved 132,634 216.6MM Trees gallons Preserved Water Saved 17.9MM kWh Electricity Saved 26

3Q18 and Full-year 2018 Outlook Category 3Q18 Average total loans held for investment Up 4% - 6% annualized vs. 2Q18 Credit quality NCOs expected to be 35 - 45 bps Net interest margin GAAP and core margins up slightly vs. 2Q18 Noninterest income3 Up 3% - 5% vs. 3Q17 Expenses1,3 Up 1% - 3% vs. 3Q17 Effective tax rate 20% Category Full-year 2018 Average total loans held for investment Up 1% - 3% vs. 2017 Revenue2,3 Up 1% - 3% vs. 2017 Expenses1,3 Flat vs. 2017 Effective tax rate 20% - 21% 1 Excludes merger-related and restructuring charges and selected items listed on page 16 of the Quarterly Performance Summary 2 Taxable-equivalent 27 3 Includes Regions Insurance Group

A-28


Appendix 30

