Attached files
| file | filename |
|---|---|
| EX-32.1 - EXHIBIT 32.1 - Presidio, Inc. | psdoex321q4fy18.htm |
| EX-32.2 - EXHIBIT 32.2 - Presidio, Inc. | psdoex322q4fy18.htm |
| EX-31.2 - EXHIBIT 31.2 - Presidio, Inc. | psdoex312q4fy18.htm |
| EX-31.1 - EXHIBIT 31.1 - Presidio, Inc. | psdoex311q4fy18.htm |
| EX-23.1 - EXHIBIT 23.1 - Presidio, Inc. | psdoex231q4fy18.htm |
| EX-21.1 - EXHIBIT 21.1 - Presidio, Inc. | psdoex211q4fy18.htm |
UNITED STATES
SECURITIES AND EXCHANGE COMMISSION
Washington, D.C. 20549
FORM 10-K
☒ | ANNUAL REPORT PURSUANT TO SECTION 13 OR 15(d) OF THE SECURITIES EXCHANGE ACT OF 1934 | |||||||
For the fiscal year ended June 30, 2018 | ||||||||
OR | ||||||||
☐ | TRANSITION REPORT PURSUANT TO SECTION 13 OR 15(d) OF THE SECURITIES EXCHANGE ACT OF 1934 | |||||||
For the transition period from ________ to ________ | ||||||||
Commission File Number: 001-38028 | ||||||||
Presidio, Inc.
(Exact name of registrant as specified in its charter)
Delaware | 47-2398593 | |||
(State or other jurisdiction of incorporation or organization) | (I.R.S. Employer Identification Number) | |||
One Penn Plaza, Suite 2832
New York, New York 10119
(212) 652-5700
(Address, including zip code, and telephone number, including area code, of registrant’s principal executive offices)
Securities registered pursuant to Section 12(b) of the Act:
Title of each class | Name of each exchange on which registered | |
Common Stock, par value $0.01 per share | NASDAQ Global Select Market | |
Securities registered pursuant to section 12(g) of the Act: None
Indicate by check mark if the registrant is a well-known seasoned issuer, as defined in Rule 405 of the Securities Act. Yes ☐ No ☒
Indicate by check mark if the registrant is not required to file reports pursuant to Section 13 or Section 15(d) of the Act. Yes ☐ No ☒
Indicate by check mark whether the registrant (1) has filed all reports required to be filed by Section 13 or 15(d) of the Securities Exchange Act of 1934 during the preceding 12 months (or for such shorter period that the registrant was required to file such reports), and (2) has been subject to such filing requirements for the past 90 days. Yes ☒ No ☐
Indicate by check mark whether the registrant has submitted electronically and posted on its corporate Web site, if any, every Interactive Data File required to be submitted and posted pursuant to Rule 405 of Regulation S-T (§ 232.405 of this chapter) during the preceding 12 months (or for such shorter period that the registrant was required to submit and post such files). Yes ☒ No ☐
Indicate by check mark if disclosure of delinquent filers pursuant to Item 405 of Regulation S-K (§ 229.405 of this chapter) is not contained herein, and will not be contained, to the best of registrant’s knowledge, in definitive proxy or information statements incorporated by reference in Part III of this Form 10-K or any amendment to this Form 10-K.
Indicate by check mark whether the registrant is a large accelerated filer, an accelerated filer, a non-accelerated filer, a smaller reporting company or an emerging growth company. See the definitions of “large accelerated filer,” “accelerated filer,” “smaller reporting company” and "emerging growth company" in Rule 12b-2 of the Exchange Act.
☐ | Large accelerated filer | ☒ | Accelerated filer | |||||
☐ | Non-accelerated filer | (Do not check if a smaller reporting company) | ☐ | Smaller reporting company | ||||
☐ | Emerging growth company | |||||||
If an emerging growth company, indicate by check mark whether the registrant has elected not to use the extended transition period for complying with any new or revised financial accounting standards provided pursuant to Section 13(a) of the Exchange Act. ☐
Indicate by check mark whether the registrant is a shell company (as defined in Rule 12b-2 of the Exchange Act): Yes ☐ No ☒
As of August 31, 2018, the latest practicable date, 92,953,627 shares of the registrant's common stock, par value $0.01 per share, were issued and outstanding. The aggregate market value of the registrant's common stock, $0.01 par value, held by non-affiliates of the registrant as of December 29, 2017, the last business day of the registrant's most recently completed second fiscal quarter, was approximately $637.2 million, based upon the last reported sales price for such date on the NASDAQ Global Select Market.
Documents Incorporated By Reference
Portions of the registrant's proxy statement for the 2018 Annual Meeting of Stockholders are incorporated by reference into Part III hereof.
Presidio, Inc.
TABLE OF CONTENTS
Page | ||
This report contains references to a number of our trademarks (including services marks) that are registered trademarks or trademarks for which we have pending applications or common-law rights. Trade names, trademarks and service marks of other companies appearing in this Annual Report on Form 10-K are the property of their respective owners.
2
Cautionary Statements Concerning Forward-Looking Statements
This Annual Report on Form 10-K contains “forward-looking statements” that involve risks and uncertainties. You can identify forward-looking statements because they contain words such as “believes,” “expects,” “may,” “will,” “should,” “would,” “could,” “seeks,” “approximately,” “intends,” “plans,” “estimates,” or “anticipates” or similar expressions that relate to our strategy, plans or intentions. All statements we make relating to our estimated and projected earnings, margins, costs, expenditures, cash flows, growth rates, and financial results or to our expectations regarding future industry trends are forward-looking statements. In addition, we, through our senior management, from time to time make forward-looking public statements concerning our expected future operations and performance and other developments. These forward-looking statements are subject to risks and uncertainties that may change at any time and, therefore, our actual results may differ materially from those that we expected. We derive many of our forward-looking statements from our operating budgets and forecasts, which are based upon many detailed assumptions. While we believe that our assumptions are reasonable, we caution that it is very difficult to predict the impact of known factors and it is impossible for us to anticipate all factors that could affect our actual results. All forward-looking statements are based upon information available to us on the date of this Annual Report on Form 10-K.
Important factors that could cause actual results to differ materially from our expectations, which we refer to as “cautionary statements,” are disclosed under “Item 1A. Risk Factors” and elsewhere in this Annual Report, including, without limitation, in conjunction with the forward-looking statements included in this Annual Report on Form 10-K. All forward-looking information in this Annual Report and subsequent written and oral forward-looking statements attributable to us, or to persons acting on our behalf, are expressly qualified in their entirety by the cautionary statements. Some of the factors that we believe could affect our results include:
• | general economic conditions; |
• | a reduced demand for our information technology solutions; |
• | a decrease in spending on technology products by our federal and local government clients; |
• | the availability of products from vendor partners and maintenance of vendor relationships; |
• | the role of rapid innovation and the introduction of new products in our industry; |
• | our ability to compete effectively in a competitive industry; |
• | the termination of our client contracts; |
• | the failure to effectively develop, maintain and operate our information technology systems; |
• | our inability to adequately maintain the security of our information technology systems and clients’ confidential information; |
• | investments in new services and technologies may not be successful; |
• | the costs of litigation and losses if we infringe on the intellectual property rights of third parties; |
• | inaccurate estimates of pricing terms with our clients; |
• | failure to comply with the terms of our public sector contracts; |
• | any failures by third-party contractors upon whom we rely to provide our services; |
• | any failures by third-party commercial delivery services; |
• | our inability to retain or hire skilled technology professionals and key personnel; |
• | the disruption to our supply chain if suppliers fail to provide products; |
• | the risks associated with accounts receivables and inventory exposure; |
• | the failure to realize the entire investment in leased equipment; |
• | our inability to realize the full amount of our backlog; |
• | our acquisitions may not achieve expectations; |
• | fluctuations in our operating results; |
• | potential litigation and claims; |
• | changes in accounting rules, tax legislation and other legislation; |
• | increased costs of labor and benefits; |
• | our inability to focus our resources, maintain our business structure and manage costs effectively; |
• | the failure to deliver technical support services of sufficient quality; |
• | the failure to meet our growth objectives and strategies; |
• | ineffectiveness of our internal controls; |
• | the risks pertaining to our substantial level of indebtedness; |
• | the ability to manage cybersecurity risks; and |
• | the other factors discussed in the section of this Annual Report entitled “Risk Factors.” |
We caution you that the foregoing list of important factors may not contain all of the material factors that are important to you. In addition, in light of these risks and uncertainties, the matters referred to in the forward-looking statements contained in this Annual Report on Form 10-K may not, in fact, occur. Moreover, we operate in a rapidly changing and competitive environment.
3
New risk factors emerge from time to time, and it is not possible for management to predict all such risk factors. Accordingly, investors should not place undue reliance on those statements. We undertake no obligation to publicly update or revise any forward-looking statement as a result of new information, future events or otherwise, except as otherwise required by law.
4
Part I
Item 1. Business
Company Overview
Presidio, Inc. (together with its subsidiaries, the "Company," "Presidio" or "we") is a leading provider of information technology (“IT”) solutions to the middle market in North America. We enable business transformation through our expertise in IT solutions for agile, secure infrastructure solution sets, with a specific focus on Digital Infrastructure, Cloud and Security solutions. Our solutions are delivered through a broad suite of professional services, including strategy, consulting, design and implementation. We complement our professional services with project management, technology acquisition, managed services, maintenance and support to offer a full lifecycle model. Our services-led, lifecycle model leads to ongoing client engagement. As of June 30, 2018, we serve approximately 8,000 middle-market, large, and government organizations across a diverse range of industries.
Our clients are increasing dependent on Presidio to develop best of breed, vendor-agnostic agile, secure infrastructure solution sets comprised of Digital Infrastructure, Cloud, and Security solutions, which are described in more detail throughout this Annual Report on Form 10-K. Through our increasing focus agile, secure infrastructure sets, we believe we are well positioned to benefit from the rapid growth in demand for Digital Infrastructure, Cloud and Security technologies. Within our three solutions areas, we offer customers enterprise-class solutions that are critical to driving digital transformation and expanding business capabilities. Examples of such solutions include advanced networking, IoT, data analytics, data center modernization, hybrid and multi-cloud, cyber risk management and enterprise mobility. These solutions are enabled by our expertise in foundational technologies, built upon our investments in network, data center, security, collaboration and mobility.
The middle market is a highly attractive segment of the IT services market, and we are differentiated by our strategic focus on this attractive segment. The increasing potential and complexity of emerging technologies and digital transformation are creating more demand for our solutions and services. Customers in the middle market are usually large enough to have substantial technology needs but typically have fewer IT resources and lack the broad expertise required to develop the necessary solutions as compared to larger companies. As a trusted solutions provider, our clients rely on us for IT investment decisions. We simplify IT for them by building solutions utilizing what we view as the best possible technologies. Since many large-scale IT service providers focus on larger enterprises, and because many resellers are unable to provide end-to-end solutions, we believe the middle market has remained underpenetrated and underserved.
We develop and maintain our long-term client relationships through a localized direct sales force of approximately 500 employees based in over 60 offices across the United States as of June 30, 2018. As a strategic partner and trusted advisor to our clients, we provide the expertise to implement new solutions, as well as optimize and better leverage existing IT resources. We provide strategy, consulting, design, customized deployment, integration and lifecycle management through our team of over 1,600 engineers as of June 30, 2018, enabling us to architect and manage the ideal IT solutions for our clients. Our local delivery model, combining relationship managers and expert engineering teams, allows us to win, retain and expand our client relationships.
Our client base is diversified across individual customers and industry verticals. In our fiscal year ended June 30, 2018, only 21% of our revenue was attributable to our top 25 clients by revenue and no industry vertical accounted for more than 19% of our revenue. Among the verticals that we serve, healthcare, government, financial services, education, and professional services are our largest categories. We believe that our diversified client profile is a key driver of our ability to generate growth across different economic and technology cycles.
As of June 30, 2018, our backlog orders believed to be firm was approximately $582 million, compared to approximately $500 million as of June 30, 2017. Our backlog orders believed to be firm represents executed but unfulfilled client orders that we expect to result in actual revenue in future periods. The actual realization and timing of any of this revenue is subject to various contingencies, many of which are beyond our control, and such realization may never occur or may change because an order could be reduced, modified or terminated early. Due to these uncertainties, we estimate that approximately $144 million of our backlog orders believed to be firm as of June 30, 2018 will not be fulfilled within the current fiscal year. Refer to the "Risk Factors" section for additional information about risks concerning our backlog orders. Additional financial information about our business segments is provided in "Management's Discussion and Analysis of Financial Condition and Results of Operations" and the "Notes to Consolidated Financial Statements," which are included elsewhere in this Annual Report on Form 10-K.
5
Our Growth Strategies
Expand and Deepen Relationships with Existing Clients
We have a long history of expanding revenue from existing clients by selling additional solutions based on their evolving needs. We believe increasing complexity in the market combined with our end-to-end IT solutions and our high-touch, lifecycle approach, position us for continued growth. This approach has resulted in strong client satisfaction and increasing client engagement that we believe will enable us to continue expanding our revenue per client as our clients leverage our expertise to adopt emerging technologies. As middle-market businesses embrace cloud capabilities and enhance digital security, we believe we are well positioned to capture increased spend from our existing client relationships.
Develop New Client Relationships
We believe the diverse and fragmented nature of the North American IT services market provides us with a significant opportunity to further grow our client base. We have developed domain expertise managing complex technologies and vertical specific-challenges, which makes us a compelling choice for potential clients looking for an IT solutions partner. Our efforts to develop new client relationships are supported by our existing, referable client base. With our technological capabilities and proven record of success with clients, we are well positioned to acquire more clients as the need grows for consulting, deployment, integration and managed services. We also conduct highly coordinated marketing and sales activities using the strength of the Presidio brand to win new clients and penetrate highly localized markets. In these markets, we are well positioned against smaller regional IT providers who lack the resources to invest in increasingly advanced IT solutions.
Develop and Offer New Services and Solutions
We focus on providing our clients with the highest quality, optimal solutions for their complex IT needs. We have developed innovative solutions for our clients across technology cycles and are currently developing and providing solutions based on emerging IT trends. Digital Infrastructure, Cloud and Security are some of the fastest growing areas of IT spend and we are focused on developing and deploying new solutions to serve these markets. For example, Presidio Concierge offering and our Next Generation Risk Management (“NGRM”) security offering help solve complex IT problems associated with these trends resulting in agile, secure infrastructure platforms. Through our national team of engineers, we maintain institutional knowledge and services capabilities that are adaptable, scalable, and transferable. We are constantly improving our offerings and developing new services and solutions for our clients, which we expect to drive incremental growth from existing and new clients.
Further Penetrate the North American Market
We have been expanding our geographic footprint in North America organically and inorganically and see new opportunities in several major regions. We take a deliberate and strategic approach to deciding which markets to pursue and consider a number of factors. Our expertise and solutions are scalable from region to region, so as we continue to expand we expect to take market share and create opportunities in new markets.
Pursue Strategic Acquisitions
We expect to continue to consider strategic acquisitions that can increase our technology expertise and geographic presence. We believe that our M&A strategy enhances and augments all of our growth avenues, including gaining capabilities, cross-selling to our existing clients and entering new markets and verticals. Since 2004, we have acquired and successfully integrated twelve companies, capitalizing on our scale, client relationships and vendor partnerships to drive margin expansion post-acquisition. In 2015, we acquired Sequoia Worldwide, LLC ("Sequoia"), a consulting, integration, and services company headquartered in California, which provided us with improved cloud consulting and integration capabilities. In 2016, we acquired Netech Corporation, an IT solutions provider headquartered in Michigan, which provided us with 11 offices to penetrate significant opportunities in the Midwestern United States. During our fiscal year ended June 30, 2018, we completed two acquisitions. In August 2017, we acquired Emergent Networks, LLC ("Emergent"), an IT solutions provider which expanded our geographic footprint into Minnesota and, in April 2018, we acquired Red Sky Solutions, LLC ("Red Sky"), which expanded our presence in the southwestern United States. We have been successful at integrating our acquisitions and retaining key management talent. These acquisitions are complementary with new office openings and the organic expansion of our presence in existing geographic markets. We expect to continue to selectively pursue acquisition opportunities within the highly fragmented IT solutions market, with a focus on enhancing our solutions offerings and geographic presence.
6
Our Competition
We believe we are the only national, vendor-agnostic IT services company that provides advanced end-to-end solutions through local high-touch relationships to the middle market. We believe we are competitively differentiated by our broad range of capabilities that we combine to offer best-in-class solutions to the middle market. We incorporate high-value services including strategy and consulting, design, implementation, optimization, and managed services, as well as technology expertise and strong vendor relationships. Across our solutions, we compete with companies such as Accenture, CDW, Deloitte, WWT, Dimension Data, DXC Technologies, ePlus, and Optiv. We categorize our competitors as:
• | Large Service Providers: Global service providers have scale and consulting capabilities but are not middle-market focused and generally do not provide all aspects of the IT value chain. We combine the scale, talent, technical expertise, and high-value services of the large service providers with end-to-end solution capabilities and a strategic middle-market focus. |
• | Local and Regional Providers: Though local and regional providers often have strong local relationships, many of them have historically been focused on one or two IT areas. As IT complexity has increased, these providers have attempted to transition from a siloed approach toward a multi-technology and multi-vendor approach. However, the relatively small scale of local and regional providers makes investments across multiple, integrated technology stacks financially prohibitive and, as a result, these competitors are increasingly getting left behind as they lack the professional and managed services capabilities in digital infrastructure, cloud, IoT, and cybersecurity. Also, lack of capability and financial scale often excludes these providers from executing on larger, multi-geography projects and relationships and developing advanced services. |
• | Boutique Specialists: Many boutique specialists focus in one distinct solution area rather than developing deep capabilities across the full range of IT challenges facing clients today. These firms are also typically sub-scale in terms of geographic coverage limiting their abilities to service larger, multi-location/multi-national customers. Our technical know-how across technologies and vendors, combined with our scale and broad client base, gives us the ability to deliver end-to-end offerings to much larger and more diverse end markets. As technologies continue to grow in complexity and interdependency, these providers will struggle to service client’s needs. |
• | Resellers: Rather than focusing principally on product resale, we focus on consulting, solution delivery, and ongoing services that allow us to develop long-lasting client relationships. Our lifecycle engagement model focuses on a holistic approach that includes high-value services and end-to-end solutions. |
Our Sponsor
AP VIII Aegis Holdings, L.P. (“Aegis LP”) holds most of our common stock. AP VIII Aegis Holdings GP, LLC (“Aegis GP”) is the general partner of Aegis LP, and Apollo Investment Fund VIII, L.P. (“Apollo VIII”) is one of the members of Aegis GP and as such has the right to direct the manager of Aegis GP in its management of Aegis GP. Apollo Management VIII, L.P. ("Management VIII") serves as the non-member manager of Aegis GP and as the investment manager of Apollo VIII. AIF VIII Management LLC ("AIF VIII LLC") serves as the general partner of Management VIII. Apollo Management, L.P. (“Apollo Management”) is the sole member and manager of AIF VIII LLC, and Apollo Management GP, LLC (“Apollo Management GP”) is the general partner of Apollo Management. Apollo Management Holdings, L.P. (“Management Holdings”) is the sole member and manager of Apollo Management GP and Apollo Management Holdings GP, LLC (“Management Holdings GP”) is the general partner of Management Holdings. Leon Black, Joshua Harris and Marc Rowan are the managers, as well as executive officers, of Management Holdings GP.
Founded in 1990, Apollo Global Management, LLC (together with its consolidated subsidiaries, "Apollo") is a leading global alternative investment manager with offices in New York, Los Angeles, Houston, Chicago, St. Louis, Bethesda, Toronto, London, Frankfurt, Madrid, Luxembourg, Mumbai, Delhi, Singapore, Hong Kong and Shanghai. As of March 31, 2018, Apollo had assets under management of approximately $247 billion in private equity, credit and real estate funds, invested across a core group of nine industries in which Apollo has considerable knowledge and resources. For more information about Apollo, please visit www.agm.com. Information contained on Apollo’s website is not intended to form a part of or be incorporated by reference into this Annual Report on Form 10-K.
7
Intellectual Property
The PRESIDIO® trademark and certain variations thereof are registered or are the subject of pending trademark applications in the U.S. We believe our trademarks have significant value and are important factors in our marketing programs. In addition, we own registrations for domain names, including presidio.com and certain other domains, for certain of our primary trademarks.
We also have pending U.S. patent applications related to our cloud management solution known as Presidio Managed Cloud, which is now part of Presidio Concierge. No patents have been issued from these applications yet and the likelihood of receiving patent protection based on these applications is not yet clear. Once issued, a patent generally has a term of 20 years from the date the application for the patent is filed. Seeking patent protection is part of our strategy for competitively differentiating our hybrid cloud solution, but patent protection is not essential to our company as a whole or to our Presidio Managed Cloud or Presidio Concierge business.
Employees
As of June 30, 2018, we had approximately 2,900 full-time employees in 68 locations across the United States. Included in this total is a localized direct sales force of approximately 500 employees as well as a team of over 1,600 engineers. As of June 30, 2018, none of our employees were covered by a collective bargaining agreement.
Corporate History
Known originally as Integrated Solutions, LLC, Presidio was capitalized by an investor group in 2003 to address the need for an elite professional services firm that was focused on providing advanced technology solutions to middle-market businesses. Our early focus was to expand our regional presence and skill set expertise through both organic growth and acquisitions. By 2010, we had completed six acquisitions that complemented our core competencies, helping expand Presidio’s presence to 33 offices in 18 states.
On February 2, 2015, certain investment funds affiliated with or managed by Apollo and its subsidiaries, including Apollo VIII, along with their parallel investment funds (the "Apollo Funds") acquired Presidio Holdings Inc., at which time Presidio Holdings Inc. became a direct wholly-owned subsidiary of the Company. We applied the acquisition method of accounting that created a new basis of accounting for the Company as of that date.
On March 15, 2017, the Company completed an initial public offering (“IPO”) in which the Company issued and sold 18,766,465 shares of common stock, inclusive of 2,099,799 shares issued and sold on March 21, 2017 pursuant to the underwriters’ option to purchase additional shares, at the public offering price of $14.00 per share. The Company received net proceeds of $247.5 million, after deducting underwriting discounts and commissions from the sale of its shares in the IPO.
On November 21, 2017, the Company completed a secondary public offering of 8,000,000 shares of the Company’s common stock by certain funds affiliated with Apollo Global Management, LLC (the “Selling Stockholder”) at a price to the public of $14.25 per share. In addition, the underwriters to such secondary public offering purchased an additional 1,200,000 shares of common stock from the Selling Stockholder. The Company did not sell any shares and did not receive any proceeds from the offering.
Our principal executive office is located at One Penn Plaza, Suite 2832, New York, New York 10119. Our telephone number is (212) 652-5700.
8
Available Information
We maintain an internet website at www.presidio.com. Information contained on our website is not part of this Annual Report on Form 10-K. Stockholders of the Company and the public may access our Annual Reports on Form 10-K, quarterly reports on Form 10-Q, current reports on Form 8-K, and amendments to these reports (if applicable) filed with or furnished to the SEC under the Securities Exchange Act of 1934, as amended, through the "Investor Relations" section of our website. You may also obtain a copy of these reports without charge by sending a written request to Presidio, Inc., One Penn Plaza, Suite 2832, New York, New York 10119, Attention: Corporate Secretary. This information is provided by a third party link to the SEC's online EDGAR database, is free of charge and may be reviewed, downloaded, and printed from our website at any time. Our SEC filings are also available directly from the SEC's website at www.sec.gov which contains reports, proxy and information statements and other information regarding issuers that file electronically. These reports, proxy statements and other information may also be inspected and copied at the SEC's Public Reference Room at 100 F Street, NE, Washington, D.C. 20549. Please call the SEC at 1-800-SEC-0330 for further information on the operation of the Public Reference Room.
We also make available free of charge, through the "Investor Relations" section of our website under Corporate Governance, our Corporate Governance Guidelines, our Code of Business Conduct and Ethics, and the charters of our Audit Committee, Nominating and Corporate Governance Committee, and Compensation Committee of our Board of Directors. The information contained on our website is not being incorporated herein.
9
Item 1A. Risk Factors
Set forth below are certain risk factors that could harm our business, results of operations and financial condition. We could also face additional risks and uncertainties not currently known to the Company or that we currently deem to be immaterial. Any of the following risks, if realized, could materially and adversely affect our business, financial condition or results of operations.
Risks Related to Our Business
General economic conditions could adversely impact technology spending by our clients and put downward pressure on prices, which could adversely impact our business, financial condition or results of operations.
Weak economic conditions generally, sustained uncertainty about global economic conditions, U.S. federal or other government spending cuts or a tightening of credit markets could cause our clients and potential clients to postpone or reduce spending on technology solutions, products or services. If our industry becomes more price-sensitive, these conditions could also result in customers demanding lower prices for our solutions. Any downward pressure on prices could affect our sales growth and profitability, which could adversely impact our business, financial condition or results of operations.
Changes and innovation in the information technology industry may result in reduced demand for our information technology solutions.
Our results of operations are influenced by a variety of factors, including the condition of the information technology industry and shifts in demand for, or availability of, information technology solutions. The information technology industry is characterized by rapid technological change and the frequent introduction of new products, product enhancements and new distribution methods or channels, each of which can decrease demand for current solutions or render them obsolete. In addition, demand for the solutions we sell to our customers could decrease if we are unable to adapt in areas like cloud technology, IaaS, SaaS, PaaS, SDN or other emerging technologies. Cloud offerings may influence our customers to move workloads to cloud providers, which may reduce the procurement of products and solutions from us. Changes in the information technology industry may also negatively impact the demand for our solutions, which could adversely impact our business, financial condition or results of operations.
Our financial performance could be adversely impacted if our federal, state and local government clients decrease their spending on technology products.
We provide IT services to various government agencies, including federal, state and local government entities. For the fiscal year ended June 30, 2018, 10% of our revenue came from sales to state and local governments and 4% of our revenue was derived from sales to the federal government. These sales may be impacted by government spending policies, budget priorities and revenue levels.
While our sales to public sector clients are diversified across various agencies and departments, an across-the-board change in government spending policies, including budget cuts at the federal level, could result in our public sector clients reducing their purchases and terminating their service contracts, which could adversely impact our business, financial condition or results of operations.
Our solutions business depends on our vendor partner relationships and the availability of their products.
Our solutions depend on the resale of products that we purchase from vendor partners, which include OEMs, software publishers and wholesale distributors. Under our agreements with our vendor partners, we are authorized to sell all or some of their products in connection with our end-to-end solutions, such as pre- and post-sales network design, configuration, troubleshooting and the support and sale of complementary products and services. Our authorization with each vendor partner has specific terms and conditions with respect to product return privileges, purchase discounts and vendor partner programs and financing programs. These include purchase rebates, sales volume rebates, purchasing incentives and cooperative advertising reimbursements. However, we do not have any long-term contracts with our vendor partners and our agreements with key vendors may be terminable upon notice by any party. As such, from time to time, vendor partners may limit or terminate our right to sell some or all of their products, or change the terms and conditions under which we obtain their products for integration into our solutions.
We also receive payments and credits from vendors, including consideration under volume incentive programs, shared marketing expense programs and early pay discounts. Our vendor partners may decide to terminate or reduce the benefits under their incentive programs, or change the conditions under which we may obtain such benefits. Any sizable reduction, termination
10
or significant delay in receiving benefits under these programs could adversely impact our business, financial condition or results of operations. If we are unable to timely react to any changes in our vendors’ programs, such as the elimination of funding for some of the activities for which we have been compensated in the past, such changes could adversely impact our business, financial condition or results of operations.
While we purchase from a diverse vendor base, we have significant supplier relationships with our vendor partners Cisco Systems, Inc. (“Cisco”) and Dell Technologies, Inc. (“Dell/EMC”). For the fiscal year ended June 30, 2018, Cisco provided products that made up 64% of our purchases from all manufacturers, while Dell/EMC provided products that constituted 9% of our purchases from all manufacturers. Another significant vendor partner is Palo Alto Networks, Inc., which provided hardware products that generated 2% of our purchases from all manufacturers in the fiscal year ended June 30, 2018. Our portfolio has been heavily concentrated in Cisco products. Though we do not maintain a long-term contractual arrangement with Cisco, historically Cisco has held a leading position in the IT infrastructure market. The loss of, change in business relationship with or change in the behavior, including the timing of fulfillment, of Cisco, any of the other vendors named in this report or any other key vendor partners, or the diminished availability of their products, may impact the timing of our sales or could reduce the supply and increase the cost of the products we sell, eroding our competitive position.
Our Systems Integrator Agreement with Cisco (the “Systems Integrator Agreement”) sets forth the terms and conditions for our purchase and licensing of various products and services from Cisco, serving as the master agreement for all material business transactions with Cisco. The Systems Integrator Agreement sets forth our obligations to maintain certain quality standards in the services we provide our customers and training standards for certain of our personnel in Cisco products, including incentives for our company to maintain high levels of certification in Cisco expertise, which is measured periodically. The Systems Integrator Agreement had an original term of one year and has been regularly extended since its effective date on May 14, 2002, including the most recent extension through August 31, 2019. The Agreement may be terminated by either party without reason by providing the other party with forty-five days’ written notice prior to termination, or by Cisco upon twenty days’ written notice if there are certain changes in control of our Company.
Given the significance of our vendor partners to our business model, any geographic relocation of key distributors used in our purchasing model could increase our cost of working capital, which would have a negative impact on our business, financial condition or results of operations. Similarly, the sale, spin-off or combination of any of our vendor partners and/or of certain of their business units, including a sale or combination with a vendor with whom we do not have an existing relationship, could adversely impact our business, financial condition or results of operations.
Our solutions depend on the innovation and adaptability of our vendor partners, as well as our ability to partner with emerging technology providers.
The technology industry has experienced rapid innovation and the introduction of new hardware, software and services offerings, such as cloud-based solutions. We have been and will expect to continue to be dependent on innovations in hardware, software and services offerings, as well as the acceptance of these products by clients. If we are unable to keep up with changes in technology and new offerings-for example, by providing the appropriate training to our account managers, technology sales specialists and engineers-it could adversely impact our business, financial condition or results of operations.
Because our solutions involve the resale of vendor products, our business depends on the ability of our vendor suppliers to develop and provide competitive hardware, software and other products. If our vendor partners cannot compete effectively against vendors with whom we do not have a supply relationship, our business, financial condition or results of operations could be adversely impacted. Further, we depend on developing and maintaining relationships with new vendors who can provide products and services in emerging areas of technology, such as cloud, security, mobility, data analytics, software-defined networking and the IoT. To the extent that we cannot develop or maintain relationships with vendors who provide desirable hardware, software and other services, it could adversely impact our business, financial condition or results of operations.
Substantial competition could reduce our market share and significantly harm our financial performance.
Our current competition includes large system integrators and resellers, such as Accenture, WWT, Dimension Data and DXC Technology; large value-added resellers, such as CDW Corporation and ePlus; local providers in the five regional markets in which we operate (North, South, Tri-State, West and North Central); manufacturers who sell directly to end users, such as Dell Technologies, HPE and Oracle; boutique solutions providers, such as Optiv, Cognizant Infrastructure Services; and newer born-in-the-cloud channel partners like 2nd Watch and Cloud Technology Partners. Strong performance by these competitors, the increasing number of services providers in the market and rapid innovation in our industry could erode our market share and adversely impact our business, financial condition or results of operations.
11
We expect our competitive landscape to continue to change as new technologies are developed, resulting in increasingly short technology refresh cycles. Innovation could disrupt our business model and create new and stronger competitors. Some of our hardware and software vendor partners sell and could intensify their efforts to sell their products directly to our clients. For example, ERP systems vendors and other major software vendors increasingly sell their procurement and asset management products along with their application suites. Because of their significant installed client base, these ERP vendors may have the opportunity to offer additional products to existing clients. Further, traditional OEMs have increased their services capabilities through mergers and acquisitions with services providers, which could potentially increase competition in the market to provide clients with comprehensive technology solutions. Any of these trends could adversely impact our business, financial condition or results of operations.
Some solutions providers in our industry compete on the basis of price. To the extent that we face increased competition to gain or retain clients, we may be required to reduce prices, increase advertising expenditures or take other actions that could impact our cash flows. If we are forced to reduce prices and in doing so we are unable to attract new clients or sell increased quantities of products, our sales growth and profitably could be negatively affected, which could adversely impact our business, financial condition or results of operations.
Our earnings could be affected if we lose several larger clients.
Generally, our contracts with our clients are nonexclusive agreements that are terminable upon either party’s discretion with 30 days’ notice. Only certain of our client agreements require longer periods of notice (60 days’ to 90 days’ notice). As of June 30, 2018, we have approximately 8,000 middle-market, large, and government clients across a diverse range of industries. In our fiscal year ended June 30, 2018, 21% of our revenue was attributable to our top 25 clients (measured by revenue generated by client). Further, we do not have guaranteed purchasing volume commitments from our clients. As a result, the loss of several of our larger clients, the failure of such clients to pay amounts due to us or a material reduction in purchases made by such clients could adversely impact our business, financial condition or results of operations.
The success of our business depends on the continuing development, maintenance and operation of our information technology systems.
Our success is dependent on the accuracy, proper use and continuing development of our information technology systems, including our business systems and our operational platforms. Our ability to effectively use the information generated by our information technology systems, as well as our success in implementing new systems and upgrades, affects our ability to:
• | conduct business with our clients, including delivering services and solutions; |
• | manage our inventory and accounts receivable; |
• | purchase, sell, ship and invoice our products and services efficiently and on a timely basis; and |
• | maintain our cost-efficient operating model while expanding our business in revenue and in scale. |
Disruption or breaches of security in our information technology systems and the misappropriation of our clients’ data could impair our reputation, expose us to liability and adversely impact our business.
Our information technology systems are vulnerable to disruption by forces outside our control. We have taken steps to protect our information technology systems from a variety of internal and external threats, including computer viruses, network disruption, denial of service, corruption of data, malware, phishing, social engineering, unauthorized access and other malicious attacks, but there can be no guarantee that these steps will be effective. Any disruption to, or infiltration, of our information technology systems could adversely impact our business, financial condition or results of operations. In addition, in order to ensure customer confidence in our solutions and services, we may choose to remediate actual or perceived security concerns by implementing further security measures, which could require us to expend significant resources.
Further, our business involves the storage and transmission of proprietary, sensitive or confidential information. In addition, we operate data centers and other information technology for our clients, which host our clients’ technology infrastructure and may store and transmit business-critical and confidential data on behalf of our clients. In connection with the services we provide our clients, some of our employees and contractors have access to our clients’ confidential data and other proprietary information. We have privacy and data security policies in place that are designed to prevent security breaches, and confidentiality and data security provisions are standard in our client contracts. However, as newer technologies evolve, our security practices and products may be sabotaged or circumvented by third parties, such as hackers and cyberterrorists or even our own employees or contractors, which could result in disruptions to our clients’ businesses, unauthorized procurement and the loss, corruption or unauthorized disclosure or misuse of sensitive corporate information or private personal information. Such breaches in security
12
could damage our reputation and our business, and could also expose us to legal claims, investigations, proceedings and liability and to regulatory penalties under laws that protect the privacy of personal information, any of which could adversely impact our business, financial condition, reputation or results of operations. Additionally, some of the hardware and software products we resell could have defects or otherwise be the subject of security breaches and other attacks. While we maintain insurance coverage that, subject to policy terms and conditions, is designed to address losses or claims that may arise in connection with certain aspects of data and cyber risks, such insurance coverage may be insufficient to cover all losses or all types of claims that may arise in the continually evolving area of data and cyber risk. We would consider the consequences of such attacks to be the responsibility of the respective manufacturers and publishers of such products; however, if such circumstances were to arise, we could be subject to litigation.
Our managed services business requires us to monitor our clients’ devices on their network in varying levels of service. If we have not designed our systems to provide this service accurately or if there is a security breach in our system or the clients’ systems, we may be liable for claims.
Increasing data privacy and information security obligations could also impose additional regulatory pressures on our clients’ businesses and, indirectly, on our operations. In response, some of our clients have sought and may continue to seek, to contractually impose certain strict data privacy and information security obligations on us. Some of our client contracts may not contractually limit our liability for the loss of confidential information. If we are unable to adequately address our clients' concerns, our business and results of operations could suffer. Compliance with new privacy and security laws, requirements and regulations may result in cost increases due to potential systems changes, the development of additional administrative processes and increased enforcement actions, fines and penalties. Any failure or perceived failure to comply or any misappropriation, loss or other unauthorized disclosure of sensitive or confidential information may result in proceedings or actions against us by government or other entities or private lawsuits against us, including class actions, which could adversely impact our business, financial condition, reputation and results of operations.
Our investments in new services and technologies may not be successful.
We have recently begun and continue to invest in new services and technologies, including cloud, security, mobility, data analytics, software-defined networking and IoT. The complexity of these solutions, our learning curve in developing and supporting them and significant competition in the markets for these solutions could make it difficult for us to market and implement these solutions successfully. There is further risk that we will be unable to protect and enforce our rights to use such intellectual property. Additionally, there is a risk that our clients may not adopt these solutions widely, which would prevent us from realizing expected returns on these investments. Even if these solutions are successful in the market, these solutions still rely on third-party hardware and software and our ability to meet stringent service levels; if we are unable to deploy these solutions successfully or profitably, it would adversely impact our business, financial condition or results of operations.
If we infringe on the intellectual property rights of third parties, we may be subject to costly disputes or indemnification obligations that could adversely impact our business, financial condition or results of operations.
We cannot assure you that our activities will not infringe on patents, trademarks or other intellectual property rights owned by others. If we are required to defend ourselves against intellectual property rights claims, we may spend significant time and effort and incur significant litigation costs, regardless of whether such claims have merit. If we are found to have infringed on the patents, trademarks or other intellectual property rights of others, we may also be subject to substantial claims for damages or a requirement to cease the use of such disputed intellectual property, which could have an adverse effect on our operations. Such litigation or claims and the consequences that could follow could distract our management from the ordinary operation of our business and could increase our costs of doing business, resulting in a negative impact on our business, financial condition or results of operations.
Furthermore, third parties may assert infringement claims against our clients for infringement by our products on the intellectual property rights of such third parties. These claims may require us to initiate or defend protracted and costly litigation on behalf of our clients, regardless of the merits of these claims. We also generally extend the indemnification granted by our OEMs to our clients for any such infringement. If any of these claims succeed, we may be forced to pay damages on behalf of our clients or may be required to obtain licenses for the products they use, even though our OEMs may in turn be liable for any such damages. Any infringement on the intellectual property rights of third parties could adversely impact our business, financial condition or results of operations.
13
Our engagements with our clients are based on estimated pricing terms. If our estimates are incorrect, these terms could become unprofitable.
Some of our client contracts for professional services are fixed-price contracts to which we commit before we provide services to these clients. In pricing such fixed-price client contracts, we are required to make estimates and assumptions at the time we enter into these contracts that could differ from actual results. As a result, the profit that is anticipated at a contract’s inception may not be guaranteed. Our estimates reflect our best judgments about the nature of the engagement and our expected costs in providing the contracted services. However, any increased or unexpected costs, or any unanticipated delays in connection with our performance of these engagements—including delays caused by our third-party providers or by factors outside our control—could make these contracts less profitable or unprofitable and could have an adverse impact on our business, financial condition or results of operations.
Failure to comply with the terms of our contracts with our public sector clients, or with applicable laws and regulations, could result in the termination of our contracts, fines or liabilities. Further, changes in government procurement regulations could adversely impact our business.
We provide information technology services to various government agencies, including federal, state and local government entities, as well as international and intergovernmental agencies. Sales to such public sector clients are highly regulated. Any noncompliance with contract provisions, government procurement regulations or other applicable laws or regulations—including, but not limited to, the False Claims Act and the Foreign Corrupt Practices Act—could result in civil, criminal and administrative liability, such as substantial monetary fines or damages, the termination of government contracts or other public sector client contracts and suspension, debarment or ineligibility from doing business with the government and with other clients in the public sector.
Our contracts with our public sector clients are terminable at any time at the convenience of the contracting agency or group purchasing organization (“GPO”). As such, our relationships with public sector clients are susceptible to government budget, procurement and other policies. Our inability to enter into or retain contracts with GPOs could threaten our ability to sell to current and potential clients in those GPOs. Further, the adoption of new or modified procurement regulations and other requirements may increase our compliance costs and reduce our gross margins, which could have a negative effect on our business, financial condition or results of operations.
We also provide services to certain government agencies that require us to have and maintain security clearance at an appropriate level. If an acquisition or any other action we take causes us to lose our security clearance status, or results in our having a lower level of security clearance, we could lose the business of such clients, which could adversely impact our business, financial condition or results of operations.
We rely on third-party companies to perform certain of our obligations to clients, which could impact our business if not performed.
We deliver and manage mission-critical software, systems and network solutions for our clients. We also offer certain services, such as implementation, installation and deployment services, to our clients through various third-party providers who are engaged to perform these services on our behalf. We are also required, as a component of some of our contracts with our OEM partners, to utilize their engineers as part of our solutions. For the fiscal year ended June 30, 2018, 8% of our revenue was attributable to these third-party services. Further, to provide services to our clients outside of the United States, we rely heavily on an international network of preferred sales partners that are generally vetted by our OEM vendor partners. If we or our third-party services providers fail to provide high-quality services to our clients, or if such services result in a disruption of our clients’ businesses, we could be subject to legal claims, proceedings and liability.
As we expand our services and solutions business, we may be exposed to additional operational, regulatory and other risks. For example, we could incur liability for failure to comply with the rules and regulations applicable to the new services and solutions we provide to our clients. Such issues could adversely affect our reputation with our clients, tarnish our brand or render us unable to compete for new work and could adversely impact our business, financial condition or results of operations.
14
We rely on third-party commercial delivery services to provide products and services to our clients, which if not performed could lead to significant disruption to our business.
We also depend heavily on commercial delivery services to provide products and services to our clients. For example, we generally ship hardware products to our clients by FedEx, United Parcel Service and other commercial delivery services and invoice clients for delivery charges. However, our inability to pass future increases in the cost of commercial delivery services to our clients could decrease our profitability. Additionally, strikes, inclement weather, natural disasters or other service interruptions by such shippers could affect our ability to deliver products to our clients in a timely manner and could adversely impact our business, financial condition or results of operations.
Our business depends on our ability to attract and retain talented personnel.
Our success depends on our ability to attract, develop, engage and retain key personnel to manage and grow our business, including our key executive, management, sales, services and technical employees.
For example, as we seek to expand our offerings of value-added services and solutions, our success depends on attracting and retaining highly skilled technology specialists and engineers, for whom the market is extremely competitive. Increasingly, our competitors are requiring their employees to sign Non-Compete and Non-Solicitation agreements as part of their employment, making it more difficult for us to hire talented individuals with experience in our industry. We do not carry any “key man insurance”—that is, an insurance policy that would cover any financial loss that would arise from the death or incapacity of an important member of our business. Our failure to recruit and retain mission-critical employees could adversely impact our business, financial condition or results of operations.
International trade laws and Anti-Corruption regulations and policies may adversely impact our ability to generate revenue from sales outside of the United States.
A small portion of our revenue is derived from our sales outside of the United States, mostly from the non-U.S. activities of our clients based in the United States. Specifically, non-U.S. sales represented approximately 2.5% of our total revenue for the fiscal year ended June 30, 2018 compared to 2.3% for the fiscal year ended June 30, 2017. We are exposed to risk under international trade laws because of our sales derived from countries associated with higher risks of corruption and our use of third-party preferred agents to provide services to our clients outside of the United States. We have implemented a global anti-corruption policy that addresses U.S. laws and regulations governing Anti-Corruption and Anti-Bribery. However, our failure to implement guidance and procedures for specific situations as they arise, as well as inadequate training of our employees on these issues, could result in our inability to comply with international trade laws and regulations.
We also export hardware and software that are subject to certain trade-related U.S. laws and regulations, including the Export Administration Regulations administered by the U.S. Department of Commerce, Bureau of Industry and Security (“BIS”) and various economic sanctions programs administered by the U.S. Treasury’s Office of Foreign Assets Control. Exports and re-exports of such hardware and software to certain countries in which we conduct business may require regulatory licensing or other authorization. Our failure to implement compliance policies and procedures, including those relating to product classification, licensing, and screening, or to adequately train our personnel to understand and comply with applicable regulations, could result in export or sanctions violations, which could have an adverse impact on our business, financial condition or results of operations.
The results of the United Kingdom’s referendum on withdrawal from the European Union may have a negative effect on global economic conditions, financial markets and our business.
In June 2016, a majority of voters in the United Kingdom elected to withdraw from the European Union in a national referendum. The referendum was advisory and the terms of any withdrawal are subject to a negotiation period that could last years after the government of the United Kingdom formally initiates a withdrawal process. Nevertheless, the referendum has created significant uncertainty about the future relationship between the United Kingdom and the European Union, including with respect to the laws and regulations that will apply as the United Kingdom determines which European Union laws to replace or replicate in the event of a withdrawal. The referendum has also given rise to calls for the governments of other European Union member states to consider withdrawal. These developments, or the perception that any of them could occur, have had and may continue to have a material adverse effect on global economic conditions and the stability of global financial markets and may significantly reduce global market liquidity and restrict the ability of key market participants to operate in certain financial markets. Any of these factors could depress economic activity and restrict our access to capital, which could have a material adverse impact on our business, financial condition and results of operations.
15
Interruption of the flow of hardware products from suppliers could disrupt our supply chain.
We rely on hardware products that our vendor partners manufacture or purchase outside of the United States, primarily in Asia. Political, social or economic instability in Asia, or in other regions in which our vendor partners purchase or manufacture the products that we resell, could cause disruptions in trade, which would affect our supply chain. Other events that could disrupt our supply chain include:
• | the imposition of additional trade law provisions or regulations; |
• | the imposition of additional duties, tariffs and other charges on imports and exports; |
• | foreign currency fluctuations; |
• | natural disasters affecting any of our suppliers’ facilities; |
• | restrictions on the transfer of funds; |
• | dependence on an international supply chain; |
• | the financial instability or bankruptcy of manufacturers; |
• | significant labor disputes, such as strikes; and |
• | product or component shortages or significant failures. |
We cannot predict whether the countries in which our products are purchased or manufactured, or may be purchased or manufactured in the future, will be subject to new or additional trade restrictions or sanctions imposed by the U.S. or other governments. Trade restrictions—including new or increased tariffs, quotas, embargoes, sanctions, safeguards and customs restrictions—against the products we sell, as well as foreign labor strikes, work stoppages or boycotts, could increase the cost or reduce the supply of the product available to us.
We could experience, and have experienced in the past, periodic product shortages from our vendor partners if they fail to adequately project demand for certain products. Because we do not maintain hardware inventory that is not supported by executed client orders, except for insignificant spares, we depend on our vendor partners’ continued supply so we can fulfill our clients’ orders on a timely basis. A substantial disruption to our supply chain could adversely impact our business, financial condition or results of operations.
We are exposed to accounts receivables and inventory risks.
We extend credit to our clients for a significant portion of our revenue, typically on 30-day payment terms. As a result, we are subject to the risk that our clients will not pay for the products they have purchased or that they will pay at a slower rate than we have historically experienced. This risk is particularly pronounced during periods of economic downturn or uncertainty or, in the case of our public sector clients, due to governmental budget constraints. Though we devote resources to collections operations and have a low write-off rate, any failure or delay by our clients in paying for the products they have purchased could adversely impact our business, financial condition or results of operations.
Any of our clients may experience a downturn in its business that may weaken its business, financial condition or results of operations. As a result, a client may fail to make payments when due, become insolvent or declare bankruptcy. Any client bankruptcy or insolvency, or the failure of any client to make payments when due, could result in losses. A client bankruptcy would delay or preclude full collection of amounts owed to us.
In certain cases, we are able to return unused equipment to our vendors. We primarily acquire inventory once we have an agreement executed with a client and with the exception of an immaterial level of spare parts inventory, we do not generally maintain inventory that is not already designated for sale. However, we may be exposed to the risk that our inventory cannot be returned to the vendor in situations where a client cancels an executed order.
We seek to minimize our inventory exposure through a variety of inventory management procedures and policies, including buying limits and restrictions on inventory purchase authority. However, if we were unable to successfully maintain our inventory management procedures and policies, or if there are unforeseen product developments that result in the more rapid obsolescence of our inventory, our inventory risks could increase, which could adversely impact our business, financial condition or results of operations.
16
We may not be able to realize our entire investment in the equipment we lease.
We are a lessor of technology equipment and the realization of equipment values (residual values) during the life and predominantly at the end of the term of a lease is an important element in our leasing business. At the inception of each lease, we record a residual value for the leased equipment based on our estimate of the value of the equipment at the expected disposition date.
If the market value of leased equipment decreases at a faster rate than we projected, whether due to rapid technological or economic obsolescence, unusual wear and tear on the equipment, excessive use of the equipment or other factors, this would adversely affect the recoverability of the estimated residual values of such equipment. Further, certain equipment residual values are dependent on the vendor’s warranties, reputation and other factors, including market liquidity. We also may not realize the full market value of equipment if we are required to sell it to meet liquidity needs or for other reasons outside of the ordinary course of business. Consequently, there can be no assurance that we will realize our estimated residual values for equipment, which failure to realize such values could adversely impact our business, financial condition or results of operations.
We may not realize the full amount of our backlog, which could have a material adverse impact on our business, financial condition or results of operations.
As of June 30, 2018, our backlog orders believed to be firm was approximately $582 million, compared to approximately $500 million as of June 30, 2017. There can be no assurance that our backlog will result in actual revenue in any particular period, or at all, or that any contract included in our backlog will be profitable. This is because the actual realization and timing of any of this revenue is subject to various contingencies, many of which are beyond our control. The actual realization of revenue on engagements included in backlog may never occur or may change because an order could be reduced, modified or terminated early. Several of our orders involve the delivery of services that can be up to five years in duration and may be subject to delays in performance that are beyond our control. Due to these uncertainties, we estimate that approximately $144 million of our backlog orders believed to be firm as of June 30, 2018 will not be fulfilled within the current fiscal year. Our failure to realize the full amount of our backlog could adversely impact our business, financial condition or results of operations.
Our acquisitions may not achieve expectations, which could affect our profitability.
We have acquired, and may acquire, companies and operations that extend or complement our existing business. These transactions involve numerous business risks, including finding suitable transaction partners, the diversion of management’s attention from other business concerns, extending our product or service offerings into areas in which we have limited experience, entering into new geographic markets, the potential loss of key employees or business relationships and the integration of acquired businesses, any of which could adversely impact our business, financial condition or results of operations.
Furthermore, failure to successfully integrate acquired operations may adversely affect our cost structure, reducing our gross margins and return on investment. In addition, we may acquire entities with unknown liabilities. Should an unknown liability emerge following an acquisition, it could adversely impact our business, financial condition or results of operations.
As with most acquisitions in our industry, we paid a premium to book value in our prior acquisitions and the portion of the purchase price paid in excess of the fair value of the assets acquired has been recorded on our books as goodwill or intangible assets. We may be required to account for similar premiums paid on future acquisitions in the same manner. Under existing U.S. GAAP, goodwill is not amortized and is carried on our books at its original value, subject to annual review and evaluation for impairment, whereas finite-lived intangible assets are amortized over the life of the asset. If market and economic conditions (including business valuation levels and trends) deteriorate, we may have to record impairment charges to the extent the carrying value of our goodwill exceeds the fair value of our overall business. Additionally, if existing U.S. GAAP were modified to require amortization, such impairment charges or amortization expense could adversely affect our net earnings during the period in which the charge or expense is recorded. As of June 30, 2018, we had goodwill and other intangible assets related to our prior acquisitions of $1,504.0 million. Any failure to successfully integrate our acquisitions or a change to existing U.S. GAAP goodwill and intangible asset accounting policies could adversely impact our business, financial condition or results of operations.
Our operating results could fluctuate significantly in the future because of industry factors and other factors outside of our control.
Our operating results are dependent on a variety of industry factors, including the condition of the technology industry in general, shifts in demand and pricing for hardware, software and services and the introduction of new products or upgrades.
17
Our operating results are also dependent on our level of gross profit as a percentage of revenue. Our gross profit percentage fluctuates due to numerous factors, some of which may be outside of our control. These include general macroeconomic conditions; pricing pressures; changes in product costs from our vendor partners; the availability of price protection, purchase discounts and incentive programs from our vendor partners; changes in product, order size and client mix; the risk that certain items in our inventory become obsolete; increases in delivery costs that we cannot pass on to clients; and general market and competitive conditions.
Our results may be affected by slight variances as a result of seasonality we may experience across our business. This seasonality is typically driven by budget cycles and spending patterns across our diverse client base. For example, our local, state and federal government clients operate on an annual budget cycle, most often on the basis of a fiscal year that begins October 1. Our private sector clients operate on an annual budget cycle, most often on the basis of a fiscal year that begins January 1. It is not uncommon to experience a higher level of contract awards, funding actions and overall government and private demand for services in the final months and weeks of the government and private fiscal years, respectively. Consequently, our revenue in the first and second quarters of our fiscal year may be greater than the revenue recognized in the third and fourth quarters of our fiscal year.
Furthermore, due to general economic conditions, we may not only experience difficulty in collecting our receivables on a timely basis but also may experience a loss due to a client’s inability to pay. In addition, certain economic factors may impact the valuation of certain investments we may make in other businesses.
As a result of these and other factors, quarterly period-to-period comparisons of our financial results are not necessarily meaningful and should not be relied upon as an indication of future performance.
In addition, our cost structure is based in part on anticipated sales and gross margins. Therefore, we may not be able to adjust our cost structure quickly enough to compensate for any unexpected sales or gross margin shortfall. Any such inability could adversely impact our business, financial condition or results of operations.
We are exposed to risks from legal proceedings and audits.
We are party to various legal proceedings that arise in the ordinary course of our business, which include commercial, employment, tort and other litigation.
We are also subject to intellectual property infringement claims in the ordinary course of our business, which come in the form of cease-and-desist letters, licensing inquiries, lawsuits and other demands. These claims may arise either from the products and services we sell or the business systems and products we use to sell the products and services. In our industry, such claims have become more frequent with the increasing complexity of technological products. In fact, many of these assertions are brought by Non-Practicing entities, whose principal business model is to secure patent licensing revenue.
Because of our significant sales to public sector clients, we are also subject to audits by federal, state and local authorities. From time to time, we receive subpoenas and other requests for information from various government authorities. We may also be subject to audits by various vendor partners and large clients, including government agencies, pursuant to certain purchase and sale agreements. Further, we may be required to indemnify our vendor partners and our clients from claims brought by third parties under certain agreements.
Current and future litigation, infringement claims, governmental proceedings, audits or indemnification claims may result in substantial costs and expenses and regardless of the outcome, significantly divert the attention of our management, which could adversely impact our business, financial condition or results of operations.
Changes in accounting rules could adversely affect our future financial results.
We prepare our financial statements in conformity with U.S. GAAP. These accounting principles are subject to interpretation by the Financial Accounting Standards Board, the Public Company Accounting Oversight Board, the Securities and Exchange Commission, the American Institute of Certified Public Accountants and various other bodies formed to interpret and create appropriate accounting policies. Products and services and the manner in which they are bundled, are technologically complex and the characterization of these products and services require judgment to apply revenue recognition policies. Any mischaracterization of these products and services could result in misapplication of revenue recognition policies. Future periodic assessments required by current or new accounting standards may result in noncash changes and/or changes in presentation or disclosure. In addition, any change in accounting standards may influence our clients’ decision to purchase from us or to finance transactions with us, which could adversely impact our business, financial condition or results of operations.
18
The impact of recent U.S. tax reform is uncertain.
New U.S. federal tax legislation (commonly referred to as the “Tax Cuts and Jobs Act” or “TCJA”) was enacted in December 2017. This legislation made significant changes to the U.S. Internal Revenue Code, many of which are highly complex and may require interpretations and implementing regulations. As a result, we may incur meaningful expenses (including professional fees) as the new legislation is implemented. The expected impact of certain aspects of the legislation is unclear and subject to change, and could adversely impact our business, financial condition or results of operations.
Increased costs of labor and employee health and welfare benefits may adversely impact our results of operations.
Given our large number of employees, labor-related costs represent a significant portion of our expenses. Salaries, wages, benefits, commissions and other labor compensation costs (not including bonus and payroll tax) for our full-time employees amounted to $403 million, which represented approximately 69% of our selling, general and administrative expenses and approximately 6% of our cost of sales for the fiscal year ended June 30, 2018. An increase in labor costs (for example, as a result of increased competition for skilled labor) or employee benefit costs (such as health care costs or otherwise) could adversely impact our business, financial condition or results of operations.
Our future results will depend on our ability to continue to focus our resources, maintain our business structure and manage costs effectively.
We are continually implementing productivity measures and focusing on measures intended to further improve cost efficiency. We may be unable to realize all expected cost savings in connection with these efforts within the expected time frame, or at all, and we may incur additional and/or unexpected costs to realize them. Further, we may not be able to sustain any achieved savings in the future. Future results will depend on the success of these efforts.
Under our contracts, should we be unable to control costs, we may incur losses, which could decrease our operating margins and significantly reduce or eliminate our profits. As our industry becomes more price-sensitive, our future profitability will depend on our ability to manage costs or increase productivity. An inability to effectively manage costs will adversely impact our business, financial condition or results of operations.
Any failure in our delivery of high-quality technical support services may adversely affect our relationships with our clients and our financial results.
Our clients depend on our services desk to provide technical support. We may be unable to respond quickly enough to accommodate short-term increases in client demand for support services. Increased client demand for these services, without corresponding revenue, could increase costs and adversely affect our operating results. In the same vein, any failure to maintain high-quality technical support, or a market perception that we do not maintain high-quality support, could adversely impact our reputation and our business, financial condition or results of operations.
We may not meet our growth objectives and strategies, which may impact our competitiveness.
On an ongoing basis, we seek to achieve profitable growth by providing superior solutions to our clients. As we continue to invest in growth opportunities, including our investments in new technologies and capabilities, we may experience unfavorable demand for these services and we may be unable to deploy these solutions successfully or profitably. In addition, we have historically been focused on reducing our costs and may not be able to achieve or maintain targeted cost reductions. Our inability to effectively invest in new growth opportunities or to reduce cost could impact our competitiveness and render it difficult for us to meet our growth objectives and strategies, which could adversely impact our business, financial condition or results of operations.
Ineffective internal controls could impact our business and operating results.
Our internal control over financial reporting may not prevent or detect misstatements because of its inherent limitations, including the possibility of human error, the circumvention or overriding of controls or fraud. Even effective internal controls can provide only reasonable assurance with respect to the preparation and fair presentation of financial statements. If we fail to maintain the adequacy of our internal controls, including any failure to implement required new or improved controls, or if we experience difficulties in their implementation, our business and results of operations could be harmed and we could fail to meet our financial reporting obligations, which could adversely impact our business, financial condition or results of operations.
19
Risks Related to an Investment in Our Common Stock
Apollo and its affiliates currently have control over us, including the ability to elect all of our directors and prevent any transaction that requires approval of our Board of Directors or our stockholders and may also pursue corporate opportunities independent of us that could present conflicts with our and our stockholders’ interests.
As of June 30, 2018, Aegis LP holds approximately 62% of our common stock. As a result, through Aegis LP and Apollo VIII, Apollo indirectly has the power to elect all of our directors. Therefore, Apollo effectively has the ability to prevent any transaction that requires the approval of our Board of Directors or our stockholders, including the approval of significant corporate transactions, such as mergers and the sale of substantially all of our assets. Thus, Apollo is able to significantly influence or effectively control our decisions.
In addition, the stockholders’ agreement with Aegis LP that we entered into in connection with our IPO provides that, except as otherwise required by applicable law, if Aegis LP, Apollo VIII or other Apollo Funds hold (a) at least 50% of our outstanding common stock, they will have the right to designate up to five nominees to our Board of Directors, (b) at least 30% but less than 50% of our outstanding common stock, they will have the right to designate up to four nominees to our Board of Directors, (c) at least 20% but less than 30% of our outstanding common stock, they will have the right to designate up to three nominees to our Board of Directors and (d) at least 10% but less than 20% of our outstanding common stock, they will have the right to designate two nominees to our Board of Directors. The agreement provides that if the size of our Board of Directors is increased or decreased at any time, the nomination rights of the Apollo Funds will be proportionately increased or decreased, respectively, rounded up to the nearest whole number.
The interests of Apollo could conflict with or differ from the interests of other holders of our common stock. For example, the concentration of ownership held by the Aegis LP could delay, defer or prevent a change of control of the Company or impede a merger, takeover or other business combination that a stockholder may otherwise view favorably. In addition, a sale of a substantial number of shares of stock in the future by Aegis LP or other Apollo Funds could cause our stock price to decline.
Additionally, the group of (A) Apollo, (B) the Apollo Funds, (C) any other investment fund or other collective investment vehicle affiliated with or managed by affiliates of Apollo or whose general partner or managing member is owned, directly or indirectly, by Apollo and (D) any affiliate of the foregoing (in each case, other than the Company and its subsidiaries) (collectively, the “Apollo Group”) is in the business of making or advising on investments in companies and holds (and may from time to time in the future acquire) interests in or provides advice to businesses that directly or indirectly compete with certain portions of our business or are suppliers or customers of ours. The Apollo Group may also pursue acquisitions that may be complementary to our business and, as a result, those acquisition opportunities may not be available to us.
Our certificate of incorporation provides that no officer or director of the Company who is also an officer, director, employee, managing director or other affiliate of any member of the Apollo Group will be liable to us or our stockholders for breach of any fiduciary duty by reason of the fact that any such individual pursues or acquires a corporate opportunity for its own account or the account of an affiliate, as applicable, instead of us, directs a corporate opportunity to any other person, instead of us or does not communicate information regarding a corporate opportunity to us.
So long as the Apollo Funds continue to beneficially own a significant amount of our equity, even if such amount is less than 50%, the Apollo Funds may continue to be able to strongly influence or effectively control our decisions.
The foregoing and other issues related to the Apollo Funds’ control of any of the foregoing may adversely impact prevailing market prices for our common stock.
The price of our common stock may fluctuate significantly and you could lose all or part of your investment.
Volatility in the market price of our common stock may prevent you from being able to sell your shares of common stock at or above the price you paid for them. In addition to the risks described in this “Risk Factors” section, the market price for our common stock could fluctuate significantly for various reasons, including:
• | our operating and financial performance and prospects; |
• | our quarterly or annual earnings or those of other companies in our industry; |
• | changes in earnings estimates or recommendations by securities analysts, if any, or termination of coverage of our common stock by securities analysts; |
• | our failure to meet estimates or forecasts made by securities analysts, if any; |
20
• | conditions that impact demand for our products and services; |
• | future announcements concerning our business or our competitors’ businesses; |
• | the public’s reaction to our press releases, other public announcements and filings with the SEC; |
• | market and industry perception of our success, or lack thereof, in pursuing our growth strategy; |
• | strategic actions by us or our competitors, such as acquisitions or restructurings; |
• | changes in government and environmental regulation; |
• | changes in accounting standards, policies, guidance, interpretations or principles; |
• | arrival and departure of key personnel; |
• | the number of our publicly traded shares; |
• | sales of common stock by us, the Apollo Funds, members of our management team or any other party; |
• | adverse resolution of new or pending litigation against us; |
• | changes in general market, economic and political conditions in the United States and global economies or financial markets, including those resulting from natural disasters, terrorist attacks, acts of war and responses to such events; and |
• | material weakness in our internal controls over financial reporting. |
In addition, in recent years, the stock market has experienced significant price and volume fluctuations. This volatility has had a significant impact on the market price of securities issued by many companies. The changes frequently appear to occur without regard to the operating performance of the affected companies. Hence, the price of our common stock could fluctuate based upon factors that have little or nothing to do with the Company and these fluctuations may adversely impact prevailing market prices for our common stock.
We are a “controlled company” within the meaning of applicable NASDAQ rules and, as a result, qualify for and rely on, exemptions from certain corporate governance requirements.
Through Aegis LP and Apollo VIII, Apollo controls a majority of our voting common stock. As a result, we are a “controlled company” within the meaning of the NASDAQ corporate governance standards. Under the NASDAQ rules, a company of which more than 50% of the voting power for the election of directors is held by an individual, group or another company is a “controlled company” and may elect not to comply with certain the NASDAQ corporate governance requirements, including the requirements:
• | that a majority of the Board of Directors consists of independent directors, as defined under the rules of the NASDAQ; |
• | that we have a compensation committee that is composed entirely of independent directors with a written charter addressing the committee’s purpose and responsibilities; and |
• | that we have a nominating and governance committee composed entirely of independent directors with a written charter addressing the committee’s purpose and responsibilities. |
Accordingly, you will not have the same protections afforded to stockholders of companies that are subject to such corporate governance requirements of the NASDAQ.
The foregoing and other issues related to the Apollo Funds’ control of any of the foregoing may adversely impact prevailing market prices for our common stock.
Our ability to pay regular dividends to our stockholders is subject to the discretion of our Board of Directors and may be limited by our agreements with third parties, our holding company structure and applicable provisions of Delaware law. If we do not pay dividends you may not receive funds without selling your common stock.
Subject to certain conditions and limitations, we expect to pay cash dividends to the holders of our Common Stock on a quarterly basis. Any declaration and payment of future dividends to holders of our common stock may be limited by restrictive covenants of our debt agreements, will be at the sole discretion of our Board of Directors, will be subject to the applicable provisions of Delaware law and will otherwise depend on many factors, including our financial condition, earnings, capital requirements, level of indebtedness, statutory and contractual restrictions applying to the payment of dividends and other considerations that our Board of Directors deems relevant.
The terms of our senior credit facility may restrict our ability to pay cash dividends on our common stock. Our debt instruments contain covenants that restrict our ability to pay dividends on our common stock, as well as the ability of our subsidiaries to pay dividends to us. Furthermore, we are permitted under the terms of our debt instruments to incur additional indebtedness, which may restrict or prevent us from paying dividends on our common stock. Agreements governing any future indebtedness,
21
in addition to those governing our current indebtedness, may not permit us to pay dividends on our common stock. Any of the foregoing may adversely impact prevailing market prices for our common stock.
We are a holding company and we conduct all of our operations through our subsidiaries. As a result, we rely on our subsidiaries for dividends and other payments to generate the funds necessary to meet our financial obligations and to pay any dividends with respect to our common stock. Our ability to pay dividends will be subject to the applicable provisions of Delaware law that may limit the amount of funds available for distribution to our stockholders. In addition, each of the companies in the corporate chain must manage its assets, liabilities and working capital in order to meet all of its cash obligations, including the payment of dividends or distributions.
Dividend payments are not mandatory or guaranteed; there can be no assurance that we will continue to pay a dividend in the future.
Future sales or the possibility of future sales of a substantial amount of our common stock may depress the price of shares of our common stock.
Future sales or the availability for sale of substantial amounts of our common stock in the public market could adversely affect the prevailing market price of our common stock and could impair our ability to raise capital through future sales of equity securities.
As of June 30, 2018, there were 92,853,983 shares of our common stock outstanding. This number includes 18,766,465 that were which were sold in our IPO and 9,200,000 shares that were sold in the November 2017 secondary offering and are freely transferable without restriction or further registration under the Securities Act of 1933, as amended (the “Securities Act”). Of the remaining 64,887,518 shares of our common stock outstanding, Aegis LP holds 57,800,000 shares representing approximately 62% of our outstanding shares. The shares owned by Aegis LP and certain of our executive officers may be sold pursuant to a prospectus supplement to the Prospectus included as part of the Registration of Form S-3 filed by the Company on April 26, 2018. Furthermore, shares held by our directors and our executive officers are eligible for resale subject to applicable volume and other restrictions under Rule 144 or pursuant to another applicable exemption under the Securities Act.
The Company and Aegis LP, the Apollo Fund that holds most of our common stock, and certain of our employees who invested in the Company in connection with its acquisition by the Apollo Funds on February 2, 2015 are parties to a securityholders agreement (the “Amended Management Stockholders Agreement”). Pursuant to the Amended Management Stockholders Agreement, Aegis LP and certain of its affiliates have certain demand registration rights for shares of our common stock held by them. In addition, under the Amended Management Stockholders Agreement, Aegis LP, certain of its affiliates and certain owners of our common stock who are employed by or serve as consultants to or directors of our Company or any of its affiliates (the “Management Holders”) have piggyback and other registration rights with respect to shares of our common stock held by them. Furthermore, under the Amended Management Stockholders Agreement, we have agreed to indemnify (A) each party to the Amended Management Stockholders Agreement and their respective officers, directors, employees, representatives and each person who controls such party, (B) Aegis LP and its officers, managers, employees, representatives and affiliates and (C) any portfolio company of the Apollo Group against losses, claims, damages, liabilities and expenses caused by any untrue or alleged untrue statement of a material fact contained in any registration statement or prospectus or any omission or alleged omission to state therein a material fact required to be stated therein or necessary to make the statements therein not misleading, except insofar as the same may be caused by or contained in any information furnished in writing to our Company by such party set forth in (A), (B) or (C) above for use therein.
We also may issue shares of our common stock or other securities from time to time as consideration for future acquisitions and investments. If any such acquisition or investment is significant, the number of shares of our common stock, or the number or aggregate principal amount, as the case may be, of other securities that we may issue may in turn be substantial. We may also grant registration rights covering those shares of our common stock or other securities in connection with any such acquisitions and investments.
We cannot predict the size of future issuances of our common stock or the effect, if any, that future issuances and sales of our common stock will have on the market price of our common stock. Sales of substantial amounts of our common stock (including shares of our common stock issued in connection with an acquisition) or the exercising of any registration rights, or the perception that such sales or such exercising of registration rights could occur, may adversely affect prevailing market prices for shares of our common stock. Any of the foregoing may adversely impact prevailing market prices for our common stock.
We filed a registration statement on Form S-8 under the Securities Act registering shares under the Presidio, Inc. 2017 Long-Term Incentive Plan, the Presidio, Inc. Amended and Restated 2015 Long-Term Incentive Plan and the Presidio, Inc.
22
Employee Stock Purchase Plan. Subject to the terms of the awards pursuant to which shares are granted under the incentive plans and except for shares held by affiliates who will be subject to the resale restrictions described above, the shares issuable pursuant to our incentive plans will be available for sale in the public market.
Delaware law and our organizational documents may impede or discourage a takeover, which could deprive our investors of the opportunity to receive a premium for their shares.
We are a Delaware corporation and the antitakeover provisions of Delaware law impose various impediments to the ability of a third party to acquire control of us, even if a change of control would be beneficial to our existing stockholders. In addition, provisions of our certificate of incorporation and bylaws may make it more difficult for, or prevent a third party from, acquiring control of us without the approval of our Board of Directors. Among other things, these provisions:
• | classify our Board of Directors so that only some of our directors are elected each year; |
• | do not permit cumulative voting in the election of directors, which would otherwise allow less than a majority of stockholders to elect director candidates; |
• | delegate the sole power of a majority of the Board of Directors to fix the number of directors; |
• | provide the power of our Board of Directors to fill any vacancy on our board, whether such vacancy occurs as a result of an increase in the number of directors or otherwise; |
• | authorize the issuance of “blank check” preferred stock without any need for action by stockholders; |
• | impose limitations on the ability of our stockholders to call special meetings and act by written consent; and |
• | establish advance notice requirements for nominations for election to our Board of Directors or for proposing matters that can be acted on by stockholders at stockholders’ meetings. |
Additionally, Section 203 of the Delaware General Corporation Law (the “DGCL”) prohibits a publicly held Delaware corporation from engaging in a business combination with an interested stockholder, generally a person, which together with any “interested” stockholder, or within the last three years has owned, 15% of our voting stock, for a period of which such person became an interested stockholder, unless the business combination is approved in a prescribed manner.
We have elected not to opt out of Section 203 of the DGCL. We have included a provision in our certificate of incorporation that exempts us from the provisions of the DGCL with respect to combinations between any member of the Apollo Group (including any portfolio company thereof), on the one hand, and us, on the other.
The foregoing factors, as well as the significant common stock ownership by Aegis LP could impede a merger, takeover or other business combination or discourage a potential investor from making a tender offer for our common stock, which, under certain circumstances, may adversely impact prevailing market prices for our common stock.
Our certificate of incorporation provides that the Court of Chancery of the State of Delaware will be the sole and exclusive forum for substantially all disputes between us and our stockholders, which could limit our stockholders’ ability to obtain a favorable judicial forum for disputes with us or our directors, officers or employees.
Our certificate of incorporation provides that, unless we consent in writing to the selection of an alternative forum, the Court of Chancery of the State of Delaware is the sole and exclusive forum for (a) any derivative action or proceeding brought on our behalf; (b) any action asserting a claim for or based on a breach of a fiduciary duty owed by any of our current or former directors or officers or other employees of the Company to the Company or to the Company’s stockholders, including a claim alleging the aiding and abetting of such a breach of fiduciary duty; (c) any action asserting a claim against the Company or any of our current or former directors, officers or other employees arising pursuant to any provision of the DGCL or our certificate of incorporation and bylaws; (d) any action asserting a claim related to or involving the Company that is governed by the internal affairs doctrine; or (e) any action asserting an “internal corporate claim” as that term is defined in Section 115 of the DGCL. The choice of forum provision may limit a stockholder’s ability to bring a claim in a judicial forum that it finds favorable for disputes with us or our directors, officers, or other employees, which may discourage such lawsuits against us and our directors, officers and other employees. Alternatively, if a court were to find the choice of forum provision contained in our certificate of incorporation to be inapplicable or unenforceable in an action, we may incur additional costs associated with resolving such action in other jurisdictions, which could adversely impact our business, financial condition or results of operations.
23
We may issue shares of preferred stock in the future, which could make it difficult for another company to acquire us or could otherwise adversely affect holders of our common stock, which could depress the price of our common stock.
Our certificate of incorporation authorizes us to issue one or more series of preferred stock. Our Board of Directors has the authority to determine the preferences, limitations and relative rights of shares of preferred stock and to fix the number of shares constituting any series and the designation of such series, without any further vote or action by our stockholders. Our preferred stock could be issued with voting, liquidation, dividend and other rights superior to the rights of our common stock. The potential issuance of preferred stock may delay or prevent a change in control of us, discouraging bids for our common stock at a premium to the market price and may adversely impact prevailing market prices for our common stock and the voting and other rights of the holders of shares of our common stock.
We are a holding company and rely on dividends and other payments, advances and transfers of funds from our subsidiaries to meet our obligations.
We are a holding company and we conduct all of our operations through our subsidiaries. As a result, we rely on our subsidiaries for dividends and other payments to generate the funds necessary to meet our financial obligations and to pay any dividends with respect to our common stock. The ability of our subsidiaries to pay dividends or to make other payments or distributions to us depends substantially on their respective operating results and is subject to restrictions under, among other things, the laws of their jurisdiction of organization, agreements of those subsidiaries, the terms of our financing arrangements and the terms of any future financing arrangements of our subsidiaries.
Fulfilling our obligations incident to being a public company, including with respect to the requirements of and related rules under the Sarbanes-Oxley Act of 2002 and the Dodd-Frank Act, is expensive and time-consuming and any delays or difficulties in satisfying these obligations could have a material adverse effect on our future results of operations and our stock price.
We are subject to reporting, accounting and corporate governance requirements of the NASDAQ, the Securities Exchange Act of 1934, as amended, the Sarbanes-Oxley Act and Dodd-Frank Wall Street Reform and Consumer Protection Act (“Dodd-Frank”). The Sarbanes-Oxley Act requires that we maintain effective disclosure controls and procedures and internal control for financial reporting. Under Section 404 of the Sarbanes-Oxley Act and pursuant to the terms therein, our independent public accountants auditing our financial statements must attest to the effectiveness of our internal control over financial reporting. To continue to maintain the effectiveness of our disclosure controls and procedures and internal control over financial reporting, significant resources and management oversight are required. To comply with the requirements of being a public company, we may need to undertake various actions, such as implementing new internal controls and procedures and hiring additional accounting or internal audit staff. In addition, we may identify control deficiencies which could result in a material weakness or significant deficiency. Furthermore, if we are unable to conclude that our disclosure controls and procedures and internal control over financial reporting are effective, or if our independent public accounting firm is unable to provide us with an unqualified report as to management’s assessment of the effectiveness of our internal control over financial reporting in future years, investors may lose confidence in our financial reports and our stock price may decline.
In addition, Dodd-Frank, which amended the Sarbanes-Oxley Act and other federal laws, has created uncertainty for public companies and we cannot predict with any certainty the requirements of the regulations that will ultimately be adopted under Dodd-Frank or how such regulations will affect the cost of compliance for a company with publicly traded common stock. There is likely to be continuing uncertainty regarding compliance matters because the application of these laws and regulations, which are subject to varying interpretations, may evolve over time as new guidance is provided by regulatory and governing bodies. We intend to invest resources to comply with these evolving laws and regulations, which may result in increased general and administrative expenses and divert management’s time and attention from other business concerns. Furthermore, if our compliance efforts differ from the activities that regulatory and governing bodies expect or intend due to ambiguities related to interpretation or practice, we may face legal proceedings initiated by such regulatory or governing bodies and our business may be harmed. In addition, new rules and regulations may make it more difficult for us to attract and retain qualified directors and officers and may make it more expensive for us to obtain director and officer liability insurance.
If securities analysts do not publish research or reports about our company, or if they publish unfavorable commentary about us or our industry or downgrade our common stock, the price of our common stock could decline.
The trading market for our common stock depends in part on the research and reports that third-party securities analysts publish about our company and our industry. One or more analysts could downgrade our common stock or issue other negative commentary about our company or our industry. Alternatively, if one or more of these analysts cease coverage of our company, we could lose visibility in the market. As a result of one or more of these factors, the trading price of our common stock could decline.
24
Risks Related to Our Indebtedness
Our substantial indebtedness could impair our financial flexibility, competitive position and financial condition.
We have a substantial amount of indebtedness and other obligations. As of June 30, 2018 we had $686.6 million in aggregate principal amount of total debt outstanding, comprised solely of term loan debt under our February 2015 Credit Agreement (without giving effect to undrawn letters of credit), and no obligations owed under our $250.0 million accounts receivable securitization facility.
Our substantial indebtedness could have important consequences. For example, it could:
• | limit our ability to obtain additional financing in the future for working capital, capital expenditures and acquisitions; |
• | make it more difficult for us to satisfy our obligations under the terms of our financing arrangements; |
• | make it more difficult to comply with the obligations of our debt instruments, including restrictive covenants and borrowing conditions, the failure of which could result in an event of default under the agreements governing our other indebtedness; |
• | limit our ability to refinance our indebtedness on terms acceptable to us or at all; |
• | limit our flexibility to plan for and to adjust to changing business and market conditions in the industry in which we operate and increase our vulnerability to general adverse economic and industry conditions; |
• | require us to dedicate a substantial portion of our cash flow from operations to make interest and principal payments on our debt, thereby limiting the availability of our cash flow to fund future investments, capital expenditures, working capital, business activities, acquisitions and other general corporate requirements; |
• | limit our ability to obtain additional financing for working capital and capital expenditures to fund growth or for general corporate purposes, even when necessary to maintain adequate liquidity, particularly if any ratings assigned to our debt securities by rating organizations were revised downward; |
• | subject us to higher levels of indebtedness than our competitors, which may cause a competitive disadvantage and may reduce our flexibility in responding to increased competition; and |
• | expose us to the risk of increased interest rates, as certain of our borrowings, including borrowings under our Credit Agreement and our accounts receivable securitization facility, are at variable rates of interest. |
In addition, the terms of the agreements governing our indebtedness contain restrictive covenants that limit our ability to engage in activities that may be in our long-term best interests. Our failure to comply with those covenants could result in an event of default, which, if not cured or waived, could result in the acceleration of our debts. The occurrence of any one of these events could adversely impact our business, financial condition or results of operations, as well as our prospects or ability to satisfy our debt obligations.
In addition to the restrictions contained in our indebtedness, the agreements governing our accounts payable - floor plan facility also contain restrictive covenants that may limit our ability to engage in activities that may be in our long-term best interests. Our failure to comply with those covenants could result in the termination of our accounts payable - floor plan facility and the acceleration of our obligations thereunder.
Despite our substantial indebtedness level, we may still be able to incur substantial additional amounts of debt that could further exacerbate the risks associated with our indebtedness.
We and our subsidiaries may be able to incur substantial additional indebtedness in the future. Although the terms of our accounts receivable securitization facility and our Credit Agreement contain restrictions on our and our subsidiaries’ ability to incur additional indebtedness, these restrictions are subject to a number of important qualifications and exceptions and the indebtedness incurred in compliance with these restrictions could be substantial. For example, as of June 30, 2018, we had $50.0 million available for additional borrowing under the revolver of our Credit Agreement (without giving effect to letters of credit) and $248.0 million available under our accounts receivable securitization facility. These restrictions also will not prevent us from incurring obligations that do not constitute indebtedness. We may opportunistically raise debt capital, subject to market and other conditions, to refinance our existing capital structure or for strategic alternatives and general corporate purposes as part of our growth strategy. There can be no assurance that such debt capital will be available to us on a timely basis, at reasonable rates or at all. If new debt is added to our existing debt levels, the related risks that we face would intensify and we may not be able to meet all of our debt obligations.
25
The agreements governing our debt contain, and future financing arrangements may contain, various covenants that limit our ability to take certain actions and require us to meet financial maintenance tests. Failure to comply with these terms could adversely impact our financial condition.
Our financing arrangements, including our Credit Agreement and our accounts receivable securitization facility, contain restrictions, covenants and events of default that, among other things, require us to satisfy certain financial tests and maintain certain financial ratios and restrict our ability to incur additional indebtedness and to refinance our existing indebtedness. Financing arrangements that we enter into in the future could contain similar restrictions and could additionally require us to comply with similar, new or additional financial tests or to maintain similar, new or additional financial ratios. The terms of our existing financing arrangements, financing arrangements that we enter into in the future and any future indebtedness may impose various restrictions and covenants on us that could limit our ability to pay dividends, respond to market conditions, provide for capital investment needs or take advantage of business opportunities because they limit the amount of additional borrowings we may incur. These restrictions include compliance with, or maintenance of, certain financial tests and ratios and may limit or prohibit our ability to, among other things:
• | borrow money or guarantee debt; |
• | create liens; |
• | pay dividends on or redeem or repurchase stock or other securities; |
• | make investments and acquisitions; |
• | enter into or permit to exist contractual limits on the ability of our subsidiaries to pay dividends to us; |
• | enter into new lines of business; |
• | enter into transactions with affiliates; and |
• | sell assets or merge with other companies. |
Various risks, uncertainties and events beyond our control could affect our ability to comply with these restrictions and covenants. Failure to comply with any of the restrictions and covenants in our existing or future financing arrangements could result in a default under those arrangements and under other arrangements containing cross-default provisions.
An event of default would permit lenders to accelerate the maturity of the debt under these arrangements and to foreclose upon any collateral securing the debt. Under such circumstances, we might not have sufficient funds or other resources to satisfy all of our obligations, including our debt obligations. In addition, the limitations imposed by our financing agreements on our ability to incur additional debt and to take other actions might significantly impair our ability to obtain other financing.
To service our indebtedness and other cash needs, we require a significant amount of cash. Our ability to generate cash depends on many factors beyond our control.
Our ability to satisfy our debt obligations and to fund any planned capital expenditures, dividends and other cash needs will depend in part upon the future financial and operating performance of our subsidiaries and upon our ability to renew or refinance borrowings. We cannot assure you that our business will generate cash flow from operations, or that we will be able to draw under our revolving credit facility or otherwise, in an amount sufficient to fund our liquidity needs, including the payment of principal and interest on our indebtedness. Prevailing economic conditions and financial, business, competitive, legislative, regulatory and other factors, many of which are beyond our control, will affect our ability to make these payments.
If we are unable to make payments, refinance our debt or obtain new financing under these circumstances, we may consider other options, including:
• | sales of assets; |
• | sales of equity; |
• | reduction or delay of capital expenditures, strategic acquisitions, investments and alliances; or |
• | negotiations with our lenders to restructure the applicable debt. |
These alternative measures may not be successful and may not permit us to meet our scheduled debt service obligations. Our ability to restructure or refinance our debt will depend on the condition of the capital markets and our financial condition at such time. Any refinancing of our debt could be at higher interest rates and may require us to comply with more onerous covenants, which could further restrict our business operations. In addition, the terms of existing or future debt agreements, including our Credit Agreement and our accounts receivable securitization facility, may restrict us from adopting some of these alternatives. In the absence of sufficient cash flow from operating results and other resources, we could face substantial liquidity problems and could be required to dispose of material assets or operations to meet our debt service and other obligations. We may not be able
26
to consummate those dispositions for fair market value, or at all. Furthermore, any proceeds that we could realize from any such dispositions may not be adequate to meet our debt service obligations then due. Our inability to generate sufficient cash flow to satisfy our debt obligations, or to refinance our indebtedness on commercially reasonable terms or at all, could adversely impact our business, financial condition or results of operation.
Any decline in the ratings of our corporate credit could adversely affect our ability to access capital.
Any decline in the ratings of our corporate credit or any indications from the rating agencies that their ratings on our corporate credit are under surveillance or review with possible negative implications could adversely impact our ability to access capital.
We are subject to fluctuations in interest rates.
Borrowings under our Credit Agreement and our accounts receivable securitization facility are subject to variable rates of interest and expose us to interest rate risk. For example, assuming the revolver under our February 2015 Credit Agreement and our accounts receivable securitization facility are fully drawn, and based on the outstanding term loan balance as of June 30, 2018, each 0.125% change in assumed blended interest rates would result in an approximately $1.2 million change in annual interest expense on indebtedness. At present, we do not have any existing interest rate swap agreements, which involve the exchange of floating for fixed rate interest payments to reduce interest rate volatility. However, we may decide to enter into such swaps in the future. If we do, we may not maintain interest rate swaps with respect to all of our variable rate indebtedness and any swaps we enter into may not fully mitigate our interest rate risk, may prove disadvantageous or may create additional risks.
27
Item 1B. Unresolved Staff Comments
None.
Item 2. Properties
We lease all of our properties, which function primarily as regional sales and engineering offices. As of June 30, 2018, we leased space in 68 buildings across the United States. We believe that our current facilities are adequate to meet our ongoing needs and that, if we require additional space, we will be able to obtain additional facilities on commercially reasonable terms.
Item 3. Legal Proceedings
We are involved in various claims and legal actions that arise in the ordinary course of business. While it is impossible to determine with certainty the ultimate outcome of these matters, in the opinion of management the ultimate disposition of these matters will not have a material adverse effect on our financial position, results of operations, or liquidity. The information set forth in Note 13, Commitments and Contingencies, to the consolidated financial statements is incorporated by reference herein.
Item 4. Mine Safety Disclosures
Not applicable.
28
Part II
Item 5. | Market for Registrant's Common Equity, Related Stockholder Matters and Issuer Purchases of Equity Securities |
Market Information for our Common Stock
Prior to March 10, 2017, our common stock was privately held and there was no established public trading market for our common stock. On March 10, 2017, in connection with our IPO, our common stock began trading on the Nasdaq Global Select Market (the “NASDAQ”) under the symbol "PSDO." Our IPO was priced at $14.00 per share. The following table sets forth for the periods indicated, on a per share basis, the high and low sale prices for our common stock, as reported by the NASDAQ.
Price Range of Common Stock | |||||||
High | Low | ||||||
Fiscal Year Ended June 30, 2017 | |||||||
Third Quarter (from March 10, 2017) | $ | 15.59 | $ | 13.26 | |||
Fourth Quarter | 16.38 | 12.75 | |||||
Fiscal Year Ended June 30, 2018 | |||||||
First Quarter | $ | 15.18 | $ | 12.75 | |||
Second Quarter | 19.49 | 13.98 | |||||
Third Quarter | 19.74 | 13.87 | |||||
Fourth Quarter | 16.51 | 11.97 | |||||
Number of Stockholders of Record
As of August 31, 2018, there were 35 shareholders of record of our common stock.
Dividends
During the year ended June 30, 2018, we did not declare or pay any distributions to stockholders. However, on September 5, 2018, our Board of Directors declared an initial quarterly dividend of $0.04 per share of common stock, payable on October 5, 2018 to stockholders of record as of the close of business on September 26, 2018.
We intend to declare quarterly dividends to holders of our common stock. However, any future declaration and payment of future dividends to holders of our common stock will be at the discretion of our Board of Directors and will depend on many factors, including our financial condition, earnings, capital requirements, level of indebtedness, statutory and contractual restrictions applying to the payment of dividends and other considerations that our Board of Directors deems relevant. Because we are a holding company and have no direct operations, we will only be able to pay dividends from our available cash on hand and any funds we receive from our subsidiaries. The terms of our indebtedness may restrict us from paying dividends, or may restrict our subsidiaries from paying dividends to us. Under Delaware law, dividends may be payable only out of surplus, which is our net assets minus our liabilities and our capital, or, if we have no surplus, out of our net profits for the fiscal year in which the dividend is declared and/or the preceding fiscal year. See "Risks Related to an Investment in our Common Stock — Our ability to pay regular dividends to our stockholders is subject to the discretion of our Board of Directors and may be limited by our agreements with third parties, our holding company structure and applicable provisions of Delaware law. If we do not pay dividends you may not receive funds without selling your common stock."
Securities Authorized for Issuance under Equity Compensation Plans
The information contained under the section "Securities Authorized for Issuance under Equity Compensation Plans" in our Proxy Statement for the Annual Meeting of Stockholders is incorporated by reference herein.
Issuer Purchases of Equity Securities
We did not repurchase any of our equity securities during the fourth quarter of fiscal 2018.
29
Performance Graph
This performance graph shall not be deemed “soliciting material” or to be “filed” with the SEC for purposes of Section 18 of the Securities Exchange Act of 1934, as amended (the “Exchange Act”), or otherwise subject to the liabilities under that Section, and shall not be deemed to be incorporated by reference into any filing of Presidio, Inc. under the Securities Act or the Exchange Act.
The following graph presents the cumulative total stockholder return on our common stock as listed on the NASDAQ from March 10, 2017 (the date our common stock commenced trading on the NASDAQ) through June 30, 2018. This graph also compares our common stock to the cumulative total stockholder return on the S&P 1500 Index and the S&P 1500 IT Consulting and Other Services Index. The graph assumes an initial investment of $100.00 in our common stock as of March 10, 2017 and in each of the comparative indicies or peer issuers, and that all dividends were reinvested. The comparisons in the graph below are based upon historical data and are not indicative of, nor intended to forecast, future performance of our common stock.
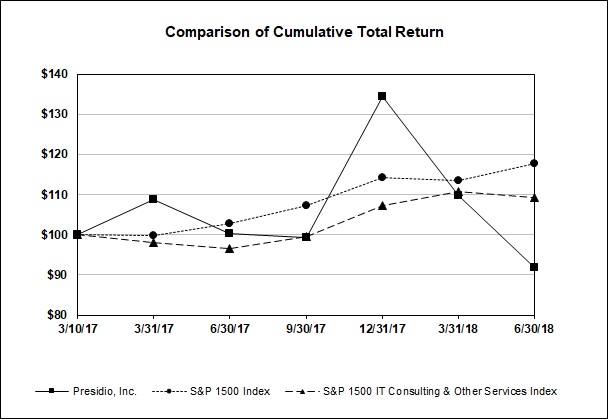
Index | 3/10/2017 | 3/31/2017 | 6/30/2017 | 9/30/2017 | 12/31/2017 | 3/31/2018 | 6/30/2018 | |||||||||||||||||||||
Presidio, Inc. | $ | 100.00 | $ | 108.67 | $ | 100.42 | $ | 99.30 | $ | 134.53 | $ | 109.75 | $ | 91.93 | ||||||||||||||
S&P 1500 Index | $ | 100.00 | $ | 99.80 | $ | 102.76 | $ | 107.32 | $ | 114.33 | $ | 113.51 | $ | 117.66 | ||||||||||||||
S&P 1500 IT Consulting & Other Services Index | $ | 100.00 | $ | 98.13 | $ | 96.65 | $ | 99.68 | $ | 107.25 | $ | 110.83 | $ | 109.25 | ||||||||||||||
30
Item 6. Selected Financial Data
The following table presents our selected historical consolidated financial data for all the periods presented. The selected historical consolidated statements of operations data for the fiscal years ended June 30, 2018, June 30, 2017 and June 30, 2016 and the selected historical consolidated balance sheet information as of June 30, 2018 and June 30, 2017 have been derived from our audited historical consolidated financial statements, included elsewhere in this Form 10-K. Our financial results with periods ending prior to February 2, 2015, have been termed those of "Predecessor," while the financial results with period ending subsequent to February 2, 2015, have been terms those of "Successor." The selected historical consolidated statements of operations data for the period from November 20, 2014 to June 30, 2015 (Successor), for the period from July 1, 2014 to February 1, 2015 (Predecessor) and the year ended June 30, 2014 and the selected historical consolidated balance sheet information as of June 30, 2016, 2015 and 2014 have been derived from our historical audited consolidated financial information, not included in this Annual Report on Form 10-K.
In addition to financial information presented in accordance with U.S. GAAP, the following table presents Adjusted Revenue, Adjusted EBITDA, Adjusted EBITDA Margin, Adjusted Net Income and Adjusted Net Income Per Share (all of which are non-GAAP measures defined below). Our non-GAAP measures should be considered in addition to, not as a substitute for, or superior to, financial measures calculated in accordance with U.S. GAAP. They are not measurements of our financial performance under U.S. GAAP and should not be considered as alternatives to net income (loss) or revenue, as applicable, or any other performance measures derived in accordance with U.S. GAAP and may not be comparable to other similarly titled measures of other businesses. These non-GAAP measures have limitations as analytical tools and you should not consider them in isolation or as a substitute for analysis of our operating results as reported under U.S. GAAP and they include adjustments for items that may occur in future periods.
Presidio, Inc. was incorporated on November 20, 2014 by certain investment funds affiliated with or managed by Apollo, including Apollo VIII, along with their parallel Apollo Funds in order to complete the acquisition of Presidio Holdings Inc. (the "Predecessor"). The Apollo Funds completed the acquisition on February 2, 2015 (the "Presidio Acquisition"), at which time Presidio Holdings Inc. became a wholly-owned subsidiary of Presidio, Inc. (the "Successor"). As a result of the Presidio Acquisition, the financial information for all periods ending on or after February 2, 2015 represent the financial information of the Successor. Periods ending prior to February 2, 2015 represent the financial information of the Predecessor. From November 20, 2014 (its date of inception) to February 1, 2015, the Successor had no operations or activities other than the incurrence of transaction costs related to the Presidio Acquisition.
You should read the following information together with the consolidated financial statements and notes thereto in Item 8 of this report, "Risk Factors" in Item 1A of this report, "Management's Discussion and Analysis of Financial Condition and Results of Operations" in Item 7 of this report and our historical consolidated financial statements and related notes included in our previous filings. Historical results are not necessarily indicative of the results to be expected in the future.
31
Predecessor | Successor | |||||||||||||||||||||||
Fiscal Year Ended June 30, 2014 | July 1, 2014 to February 1, 2015 | November 20, 2014 to June 30, 2015 | Fiscal Year Ended June 30, | |||||||||||||||||||||
2016 | 2017 | 2018 | ||||||||||||||||||||||
Consolidated Statement of Operations Data: | ||||||||||||||||||||||||
Revenue | $ | 2,266.0 | $ | 1,392.8 | $ | 985.5 | $ | 2,714.9 | $ | 2,817.6 | $ | 2,858.0 | ||||||||||||
Cost of revenue | 1,812.0 | 1,103.5 | 788.5 | 2,174.3 | 2,231.7 | 2,273.0 | ||||||||||||||||||
Gross Margin | 454.0 | 289.3 | 197.0 | 540.6 | 585.9 | 585.0 | ||||||||||||||||||
Operating expenses | 362.5 | 262.5 | 186.4 | 441.7 | 477.8 | 470.0 | ||||||||||||||||||
Operating income | 91.5 | 26.8 | 10.6 | 98.9 | 108.1 | 115.0 | ||||||||||||||||||
Interest expense | 34.3 | 21.4 | 46.7 | 81.9 | 72.5 | 46.0 | ||||||||||||||||||
Loss on disposal of business | — | — | — | 6.8 | — | — | ||||||||||||||||||
Loss on extinguishment of debt | 2.7 | 7.5 | 0.7 | 9.7 | 28.5 | 14.8 | ||||||||||||||||||
Other (income) expense, net | (2.4 | ) | (0.2 | ) | 0.1 | 0.1 | 0.1 | (0.3 | ) | |||||||||||||||
Total interest and other expense | 34.6 | 28.7 | 47.5 | 98.5 | 101.1 | 60.5 | ||||||||||||||||||
Income (loss) before income taxes | 56.9 | (1.9 | ) | (36.9 | ) | 0.4 | 7.0 | 54.5 | ||||||||||||||||
Income tax expense (benefit) | 24.4 | 3.2 | (12.6 | ) | 3.8 | 2.6 | (79.7 | ) | ||||||||||||||||
Net income (loss) | $ | 32.5 | $ | (5.1 | ) | $ | (24.3 | ) | $ | (3.4 | ) | $ | 4.4 | $ | 134.2 | |||||||||
Earnings (loss) per share: | ||||||||||||||||||||||||
Basic | $ | (0.35 | ) | $ | (0.05 | ) | $ | 0.06 | $ | 1.46 | ||||||||||||||
Diluted | $ | (0.35 | ) | $ | (0.05 | ) | $ | 0.05 | $ | 1.39 | ||||||||||||||
Weighted average shares used to compute earnings (loss) per share: | ||||||||||||||||||||||||
Basic | 70,010,538 | 71,117,962 | 77,517,700 | 91,891,295 | ||||||||||||||||||||
Diluted | 70,010,538 | 71,117,962 | 81,861,839 | 96,227,578 | ||||||||||||||||||||
Statement of cash flows data: | ||||||||||||||||||||||||
Net cash provided by (used in) operating activities | $ | 53.3 | $ | 74.5 | $ | (1.6 | ) | $ | 86.1 | $ | 51.0 | $ | 192.0 | |||||||||||
Net cash used in investing activities | (74.4 | ) | (71.3 | ) | (678.9 | ) | (322.0 | ) | (101.6 | ) | (162.1 | ) | ||||||||||||
Net borrowings (repayments) on floor plan facility | 20.5 | (29.0 | ) | 50.8 | 20.9 | 41.6 | (54.3 | ) | ||||||||||||||||
Other financing activities | 0.5 | 24.3 | 718.0 | 159.7 | 3.5 | 33.9 | ||||||||||||||||||
Net cash provided by (used in) financing activities | 21.0 | (4.7 | ) | 768.8 | 180.6 | 45.1 | (20.4 | ) | ||||||||||||||||
Net increase (decrease) in cash and cash equivalents | $ | (0.1 | ) | $ | (1.5 | ) | $ | 88.3 | $ | (55.3 | ) | $ | (5.5 | ) | $ | 9.5 | ||||||||
Other financial data: | ||||||||||||||||||||||||
Adjusted Revenue (1) | 2,149.9 | 1,323.4 | 940.8 | 2,683.7 | 2,818.2 | 2,858.1 | ||||||||||||||||||
Adjusted EBITDA (2) | 167.0 | 116.2 | 68.6 | 211.1 | 226.1 | 223.7 | ||||||||||||||||||
Adjusted EBITDA margin (2) | 7.8 | % | 8.8 | % | 7.3 | % | 7.9 | % | 8.0 | % | 7.8 | % | ||||||||||||
Adjusted Net Income (3) | 81.7 | 58.6 | 13.4 | 81.2 | 100.4 | 123.0 | ||||||||||||||||||
Adjusted Net Income per share: | ||||||||||||||||||||||||
Basic | $ | 0.19 | $ | 1.14 | $ | 1.30 | $ | 1.34 | ||||||||||||||||
Diluted | $ | 0.19 | $ | 1.11 | $ | 1.23 | $ | 1.28 | ||||||||||||||||
Weighted average shares used to compute Adjusted Net Income per share: | ||||||||||||||||||||||||
Basic | 70,010,538 | 71,117,962 | 77,517,700 | 91,891,295 | ||||||||||||||||||||
Diluted | 71,311,414 | 72,830,202 | 81,861,839 | 96,227,578 | ||||||||||||||||||||
Predecessor | Successor | |||||||||||||||||||
As of June 30, 2014 | As of June 30, 2015 | As of June 30, 2016 | As of June 30, 2017 | As of June 30, 2018 | ||||||||||||||||
Consolidated Balance Sheet (at the end of the period): | ||||||||||||||||||||
Cash and cash equivalents | $ | 8.5 | $ | 88.3 | $ | 33.0 | $ | 27.5 | $ | 37.0 | ||||||||||
Total assets | 1,545.0 | 2,444.4 | 2,623.1 | 2,650.7 | 2,694.3 | |||||||||||||||
Long-term debt, including current maturities | 618.7 | 933.7 | 1,038.0 | 730.7 | 671.2 | |||||||||||||||
Total liabilities | 1,448.5 | 2,108.6 | 2,276.2 | 2,047.8 | 1,938.2 | |||||||||||||||
Total stockholders’ equity | 96.5 | 335.8 | 346.9 | 602.9 | 756.1 | |||||||||||||||
Cash dividends declared per common share | $ | 0.46 | $ | — | $ | — | $ | — | $ | — | ||||||||||
32
(1) | Adjusted Revenue is a non-GAAP financial measure. We believe Adjusted Revenue provides supplemental information with respect to our revenue activity associated with our ongoing operations. We define Adjusted Revenue as revenue adjusted to exclude (i) revenue generated by disposed businesses and (ii) noncash purchase accounting adjustments to revenue as a result of our acquisitions. The following table presents a reconciliation of Adjusted Revenue from Revenue: |
Predecessor | Successor | |||||||||||||||||||||||
Fiscal Year Ended June 30, 2014 | July 1, 2014 to February 1, 2015 | November 20, 2014 to June 30, 2015 | Fiscal Year Ended June 30, | |||||||||||||||||||||
2016 | 2017 | 2018 | ||||||||||||||||||||||
Revenue | $ | 2,266.0 | $ | 1,392.8 | $ | 985.5 | $ | 2,714.9 | $ | 2,817.6 | $ | 2,858.0 | ||||||||||||
Adjustments: | ||||||||||||||||||||||||
Revenue from disposed business (a) | (116.1 | ) | (69.4 | ) | (46.0 | ) | (32.8 | ) | — | — | ||||||||||||||
Purchase accounting adjustments (b) | — | — | 1.3 | 1.6 | 0.6 | 0.1 | ||||||||||||||||||
Total adjustments | (116.1 | ) | (69.4 | ) | (44.7 | ) | (31.2 | ) | 0.6 | 0.1 | ||||||||||||||
Adjusted Revenue | $ | 2,149.9 | $ | 1,323.4 | $ | 940.8 | $ | 2,683.7 | $ | 2,818.2 | $ | 2,858.1 | ||||||||||||
(a) | “Revenue from disposed business” represents the removal of the historical revenue of Atlantix prior to the sale of the business. |
(b) | “Purchase accounting adjustments” include the noncash reduction to revenue associated with deferred revenue step down fair value adjustments in connection with purchase accounting. |
(2) | Adjusted EBITDA is a non-GAAP financial measure. We believe Adjusted EBITDA provides helpful information with respect to our operating performance as viewed by management, including a view of our business that is not dependent on (a) the impact of our capitalization structure and (b) items that are not part of our day-to-day operations. We define Adjusted EBITDA as net income (loss) plus (i) total depreciation and amortization, (ii) interest and other (income) expense and (iii) income tax expense (benefit), and further adjusted to eliminate noncash share-based compensation expense, purchase accounting adjustments, transaction costs, other costs and earnings from disposed business. We define Adjusted EBITDA margin as the ratio of Adjusted EBITDA to Adjusted Revenue. The following table presents a reconciliation of net income (loss) to Adjusted EBITDA: |
Predecessor | Successor | |||||||||||||||||||||||
Fiscal Year Ended June 30, 2014 | July 1, 2014 to February 1, 2015 | November 20, 2014 to June 30, 2015 | Fiscal Year Ended June 30, | |||||||||||||||||||||
2016 | 2017 | 2018 | ||||||||||||||||||||||
Adjusted EBITDA Reconciliation: | ||||||||||||||||||||||||
Net income (loss) | $ | 32.5 | $ | (5.1 | ) | $ | (24.3 | ) | $ | (3.4 | ) | $ | 4.4 | $ | 134.2 | |||||||||
Total depreciation and amortization (a) | 50.6 | 24.9 | 32.1 | 81.7 | 87.2 | 89.5 | ||||||||||||||||||
Interest and other (income) expense | 34.6 | 28.7 | 47.5 | 98.5 | 101.1 | 60.5 | ||||||||||||||||||
Income tax expense (benefit) | 24.4 | 3.2 | (12.6 | ) | 3.8 | 2.6 | (79.7 | ) | ||||||||||||||||
EBITDA | 142.1 | 51.7 | 42.7 | 180.6 | 195.3 | 204.5 | ||||||||||||||||||
Adjustments: | ||||||||||||||||||||||||
Share-based compensation expense | 5.5 | 20.1 | 1.0 | 2.2 | 10.2 | 7.0 | ||||||||||||||||||
Purchase accounting adjustments (b) | — | — | 4.9 | 3.9 | 1.0 | 0.3 | ||||||||||||||||||
Transaction costs (c) | 14.8 | 42.6 | 21.3 | 20.6 | 14.8 | 10.8 | ||||||||||||||||||
Other costs (d) | 13.0 | 4.5 | 1.9 | 5.6 | 4.8 | 1.1 | ||||||||||||||||||
Earnings from disposed business (e) | (8.4 | ) | (2.7 | ) | (3.2 | ) | (1.8 | ) | — | — | ||||||||||||||
Total adjustments | 24.9 | 64.5 | 25.9 | 30.5 | 30.8 | 19.2 | ||||||||||||||||||
Adjusted EBITDA | $ | 167.0 | $ | 116.2 | $ | 68.6 | $ | 211.1 | $ | 226.1 | $ | 223.7 | ||||||||||||
33
(a) | “Total depreciation and amortization” equals the sum of (i) depreciation and amortization within total operating expenses and (ii) depreciation and amortization recorded as part of cost of revenue within our consolidated financial statements. |
(b) | “Purchase accounting adjustments” include charges associated with noncash adjustments to acquired assets and liabilities in connection with purchase accounting, such as recognition of increased cost of revenue in connection with an inventory step up fair value adjustment, recognition of reduced revenue in connection with a deferred revenue step down fair value adjustment and recognition of increased office rent expense associated with a fair value adjustment to the liabilities associated with deferred rent. |
(c) | “Transaction costs” (1) of $14.8 million for the fiscal year ended June 30, 2014 includes acquisition-related expenses of $0.8 million related to stay and retention bonuses, $0.3 million related to severance charges, $0.7 million related to transaction-related legal, accounting and tax fees and $13.0 million related to professional fees and expenses associated with debt refinancings; (2) of $42.6 million for the Predecessor period from July 1, 2014 to February 1, 2015 includes acquisition-related expenses of $0.3 million related to stay and retention bonuses, $0.2 million related to acquisition-related severance charges, $31.2 million related to transaction-related legal, accounting and tax fees in connection with the Presidio Acquisition and $10.9 million related to professional fees and expenses associated with debt refinancings; (3) of $21.3 million for the Successor period from November 20, 2014 to June 30, 2015 includes acquisition-related expenses of $0.6 million related to stay and retention bonuses, $0.6 million related to severance charges, $18.5 million related to transaction-related legal, accounting and tax fees in connection with the Presidio Acquisition and $1.6 million related to professional fees and expenses associated with debt refinancings; (4) of $20.6 million for the fiscal year ended June 30, 2016 includes acquisition-related expenses of $3.0 million related to stay and retention bonuses, $1.1 million related to severance charges, $8.7 million related to transaction-related advisory and diligence fees, $6.0 million related to transaction-related legal, accounting and tax fees and $1.8 million related to professional fees and expenses associated with debt refinancings; (5) of $14.8 million for the fiscal year ended June 30, 2017 includes acquisition-related expenses of $7.4 million related to stay and retention bonuses, $5.2 million related to transaction-related advisory and diligence fees, $0.5 million related to transaction-related legal, accounting and tax fees and $1.7 million related to professional fees and expenses associated with debt refinancings; and (6) of $10.8 million for the fiscal year ended June 30, 2018 includes acquisition-related expenses of $5.9 million related to stay, retention and earnout bonuses, $1.4 million related to transaction-related advisory and diligence fees primarily associated with the November 2017 secondary offering of our common stock, $0.6 million related to transaction-related legal, accounting and tax fees and $2.9 million related to professional fees and expenses associated with debt refinancings. |
(d) | “Other costs” (1) of $13.0 million for the fiscal year ended June 30, 2014 includes expenses of $3.7 million associated with the integration of previously acquired managed services platforms into one system, certain expenses of $1.1 million related to unusual office start-up development costs, an unusual and non-recurring loss of $1.7 million related to an Atlantix customer receivable, certain unusual legal expenses of $2.2 million, $2.1 million related to payments to our former sponsor for advisory and consulting services and $2.2 million related to certain acquisition-related integration and related costs; (2) of $4.5 million for the Predecessor period from July 1, 2014 to February 1, 2015 includes expenses of $2.2 million associated with the integration of previously acquired managed services platforms into one system, certain expenses of $0.4 million related to unusual office start-up development costs, $1.6 million related to payments to our former sponsor for advisory and consulting services and $0.3 million related to other non-recurring items; (3) of $1.9 million for the Successor period from November 20, 2014 to June 30, 2015 includes expenses of $1.0 million associated with the integration of previously acquired managed services platforms into one system, $0.7 million related to certain non-recurring costs incurred in the development of our new cloud service offerings and certain unusual legal expenses of $0.2 million; (4) of $5.6 million for the fiscal year ended June 30, 2016 includes expenses of $0.5 million associated with the integration of previously acquired managed services platforms into one system, $3.4 million related to certain non-recurring costs incurred in the development of our new cloud service offerings, certain expenses of $0.5 million related to unusual office start-up development costs and certain unusual legal expenses of $1.2 million; (5) of $4.8 million for the fiscal year ended June 30, 2017 includes $3.6 million related to certain non-recurring costs incurred in the development of our new cloud service offerings, certain unusual legal expenses of $0.9 million and $0.3 million related to other non-recurring items; and (6) of $1.1 million for the fiscal year ended June 30, 2018 primarily related to severance charges associated with the retirement of our former Chief Financial Officer. |
34
(e) | “Earnings from disposed business” represents the removal of the historical earnings contribution of Atlantix prior to the sale of the business. |
(3) Adjusted Net Income is a non-GAAP financial measure. We believe that Adjusted Net Income provides additional information regarding our operating performance while considering the interest expense associated with our outstanding debt, as well as the impact of depreciation on our fixed assets and income taxes. We define Adjusted Net Income as net income (loss) adjusted to exclude (i) amortization of intangible assets, (ii) amortization of debt issuance costs, (iii) losses recognized on the disposal of business, (iv) losses on extinguishment of debt, (v) noncash share-based compensation expense, (vi) purchase accounting adjustments, (vii) transaction costs, (viii) other costs, (ix) earnings from disposed business and (x) the income tax impact associated with the foregoing items to arrive at an appropriate effective tax rate on Adjusted Net Income and adjusted for the impact of permanently nondeductible expenses, the impact of tax-deductible goodwill and intangible assets resulting from certain historical acquisitions and the impact of discrete tax items. The following table presents a reconciliation of net income (loss) to Adjusted Net Income:
Predecessor | Successor | |||||||||||||||||||||||
Fiscal Year Ended June 30, 2014 | July 1, 2014 to February 1, 2015 | November 20, 2014 to June 30, 2015 | Fiscal Year Ended June 30, | |||||||||||||||||||||
2016 | 2017 | 2018 | ||||||||||||||||||||||
Adjusted Net Income reconciliation: | ||||||||||||||||||||||||
Net income (loss) | $ | 32.5 | $ | (5.1 | ) | $ | (24.3 | ) | $ | (3.4 | ) | $ | 4.4 | $ | 134.2 | |||||||||
Adjustments: | ||||||||||||||||||||||||
Amortization of intangible assets | 38.3 | 18.3 | 26.4 | 67.2 | 73.6 | 74.4 | ||||||||||||||||||
Amortization of debt issuance costs | 4.4 | 2.4 | 2.7 | 7.6 | 6.5 | 4.5 | ||||||||||||||||||
Loss on disposal of business | — | — | — | 6.8 | — | — | ||||||||||||||||||
Loss on extinguishment of debt | 2.7 | 7.5 | 0.7 | 9.7 | 28.5 | 14.8 | ||||||||||||||||||
Share-based compensation expense | 5.5 | 20.1 | 1.0 | 2.2 | 10.2 | 7.0 | ||||||||||||||||||
Purchase accounting adjustments (a) | — | — | 4.9 | 3.9 | 1.0 | 0.3 | ||||||||||||||||||
Transaction costs (b) | 14.8 | 42.6 | 21.3 | 20.6 | 14.8 | 10.8 | ||||||||||||||||||
Other costs (c) | 13.0 | 4.5 | 1.9 | 5.6 | 4.8 | 1.1 | ||||||||||||||||||
Earnings from disposed business (d) | (8.4 | ) | (2.7 | ) | (3.2 | ) | (1.8 | ) | — | — | ||||||||||||||
Revaluation of federal deferred taxes | — | — | — | — | — | (94.1 | ) | |||||||||||||||||
Income tax impact of adjustments (e) | (21.1 | ) | (29.0 | ) | (18.0 | ) | (37.2 | ) | (43.4 | ) | (30.0 | ) | ||||||||||||
Total adjustments | 49.2 | 63.7 | 37.7 | 84.6 | 96.0 | (11.2 | ) | |||||||||||||||||
Adjusted Net Income | $ | 81.7 | $ | 58.6 | $ | 13.4 | $ | 81.2 | $ | 100.4 | $ | 123.0 | ||||||||||||
(a) | “Purchase accounting adjustments” include charges associated with noncash adjustments to acquired assets and liabilities in connection with purchase accounting, such as recognition of increased cost of revenue in connection with an inventory step up fair value adjustment, recognition of reduced revenue in connection with a deferred revenue step down fair value adjustment and recognition of increased office rent expense associated with a fair value adjustment to the liabilities associated with deferred rent. |
(b) | “Transaction costs” (1) of $14.8 million for the fiscal year ended June 30, 2014 includes acquisition-related expenses of $0.8 million related to stay and retention bonuses, $0.3 million related to severance charges, $0.7 million related to transaction-related legal, accounting and tax fees and $13.0 million related to professional fees and expenses associated with debt refinancings; (2) of $42.6 million for the Predecessor period from July 1, 2014 to February 1, 2015 includes acquisition-related expenses of $0.3 million related to stay and retention bonuses, $0.2 million related to acquisition-related severance charges, $31.2 million related to transaction-related legal, accounting and tax fees in connection with the Presidio Acquisition and $10.9 million related to professional fees and expenses associated with debt refinancings; (3) of $21.3 million for the Successor period from November 20, 2014 to June 30, 2015 includes acquisition-related expenses of $0.6 million related to stay and retention bonuses, $0.6 million related to severance charges, $18.5 million related to transaction-related legal, accounting and tax fees in connection with the Presidio Acquisition and $1.6 million related to professional fees and expenses associated with debt refinancings; (4) of $20.6 million for the fiscal year ended June 30, 2016 includes acquisition-related expenses of $3.0 million related to stay and retention bonuses, $1.1 million related to severance charges, $8.7 million related to transaction-related advisory and diligence fees, $6.0 million related to transaction-related legal, accounting and tax fees and $1.8 million related to professional fees and expenses associated with debt refinancings; (5) of $14.8 million for the fiscal year ended June 30, 2017 includes acquisition-related expenses of $7.4 million related to stay and retention bonuses, $5.2 million related to transaction-related advisory and |
35
diligence fees, $0.5 million related to transaction-related legal, accounting and tax fees and $1.7 million related to professional fees and expenses associated with debt refinancings; and (6) of $10.8 million for the fiscal year ended June 30, 2018 includes acquisition-related expenses of $5.9 million related to stay, retention and earnout bonuses, $1.4 million related to transaction-related advisory and diligence fees primarily associated with the November 2017 secondary offering of our common stock, $0.6 million related to transaction-related legal, accounting and tax fees and $2.9 million related to professional fees and expenses associated with debt refinancings.
(c) | “Other costs” (1) of $13.0 million for the fiscal year ended June 30, 2014 includes expenses of $3.7 million associated with the integration of previously acquired managed services platforms into one system, certain expenses of $1.1 million related to unusual office start-up development costs, an unusual and non-recurring loss of $1.7 million related to an Atlantix customer receivable, certain unusual legal expenses of $2.2 million, $2.1 million related to payments to our former sponsor for advisory and consulting services and $2.2 million related to certain acquisition-related integration and related costs; (2) of $4.5 million for the Predecessor period from July 1, 2014 to February 1, 2015 includes expenses of $2.2 million associated with the integration of previously acquired managed services platforms into one system, certain expenses of $0.4 million related to unusual office start-up development costs, $1.6 million related to payments to our former sponsor for advisory and consulting services and $0.3 million related to other non-recurring items; (3) of $1.9 million for the Successor period from November 20, 2014 to June 30, 2015 includes expenses of $1.0 million associated with the integration of previously acquired managed services platforms into one system, $0.7 million related to certain non-recurring costs incurred in the development of our new cloud service offerings and certain unusual legal expenses of $0.2 million; (4) of $5.6 million for the fiscal year ended June 30, 2016 includes expenses of $0.5 million associated with the integration of previously acquired managed services platforms into one system, $3.4 million related to certain non-recurring costs incurred in the development of our new cloud service offerings, certain expenses of $0.5 million related to unusual office start-up development costs and certain unusual legal expenses of $1.2 million; (5) of $4.8 million for the fiscal year ended June 30, 2017 includes $3.6 million related to certain non-recurring costs incurred in the development of our new cloud service offerings, certain unusual legal expenses of $0.9 million and $0.3 million related to other non-recurring items; and (6) of $1.1 million for the fiscal year ended June 30, 2018 primarily related to severance charges associated with the retirement of our former Chief Financial Officer. |
(d) | “Earnings from disposed business” represents the removal of the historical earnings contribution of Atlantix prior to the sale of the business. |
(e) | “Income tax impact of adjustments” includes an estimated tax impact of the adjustments to net income at the Company’s average statutory rate to arrive at an appropriate effective tax rate on Adjusted Net Income, except for (i) the adjustment of certain transaction costs that are permanently nondeductible for tax purposes, (ii) the impact of tax-deductible goodwill and intangible assets resulting from certain historical acquisitions and further adjusted for discrete tax items, such as the remeasurement of deferred tax liabilities due to state effective tax rate changes or the excess tax benefit related to share-based compensation activity. |
36
Item 7. Management's Discussion and Analysis of Financial Condition and Results of Operations
INDEX TO MANAGEMENT'S DISCUSSION AND ANALYSIS
OF FINANCIAL CONDITION AND RESULTS OF OPERATIONS
Page | |
37
Introduction
Unless otherwise indicated or the context otherwise requires, as used in this “Management’s Discussion and Analysis of Financial Condition and Results of Operations,” the terms “we,” “us,” “the Company,” “our,” “Presidio,” and similar terms refer to Presidio, Inc. and its subsidiaries. You should read the following discussion in conjunction with the historical consolidated financial statements of Presidio, Inc. and its subsidiaries and the related notes included elsewhere in this Annual Report on Form 10-K. This discussion contains forward-looking statements and involves numerous risks and uncertainties, including, but not limited to, those described in "Item 1A. Risk Factors." Our actual results may differ materially from those contained in any forward-looking statements.
The following is a discussion and analysis of our consolidated financial condition as of June 30, 2018 and 2017 and our consolidated results of operations for the fiscal year ended June 30, 2018, the fiscal year ended June 30, 2017 and for the fiscal year ended June 30, 2016 and significant factors which we believe could affect our prospective financial condition and results of operations.
Overview
Presidio is a leading provider of IT solutions to the middle market in North America. We enable business transformation through our expertise in agile, secure infrastructure solutions, with a specific focus on Digital Infrastructure, Cloud and Security solutions. Our solutions are delivered through a broad suite of life-cycle services comprised of professional services and Managed/Optimization services. These services include strategy, consulting, design, implementation, project management, technology acquisition, managed infrastructure, cloud and security services, maintenance and support. Our services-led, lifecycle model leads to ongoing client engagement. For the fiscal year ended June 30, 2018, we served approximately 8,000 middle-market, large and government organizations across a diverse range of industries.
We develop and maintain our long-term client relationships through a localized direct sales force of approximately 500 employees based in over 60 offices across the United States as of June 30, 2018. As a strategic partner and trusted advisor to our clients, we provide the expertise to implement new solutions, as well as optimize and better leverage existing IT resources. We provide strategy, consulting, design, customized deployment, integration and lifecycle management through our team of over 1,600 engineers as of June 30, 2018, enabling us to architect and manage the ideal IT solutions for our clients. Our local delivery model, combining relationship managers and expert engineering teams, allows us to win, retain and expand our client relationships.
Our clients are increasingly dependent on Presidio to develop best of breed, vendor-agnostic agile, secure infrastructure solution sets comprised of Digital Infrastructure, Cloud and Security solutions. Within these areas, we offer customers enterprise-class solutions that are critical to driving digital transformation and expanding business capabilities. Examples of our solutions include advanced networking, Software Defined Data Centers, IoT, data analytics, data center modernization, hybrid and multi-cloud, cyber risk management and enterprise mobility. These solutions are enabled by our expertise in foundational technologies, built upon our investments in network, data center, security, collaboration and mobility.
Digital Infrastructure Solutions: Our enterprise-class Digital Infrastructure solutions enable clients to deploy IT infrastructure that is cloud-flexible, mobile-ready, secure and insight-driven. We also make clients’ existing IT infrastructure more efficient and flexible for emerging technologies. Within Digital Infrastructure, we are focused on networking, Software Defined networking, collaboration, enterprise mobility, IoT and data analytics. Given the millions of potential configurations across technologies, our clients rely on our expertise to simplify the highly complex IT landscape.
Cloud Solutions: Companies are increasingly turning to us for help with their cloud strategy and adoption. We combine our highly specialized cloud professional services with our deep experience in cloud-managed services, converged infrastructure, server, storage, support and capacity-on-demand economic models to provide a complete lifecycle of cloud infrastructure solutions for our clients. Our proprietary tools, technical expertise and vendor-agnostic approach help our customers accelerate and simplify cloud adoption across the entire IT lifecycle.
Security Solutions: We use a risk-based security consulting methodology to assess, design, implement, manage and maintain information security solutions that protect our customers’ critical business data and protects against loss of client loyalty, corporate reputation and disruptions in ongoing operations. We offer cyber risk management, infrastructure security and managed security solutions to our clients. Through our NGRM, we provide comprehensive risk assessments, detailed reporting, ongoing reviews, process and program development, and training services. NGRM ensures that identified vulnerabilities are mitigated and business risk has been properly addressed. Because our customers’ infrastructures are constantly changing, our NGRM offering is structured as a recurring service with regular periodic assessments of the current security posture combined with ongoing monitoring and surveillance through our 7x24 Security Operations Centers. Our experience spans all major verticals including
38
retail, education, healthcare, government, banking, pharmaceutical and others. We have expertise with HIPAA, PCI DSS, FISMA, the Sarbanes-Oxley Act and others. We help our clients design and implement information security programs consistent with industry best practices and comply with the regulatory mandates of their specific vertical that are flexible enough to help ensure information security in an ever-changing risk environment. Findings, recommendations and real time security posture status, including our proprietary Risk Management Score, are provided through a 7x24 portal that is accessible by our clients and is updated with the up to date vulnerabilities identified by several industry sources.
We help our clients establish both technical and non-technical security controls and practices to prevent, detect, correct, and minimize the risk of loss or damage to information resources, disruption of access to information resources and unauthorized disclosure of information. In addition to our NGRM program, we offer options for security strategy program development, security awareness training, technology exposure assessments and incident response.
Factors Affecting Our Operating Performance
We believe that the financial performance of our business and our future success are dependent upon many factors, including those highlighted in this section. Our operating performance will depend upon many variables, including the success of our growth strategies and the timing and size of investments and expenditures that we choose to undertake, as well as market growth and other factors that are not within our control.
Macroeconomic environment: Weak economic conditions generally, U.S. federal or other government spending cuts, a rising interest rate environment, uncertain tax and regulatory policies, weakening business confidence or a tightening of credit markets could cause our clients and potential clients to postpone or reduce spending on technology solutions, products or services. Our clients are diverse, including both public and private sector parties, but any long-term, severe or sustained economic downturn may adversely affect all of our clients.
Competitive markets: We believe that we are uniquely positioned to take advantage of the markets in which we operate because of our expertise and specialization. We focus on the middle-market segment of the IT services market. Since most large-scale IT service providers focus on larger enterprises and because smaller regional competitors are typically unable to provide end-to-end solutions, we believe the middle market is under-penetrated and under-served. Strategic and investment decisions by our competitors may affect our operating performance.
Delivery of complex technology solutions: Our vendor agnostic approach to the market allows us to develop optimal IT solutions for our clients based on what we view as the best mix of technologies. We deliver our end-to-end solutions through a full lifecycle model, which combines consulting, engineering, managed services and technology to give us a significant competitive advantage compared to other IT providers. Our ability to effectively manage project engagements, including logistics, product availability, client requirements, engineering resources and service levels, will affect our financial performance.
Vendor partner relationships: We are focused on developing and strengthening our partner relationships with original equipment manufacturers (“OEMs”). We partner with OEMs to deploy product offerings. Pricing and incentive programs are subject to change, and the loss of, change in business relationship with or change in the behavior, including the timing of fulfillment, of any key vendor partners, or the diminished availability of their products, may impact the timing of our sales or could reduce the supply and increase the cost of the products we sell. While we maintain existing relationships with large vendors, there is no guarantee that our vendor partners will continue to develop or produce information technology products that are popular with our clients. We maintain the ability to evolve our vendor relationships as necessary to respond to market trends.
Seasonality: Our results may be affected by slight variances as a result of seasonality we may experience across our business. This seasonality is typically driven by budget cycles and spending patterns across our diverse client base. For example, our local, state and federal government clients operate on an annual budget cycle, most often on the basis of a fiscal year that begins October 1. Our private sector clients operate on an annual budget cycle, most often on the basis of a fiscal year that begins January 1. It is not uncommon to experience a higher level of contract awards, funding actions and overall government and private demand for services in the final months and weeks of the government and private fiscal years, respectively.
Components of Results of Operations
Basis of Presentation
The accompanying consolidated financial statements have been prepared in conformity with accounting principles generally accepted in the United States of America (“U.S. GAAP”). All financial information presented in the financial statements and notes herein is presented in millions except for share and per share information and percentages.
39
In management’s opinion, all adjustments necessary for a fair presentation of the results of operations, financial position and cash flows for the periods shown have been made. With the exception of acquisition related accounting, all other adjustments are of a normal recurring nature.
There are a number of factors that impact the revenue and margin profile of the solutions we provide, including, but not limited to, solution and technology complexity, technical expertise requiring the combination of products and value-added services provided, as well as other elements that may be specific to a particular engagement.
Revenue and cost of revenue: Revenue from the sale of our solutions is primarily comprised of the sale of third-party products, software and third-party support service contracts along with the sale of Company and third-party services. We separately present product revenue and service revenue, along with the associated cost of revenue, in our consolidated statements of operations.
Product revenue: Our product revenue includes:
Revenue for hardware and software: Revenue from the sale of hardware and software products is generally recognized on a gross basis with the selling price to the client recorded as revenue and the acquisition cost of the product recorded as cost of revenue, net of vendor rebates. Revenue is generally recognized when the title and risk of loss are passed to the client. Hardware and software items can be delivered to clients in a variety of ways including as physical products shipped from our warehouse, via drop-shipment by the vendor or supplier, or via electronic delivery for software licenses. In certain cases, our solutions include the sale of software subscriptions where we are the agent in the arrangement with the customer and recognize the related revenue net of the related cost of revenue.
Revenue for third-party support service contracts: Revenue from the sale of third-party support service contracts is recognized net of the related cost of revenue. In a third-party support service contract, all services are provided by our third-party providers and as a result, we are acting as an agent and recognize revenue on a net basis at the date of sale, with revenue being equal to the gross margin on the transaction. As we are under no obligation to perform additional services, revenue is recognized at the time of sale as opposed to over the life of the third-party support service agreement.
Revenue from leasing arrangements: Revenue recognition for information technology hardware and software products leased to clients is based on the type of the lease. Each lease is classified as either a direct financing lease, sales-type lease or operating lease. The majority of our leases are sales-type leases. At the inception of a sales-type lease, the present value of the non-cancelable rentals is recorded as revenue and equipment costs, less the present value of the estimated residual values, are recorded in cost of revenue. At the inception of an operating lease, the equipment assigned to the lease is recorded at cost as equipment under operating leases in our consolidated balance sheets and is depreciated on a straight-line basis over its useful life. Monthly payments are recorded as revenue within our consolidated statements of operations, with the depreciation expense associated with the equipment recorded in cost of product revenue.
Service revenue: Our service revenue includes consulting and integration services, project management, managed services and support services and includes:
Revenue for professional services: Revenue for professional services is generally recognized as the services are performed. For time and material service contracts, revenue is recognized at the contractual hourly rates for the hours performed during the period. For fixed price service contracts, revenue is recognized on a proportional performance method based on the labor hours completed compared to the total estimated hours for the scope of work with contract and revenue accrued or deferred as appropriate. Cost of revenue associated with professional services includes the compensation, benefits, and other costs associated with our delivery and project management engineering team, as well as costs charged by subcontractors.
Revenue for managed services: Revenue for managed services is generally recognized on a straight-line basis over the term of the arrangement. We may incur upfront costs associated with professional and managed services including, but not limited to, purchasing third-party support service arrangements, and software licenses. These costs are initially deferred as prepaid expenses or other assets and expensed over the period that services are being provided as cost of revenue. In addition, cost of revenue includes the compensation, benefits and other costs associated with our managed services engineering team, costs charged by subcontractors and depreciation of the software used to deliver our managed services and managed cloud contracts.
Gross margin: Our product gross margin is impacted by the types of technology sold in our solutions, as well as the mix of third-party support service contracts. As described previously, our third-party support service sales are recognized on a net basis, resulting in the gross margin being recognized as revenue. Accordingly, higher attach rates of third-party support service
40
contracts to the sale of hardware and more successful renewals of expiring contracts have a significant favorable impact to our gross margin percentage.
Our service gross margin is primarily impacted by our ability to deliver on fixed price professional services engagements within scope, the ability to keep our delivery engineers utilized and the hourly bill rate charged to clients. The complexity of the solutions sold to our clients may require specialized engineering capabilities that can favorably impact the bill rate we charge. Our service revenue and cost of revenue also includes third-party services. Generally, a higher mix of professional services delivered by our delivery engineers has a favorable impact on service gross margin. In addition, our managed services gross margins are favorably impacted by our ability to negotiate longer contracts with our clients, as well as renewing contracts at a high rate, which improves our operating efficiency. Generally, a higher percentage of our overall revenue relates to services sold to our clients when the technology complexity of our solutions increases. Accordingly, our gross margins are favorably impacted by our ability to deliver more complex solutions, which include professional and managed services.
Operating expenses: Our operating expenses include selling expenses, general and administrative expenses, transaction costs and depreciation and amortization.
Selling expenses are comprised of compensation (including share-based compensation), variable incentive pay and benefits related to our sales personnel along with travel expenses and other employee related costs. Variable incentive pay is largely driven by our gross margin performance. We expect selling expenses to increase as a result of higher gross margin, as well as continued investment in our direct and indirect sales resources. However, we expect selling expenses to decline as a percentage of our total revenue.
General and administrative expenses are comprised of compensation (including share-based compensation) and benefits of administrative and operational support personnel, including variable incentive pay and other administrative costs such as facilities expenses, professional fees and bad debt expense. We expect general and administrative expenses to increase due to our growth, however, we expect general and administrative expenses to decline as a percentage of our total revenue as we realize the benefits of scale.
Transaction costs include acquisition-related expenses (such as stay and retention bonuses), severance charges, advisory and diligence fees, transaction-related legal, accounting and tax fees, as well as professional fees and related out-of-pocket expenses associated with refinancing of debt and credit agreements.
Depreciation and amortization primarily includes the amortization of acquired intangible assets associated with our acquisitions and depreciation associated with our property and equipment.
Total interest and other (income) expense: Total interest and other (income) expense primarily includes interest expense associated with our outstanding debt. In addition, we include losses on extinguishment of debt and other noncash gains or losses within total interest and other (income) expense.
41
Results of Operations
Key Business Metrics
Our management regularly monitors certain financial measures to track the progress of our business against internal goals and targets. In addition to financial information presented in accordance with GAAP, such as total revenue and net income, management uses Adjusted EBITDA and Adjusted Net Income (each of which is a non-GAAP measure defined below) in its evaluation of past performance and prospects for the future. Our non-GAAP measures should be considered in addition to, not as a substitute for, or superior to, financial measures calculated in accordance with GAAP. They are not measurements of our financial performance under GAAP and should not be considered as alternatives to net income (loss) or revenue, as applicable, or any other performance measures derived in accordance with GAAP and may not be comparable to other similarly titled measures of other businesses. These non-GAAP measures have limitations as analytical tools and you should not consider them in isolation or as a substitute for analysis of our operating results as reported under GAAP and they include adjustments for items that may occur in future periods. However, we believe these adjustments are appropriate because the amounts recognized can vary significantly from period to period, do not directly relate to the ongoing operations of our business and complicate comparisons of our internal operating results and operating results of other peer companies over time.
We believe that the most important GAAP and non-GAAP measures include:
Fiscal Year Ended June 30, | |||||||||||
(in millions) | 2016 | 2017 | 2018 | ||||||||
Total Revenue | $ | 2,714.9 | $ | 2,817.6 | $ | 2,858.0 | |||||
Gross margin | $ | 540.6 | $ | 585.9 | $ | 585.0 | |||||
Adjusted EBITDA | $ | 211.1 | $ | 226.1 | $ | 223.7 | |||||
Adjusted EBITDA margin | 7.9 | % | 8.0 | % | 7.8 | % | |||||
Net income (loss) | $ | (3.4 | ) | $ | 4.4 | $ | 134.2 | ||||
Adjusted Net Income | $ | 81.2 | $ | 100.4 | $ | 123.0 | |||||
Adjusted EBITDA - Adjusted EBITDA is a non-GAAP financial measure. We believe Adjusted EBITDA provides helpful information with respect to our operating performance as viewed by management, including a view of our business that is not dependent on (a) the impact of our capitalization structure and (b) items that are not part of our day-to-day operations. We define Adjusted EBITDA as net income (loss) plus (i) total depreciation and amortization, (ii) interest and other (income) expense, and (iii) income tax expense (benefit), as further adjusted to eliminate noncash share-based compensation expense, purchase accounting adjustments, transaction costs, other costs and earnings from disposed business. We define Adjusted EBITDA margin as the ratio of Adjusted EBITDA to Adjusted Revenue.
42
The reconciliation of from net income (loss) to Adjusted EBITDA for each of the periods presented is as follows:
Fiscal Year Ended June 30, | |||||||||||
(in millions) | 2016 | 2017 | 2018 | ||||||||
Adjusted EBITDA Reconciliation: | |||||||||||
Net income (loss) | $ | (3.4 | ) | $ | 4.4 | $ | 134.2 | ||||
Total depreciation and amortization (a) | 81.7 | 87.2 | 89.5 | ||||||||
Interest and other (income) expense | 98.5 | 101.1 | 60.5 | ||||||||
Income tax expense (benefit) | 3.8 | 2.6 | (79.7 | ) | |||||||
EBITDA | 180.6 | 195.3 | 204.5 | ||||||||
Adjustments: | |||||||||||
Share-based compensation expense | 2.2 | 10.2 | 7.0 | ||||||||
Purchase accounting adjustments (b) | 3.9 | 1.0 | 0.3 | ||||||||
Transaction costs (c) | 20.6 | 14.8 | 10.8 | ||||||||
Other costs (d) | 5.6 | 4.8 | 1.1 | ||||||||
Earnings from disposed business (e) | (1.8 | ) | — | — | |||||||
Total adjustments | 30.5 | 30.8 | 19.2 | ||||||||
Adjusted EBITDA | $ | 211.1 | $ | 226.1 | $ | 223.7 | |||||
(a) | “Total depreciation and amortization” equals the sum of (i) depreciation and amortization included within total operating expenses and (ii) depreciation and amortization recorded as part of cost of revenue within our consolidated financial statements. |
(b) | “Purchase accounting adjustments” include charges associated with noncash adjustments to acquired assets and liabilities in connection with purchase accounting, such as recognition of increased cost of revenue in connection with an inventory step up fair value adjustment, recognition of reduced revenue in connection with a deferred revenue step down fair value adjustment and recognition of increased office rent expense associated with a fair value adjustment to the liability associated with deferred rent. |
(c) | “Transaction costs” (i) of $20.6 million for the fiscal year ended June 30, 2016 includes acquisition-related expenses of $3.0 million related to stay and retention bonuses, $1.1 million related to severance charges, $8.7 million related to transaction-related advisory and diligence fees, $6.0 million related to transaction-related legal, accounting and tax fees in connection with the Presidio Acquisition and $1.8 million related to professional fees and expenses associated with debt refinancings; (ii) of $14.8 million for the fiscal year ended June 30, 2017 includes acquisition-related expenses of $7.4 million related to stay and retention bonuses, $5.2 million related to transaction-related advisory and diligence fees, $0.5 million related to transaction-related legal, accounting and tax fees and $1.7 million related to professional fees and expenses associated with debt refinancings; and (iii) of $10.8 million for the fiscal year ended June 30, 2018 includes acquisition-related expenses of $5.9 million related to stay and retention bonuses, $1.4 million related to transaction-related advisory and diligence fees primarily associated with the November 2017 secondary offering of our common stock, $0.6 million related to transaction-related legal, accounting and tax fees and $2.9 million related to professional fees and expenses associated with debt refinancings. |
(d) | “Other costs” (i) of $5.6 million for the fiscal year ended June 30, 2016 includes expenses of $3.4 million related to certain non-recurring costs incurred in the development of our new cloud service offerings, certain expenses of $0.5 million related to unusual office start-up development costs and certain unusual legal expenses of $1.2 million; (ii) of $4.8 million for the fiscal year ended June 30, 2017 includes $3.6 million related to certain non-recurring costs incurred in the development of our new cloud service offerings, certain unusual legal expenses of $0.9 million and $0.3 million related to severance, (iii) of $1.1 million for the fiscal year ended June 30, 2018 primarily related to severance charges associated with the retirement of our former Chief Financial Officer. |
(e) | “Earnings from disposed business” represents the removal of the historical earnings contribution of Atlantix prior to the sale of the business. |
Adjusted Net Income – Adjusted Net Income is a non-GAAP measure, which management uses to provide additional information regarding our operating performance while considering the interest expense associated with our outstanding debt, as
43
well as the impact of depreciation on our fixed assets and income taxes. We define Adjusted Net Income as net income (loss) adjusted to exclude (i) amortization of intangible assets, (ii) amortization of debt issuance costs, (iii) losses recognized on the disposal of business, (iv) losses on extinguishment of debt, (v) noncash share-based compensation expense, (vi) purchase accounting adjustments, (vii) transaction costs, (viii) other costs, (ix) earnings from disposed business and (x) the income tax impact associated with the foregoing items to arrive at an appropriate effective tax rate on Adjusted Net Income and adjusted for the impact of permanently nondeductible expenses, the impact of tax-deductible goodwill and intangible assets resulting from certain historical acquisitions and the impact of discrete items. The following table presents a reconciliation of net income (loss) to Adjusted Net Income:
Fiscal Year Ended June 30, | |||||||||||
(in millions) | June 30, 2016 | June 30, 2017 | June 30, 2018 | ||||||||
Adjusted Net Income reconciliation: | |||||||||||
Net income (loss) | $ | (3.4 | ) | $ | 4.4 | $ | 134.2 | ||||
Adjustments: | |||||||||||
Amortization of intangible assets | 67.2 | 73.6 | 74.4 | ||||||||
Amortization of debt issuance costs | 7.6 | 6.5 | 4.5 | ||||||||
Loss on disposal of business | 6.8 | — | — | ||||||||
Loss on extinguishment of debt | 9.7 | 28.5 | 14.8 | ||||||||
Share-based compensation expense | 2.2 | 10.2 | 7.0 | ||||||||
Purchase accounting adjustments (a) | 3.9 | 1.0 | 0.3 | ||||||||
Transaction costs (b) | 20.6 | 14.8 | 10.8 | ||||||||
Other costs (c) | 5.6 | 4.8 | 1.1 | ||||||||
Earnings from disposed business (d) | (1.8 | ) | — | — | |||||||
Revaluation of federal deferred taxes | — | — | (94.1 | ) | |||||||
Income tax impact of adjustments (e) | (37.2 | ) | (43.4 | ) | (30.0 | ) | |||||
Total adjustments | 84.6 | 96.0 | (11.2 | ) | |||||||
Adjusted Net Income | $ | 81.2 | $ | 100.4 | $ | 123.0 | |||||
(a) | “Purchase accounting adjustments” include charges associated with noncash adjustments to acquired assets and liabilities in connection with purchase accounting, such as recognition of increased cost of revenue in connection with an inventory step up fair value adjustment, recognition of reduced revenue in connection with a deferred revenue step down fair value adjustment and recognition of increased office rent expense associated with a fair value adjustment to the liability associated with deferred rent. |
(b) | “Transaction costs” (i) of $20.6 million for the fiscal year ended June 30, 2016 includes acquisition-related expenses of $3.0 million related to stay and retention bonuses, $1.1 million related to severance charges, $8.7 million related to transaction-related advisory and diligence fees, $6.0 million related to transaction-related legal, accounting and tax fees in connection with the Presidio Acquisition and $1.8 million related to professional fees and expenses associated with debt refinancings; (ii) of $14.8 million for the fiscal year ended June 30, 2017 includes acquisition-related expenses of $7.4 million related to stay and retention bonuses, $5.2 million related to transaction-related advisory and diligence fees, $0.5 million related to transaction-related legal, accounting and tax fees and $1.7 million related to professional fees and expenses associated with debt refinancings; and (iii) of $10.8 million for the fiscal year ended June 30, 2018 includes acquisition-related expenses of $5.9 million related to stay and retention bonuses, $1.4 million related to transaction-related advisory and diligence fees primarily associated with the November 2017 secondary offering of our common stock, $0.6 million related to transaction-related legal, accounting and tax fees and $2.9 million related to professional fees and expenses associated with debt refinancings. |
(c) | “Other costs” (i) of $5.6 million for the fiscal year ended June 30, 2016 includes expenses of $3.4 million related to certain non-recurring costs incurred in the development of our new cloud service offerings, certain expenses of $0.5 million related to unusual office start-up development costs and certain unusual legal expenses of $1.2 million; (ii) of $4.8 million for the fiscal year ended June 30, 2017 includes $3.6 million related to certain non-recurring costs incurred in the development of our new cloud service offerings, certain unusual legal expenses of $0.9 million and $0.3 million related to severance, (iii) of $1.1 million for the fiscal year ended June 30, 2018 primarily related to severance charges associated with the retirement of our former Chief Financial Officer. |
44
(d) | “Earnings from disposed business” represents the removal of the historical earnings contribution of Atlantix prior to the sale of the business. |
(e) | “Income tax impact of adjustments” includes an estimated tax impact of the adjustments to net income at the Company’s average statutory rate to arrive at an appropriate effective tax rate on Adjusted Net Income, except for (i) the adjustment of certain transaction costs that are permanently nondeductible for tax purposes, (ii) the impact of tax-deductible goodwill and intangible assets resulting from certain historical acquisitions and further adjusted for discrete tax items such as the remeasurement of deferred tax liabilities due to state effective tax rate changes or the excess tax benefit related to share-based compensation activity. |
Basis of Presentation and Results of Operations
The accompanying consolidated financial statements have been prepared in conformity U.S. GAAP and Securities and Exchange Commission ("SEC") rules and regulations for annual reporting periods. The information contained below should be read in conjunction with our historical financial statements and the related notes included in this Annual Report on Form 10-K.
45
Fiscal Year Ended June 30, 2018 Compared to Fiscal Year Ended June 30, 2017
Fiscal Year Ended June 30, | Change | |||||||||||||
(in millions) | 2017 | 2018 | $ | % | ||||||||||
Revenue | ||||||||||||||
Product | $ | 2,373.2 | $ | 2,336.5 | $ | (36.7 | ) | (1.5 | )% | |||||
Service | 444.4 | 521.5 | 77.1 | 17.3 | % | |||||||||
Total revenue | 2,817.6 | 2,858.0 | 40.4 | 1.4 | % | |||||||||
Cost of revenue | ||||||||||||||
Product | 1,884.2 | 1,856.3 | (27.9 | ) | (1.5 | )% | ||||||||
Service | 347.5 | 416.7 | 69.2 | 19.9 | % | |||||||||
Total cost of revenue | 2,231.7 | 2,273.0 | 41.3 | 1.9 | % | |||||||||
Gross margin | 585.9 | 585.0 | (0.9 | ) | (0.2 | )% | ||||||||
Product gross margin | 489.0 | 480.2 | (8.8 | ) | (1.8 | )% | ||||||||
Service gross margin | 96.9 | 104.8 | 7.9 | 8.2 | % | |||||||||
Product gross margin % | 20.6 | % | 20.6 | % | — | % | ||||||||
Service gross margin % | 21.8 | % | 20.1 | % | (1.7 | )% | ||||||||
Total gross margin % | 20.8 | % | 20.5 | % | (0.3 | )% | ||||||||
Operating expenses | ||||||||||||||
Selling expenses | 276.2 | 273.7 | (2.5 | ) | (0.9 | )% | ||||||||
General and administrative | 105.0 | 101.8 | (3.2 | ) | (3.0 | )% | ||||||||
Transaction costs | 14.8 | 10.8 | (4.0 | ) | (27.0 | )% | ||||||||
Depreciation and amortization | 81.8 | 83.7 | 1.9 | 2.3 | % | |||||||||
Total operating expenses | 477.8 | 470.0 | (7.8 | ) | (1.6 | )% | ||||||||
Selling, general and administrative expenses % of total revenue | 13.5 | % | 13.1 | % | (0.4 | )% | ||||||||
Operating income | 108.1 | 115.0 | 6.9 | 6.4 | % | |||||||||
Interest and other (income) expense | ||||||||||||||
Interest expense | 72.5 | 46.0 | (26.5 | ) | (36.6 | )% | ||||||||
Loss on extinguishment of debt | 28.5 | 14.8 | (13.7 | ) | (48.1 | )% | ||||||||
Other (income) expense, net | 0.1 | (0.3 | ) | (0.4 | ) | n.m. | ||||||||
Total interest and other (income) expense | 101.1 | 60.5 | (40.6 | ) | (40.2 | )% | ||||||||
Income before income taxes | 7.0 | 54.5 | 47.5 | n.m. | ||||||||||
Income tax expense (benefit) | 2.6 | (79.7 | ) | (82.3 | ) | n.m. | ||||||||
Net income | $ | 4.4 | $ | 134.2 | $ | 129.8 | n.m. | |||||||
Adjusted EBITDA | $ | 226.1 | $ | 223.7 | $ | (2.4 | ) | (1.1 | )% | |||||
Adjusted Net Income | $ | 100.4 | $ | 123.0 | $ | 22.6 | 22.5 | % | ||||||
___________________________________
n.m. - not meaningful
46
Revenue
Fiscal Year Ended June 30, | Change | |||||||||||||
(in millions) | 2017 | 2018 | $ | % | ||||||||||
Revenue | ||||||||||||||
Product | $ | 2,373.2 | $ | 2,336.5 | $ | (36.7 | ) | (1.5 | )% | |||||
Service | 444.4 | 521.5 | 77.1 | 17.3 | % | |||||||||
Total revenue | $ | 2,817.6 | $ | 2,858.0 | $ | 40.4 | 1.4 | % | ||||||
Total revenue increased $40.4 million, or 1.4%, to $2,858.0 million for the fiscal year ended June 30, 2018, compared to total revenue of $2,817.6 million for the fiscal year ended June 30, 2017 which was led by growth in Security solutions. Our revenue growth in the period was negatively impacted by net recognition of software subscription sales, and a 16% increase in backlog orders believed to be firm as of June 30, 2018 compared to the prior year period.
Revenue from sales of product decreased $36.7 million, or 1.5%, to $2,336.5 million for the fiscal year ended June 30, 2018, compared to $2,373.2 million for the fiscal year ended June 30, 2017. The decrease was driven by the impact of net recognition of software subscription sales in the fiscal year ended June 30, 2018, partially offset by strong growth in Security hardware sales.
Revenue from sales of services increased $77.1 million, or 17.3%, to $521.5 million for the fiscal year ended June 30, 2018, as compared to $444.4 million for the fiscal year ended June 30, 2017, a result of increased demand for our professional and managed services. Increased demand for Presidio led services along with several large vendor partner engagements contributed to the double-digit growth in services revenue. In addition, we continue to see strong demand for our managed services with revenue up 14% over the prior year.
Fiscal Year Ended June 30, | Change | |||||||||||||
(in millions) | 2017 | 2018 | $ | % | ||||||||||
Revenue by solution area | ||||||||||||||
Cloud | $ | 501.1 | $ | 450.3 | $ | (50.8 | ) | (10.1 | )% | |||||
Security | 324.1 | 376.9 | 52.8 | 16.3 | % | |||||||||
Digital Infrastructure | 1,992.4 | 2,030.8 | 38.4 | 1.9 | % | |||||||||
Total revenue | $ | 2,817.6 | $ | 2,858.0 | $ | 40.4 | 1.4 | % | ||||||
Cloud revenue decreased $50.8 million, or 10.1%, to $450.3 million in the fiscal year ended June 30, 2018, compared to $501.1 million for the fiscal year ended June 30, 2017. The middle market drove the decline where we experienced reduced spending from both healthcare and education clients. In the government sector both state and local and federal clients declined year over year. Cloud revenue was impacted by shifting of revenue recognition from a point in time to a period over the life of the contract with the customer as our revenue base continues to migrate to multi-year, recurring revenue contracts vs. point in time sales.
Security revenue increased $52.8 million, or 16.3%, to $376.9 million in the fiscal year ended June 30, 2018, compared to $324.1 million in the fiscal year ended June 30, 2017, driven by higher demand from customers as they look to stay ahead of increasingly complex cyber security threats which drove adoption of advanced security technologies and services across middle-market and large clients. In the middle market, healthcare clients experienced strong growth as well as education clients. Retail and financial services clients drove the growth in the large market sector.
Digital Infrastructure increased $38.4 million, or 1.9%, to $2,030.8 million in the fiscal year ended June 30, 2018, compared to $1,992.4 million in the fiscal year ended June 30, 2017. Large clients led the demand for core traditional and software defined infrastructure solutions, particularly in the media, communications, and entertainment market as well as the energy and utilities sector.
47
Gross Margin
Fiscal Year Ended June 30, | Change | |||||||||||||
(in millions) | 2017 | 2018 | $ | % | ||||||||||
Gross margin | ||||||||||||||
Product gross margin | $ | 489.0 | $ | 480.2 | $ | (8.8 | ) | (1.8 | )% | |||||
Service gross margin | 96.9 | 104.8 | 7.9 | 8.2 | % | |||||||||
Gross margin | $ | 585.9 | $ | 585.0 | $ | (0.9 | ) | (0.2 | )% | |||||
Product gross margin % | 20.6 | % | 20.6 | % | — | % | ||||||||
Service gross margin % | 21.8 | % | 20.1 | % | (1.7 | )% | ||||||||
Total gross margin % | 20.8 | % | 20.5 | % | (0.3 | )% | ||||||||
Total gross margin decreased $0.9 million, or 0.2%, to $585.0 million for the fiscal year ended June 30, 2018, as compared to $585.9 million for the fiscal year ended June 30, 2017. As a percentage of total revenue, total gross margin decreased 30 basis points to 20.5% for the fiscal year ended June 30, 2018, compared to 20.8% of revenue for the fiscal year ended June 30, 2017.
Product gross margin decreased $8.8 million, or 1.8%, as a result of product revenue decline of 1.5%. Product gross margin as a percentage of product revenue was 20.6% for the fiscal year ended June 30, 2018, flat compared to 20.6% for the fiscal year ended June 30, 2017. Expanding margin driven by the net recognition of certain software subscription sales and data center technologies was fully offset by a decline in vendor incentive rebates.
Service gross margin increased $7.9 million, or 8.2%, attributable to the growth in service revenue of 17.3% partly offset by the decline in service gross margin as a percentage of services revenue, which decreased 170 basis points from 21.8% for the fiscal year ended June 30, 2017, to 20.1% for the fiscal year ended June 30, 2018. The decrease in gross margin percentage was due to a higher proportion of vendor partner service engagements to Presidio delivered services and continued investments in enhancing our managed services and cloud-related service offerings.
Operating Expenses
Fiscal Year Ended June 30, | Change | |||||||||||||
(in millions) | 2017 | 2018 | $ | % | ||||||||||
Operating expenses | ||||||||||||||
Selling expenses | $ | 276.2 | $ | 273.7 | $ | (2.5 | ) | (0.9 | )% | |||||
General and administrative | 105.0 | 101.8 | (3.2 | ) | (3.0 | )% | ||||||||
Selling, general and administrative costs | 381.2 | 375.5 | (5.7 | ) | (1.5 | )% | ||||||||
Transaction costs | 14.8 | 10.8 | (4.0 | ) | (27.0 | )% | ||||||||
Depreciation and amortization | 81.8 | 83.7 | 1.9 | 2.3 | % | |||||||||
Total operating expenses | $ | 477.8 | $ | 470.0 | $ | (7.8 | ) | (1.6 | )% | |||||
Selling, general and administrative expenses % of total revenue | 13.5 | % | 13.1 | % | (0.4 | )% | ||||||||
We define selling, general and administrative expenses (“SG&A”) as the sum of selling expenses and general and administrative expenses. SG&A decreased $5.7 million, or 1.5%, to $375.5 million during the fiscal year ended June 30, 2018, down from $381.2 million for the fiscal year ended June 30, 2017. The decline in SG&A was primarily attributed to a lower share-based compensation expense in the current year, as well as a decline in selling and administrative personnel costs partially offset by the addition of personnel from the acquisitions of Emergent and Red Sky. Due to the impact of these items, SG&A as a percent of revenue decreased by 40 basis points to 13.1% of revenue for the fiscal year ended June 30, 2018 compared to 13.5% of revenue for the fiscal year ended June 30, 2017.
Transaction costs primarily relate to professional fees and other costs incurred as a result of transaction-related activities. In the fiscal year ended June 30, 2018 transaction costs declined $4.0 million primarily due to lower expense related to certain stay and retention bonuses and lower expenses on transaction-related advisory and diligence fees compared to the fiscal year ended June 30, 2017.
48
Interest and Other (Income) Expense
Fiscal Year Ended June 30, | Change | |||||||||||||
(in millions) | 2017 | 2018 | $ | % | ||||||||||
Interest and other (income) expense | ||||||||||||||
Interest expense | $ | 72.5 | $ | 46.0 | $ | (26.5 | ) | (36.6 | )% | |||||
Loss on extinguishment of debt | 28.5 | 14.8 | (13.7 | ) | (48.1 | )% | ||||||||
Other (income) expense, net | 0.1 | (0.3 | ) | (0.4 | ) | n.m. | ||||||||
Total interest and other (income) expense | $ | 101.1 | $ | 60.5 | $ | (40.6 | ) | (40.2 | )% | |||||
Interest and other (income) expense decreased $40.6 million, or 40.2%, to $60.5 million for the fiscal year ended June 30, 2018, from $101.1 million in the fiscal year ended June 30, 2017 primarily due to lower interest expense resulting from lower outstanding debt, reduced interest rates on outstanding debt and smaller losses on extinguishment of debt.
The $26.5 million decline in interest expense for the fiscal year ended June 30, 2018 was primarily related to $22.0 million of lower interest expense associated with the Company’s Senior Notes and Senior Subordinated Notes that have been redeemed and retired, $5.1 million of lower interest expense associated with the Company’s term loan facility reflecting the impact of a lower average interest rate on our outstanding debt in the current period and a reduction in the outstanding principal due to voluntary prepayments, offset by $0.6 million of other interest items.
The $14.8 million loss on extinguishment of debt in the fiscal year ended June 30, 2018 resulted from the debt refinancing transactions in January 2018 which included the redemption of $125.0 million of Senior Notes, as well as $80.0 million in cumulative voluntary prepayments on the term loan facility during the fiscal year ended June 30, 2018.
Income Tax Expense (Benefit)
Fiscal Year Ended June 30, | Change | ||||||||||||
(in millions) | 2017 | 2018 | $ | % | |||||||||
Income before income taxes | $ | 7.0 | $ | 54.5 | $ | 47.5 | n.m. | ||||||
Income tax expense (benefit) | 2.6 | (79.7 | ) | (82.3 | ) | n.m. | |||||||
Net income | $ | 4.4 | $ | 134.2 | $ | 129.8 | n.m. | ||||||
Income tax benefit of $79.7 million was recognized for the fiscal year ended June 30, 2018, compared to income tax expense of $2.6 million for the year ended June 30, 2017. The effective tax rate for the fiscal year ended June 30, 2018 was (146.2)% compared to 37.1% in the fiscal year ended June 30, 2017. The change in the effective tax rate in the current year was impacted by the $94.1 million benefit due to the revaluation of deferred income tax assets and liabilities, or (172.6)%, the impact of the $3.7 million excess tax benefit on share-based compensation, or (6.7)%, and the impact of permanent differences including the TCJA which reduced our U.S. federal statutory rate from 35.0% to 28.1% for our fiscal year ending June 30, 2018.
Adjusted EBITDA
Adjusted EBITDA decreased $2.4 million, or 1.1%, to $223.7 million for the fiscal year ended June 30, 2018, from $226.1 million for the fiscal year ended June 30, 2017, reflecting gross margin percent contraction led by lower vendor incentive rebates and higher vendor partner service engagements at lower margins, partially offset by improved efficiency in SG&A as a percentage of revenue driven by lower personnel costs.
Adjusted Net Income
Adjusted Net Income increased $22.6 million, or 22.5%, to $123.0 million for the fiscal year ended June 30, 2018, from $100.4 million for the fiscal year ended June 30, 2017. The increase was attributable to the impact of the TCJA and lower interest expense in the fiscal year ended June 30, 2018.
49
Fiscal Year Ended June 30, 2017 Compared to Fiscal Year Ended June 30, 2016
Fiscal Year Ended June 30, | Change | |||||||||||||
(in millions) | 2016 | 2017 | $ | % | ||||||||||
Revenue | ||||||||||||||
Product | $ | 2,319.8 | $ | 2,373.2 | $ | 53.4 | 2.3 | % | ||||||
Service | 395.1 | 444.4 | 49.3 | 12.5 | % | |||||||||
Total revenue | 2,714.9 | 2,817.6 | 102.7 | 3.8 | % | |||||||||
Cost of revenue | ||||||||||||||
Product | 1,866.5 | 1,884.2 | 17.7 | 0.9 | % | |||||||||
Service | 307.8 | 347.5 | 39.7 | 12.9 | % | |||||||||
Total cost of revenue | 2,174.3 | 2,231.7 | 57.4 | 2.6 | % | |||||||||
Gross margin | 540.6 | 585.9 | 45.3 | 8.4 | % | |||||||||
Product gross margin | 453.3 | 489.0 | 35.7 | 7.9 | % | |||||||||
Service gross margin | 87.3 | 96.9 | 9.6 | 11.0 | % | |||||||||
Product gross margin % | 19.5 | % | 20.6 | % | 1.1 | % | ||||||||
Service gross margin % | 22.1 | % | 21.8 | % | (0.3 | )% | ||||||||
Total gross margin % | 19.9 | % | 20.8 | % | 0.9 | % | ||||||||
Operating expenses | ||||||||||||||
Selling expenses | 248.2 | 276.2 | 28.0 | 11.3 | % | |||||||||
General and administrative | 96.9 | 105.0 | 8.1 | 8.4 | % | |||||||||
Transaction costs | 20.6 | 14.8 | (5.8 | ) | (28.2 | )% | ||||||||
Depreciation and amortization | 76.0 | 81.8 | 5.8 | 7.6 | % | |||||||||
Total operating expenses | 441.7 | 477.8 | 36.1 | 8.2 | % | |||||||||
Selling, general and administrative expenses % of total revenue | 12.7 | % | 13.5 | % | 0.8 | % | ||||||||
Operating income | 98.9 | 108.1 | 9.2 | 9.3 | % | |||||||||
Interest and other (income) expense | ||||||||||||||
Interest expense | 81.9 | 72.5 | (9.4 | ) | (11.5 | )% | ||||||||
Loss on disposal of business | 6.8 | — | (6.8 | ) | (100.0 | )% | ||||||||
Loss on extinguishment of debt | 9.7 | 28.5 | 18.8 | 193.8 | % | |||||||||
Other (income) expense, net | 0.1 | 0.1 | — | — | % | |||||||||
Total interest and other (income) expense | 98.5 | 101.1 | 2.6 | 2.6 | % | |||||||||
Income before income taxes | 0.4 | 7.0 | 6.6 | n.m. | ||||||||||
Income tax expense | 3.8 | 2.6 | (1.2 | ) | (31.6 | )% | ||||||||
Net income (loss) | $ | (3.4 | ) | $ | 4.4 | $ | 7.8 | (229.4 | )% | |||||
Adjusted EBITDA | $ | 211.1 | $ | 226.1 | $ | 15.0 | 7.1 | % | ||||||
Adjusted Net Income | $ | 81.2 | $ | 100.4 | $ | 19.2 | 23.6 | % | ||||||
___________________________________
n.m. - not meaningful
50
Revenue
Fiscal Year Ended June 30, | Change | |||||||||||||
(in millions) | 2016 | 2017 | $ | % | ||||||||||
Revenue | ||||||||||||||
Product | $ | 2,319.8 | $ | 2,373.2 | $ | 53.4 | 2.3 | % | ||||||
Service | 395.1 | 444.4 | 49.3 | 12.5 | % | |||||||||
Total revenue | $ | 2,714.9 | $ | 2,817.6 | $ | 102.7 | 3.8 | % | ||||||
Total revenue increased $102.7 million, or 3.8%, to $2,817.6 million for the fiscal year ended June 30, 2017, compared to total revenue of $2,714.9 million for the fiscal year ended June 30, 2016. The increase in total revenue resulted from an increase in client demand across both Cloud and Security solutions along with a higher proportion of services as part of our solutions. Revenue growth during the period was also favorably impacted by seven months of incremental Netech sales. Furthermore, we saw an acceleration in the proportion of our solutions being delivered in the form of software subscriptions where we are an agent, accordingly the revenue associated with these solutions are recognized net of the related cost of sales in total revenue. Revenue growth was 7.8% adjusting for (i) software subscription solution offerings during the fiscal year ended June 30, 2017 to be on the same terms as comparable sales in the prior year, (ii) the exclusion of $32.8 million of revenue associated with our Atlantix business in the fiscal year ended June 30, 2016 prior to its disposition in October 2015, and (iii) purchase accounting adjustments.
Revenue from sales of product increased $53.4 million, or 2.3%, to $2,373.2 million for the fiscal year ended June 30, 2017, compared to $2,319.8 million for the fiscal year ended June 30, 2016. Higher customer demand for data center, mobility and security solutions was further enhanced by higher growth in third party support revenue, partly offset by the impact of net recognition of software subscription sales.
Revenue from sales of services increased $49.3 million, or 12.5%, to $444.4 million for the fiscal year ended June 30, 2017, as compared to $395.1 million for the fiscal year ended June 30, 2016, a result of increased demand for our professional, managed and cloud consulting services in connection with the greater complexity of solutions sold. The shift to more complex solution sales resulted in a 10.9% increase in utilized hours of our engineers and a 2.1% increase in the hourly bill rate charged to our customers.
Fiscal Year Ended June 30, | Change | |||||||||||||
(in millions) | 2016 | 2017 | $ | % | ||||||||||
Revenue by solution area | ||||||||||||||
Cloud | $ | 391.7 | $ | 501.1 | $ | 109.4 | 27.9 | % | ||||||
Security | 249.4 | 324.1 | 74.7 | 30.0 | % | |||||||||
Digital Infrastructure | 2,073.8 | 1,992.4 | (81.4 | ) | (3.9 | )% | ||||||||
Total revenue | $ | 2,714.9 | $ | 2,817.6 | $ | 102.7 | 3.8 | % | ||||||
Cloud revenue increased $109.4 million, or 27.9%, to $501.1 million in the fiscal year ended June 30, 2017, compared to $391.7 million for the fiscal year ended June 30, 2016, a result of strong demand in client engagements around multi-cloud and IT transformation, converged and hyper-converged infrastructure, data center modernization and associated services to support new multi-cloud infrastructure particularly with middle-market and large clients. In the middle market, growth was driven by both healthcare and education clients. Large market client growth was driven by demand from retail and media, communications and entertainment clients.
Security revenue increased $74.7 million, or 30.0%, to $324.1 million in the fiscal year ended June 30, 2017, compared to $249.4 million in the fiscal year ended June 30, 2016, driven by higher demand from customers as they look to stay ahead of increasingly complex cyber security threats which drove adoption of advanced security technologies and services across middle-market and large clients. In the middle market, information technology clients experienced strong growth as well as education clients. Manufacturing and transportation as well as media, communications, and entertainment customers drove the growth in the large market sector.
Digital Infrastructure revenue decreased $81.4 million, or 3.9%, to $1,992.4 million in the fiscal year ended June 30, 2017, compared to $2,073.8 million in the fiscal year ended June 30, 2016. Large clients experienced softening demand for core infrastructure solutions, particularly in the healthcare market as customers shifted focus to cloud and security solutions.
51
Gross Margin
Fiscal Year Ended June 30, | Change | |||||||||||||
(in millions) | 2016 | 2017 | $ | % | ||||||||||
Gross margin | ||||||||||||||
Product gross margin | $ | 453.3 | $ | 489.0 | $ | 35.7 | 7.9 | % | ||||||
Service gross margin | 87.3 | 96.9 | 9.6 | 11.0 | % | |||||||||
Gross margin | $ | 540.6 | $ | 585.9 | $ | 45.3 | 8.4 | % | ||||||
Product gross margin % | 19.5 | % | 20.6 | % | 1.1 | % | ||||||||
Service gross margin % | 22.1 | % | 21.8 | % | (0.3 | )% | ||||||||
Total gross margin % | 19.9 | % | 20.8 | % | 0.9 | % | ||||||||
Total gross margin increased $45.3 million, or 8.4%, to $585.9 million for the fiscal year ended June 30, 2017, as compared to $540.6 million for the fiscal year ended June 30, 2016, primarily a result of an increase in total revenue of 3.8% between periods and the sale of higher margin solutions. The growth in total gross margin was negatively impacted by $7.5 million of gross margin associated with our Atlantix business in the fiscal year ended June 30, 2016. As a percentage of total revenue, total gross margin increased 90 basis points to 20.8%for the fiscal year ended June 30, 2017, compared to 19.9% of revenue for the fiscal year ended June 30, 2016.
Product gross margin as a percentage of product revenue was 20.6% for the fiscal year ended June 30, 2017, a increase of 110 basis points from 19.5% for the fiscal year ended June 30, 2016. The increase in gross margin percentage was due to higher margin product offerings featuring mobility and security technologies, increased sales of third party support services and the impact of software subscription solution offerings recognized on a net basis.
Service gross margin as a percentage of services revenue decreased 30 basis points from 22.1% for the fiscal year ended June 30, 2016, to 21.8% for the fiscal year ended June 30, 2017. The decrease in gross margin percentage was due to expanded gross margins on managed services that were more than offset by a higher proportion of engagements that utilized third party services and investments in new cloud-related service offerings.
Operating Expenses
Fiscal Year Ended June 30, | Change | |||||||||||||
(in millions) | 2016 | 2017 | $ | % | ||||||||||
Operating expenses | ||||||||||||||
Selling expenses | $ | 248.2 | $ | 276.2 | $ | 28.0 | 11.3 | % | ||||||
General and administrative | 96.9 | 105.0 | 8.1 | 8.4 | % | |||||||||
Selling, general and administrative costs | 345.1 | 381.2 | 36.1 | 10.5 | % | |||||||||
Transaction costs | 20.6 | 14.8 | (5.8 | ) | (28.2 | )% | ||||||||
Depreciation and amortization | 76.0 | 81.8 | 5.8 | 7.6 | % | |||||||||
Total operating expenses | $ | 441.7 | $ | 477.8 | $ | 36.1 | 8.2 | % | ||||||
Selling, general and administrative expenses % of total revenue | 12.7 | % | 13.5 | % | 0.8 | % | ||||||||
SG&A increased $36.1 million, or 10.5%, to $381.2 million during the fiscal year ended June 30, 2017, up from $345.1 million for the fiscal year ended June 30, 2016. The growth in SG&A was primarily attributed to (1) $8.0 million of additional share-based compensation expense primarily associated with the IPO, (2) additional expenses associated with Netech’s employees, facilities and other expenses, (3) expense associated with investment in direct sales and sales support personnel within high-growth solution offerings including cloud and security, partly offset by the combination of lower incentive compensation to employees as a percent of gross margin and a $5.8 million reduction of expense associated with Atlantix. Due to the impact of these items, SG&A as a percent of revenue increased 0.8% to 13.5% of revenue for the fiscal year ended June 30, 2017 compared to 12.7% of revenue for the fiscal year ended June 30, 2016.
Transaction costs primarily relate to professional fees and other costs incurred as a result of transaction-related activities. In the fiscal year ended June 30, 2017, $14.8 million of transaction costs were incurred including acquisition-related expenses
52
of $7.4 million related to stay and retention bonuses primarily associated with accelerated vesting which resulted from the IPO, $5.2 million related to transaction-related advisory and diligence fees, $0.5 million related to transaction-related legal, accounting and tax fees and $1.7 million related to professional fees and expenses associated with debt refinancings. In the fiscal year ended June 30, 2016, $20.6 million of transaction costs were incurred including acquisition-related expenses of $3.0 million related to stay and retention bonuses, $1.1 million related to severance charges, $8.7 million related to transaction-related advisory and diligence fees, and $6.0 million related to transaction-related legal, accounting and tax fees primarily related to the acquisition of Netech and disposition of Atlantix.
Depreciation and amortization expense included in operating expenses increased $5.8 million, or 7.6%, to $81.8 million for the fiscal year ended June 30, 2017, from $76.0 million for the fiscal year ended June 30, 2016, primarily as a result of increased amortization expense associated with acquired intangible assets associated with the Netech Acquisition.
Interest and Other (Income) Expense
Fiscal Year Ended June 30, | Change | |||||||||||||
(in millions) | 2016 | 2017 | $ | % | ||||||||||
Interest and other (income) expense | ||||||||||||||
Interest expense | $ | 81.9 | $ | 72.5 | $ | (9.4 | ) | (11.5 | )% | |||||
Loss on disposal of business | 6.8 | — | (6.8 | ) | (100.0 | )% | ||||||||
Loss on extinguishment of debt | 9.7 | 28.5 | 18.8 | 193.8 | % | |||||||||
Other (income) expense, net | 0.1 | 0.1 | — | — | % | |||||||||
Total interest and other (income) expense | $ | 98.5 | $ | 101.1 | $ | 2.6 | 2.6 | % | ||||||
Interest and other (income) expense increased $2.6 million, or 2.6%, to $101.1 million for the fiscal year ended June 30, 2017, from $98.5 million in the fiscal year ended June 30, 2016. The net increase primarily related to losses on extinguishment of debt associated with (i) the redemption of $97.5 million of Senior Notes, (ii) the repurchase of all of the $111.8 million Subordinated Notes and (iii) the $100.2 million of voluntary prepayments on the term loan facility made over the course of the fiscal year ended June 30, 2017 using cash from operations and existing cash on hand, as well as the remaining proceeds from the IPO, offset by lower interest expense for the fiscal year ended June 30, 2017 associated with (a) debt refinancing resulting in a lower average interest rate on our outstanding debt in the current period, (b) a reduction in average outstanding principal balance, (c) the loss on disposal of business incurred in the fiscal year ended June 30, 2016 that did not reoccur in the fiscal year ended June 30, 2017, partially offset by an increase in floating interest rates.
Income Tax Expense
Fiscal Year Ended June 30, | Change | |||||||||||||
(in millions) | 2016 | 2017 | $ | % | ||||||||||
Income before income taxes | $ | 0.4 | $ | 7.0 | $ | 6.6 | n.m. | |||||||
Income tax expense | 3.8 | 2.6 | (1.2 | ) | (31.6 | )% | ||||||||
Net income (loss) | $ | (3.4 | ) | $ | 4.4 | $ | 7.8 | (229.4 | )% | |||||
Income tax expense of $2.6 million was recognized for the fiscal year ended June 30, 2017, compared to income tax expense of $3.8 million for the year ended June 30, 2016. The effective tax rate for the fiscal year ended June 30, 2017 was 37.1% compared to 950.0% in the fiscal year ended June 30, 2016 due to higher pre-tax book income, lower permanent tax differences and a smaller impact of the revaluation of deferred tax balances related to the state effective tax rate change compared to prior year. The effective tax rate differed from the U.S. federal statutory rate primarily due to state income taxes and non-deductible meals and entertainment expenses which is offset by the favorable stock compensation excess benefit deduction.
Adjusted EBITDA
Adjusted EBITDA increased $15.0 million, or 7.1%, to $226.1 million for the fiscal year ended June 30, 2017, from $211.1 million for the fiscal year ended June 30, 2016, reflecting improved Adjusted EBITDA margins during the year driven by gross margin percent expansion, offset by the net impact of sales investments we have made in high-growth areas of our business to drive future growth.
53
Adjusted Net Income
Adjusted Net Income increased $19.2 million, or 23.6%, to $100.4 million for the fiscal year ended June 30, 2017, from $81.2 million for the fiscal year ended June 30, 2016, resulting from the growth in Adjusted EBITDA along with the impact of lower interest expense in the period, largely associated with the repurchase and redemption of our Senior and Subordinated Notes as part of the IPO, as we continued our focus on deleveraging the business.
54
Liquidity and Capital Resources
We fund our operations and capital expenditures through a combination of internally generated cash from operations and from borrowings under our various debt facilities. We believe that our current sources of funds will be sufficient to fund our cash operating requirements for at least the next year. In addition, we believe that, despite the uncertainty of future macroeconomic conditions, we have adequate sources of liquidity and funding available to meet our long-term needs. These long-term needs primarily include meeting debt service requirements, working capital requirements and capital expenditures. We may also pursue strategic acquisition opportunities that may impact our future cash requirements.
There are a number of factors that may negatively impact our available sources of funds in the future including the ability to generate cash from operations and borrow on debt facilities. The amount of cash generated from operations is dependent upon factors such as the successful execution of our business strategies and general economic conditions. The amount of cash available for borrowings under our various debt facilities is largely dependent on our ability to maintain sufficient collateral and general financial conditions in the marketplace.
Historical Sources and Uses of Cash
The following table summarizes our sources and uses of cash over the periods indicated (in millions):
Fiscal Year Ended June 30, | |||||||||||
2016 | 2017 | 2018 | |||||||||
Net cash provided by (used in) | |||||||||||
Operating activities | $ | 86.1 | $ | 51.0 | $ | 192.0 | |||||
Investing activities | (322.0 | ) | (101.6 | ) | (162.1 | ) | |||||
Net borrowings (repayments) on floor plan | 20.9 | 41.6 | (54.3 | ) | |||||||
Other financing activities | 159.7 | 3.5 | 33.9 | ||||||||
Financing activities | 180.6 | 45.1 | (20.4 | ) | |||||||
Net increase (decrease) in cash and cash equivalents | $ | (55.3 | ) | $ | (5.5 | ) | $ | 9.5 | |||
Operating Activities
Net cash flows from operating activities consist of net income (loss) adjusted for noncash items such as: depreciation and amortization of property and equipment and intangible assets, deferred income taxes, share-based compensation, losses on extinguishments of debt or disposals of businesses and for changes in net working capital assets and liabilities. The cash impact of changes in deferred income taxes primarily relates to temporary differences between the carrying amounts of assets and liabilities for financial reporting purposes and the amounts used for income tax purposes. Generally, the most significant factor relates to nondeductible book amortization expense associated with intangible assets. The timing between the conversion of our billed and unbilled receivables into cash from our customers and disbursements to our vendors is the primarily driver of changes in our working capital. As described below, we also consider free cash flow (which is a non-GAAP measure) as a tool to review our cash flow generation, inclusive of all working capital components.
Our net cash provided by (used in) operating activities for our historical periods includes the impact of tax-deductible goodwill and intangible assets resulting from certain historical acquisitions. The reductions in current tax expense associated with the tax-deductible goodwill and intangible assets were (in millions):
Fiscal Year Ended June 30, | |||||||||||
2016 | 2017 | 2018 | |||||||||
Impact of tax deductible goodwill and intangible assets | $ | 8.6 | $ | 12.0 | $ | 10.5 | |||||
Fiscal year ended June 30, 2018: Net cash provided by operating activities for the fiscal year ended June 30, 2018 was $192.0 million. This was primarily attributed to a net income of $134.2 million adjusted for: $74.4 million of intangible amortization expense, $15.1 million of total property and equipment depreciation expense, $4.5 million of amortization of debt issuance costs, $14.8 million of losses on extinguishment of debt, $7.0 million of share-based compensation, partially offset by a $35.3 million decrease in our working capital components and other long-term assets, as well as a $93.0 million deferred income tax benefit.
55
The net decrease in our working capital components (including related non-current assets and liabilities) was primarily driven by higher outstanding customer receivables associated with purchases on the accounts payable – floor plan facility (presented as a change in financing cash flows).
Fiscal year ended June 30, 2017: Net cash provided by operating activities for the fiscal year ended June 30, 2017 was $51.0 million. This was primarily attributed to a net income of $4.4 million adjusted for: $73.6 million of intangible amortization expense, $13.6 million of total property and equipment depreciation expense, $6.5 million of amortization of debt issuance costs, $28.5 million of losses on extinguishment of debt, $10.2 million of share-based compensation, partially offset by a $66.9 million increase in our working capital components and other long-term assets, as well as a $17.6 million deferred income tax benefit. The net increase in our working capital components (including related non-current assets and liabilities) was primarily driven by higher outstanding customer receivables associated with purchases on the accounts payable – floor plan facility (presented as a change in financing cash flows).
Fiscal year ended June 30, 2016: Net cash provided by operating activities for the fiscal year ended June 30, 2016 was $86.1 million. This was primarily attributed to a net loss of $3.4 million adjusted for: $67.2 million of intangible amortization expense, $14.5 million of total property and equipment depreciation expense, $9.7 million noncash loss on extinguishment of debt, $6.8 million noncash loss on disposition of the Atlantix business, $7.6 million of amortization of deferred issuance costs, offset by a $19.6 million deferred income tax benefit. In addition, operating cash flows were favorably impacted by a net $4.6 million decrease in our working capital components. The net decrease in our working capital components was primarily driven by the increase in accounts payable and accrued expenses associated with our purchases from vendors exceeding the increase in outstanding customer receivables associated with revenue growth.
Investing Activities
Net cash flows from investing activities consist of the cash flows associated with acquisitions and/or dispositions, leasing activities and capital expenditures. During the periods presented all purchases of property and equipment were of a normal recurring nature. With respect to our leasing activities, we reduce our financial exposure and increase liquidity by partnering with various third-party lenders and discounting the customer lease financing receivables. This results in us carrying both a lease asset and an offsetting financial liability to the lenders on our balance sheet. Accordingly, the investment in leased assets appears in our investing activities and the funding we receive from third-party lenders is recognized in our financing activities, discussed below.
Fiscal year ended June 30, 2018: Net cash used in investing activities for the fiscal year ended June 30, 2018 was $162.1 million. Cash was primarily used for additional investments in sales-type and direct financing leases of $108.3 million in support of our leasing business, $42.8 million used to acquire the Emergent and Red Sky businesses and the purchase of property and equipment of $14.4 million, partially offset by proceeds received from our leasing assets of $4.1 million.
Fiscal year ended June 30, 2017: Net cash used in investing activities for the fiscal year ended June 30, 2017 was $101.6 million. Cash was primarily used for additional investments in sales-type and direct financing leases of $100.1 million in support of our business and the purchase of property and equipment of $11.4 million, partially offset by proceeds received from our leasing assets of $9.8 million.
Fiscal year ended June 30, 2016: Net cash used in investing activities for the fiscal year ended June 30, 2016 was $322.0 million. This use of cash was primarily the result of $251.3 million used to acquire the Sequoia and Netech businesses, offset by $36.3 million of cash proceeds received from the disposition of Atlantix. Cash was also used for additional investments in sales-type and direct financing leases in support of our business of $95.4 million and the purchases of property and equipment of $16.4 million.
Financing Activities
Net cash flows from financing activities primarily consists of cash activity associated with our capitalization, including debt and equity activity, cash flow associated with discounting client leases and activity on our accounts payable – floor plan facility.
Fiscal year ended June 30, 2018: Net cash used in financing activities for the fiscal year ended June 30, 2018 was $20.4 million, comprised of $54.3 million of net repayments on the accounts payable – floor plan facility and $33.9 million of other financing activities. The $33.9 million provided by other financing activities was primarily the result of $114.6 million in proceeds from discounting financing receivables offset by $80.0 million in repayments on term loans.
56
Fiscal year ended June 30, 2017: Net cash provided by financing activities for the fiscal year ended June 30, 2017 was $45.1 million, comprised of $41.6 million of net borrowings on the accounts payable – floor plan facility and $3.5 million of other financing activities. The $3.5 million of other financing activities was primarily the result of $247.5 million of proceeds from the initial public offering and $108.6 million in proceeds from discounting financing receivables offset by $5.0 million in repayments on the receivables securitization facility, $230.8 million in repurchases and redemptions of our Senior and Subordinated Notes including redemption premiums and debt extinguishment costs, $105.7 million in repayments on term loans and $5.0 million of retirements of discounted financing receivables.
Fiscal year ended June 30, 2016: Net cash provided by financing activities for the fiscal year ended June 30, 2016 was $180.6 million consisted of $20.9 million of net borrowings on the accounts payable – floor plan facility and $159.7 million of other financing activities. The other financing activities was primarily the result of net borrowings on term loans of $150.4 million to fund the Sequoia and Netech acquisitions, offset by $66.3 million of cash outflows associate with repayments of the Senior Notes and the Subordinated Notes. Additional cash provided by financing activities includes $86.4 million in proceeds from discounting financing receivables, offset by $10.3 million of payments for future consideration associated with prior acquisitions.
Liquidity
We generally fund our short- and long-term liquidity needs through the use of cash flows from operations, utilization of the extended payment terms on our accounts payable-floor plan facility and the available credit on our revolving credit facility, accounts receivable securitization facility and long-term debt.
In addition to financial information presented in accordance with U.S. GAAP, such as cash provided by or used in operating, investing and financing activities, our management regularly monitors certain non-GAAP liquidity measures to monitor performance. We believe that the most important of those non-GAAP measures include available liquidity, net debt, net working capital ratio and free cash flow. Our non-GAAP measures should be considered in addition to, not as a substitute for, or superior to, financial measures calculated in accordance with U.S. GAAP. They are not measurements of our financial performance under U.S. GAAP and should not be considered as alternatives to information presented on our consolidated statements of cash flows or any other performance measures derived in accordance with U.S. GAAP and may not be comparable to other similarly titled measures of other businesses. These non-GAAP measures have limitations as analytical tools. You should not consider non-GAAP measures in isolation or as a substitute for analysis of our operating results as reported under U.S. GAAP, and they include adjustments for items that may occur in future periods.
(in millions) | June 30, 2017 | June 30, 2018 | |||||
Available liquidity | $ | 251.5 | $ | 333.2 | |||
Net debt | $ | 724.1 | $ | 649.6 | |||
Net working capital ratio | 1.00x | 1.02x | |||||
Free cash flow | $ | 94.0 | $ | 122.8 | |||
Available liquidity – As previously discussed, we fund our short-term cash flow requirements through a combination of cash on hand, cash flows generated from operations and borrowings under our various debt facilities. We calculate our available liquidity as a sum of cash and cash equivalents from our consolidated balance sheet plus the amount available and unutilized on our revolving and accounts receivable securitization facilities.
The following table presents our calculation of available liquidity as of June 30, 2018 and 2017 (in millions):
June 30, 2017 | June 30, 2018 | ||||||
Cash and cash equivalents | $ | 27.5 | $ | 37.0 | |||
Availability under the February 2015 Revolver | 48.5 | 48.2 | |||||
Availability under the Receivables Securitization Facility | 175.5 | 248.0 | |||||
Available liquidity | $ | 251.5 | $ | 333.2 | |||
Available liquidity increased from $251.5 million at June 30, 2017 to $333.2 million at June 30, 2018 primarily as a result of increased availability under our Receivables Securitization Facility associated with an increase in receivables used as collateral.
57
The following table presents amounts outstanding under our primary sources of liquidity as of June 30, 2018 and 2017 (in millions):
June 30, 2017 | June 30, 2018 | ||||||
Cash and cash equivalents | $ | 27.5 | $ | 37.0 | |||
Accounts payable - floor plan facility | $ | 264.9 | $ | 210.6 | |||
Revolving credit facility | $ | — | $ | — | |||
Receivables Securitization Facility | — | — | |||||
Term loan facility, due February 2022 | 626.6 | — | |||||
Term loan facility, due February 2024 | — | 686.6 | |||||
Senior Notes, 10.25% due February 2023 | 125.0 | — | |||||
Total long-term debt | $ | 751.6 | $ | 686.6 | |||
Net debt – We have a substantial amount of indebtedness, largely related to the capitalization of the Company in connection with the Presidio Acquisition. We believe the change in net debt provides information about our ability to generate free cash flows and de-lever our company. We define net debt as the total principal of debt outstanding, excluding discounts and issuance costs less cash and cash equivalents. The following table presents our calculation of net debt as of June 30, 2018 and 2017 (in millions):
June 30, 2017 | June 30, 2018 | ||||||
Total long-term debt | $ | 751.6 | $ | 686.6 | |||
Cash and cash equivalents | (27.5 | ) | (37.0 | ) | |||
Net debt | $ | 724.1 | $ | 649.6 | |||
Net debt decreased from $724.1 million at June 30, 2017 to $649.6 million at June 30, 2018 primarily as a result of $80 million of voluntary prepayments on our term loan facility generated from our free cash flow in the period, partly offset by the impact of the $42.8 million of cash paid to acquire Emergent and Red Sky.
Net working capital ratio – We experience periodic changes in our net working capital, defined as current assets from our consolidated balance sheet minus current liabilities from our consolidated balance sheet excluding cash and cash equivalents and current maturities of long-term debt. We define net working capital ratio as our current assets excluding cash and cash equivalents divided by current liabilities excluding current maturities of long-term debt.
Free cash flow – We define free cash flow as our net cash provided by operating activities adjusted to include: (i) the impact of net borrowings (repayments) on the floor plan facility, (ii) the aggregate net cash impact of our leasing business and (iii) the purchases of property and equipment.
The following table presents the aggregate net cash impact of our leasing business for the fiscal years ended June 30, 2018 and 2017 (in millions):
Fiscal Year Ended June 30, | |||||||
2017 | 2018 | ||||||
Additions of equipment under sales-type and direct financing leases | $ | (100.1 | ) | $ | (108.3 | ) | |
Proceeds from collection of financing receivables | 9.8 | 4.1 | |||||
Additions to equipment under operating leases | (2.0 | ) | (1.6 | ) | |||
Proceeds from disposition of equipment under operating leases | 1.5 | 0.7 | |||||
Proceeds from the discounting of financing receivables | 108.6 | 114.6 | |||||
Retirements of discounted financing receivables | (5.0 | ) | (10.0 | ) | |||
Aggregate net cash impact of leasing business | $ | 12.8 | $ | (0.5 | ) | ||
58
The following table presents reconciliation of net cash provided by operating activities to free cash flow for the fiscal years ended June 30, 2018 and 2017 (in millions):
Fiscal Year Ended June 30, | ||||||||
2017 | 2018 | |||||||
Net cash provided by operating activities | $ | 51.0 | $ | 192.0 | ||||
Adjustments to reconcile to free cash flow: | ||||||||
Net change in accounts payable — floor plan | 41.6 | (54.3 | ) | |||||
Aggregate net cash impact of leasing business | 12.8 | (0.5 | ) | |||||
Purchases of property and equipment | (11.4 | ) | (14.4 | ) | ||||
Total adjustments | 43.0 | (69.2 | ) | |||||
Free cash flow | $ | 94.0 | $ | 122.8 | ||||
As of June 30, 2018 the Company had the following sources of liquidity:
Cash Flow From Operations: We have historically generated positive cash flows from operations. This source of cash has historically provided sufficient funding for operations, managing working capital needs and servicing of long-term debt. We believe that, despite the uncertainty of future macroeconomic conditions, cash flow from operations will continue to provide us with an adequate source of funding for use in meeting our short-term liquidity needs.
Accounts Payable – Floor Plan Facility: We have an agreement with a financial institution that provides our indirect wholly-owned subsidiary with funding for discretionary inventory purchases from approved vendors. Payables are due within 90 days and are non-interest bearing provided they are paid when due. We use the extended payment terms of this facility to reduce the working capital needs associated with the timing of vendor payments and the collection of customer receivables. In accordance with the agreement, the financial institution has been granted a senior security interest in the indirect wholly-owned subsidiary’s inventory purchased under the agreement and accounts receivable arising from the sale thereof. Payments on the facility are guaranteed by Presidio LLC and subsidiaries. As of June 30, 2018, the aggregate availability for purchases under the floor plan facility is the lesser of $325.0 million or the liquidation value of the pledged assets. The balances outstanding under the accounts payable – floor plan facility were $210.6 million as of June 30, 2018.
Receivables Securitization Facility: We maintain an accounts receivables securitization facility which provides us with short-term liquidity needs (“Receivables Securitization Facility”). The Receivables Securitization Facility agreement is with our wholly-owned non-operating subsidiary, Presidio Capital Funding, LLC (“PCF”). To obtain accounts receivable for use in the Receivables Securitization Facility, PCF purchases the trade receivables of PNS on a continuous basis and then grants, without recourse, a senior undivided security interest in the pooled receivables to the administrative agent of the facility, PNC Bank, while maintaining a subordinated undivided security interest in any over-collateralization of the pooled receivables. Presidio LLC services the receivables for PCF at market rates and accordingly, no servicing asset or liability has been recorded. Upon and after the sale or contribution of the accounts receivables to PCF, such accounts receivables are assets of PCF and, as such, are not available to our creditors or its other subsidiaries.
The committed amount of the Receivables Securitization Facility is $250.0 million and the maturity date is November 28, 2020. The borrowing capacity on the facility is subject to a borrowing limit that is based on eligible receivables, as defined in the securitization agreements. Interest is calculated daily but payable monthly based on a Eurodollar borrowing rate plus a utilized program fee of 1.40%. We also incur a commitment fee of 0.50% or 0.40%, depending on utilization. At June 30, 2018, the interest rates was 3.49% and the commitment fee was 0.50%.
Accounts receivables purchased by PCF are subject to the satisfaction of customary conditions, including the absence of a termination event and the accuracy of representations and warranties. The obligations under the facility are secured by PCF’s right, title and interest in the pool of receivables and certain related assets. The facility requires that Presidio LLC comply with a minimum fixed charge coverage ratio of 1.0 to 1.0 if its excess liquidity, as defined in the facility, falls below $35.0 million for at least five consecutive days. We were in compliance with this covenant as of June 30, 2018.
There were no borrowings outstanding under the facility as of June 30, 2018. We had $248.0 million available under the facility based on the collateral available as of June 30, 2018.
February 2015 Credit Facility: On February 2, 2015, Presidio LLC and PNS as borrowers (the “Borrowers”), entered into a senior secured financing facility (the “February 2015 Credit Agreement”), which provided a term loan (“February 2015
59
Term Loan”) and a revolving credit facility (“February 2015 Revolver”) (collectively referred to as the “February 2015 Credit Facilities”).
In accordance with the terms of the February 2015 Credit Agreement, the Borrowers may request one or more incremental term loan facilities and/or increase commitments under the February 2015 Revolver in an aggregate amount of up to the sum of $125.0 million plus additional amounts so long as, (i) in the case of loans under additional credit facilities secured by liens (other than to the extent such liens are expressly subordinated in writing to the liens on the collateral securing the February 2015 Credit Agreement), the consolidated net first lien secured leverage ratio would be no greater than 3.75 to 1.00 and (ii) in the case of loans under additional credit facilities that would not be included in the computation of the consolidated net first lien secured leverage ratio, the consolidated net secured leverage ratio would be no greater than 4.25 to 1.00, subject to certain conditions and receipt of commitments by existing or additional lenders.
The Borrowers may voluntarily repay outstanding loans under the February 2015 Credit Agreement at any time, without prepayment premium or penalty except in connection with a repricing event, subject to customary “breakage” costs with respect to LIBOR rate loans.
All obligations under the February 2015 Credit Agreement are unconditionally guaranteed by the Borrowers and each of their existing and future direct and indirect, wholly-owned domestic subsidiaries, subject to certain exceptions. The obligations are secured by substantially all assets of the Borrowers and each guarantor, subject to certain exceptions. The February 2015 Credit Agreement is subject to an inter-creditor agreement with the accounts payable—floor plan facility that provides that certain security interests in assets securing the February 2015 Credit Agreement shall be subordinate to the security interests on the collateral securing the obligations under the accounts payable—floor plan facility described above.
The February 2015 Credit Agreement contains certain customary affirmative covenants, negative covenants and events of default. The negative covenants in the February 2015 Credit Agreement include, among other things, limitations (subject in each case to exceptions) on the ability of the Borrowers, the guarantors and their restricted subsidiaries to:
• | incur additional debt or issue certain preferred shares; |
• | create liens on certain assets; |
• | make certain loans or investments (including acquisitions); |
• | pay dividends on or make distributions in respect of capital stock or make other restricted payments; |
• | consolidate, merge, sell or otherwise dispose of all or substantially all of our assets; |
• | sell assets; |
• | enter into certain transactions with affiliates; |
• | enter into sale-leaseback transactions; |
• | change lines of business; |
• | restrict dividends from our subsidiaries or restrict liens; |
• | change our fiscal year; and |
• | modify the terms of certain debt or organizational agreements. |
February 2015 Term Loan: Borrowings under the February 2015 Term Loan bear interest at a rate equal to, at the Borrowers’ option, either:
(a) | the LIBOR rate determined by reference to the costs of funds for Eurodollar deposits for the interest period relevant to such borrowing, adjusted for certain additional costs, subject to a 1.00% floor in the case of term loans, plus an applicable margin; or |
(b) | the base rate determined by reference to the highest of: |
(i) | the federal funds rate plus 0.50%, |
(ii) | the prime rate, or |
(iii) | the one-month adjusted LIBOR plus 1.00%; in each case, plus an applicable margin. |
60
The applicable margin for term loans is 2.75% in the case of LIBOR rate borrowings and 1.75% in the case of base rate borrowings as of June 30, 2018, resulting from the Company's Incremental Assumption Agreement and Amendment No. 6, entered into on January 5, 2018.
As a result of the Company's prepayments, $11.2 million of amortization payments are due prior to the maturity of the February 2015 Term Loan.
The February 2015 Credit Agreement requires the Borrowers to prepay outstanding term loan borrowings, subject to certain exceptions, with:
• | 75% (which percentage will be reduced to 50% if the consolidated net first lien secured leverage ratio is less than or equal to 3.00 to 1.00, reduced to 25% if the consolidated net first lien secured leverage ratio is less than or equal to 2.50 to 1.00 and reduced to 0% if the consolidated net first lien secured leverage ratio is less than or equal to 2.00 to 1.00) of the Borrowers’ annual excess cash flow, as defined under the February 2015 Credit Agreement; |
• | 100% of the net cash proceeds of all non-ordinary course asset sales, other dispositions of property or certain casualty events, in each case subject to certain exceptions and provided that we may (a) reinvest within twelve months or (b) commit to reinvest those proceeds within 12 months and so reinvest such proceeds within 18 months in assets to be used in the business, or certain other permitted investments; and |
• | 100% of the net cash proceeds of any issuance or incurrence of debt, other than proceeds from debt permitted under the February 2015 Credit Agreement. |
For the fiscal year ended June 30, 2018, there were no prepayments required based on the Borrowers’ calculation of annual excess cash flow.
February 2015 Revolver: The February 2015 Revolver provides a $50.0 million borrowing capacity with a $25.0 million sublimit available for letters of credit and a swingline loan sub-facility, maturing February 2, 2020. Borrowings under the February 2015 Revolver bear interest at a rate equal to, at the Borrowers’ option, either:
(a) | the LIBOR rate determined by reference to the costs of funds for Eurodollar deposits for the interest period relevant to such borrowing, adjusted for certain additional costs, subject to a 1.00% floor in the case of term loans; or |
(b) | the base rate determined by reference to the highest of: |
(i) | the federal funds rate plus 0.50%, |
(ii) | the prime rate, or |
(iii) | the one-month adjusted LIBOR plus 1.00%, in each case, plus an applicable margin. |
The applicable margin for revolving loans is 4.25% in the case of LIBOR rate borrowings and 3.25% in the case of base rate borrowings (with margins for revolving loans subject to certain reductions based on a net first lien leverage ratio).
In addition to paying interest on outstanding principal under the February 2015 Revolver, the Borrowers are required to pay a commitment fee equal to 0.50% (subject to a step down to 0.375% based on a net first lien leverage ratio) in respect of the unutilized commitments under the facility. The Borrowers are also required to pay customary agency fees as well as letter of credit participation fees computed at a rate per annum equal to the applicable margin for LIBOR rate borrowings on the dollar equivalent of the daily stated amount of outstanding letters of credit, plus such letter of credit issuer’s customary documentary and processing fees and charges and customary fronting fees.
All borrowings under the February 2015 Revolver are subject to the satisfaction of customary conditions, including the absence of a default and the accuracy of representations and warranties.
The February 2015 Revolver requires that Presidio Holdings, after an initial grace period and subject to a testing threshold, comply on a quarterly basis with a maximum first lien net senior secured leverage ratio. The testing threshold is met if, at the end of any applicable fiscal quarter, the sum of outstanding exposure under the February 2015 Revolver exceeds 30% of the outstanding commitments under the revolving credit facility at such time.
61
As of June 30, 2018, there were no outstanding borrowings on the February 2015 Revolver and there were $1.8 million in letters of credit outstanding. We are in compliance with the covenants and have $48.2 million available for borrowings under the facility.
Contractual Obligations
The following table presents a summary of our contractual obligations as of June 30, 2018 (in millions):
Payments Due by Period | |||||||||||||||||||
Total | <1 Year | 1-3 Years | 4-5 Years | >5 Years | |||||||||||||||
Term loan facility(1) | $ | 686.6 | $ | — | $ | — | $ | 7.6 | $ | 679.0 | |||||||||
Interest on term loan facility(2) | 197.5 | 35.4 | 70.9 | 70.6 | 20.6 | ||||||||||||||
Operating leases(3) | 55.5 | 12.0 | 20.7 | 12.4 | 10.4 | ||||||||||||||
Total | $ | 939.6 | $ | 47.4 | $ | 91.6 | $ | 90.6 | $ | 710.0 | |||||||||
___________________________________
(1) | Includes future principal on long-term borrowings through scheduled maturity dates. |
(2) | Interest payments for the variable rate term loan were calculated using interest rates as of June 30, 2018. Excluded from these amounts are the amortization of debt issuance and other costs related to indebtedness. |
(3) | Includes the minimum lease payments for non-cancelable operating leases used in our operations. Excluded from these amounts are applicable taxes, insurance and common area maintenance charges which we are obligated to pay per the terms of our lease agreements. |
Purchase obligations are defined as an agreement to purchase goods or services which is enforceable and legally binding and specify all significant terms, including fixed or minimum quantities to be purchased, fixed minimum or variable price provisions and approximate timing of the transaction. Purchase orders and authorizations that we issue involve no firm commitment from either party and as such are excluded from the above table. We have no enforceable and legally binding purchase obligations.
Commitments and Contingencies
In the normal course of business, the Company is subject to certain claims and assessments that arise in the ordinary course of business. The Company records a liability when the Company believes that it is both probable that a loss has been incurred and the amount can be reasonably estimated. Significant judgment is required to determine the outcome and the estimated amount of a loss related to such matters. Management believes that there are no claims or assessments outstanding which would materially affect the consolidated results of operations or financial position of the Company.
62
Off-Balance Sheet Arrangements
We had $1.8 million and $1.5 million of outstanding letters of credit on our revolving credit facility as of June 30, 2018 and June 30, 2017, respectively. We have no other off-balance sheet arrangements that have or are reasonably likely to have a material current or future effect on our financial condition, changes in financial condition, revenue or expenses, results of operations, liquidity, capital expenditures or capital resources.
Dividends
During the year ended June 30, 2018, we did not declare or pay any distributions to stockholders. However, on September 5, 2018, our Board of Directors declared an initial quarterly dividend of $0.04 per share of common stock, payable on October 5, 2018 to stockholders of record as of the close of business on September 26, 2018.
We intend to declare quarterly dividends to holders of common stock. However, any future declaration and payment of future dividends to holders of common stock will be at the discretion of the Board of Directors and will depend on many factors, including our financial condition, earnings, capital requirements, level of indebtedness, statutory and contractual restrictions applying to the payment of dividends, and other considerations that the Board of Directors deems relevant. Presidio, Inc., as a holding company, has no direct operations and our ability to pay dividends is limited to our available cash on hand and any funds received from subsidiaries. The terms of the indebtedness may restrict Presidio, Inc.’s ability to pay dividends, or may restrict the subsidiaries from paying dividends to Presidio, Inc. Under Delaware law, dividends may be payable only out of surplus, which is net assets minus liabilities and capital, or, if there is no surplus, out of net profits for the fiscal year in which the dividend is declared and/or the preceding fiscal year.
Critical Accounting Policies and Estimates
The preparation of financial statements in accordance with generally accepted accounting principles in the United States requires management to make use of certain estimates and assumptions that affect the reported amounts of assets and liabilities and disclosure of contingent assets and liabilities at the date of the financial statements and the reported amounts of revenue and expenses during the reported periods. We base our estimates on historical experience and on various other assumptions that we believe are reasonable under the circumstances, the results of which form the basis for making judgments about carrying values of assets and liabilities that are not readily apparent from other sources. Actual results could differ from those estimates.
In Note 1 to the consolidated financial statements included in Item 8 of this Form 10-K, we include a discussion of the significant accounting policies used in the preparation of our consolidated financial statements. We believe that the items included in Note 1 are the most critical accounting policies and estimates that involved significant judgment as we prepared our financial statements. We consider an accounting policy or estimate to be critical if the policy or estimate requires assumptions to be made that were uncertain at the time they were made and if changes in these assumptions could have a material impact on our financial condition or results of operations.
Revenue Recognition
Our revenue is generally derived from the sale of IT-solutions to customers. Incorporated in those solutions are third-party products including hardware, software and support service contracts and the sale of our services and third-party services. Revenue is generally recognized when all of the following criteria have been met:
• | Persuasive evidence of an arrangement exists. Contracts, customer purchase orders, and statements of work are generally used to determine the existence of an arrangement. |
• | Delivery has occurred. Shipping documents and customer acceptance, when applicable, are used to verify product delivery and hours incurred are used to verify services are performed. |
• | The fee is fixed or determinable. We assess whether the fee is fixed or determinable based on the payment terms associated with the transaction and whether the sales price is subject to refund or adjustment. |
• | Collectability is reasonably assured. We assess collectability based primarily on the creditworthiness of the customer as determined by credit checks and analysis, as well as the customer’s payment history. |
63
As a provider of third-party products and services, we consider the principal versus agent accounting guidance to determine if we are the primary obligor in the arrangement and if revenue should be recognized gross or net of the associated costs. Applying the principal versus agent accounting guidance is a matter of judgment based on the consideration of several factors and indicators.
Our solutions may consist of a combination of deliverables including third-party products along with services delivered by the Company and/or third-parties. These types of arrangements generally contain multiple revenue generating activities or elements where delivery or performance may occur at different times or over different periods of time as discussed in the policies below. For arrangements that contain multiple elements, the total consideration of the arrangement is allocated to the deliverables which qualify as separate units of accounting. Generally, each of the above items qualifies as separate units of accounting since they provide stand-alone value to the customer and the delivery or performance of any undelivered items is considered probable and substantially in our control. The allocation of the arrangement consideration to the separate units of accounting is based on the relative selling price of each deliverable. The relative selling price is determined based on an assessment of the cost plus a reasonable margin. The identification of the deliverables, the separate units of accounting, the estimated selling prices and the allocation of the arrangement require management estimates and judgment. We use historical sales and profitability data in making these estimates and judgments. Additionally, with the exception of our managed service offerings that are delivered over a period up to five years, the majority of our sales are completed within a relatively short time period that reduces the significance of those estimates and judgments that span across reporting periods. The allocation of the arrangement consideration to the deliverables is determined at the inception of the arrangement.
Product Revenue
Revenue for hardware and software – Revenue from the sale of third-party hardware and third-party software products is generally recognized on a gross basis with the sales price to the customer recorded as revenue and the acquisition cost of the product recorded as cost of revenue, net of vendor rebates. Revenue is recognized when the title and risk of loss are passed to the customer. Hardware and software items can be delivered to customers in a variety of ways including drop-shipped by our vendor or supplier, shipped from our warehouse or via electronic delivery for software licenses. In certain cases, our solutions include the sale of software subscriptions where we are the agent in the arrangement with the customer and recognize the related revenue at the date of sale, net of the related cost of revenue. As we are under no obligation to perform additional services, such as post-customer support or upgrades, revenue is recognized at the time of sale as opposed to over the life of the software license. We maintain an estimate for sales returns and credit losses based on historical experience. Our vendor partners provide warranties to our customers on equipment sold and as such we have not estimated a warranty reserve or deferred revenue for potential warranty work.
Revenue for third-party support service contracts – Revenue from the sale of third-party support service contracts is recognized net of the related cost of revenue. In a third-party support service contract, all services are performed by third-party providers and as a result, we concluded that it is acting as an agent and recognizes revenue on a net basis at the date of sale with revenue being equal to the gross margin on the transaction. As we are under no obligation to perform additional services, revenue is recognized at the time of sale as opposed to over the life of the third-party support agreement.
Revenue from leasing arrangements – Revenue from information technology products leased to customers is based on the type of lease entered into with each customer. Each lease is classified as either a direct financing lease, sales-type lease or operating lease. If a lease meets one or more of the four criteria listed below and both the collectability of the minimum lease payments is reasonably predictable and there are no material uncertainties surrounding the amount of unreimbursable costs yet to be incurred, the lease is classified as either a sales-type or direct financing lease; otherwise, it is classified as an operating lease:
• | the lease transfers ownership of the property to the lessee by the end of the lease term; |
• | the lease contains a bargain purchase option; |
• | the lease is equal to 75% or more of the estimated economic life of the leased property; or |
• | the present value at the beginning of the lease term of the minimum lease payments equals or exceeds 90% of the fair value of the leased property at the inception of the lease. |
Interest earned on direct financing leases is recognized over the term of the lease using the effective interest method. Revenue on sales-type leases is recognized at the inception of the lease at the present value of the minimum lease payments using the discount rate implicit in the lease, with the earned interest being recognized over the term of the lease using the effective interest method. Minimum lease payments comprise the rental payments that the lessee is obligated to make, excluding contingent rentals and any guarantee by the lessee to pay executory costs. Revenue from operating leases is recognized ratably on a straight-
64
line basis over the term of the lease agreement. Revenue from the sale of the residual asset at the end of a lease term is recognized at the date of sale.
The interest income from direct financing and sales-type leases and the revenue recognized from sales-type leases, operating leases and residual asset sales are presented as product revenue in the consolidated statements of operations.
Our lessor lease transactions are classified at the inception of the lease as either direct financing leases, sales-type leases or operating leases. At the inception of direct financing and sales-type leases, the net investment in leases is recorded, which consists of the minimum lease payments, the initial direct costs applicable for direct financing leases, the unguaranteed residual value of the leased asset and the unearned interest income.
Upon entering into a lease transaction, we generally assign the customer lease payments to a financial institution along with a first priority security interest in the leased equipment (“discounting”). These assignments do not qualify for sale accounting in accordance with Accounting Standards Codification (“ASC”) 860, Transfers and Servicing, and as such are not derecognized from the consolidated balance sheet and instead reported as collateralized borrowings. Accordingly, the related assets remain on our balance sheet and continue to be reported and accounted for as if the sale or assignment had not occurred. The majority of our assigned lease payments are on a nonrecourse basis with the financial institutions. At the time the lease is discounted, we receive a cash payment from the financial institution equal to the present value of the lease payments discounted at a fixed interest rate, and a related liability is established equal to this cash payment received. The asset and liability are both decreased over the term of the lease as payments are received by the financial institution from the lessee. The typical term of our leases and the discounting arrangements is between two and five years.
Sales-type leases – At the inception of the lease, the present value of the non-cancelable rentals is recorded as product revenue. Equipment costs, less the present value of the estimated residual values, are recorded in cost of product revenue. The difference between the present value of the non-cancelable rentals and the minimum lease payments receivable and the difference between the present value of the estimated residual values and the future value of residuals are recorded as unearned income, which is amortized to product revenue over the lease term using the effective interest rate method.
Direct financing leases – At the inception of a lease, the difference between the cost of the equipment and the present value of the non-cancelable rentals is recorded as unearned income, which is amortized to product revenue over the lease term using an effective interest rate method.
Residual values – Residual values represent management’s estimates of the fair market or realizable values of equipment under leases at the maturity of the leases. Estimating the fair market or realizable value of equipment at a point in the future involves management judgment. Management bases its estimates on historical experience, market values for similar but aged equipment and estimated depreciation factors. Management reviews the residual values and they are reduced as necessary to reflect any decrease in the estimated fair market or realizable values. Residual values are evaluated on a quarterly basis and any impairment, other than temporary, is recorded in the period in which the impairment is determined. The resulting reduction in the net investment in leases is recognized as a loss in the period in which the estimate is changed. No upward revision of residual value is made subsequent to the inception of the lease.
Operating leases – At the inception of a lease, the equipment assigned to the lease is recorded at cost as equipment under operating leases presented within other assets in our consolidated balance sheet and is depreciated on a straight-line basis over its useful life. Estimating the useful life of equipment requires management judgment. Management bases its estimates on historical experience and industry trends for similar products in the marketplace. Monthly payments from customers are recorded as part of product revenue, with the depreciation expense associated with the equipment recorded in cost of product revenue within our consolidated statements of operations.
Service Revenue
Revenue for Services – Revenue from professional services and cloud services is recognized as the services are performed. For time and material service contracts revenue is recognized at the contractual hourly rates for the labor hours performed during the period. For fixed price service contracts revenue is recognized on a proportional performance basis. Milestone payments are recognized against the labor hours completed compared to the total estimated hours for the scope of work with contract and revenue accrued or deferred as appropriate. Estimating the proportional performance on a contract requires management judgment. Management bases its estimates on the scope of work being performed, our historical experience performing similar work and the risks and uncertainties surrounding that work. These estimates are adjusted throughout the performance of the contract as work is completed. Our actual results have not differed materially from our estimates and we do not believe it is reasonably likely that the estimates and related assumptions will change materially in the foreseeable future.
65
Revenue for managed services is recognized on a straight-line basis over the term of the arrangement. We may incur upfront costs associated with professional and managed services, including, but not limited to, purchasing support service contracts and software licenses. These costs are initially deferred as prepaid expenses or other assets and expensed over the period that services are being provided.
Provision for Sales Returns and Credit Losses
Accounts receivable are carried at the original invoice amount less a provision for credit losses. Management determines the provision for credit losses by reviewing all outstanding amounts to identify troubled accounts, using historical experience applied to the aging of accounts, and considering current economic conditions that may affect a customer’s ability to pay. Accounts receivable are written off when deemed uncollectible. Recoveries of accounts receivable previously written off are recorded when received.
Accounts receivable are generally due within 30 days of the date of the invoice and typically do not bear interest. Any interest income received on accounts receivable is recorded as received or when collectability is reasonably assured.
Unbilled accounts receivable represent the revenue that has been earned but not yet billed to the customer as of the balance sheet date, less a provision for credit losses. Unbilled accounts receivable typically are comprised of receivables for hardware and software products delivered but not yet invoiced as a result of bill in full provisions, support service contract sales that are being billed over the contract term to customers, and revenue on professional service contracts in which revenue has been recognized in accordance with a proportional performance method but invoicing milestones have not yet been achieved. Management determines the provision for credit losses by reviewing unbilled amounts to identify troubled accounts, using historical experience and considering economic conditions that may affect a customer’s ability to pay. Unbilled receivables are written off when deemed uncollectible.
A provision for sales returns is maintained for potential future product returns. A corresponding provision is maintained for those product returns that we are able to return to our vendors or original equipment manufacturers. These provisions are based on an evaluation of historical trends in product return rates and are presented net as a reduction in accounts receivable and product revenue.
Provisions for credit losses are maintained for potentially uncollectible accounts receivable, unbilled receivables and financing receivables. The provisions are increased for potential credit losses, which increases expenses, and decreased by subsequent recoveries. The provisions for credit losses are decreased by write-offs and reductions to the provision for potential credit losses. Accounts are either written off or written down when the loss is both probable and determinable. Management’s determination of the adequacy of the provisions for credit losses for accounts receivable, unbilled receivables and financing receivables are based on the age of the receivable balance, the customer’s credit quality rating, an evaluation of historical credit losses, current economic conditions, and other relevant factors.
Goodwill and Intangible Assets
Goodwill and intangible assets are generally acquired in conjunction with a business combination using the acquisition method of accounting. The acquisition method requires that the total purchase price of the acquired entity be allocated to the assets acquired and liabilities assumed based on their fair values at the acquisition date. The assets acquired include the analysis and recognition of intangible assets such as customer relationships, trade names and contractual rights and the liabilities assumed include contractual commitments and contingencies. Any premium paid over the fair value of the net assets and liabilities acquired is recorded as goodwill. Determining the fair value of the assets and liabilities acquired involves significant estimates and judgments by management. Management typically engages a third-party valuation specialist to assist in the identification and valuation of these assets and liabilities. Valuing the assets and liabilities of a business generally involves the use of the market approach, income approach and cost approach.
66
Finite-lived Intangible Assets
Finite-lived intangible assets such as customer relationships assets, developed technology, trade names, and non-compete agreements are amortized over their estimated useful lives, generally on a straight-line basis. Estimating the useful life of finite-lived intangible assets requires management judgment. Management bases its judgment on historical experience and the assumptions and inputs used in initially valuing the assets. Assumptions and inputs used in determining customer relationships and trade name values include estimating future cash flows, profitability, discount rates and a customer attrition rate. The useful life of developed technology is based on management’s estimate of market trends. Finite-lived intangible assets are reviewed for impairment or obsolescence whenever events or circumstances indicate that the carrying amount of the asset may not be recoverable. Recoverability of intangible assets is measured by a comparison of the carrying amount of the asset to the future undiscounted net cash flows expected to be generated by that asset. If the asset is considered to be impaired, the impairment loss is measured as the amount by which the carrying amount of the asset exceeds the estimated fair value.
Goodwill and Indefinite-lived Intangible Assets
We assess goodwill for impairment at least annually on March 31st of each year for each reporting unit. During the year, we adopted ASU 2017-04, Intangibles - Goodwill and Other (Topic 350), which simplified the test for goodwill impairment. To perform its impairment assessment, we compare the fair value of our reporting unit with its carrying amount. If our carrying amount exceeds our fair value, an impairment charge would be recognized for the difference. When the fair value of our reporting unit exceeds the carrying amount, no impairment is recognized.
Indefinite-lived intangible assets other than goodwill are assessed annually on March 31st, or more frequently if indicated, for impairment. The impairment assessment first considers qualitative and quantitative factors to determine whether events and circumstances indicate that it is more likely than not that an indefinite-lived intangible asset is impaired, including, but not limited to, the following: (i) the performance of the underlying business related to the intangible asset; (ii) the use of the intangible asset to market to customers and transact with vendors; and (iii) the expectation that the intangible asset will continue to be used going forward. If after assessing the qualitative and quantitative factors we determine that it is more likely than not that the fair value of an indefinite-lived intangible asset is less than its carrying value, then we will write down the value of the intangible asset to its fair value. The fair value of our indefinite-lived intangible asset is determined using the relief from royalty method. The significant estimates and assumptions utilized in the fair value estimates include revenue projections, the royalty rate and the weighted average cost of capital.
No impairment of goodwill or indefinite-lived intangible assets was recognized for any of the periods presented.
Share-based Compensation
We measure and recognize share-based compensation expense for all share-based awards made to employees and directors using fair value based methods over the requisite service period. Prior to the fiscal year ended June 30, 2017 adoption of ASU 2016-09, Compensation – Stock Compensation (Topic 718): Improvements to Employee Share-Based Payment Accounting, we included an estimated forfeiture rate in the calculation of compensation expense. Subsequently, we recognize forfeitures as they occur. The cost of equity-classified awards is based on the grant-date fair value calculated using a Black-Scholes or Monte Carlo valuation model, depending on the nature and classification of the award. The cost of liability-classified awards were based on the intrinsic value of the awards at each reporting date.
Share-based compensation expense for awards with a service-only condition is recognized over the employee’s requisite service period using a graded vesting method. For awards with a performance condition that affects vesting, the performance condition is not considered in determining the award’s grant-date fair value; however, the conditions are considered when estimating the quantity of awards that are expected to vest. No compensation expense is recorded for awards with performance conditions until the performance condition is determined to be probable of achievement. Estimating when a performance condition is probable of achievement requires management judgment. Management considers all available factors and available information in making this determination including, measurement against the performance condition, historical results, volatility, remaining contractual period of the awards and future forecasts and market outlook. For awards with a market condition that affects vesting, the market condition is considered in determining the award’s grant-date fair value. Compensation expense for awards with a market condition is recognized straight-line over the derived or implied service period. For awards with both performance and market conditions, the market condition is incorporated into the fair value of the award, while the performance condition impacts the timing of expense recognition.
Prior to the fiscal year ended June 20, 2017 adoption of ASU 2016-09, Compensation – Stock Compensation (Topic 718): Improvements to Employee Share-Based Payment Accounting, we recorded excess tax benefits to additional paid in capital on the
67
consolidated balance sheet. Subsequently, excess tax benefits are recorded as a component of income tax expense in the consolidated statement of operations. Additionally, subsequent to the adoption of ASU 2016-09, excess tax benefits are presented as an operating activity on the consolidated statement of cash flows, instead of as a financing activity.
In the case of modifications of awards, additional share-based compensation expense is based on the excess, if any, of the fair value of the modified award over the fair value of the original award immediately before its terms are modified.
Share-based compensation expense is classified as selling expenses or general and administrative expenses consistent with other compensation expense associated with the award recipient.
We use the simplified method in estimating the expected life of its service-only condition awards because we do not have sufficient historical exercise data to provide a reasonable basis to estimate future exercise patterns.
Assumptions used in the Black-Scholes and Monte Carlo valuation models to calculate the fair value of the awards includes the expected life, volatility, risk-free rate and dividend yield. We use the simplified method in estimating the expected life of service based awards because we do not have sufficient historical exercise data to provide a reasonable basis to estimate future exercise patterns. The expected stock price volatility is based on the average of the historical volatility of public companies in industries similar to our industry as we do not have sufficient history as a public company. The risk-free interest rate is based on U.S. Treasury yields in effect at the time of grant over the expected term of the option. We do not use a dividend yield as we have not historically paid dividends.
When we were a private company, there was inherent uncertainty in estimating the fair value of our common stock and if we had made different assumptions, the fair value of the underlying common stock and amount of our share-based compensation expense, net income (loss) and earnings (loss) per share would have been different. Following our IPO on March 10, 2017, the fair value per share of our common stock for purposes of determining share-based compensation expense is the closing price of our common stock as reported on the NASDAQ on the applicable grant date.
Partner Incentive Program Consideration
The Company receives payments and credits from vendors for various programs, including rebates, volume incentive programs, and shared marketing expense programs. Each program varies in length and has varying conditions or achievement targets that determine the amount of consideration the Company is eligible for. The Company estimates and recognizes the amount of partner incentive program consideration earned when it is probable and reasonably estimable using the information available or historical data. Such partner incentive program consideration is recognized as a reduction of cost of revenue with respect to rebates, volume incentive programs and similar programs or as a reduction to operating expenses with respect to shared marketing expense programs.
Income Taxes
Deferred taxes are calculated using the liability method, whereby deferred tax assets are recognized for deductible temporary differences, operating losses and tax credit carry-forwards, and deferred tax liabilities are recognized for taxable temporary differences. Temporary differences are the differences between the reported amounts of assets and liabilities in the our consolidated balance sheets and their tax bases. Deferred tax assets are reduced by a valuation allowance when, in the opinion of management, it is more likely than not that some portion or all of the deferred tax assets will not be realized. The assessment of future realization of deferred tax assets requires management judgment. Based on management’s forecast of future operations, no valuation allowance has been recorded for any of our deferred tax assets as we believe we will generate sufficient taxable income in the future to realize these benefits. Deferred tax assets and liabilities are presented based on the tax rates currently in effect and adjusted for changes in tax laws and rates on the date of enactment. Deferred tax assets and liabilities are classified as noncurrent and presented net in the consolidated balance sheets.
We evaluate our tax positions under a more-likely-than-not recognition threshold and measurement analysis before they can be recognized for financial statement reporting. Identifying and evaluating the likely outcome of tax positions requires management judgment. Uncertain tax positions have been classified as current or non-current income tax liabilities based on the expectation of whether they will be paid in the next fiscal year. We recognize interest and penalties related to income tax exposures as a component of income tax expense (benefit) in our consolidated statements of operations.
68
Recent Accounting Pronouncements
See the information set forth in Note 1 ("Recent Accounting Pronouncements Adopted During the Fiscal Year" and "Recent Accounting Pronouncements Not Yet Adopted") to the consolidated financial statements included in Item 8 to this Form 10-K.
Impact of Inflation
Inflation has not had a material impact on our operating results. We generally have been able to pass along price increases to our customers, though certain economic factors and technological advances in recent years have tended to place downward pressure on pricing.
Item 7A. Quantitative and Qualitative Disclosures about Market Risk
Interest Rate Risk
Our market risks relate primarily to changes in interest rates. The interest rates on borrowings under our term loans are floating and, therefore, are subject to fluctuations. Currently the applicable interest rate is based on a floor, however if interest rates rise in the future with the base rate increasing above the floor, our interest expense will increase. To manage this risk, we may enter into interest rate swaps to add stability to interest expense and to manage our exposure to interest rate fluctuations.
See “Management’s Discussion and Analysis of Financial Condition and Results of Operations - Contractual Obligations” for information on cash flows, interest rates and maturity dates of our debt obligations.
69
PRESIDIO, INC.
Item 8. Financial Statements and Supplementary Data
Page | |
CONSOLIDATED FINANCIAL STATEMENTS | |
FINANCIAL STATEMENT SCHEDULES | |
70
REPORT OF INDEPENDENT REGISTERED PUBLIC ACCOUNTING FIRM
To the Stockholders and the Board of Directors
Presidio, Inc.
Opinion on the Financial Statements
We have audited the accompanying consolidated balance sheets of Presidio, Inc. and its subsidiaries (the Company) as of June 30, 2018 and 2017, the related consolidated statements of operations, stockholders' equity and cash flows for each of the three years in the period ended June 30, 2018, and the related notes to the consolidated financial statements and schedules listed in Item 15 (collectively, the financial statements). In our opinion, the financial statements present fairly, in all material respects, the financial position of the Company as of June 30, 2018 and 2017, and the results of its operations and its cash flows for each of the three years in the period ended June 30, 2018, in conformity with accounting principles generally accepted in the United States of America.
We have also audited, in accordance with the standards of the Public Company Accounting Oversight Board (United States) (PCAOB), the Company's internal control over financial reporting as of June 30, 2018, based on criteria established in Internal Control - Integrated Framework issued by the Committee of Sponsoring Organizations of the Treadway Commission in 2013, and our report dated September 6, 2018 expressed an unqualified opinion on the effectiveness of the Company's internal control over financial reporting.
Basis for Opinion
These financial statements are the responsibility of the Company’s management. Our responsibility is to express an opinion on the Company’s financial statements based on our audits. We are a public accounting firm registered with the PCAOB and are required to be independent with respect to the Company in accordance with U.S. federal securities laws and the applicable rules and regulations of the Securities and Exchange Commission and the PCAOB.
We conducted our audits in accordance with the standards of the PCAOB. Those standards require that we plan and perform the audits to obtain reasonable assurance about whether the financial statements are free of material misstatement, whether due to error or fraud. Our audits included performing procedures to assess the risks of material misstatement of the financial statements, whether due to error or fraud, and performing procedures that respond to those risks. Such procedures included examining, on a test basis, evidence regarding the amounts and disclosures in the financial statements. Our audits also included evaluating the accounting principles used and significant estimates made by management, as well as evaluating the overall presentation of the financial statements. We believe that our audits provide a reasonable basis for our opinion.
/s/ RSM US LLP
We have served as the Company's auditor since 2005.
Mclean, Virginia
September 6, 2018
71
REPORT OF INDEPENDENT REGISTERED PUBLIC ACCOUNTING FIRM
To the Stockholders and the Board of Directors
Presidio, Inc.
Opinion on the Internal Control Over Financial Reporting
We have audited Presidio, Inc.'s (the Company) internal control over financial reporting as of June 30, 2018, based on criteria established in Internal Control - Integrated Framework issued by the Committee of Sponsoring Organizations of the Treadway Commission in 2013. In our opinion, the Company maintained, in all material respects, effective internal control over financial reporting as of June 30, 2018, based on criteria established in Internal Control - Integrated Framework issued by the Committee of Sponsoring Organizations of the Treadway Commission in 2013.
We have also audited, in accordance with the standards of the Public Company Accounting Oversight Board (United States) (PCAOB), the consolidated balance sheets as of June 30, 2018 and 2017, the related consolidated statements of operations, stockholders' equity and cash flows for each of the three years in the period ended June 30, 2018, and the related notes to the consolidated financial statements and schedules listed in Item 15 (collectively, the financial statements) of the Company and our report dated September 6, 2018 expressed an unqualified opinion.
Basis for Opinion
The Company’s management is responsible for maintaining effective internal control over financial reporting and for its assessment of the effectiveness of internal control over financial reporting in the accompanying Management’s Annual Report on Internal Control over Financial Reporting. Our responsibility is to express an opinion on the Company’s internal control over financial reporting based on our audit. We are a public accounting firm registered with the PCAOB and are required to be independent with respect to the Company in accordance with U.S. federal securities laws and the applicable rules and regulations of the Securities and Exchange Commission and the PCAOB.
We conducted our audit in accordance with the standards of the PCAOB. Those standards require that we plan and perform the audit to obtain reasonable assurance about whether effective internal control over financial reporting was maintained in all material respects. Our audit included obtaining an understanding of internal control over financial reporting, assessing the risk that a material weakness exists, and testing and evaluating the design and operating effectiveness of internal control based on the assessed risk. Our audit also included performing such other procedures as we considered necessary in the circumstances. We believe that our audit provides a reasonable basis for our opinion.
Definition and Limitations of Internal Control Over Financial Reporting
A company's internal control over financial reporting is a process designed to provide reasonable assurance regarding the reliability of financial reporting and the preparation of financial statements for external purposes in accordance with generally accepted accounting principles. A company's internal control over financial reporting includes those policies and procedures that (1) pertain to the maintenance of records that, in reasonable detail, accurately and fairly reflect the transactions and dispositions of the assets of the company; (2) provide reasonable assurance that transactions are recorded as necessary to permit preparation of financial statements in accordance with generally accepted accounting principles, and that receipts and expenditures of the company are being made only in accordance with authorizations of management and directors of the company; and (3) provide reasonable assurance regarding prevention or timely detection of unauthorized acquisition, use or disposition of the company's assets that could have a material effect on the financial statements.
Because of its inherent limitations, internal control over financial reporting may not prevent or detect misstatements. Also, projections of any evaluation of effectiveness to future periods are subject to the risk that controls may become inadequate because of changes in conditions, or that the degree of compliance with the policies or procedures may deteriorate.
/s/ RSM US LLP
Mclean, Virginia
September 6, 2018
72
PRESIDIO, INC.
Consolidated Balance Sheets
(in millions, except share data)
As of June 30, 2017 | As of June 30, 2018 | ||||||
Assets | |||||||
Current Assets | |||||||
Cash and cash equivalents | $ | 27.5 | $ | 37.0 | |||
Accounts receivable, net | 576.3 | 613.3 | |||||
Unbilled accounts receivable, net | 159.8 | 156.7 | |||||
Financing receivables, current portion | 84.2 | 88.3 | |||||
Inventory | 27.7 | 27.7 | |||||
Prepaid expenses and other current assets | 63.4 | 80.7 | |||||
Total current assets | 938.9 | 1,003.7 | |||||
Property and equipment, net | 32.1 | 35.9 | |||||
Financing receivables, less current portion | 113.6 | 116.8 | |||||
Goodwill | 781.5 | 803.7 | |||||
Identifiable intangible assets, net | 751.9 | 700.3 | |||||
Other assets | 32.7 | 33.9 | |||||
Total assets | $ | 2,650.7 | $ | 2,694.3 | |||
Liabilities and Stockholders’ Equity | |||||||
Current Liabilities | |||||||
Current maturities of long-term debt | $ | — | $ | — | |||
Accounts payable – trade | 350.5 | 457.7 | |||||
Accounts payable – floor plan | 264.9 | 210.6 | |||||
Accrued expenses and other current liabilities | 216.3 | 193.2 | |||||
Discounted financing receivables, current portion | 79.9 | 85.2 | |||||
Total current liabilities | 911.6 | 946.7 | |||||
Long-term debt, net of debt issuance costs | 730.7 | 671.2 | |||||
Discounted financing receivables, less current portion | 104.7 | 108.6 | |||||
Deferred income tax liabilities | 270.4 | 177.7 | |||||
Other liabilities | 30.4 | 34.0 | |||||
Total liabilities | 2,047.8 | 1,938.2 | |||||
Commitments and contingencies (Note 13) | |||||||
Stockholders’ Equity | |||||||
Preferred stock: | |||||||
$0.01 par value; 100 shares authorized and zero shares issued and outstanding at June 30, 2018 and June 30, 2017 | — | — | |||||
Common stock: | |||||||
$0.01 par value; 250,000,000 shares authorized and 92,853,983 shares issued and outstanding at June 30, 2018, 250,000,000 shares authorized and 90,969,919 shares issued and outstanding at June 30, 2017 | 0.9 | 0.9 | |||||
Additional paid-in capital | 625.3 | 644.3 | |||||
Accumulated earnings (deficit) | (23.3 | ) | 110.9 | ||||
Total stockholders’ equity | 602.9 | 756.1 | |||||
Total liabilities and stockholders’ equity | $ | 2,650.7 | $ | 2,694.3 | |||
See Notes to the Consolidated Financial Statements.
73
PRESIDIO, INC.
Consolidated Statements of Operations
(in millions, except share and per-share data)
Fiscal Year Ended June 30, | |||||||||||
2016 | 2017 | 2018 | |||||||||
Revenue | |||||||||||
Product | $ | 2,319.8 | $ | 2,373.2 | $ | 2,336.5 | |||||
Service | 395.1 | 444.4 | 521.5 | ||||||||
Total revenue | 2,714.9 | 2,817.6 | 2,858.0 | ||||||||
Cost of revenue | |||||||||||
Product | 1,866.5 | 1,884.2 | 1,856.3 | ||||||||
Service | 307.8 | 347.5 | 416.7 | ||||||||
Total cost of revenue | 2,174.3 | 2,231.7 | 2,273.0 | ||||||||
Gross margin | 540.6 | 585.9 | 585.0 | ||||||||
Operating expenses | |||||||||||
Selling expenses | 248.2 | 276.2 | 273.7 | ||||||||
General and administrative expenses | 96.9 | 105.0 | 101.8 | ||||||||
Transaction costs | 20.6 | 14.8 | 10.8 | ||||||||
Depreciation and amortization | 76.0 | 81.8 | 83.7 | ||||||||
Total operating expenses | 441.7 | 477.8 | 470.0 | ||||||||
Operating income | 98.9 | 108.1 | 115.0 | ||||||||
Interest and other (income) expense | |||||||||||
Interest expense | 81.9 | 72.5 | 46.0 | ||||||||
Loss on disposal of business | 6.8 | — | — | ||||||||
Loss on extinguishment of debt | 9.7 | 28.5 | 14.8 | ||||||||
Other (income) expense, net | 0.1 | 0.1 | (0.3 | ) | |||||||
Total interest and other (income) expense | 98.5 | 101.1 | 60.5 | ||||||||
Income before income taxes | 0.4 | 7.0 | 54.5 | ||||||||
Income tax expense (benefit) | 3.8 | 2.6 | (79.7 | ) | |||||||
Net income (loss) | $ | (3.4 | ) | $ | 4.4 | $ | 134.2 | ||||
Earnings (loss) per share: | |||||||||||
Basic | $ | (0.05 | ) | $ | 0.06 | $ | 1.46 | ||||
Diluted | $ | (0.05 | ) | $ | 0.05 | $ | 1.39 | ||||
Weighted-average common shares outstanding: | |||||||||||
Basic | 71,117,962 | 77,517,700 | 91,891,295 | ||||||||
Diluted | 71,117,962 | 81,861,839 | 96,227,578 | ||||||||
See Notes to the Consolidated Financial Statements.
74
PRESIDIO, INC.
Consolidated Statements of Cash Flows
(in millions)
Fiscal Year Ended June 30, | |||||||||||
2016 | 2017 | 2018 | |||||||||
Cash flows from operating activities: | |||||||||||
Net income (loss) | $ | (3.4 | ) | $ | 4.4 | $ | 134.2 | ||||
Adjustments to reconcile net income (loss) to net cash provided by (used in) operating activities: | |||||||||||
Amortization of intangible assets | 67.2 | 73.6 | 74.4 | ||||||||
Depreciation of property and equipment in operating expenses | 8.8 | 8.2 | 9.3 | ||||||||
Depreciation of property and equipment in cost of revenue | 5.7 | 5.4 | 5.8 | ||||||||
Provision for sales returns and credit losses | 1.5 | 2.0 | 1.0 | ||||||||
Amortization of debt issuance costs | 7.6 | 6.5 | 4.5 | ||||||||
Loss on extinguishment of debt | 9.7 | 28.5 | 14.8 | ||||||||
Loss on disposal of business | 6.8 | — | — | ||||||||
Noncash lease income | (5.0 | ) | (3.7 | ) | (1.4 | ) | |||||
Share-based compensation expense | 2.2 | 10.2 | 7.0 | ||||||||
Deferred income tax benefit | (19.6 | ) | (17.6 | ) | (93.0 | ) | |||||
Other | — | 0.4 | 0.1 | ||||||||
Change in assets and liabilities, net of acquisitions and dispositions: | |||||||||||
Unbilled and accounts receivable | (37.6 | ) | (98.4 | ) | (23.9 | ) | |||||
Inventory | (4.5 | ) | 20.6 | 0.3 | |||||||
Prepaid expenses and other assets | 13.5 | (20.6 | ) | (17.3 | ) | ||||||
Accounts payable – trade | 21.7 | (31.9 | ) | 96.4 | |||||||
Accrued expenses and other liabilities | 11.5 | 63.4 | (20.2 | ) | |||||||
Net cash provided by operating activities | 86.1 | 51.0 | 192.0 | ||||||||
Cash flows from investing activities: | |||||||||||
Acquisition of businesses, net of cash and cash equivalents acquired | (251.3 | ) | — | (42.8 | ) | ||||||
Proceeds from collection of escrow related to acquisition of business | — | 0.6 | 0.2 | ||||||||
Proceeds from disposition of business | 36.3 | — | — | ||||||||
Additions of equipment under sales-type and direct financing leases | (95.4 | ) | (100.1 | ) | (108.3 | ) | |||||
Proceeds from collection of financing receivables | 6.5 | 9.8 | 4.1 | ||||||||
Additions to equipment under operating leases | (2.7 | ) | (2.0 | ) | (1.6 | ) | |||||
Proceeds from disposition of equipment under operating leases | 1.0 | 1.5 | 0.7 | ||||||||
Purchases of property and equipment | (16.4 | ) | (11.4 | ) | (14.4 | ) | |||||
Net cash used in investing activities | (322.0 | ) | (101.6 | ) | (162.1 | ) | |||||
Cash flows from financing activities: | |||||||||||
Proceeds from initial public offering, net of underwriter discounts and commissions | — | 247.5 | — | ||||||||
Payments of initial public offering costs | — | (7.2 | ) | — | |||||||
Proceeds from issuance of common stock under share-based compensation plans | — | 1.1 | 8.0 | ||||||||
Repurchases of common stock | (0.1 | ) | — | — | |||||||
Payments of future consideration on acquisitions | (10.3 | ) | — | — | |||||||
Deferred financing costs | (1.2 | ) | — | (1.2 | ) | ||||||
Proceeds from the discounting of financing receivables | 86.4 | 108.6 | 114.6 | ||||||||
Retirements of discounted financing receivables | (4.2 | ) | (5.0 | ) | (10.0 | ) | |||||
Net borrowings (repayments) on the receivables securitization facility | 5.0 | (5.0 | ) | — | |||||||
Repayments of senior and subordinated notes | (66.3 | ) | (230.8 | ) | (135.7 | ) | |||||
Borrowings of term loans, net of original issue discount | 306.6 | — | 138.2 | ||||||||
Repayments of term loans | (156.2 | ) | (105.7 | ) | (80.0 | ) | |||||
Net borrowings (repayments) on the floor plan facility | 20.9 | 41.6 | (54.3 | ) | |||||||
Net cash provided by (used in) financing activities | 180.6 | 45.1 | (20.4 | ) | |||||||
Net increase (decrease) in cash and cash equivalents | (55.3 | ) | (5.5 | ) | 9.5 | ||||||
Cash and cash equivalents: | |||||||||||
Beginning of the period | 88.3 | 33.0 | 27.5 | ||||||||
End of the period | $ | 33.0 | $ | 27.5 | $ | 37.0 | |||||
Supplemental disclosures of cash flow information | |||||||||||
Cash paid (received) during the period for: | |||||||||||
Interest | $ | 74.0 | $ | 75.7 | $ | 44.8 | |||||
Income taxes, net of refunds | $ | 23.7 | $ | 3.3 | $ | 20.3 | |||||
Reduction of discounted lease assets and liabilities | $ | 82.8 | $ | 89.6 | $ | 102.7 | |||||
See Notes to the Consolidated Financial Statements.
75
PRESIDIO, INC.
Consolidated Statements of Stockholders’ Equity
(in millions, except share data)
Preferred stock | Common stock | Additional paid-in capital | Accumulated earnings (deficit) | Total | |||||||||||||||||||||
Shares | Amount | Shares | Amount | ||||||||||||||||||||||
Balance, June 30, 2015 | — | $ | — | 70,491,948 | $ | 0.7 | $ | 359.4 | $ | (24.3 | ) | $ | 335.8 | ||||||||||||
Common stock issued for awards under share-based compensation plans | — | — | 23,856 | — | — | — | — | ||||||||||||||||||
Common stock issued for acquisitions | — | — | 1,417,032 | — | 12.4 | — | 12.4 | ||||||||||||||||||
Repurchase of common stock | — | — | (10,000 | ) | — | (0.1 | ) | — | (0.1 | ) | |||||||||||||||
Net Loss | — | — | — | — | — | (3.4 | ) | (3.4 | ) | ||||||||||||||||
Share-based compensation expense | — | — | — | — | 2.2 | — | 2.2 | ||||||||||||||||||
Balance, June 30, 2016 | — | — | 71,922,836 | 0.7 | 373.9 | (27.7 | ) | 346.9 | |||||||||||||||||
Common stock issued for initial public offering, net of underwriting discounts and commissions | — | — | 18,766,465 | 0.2 | 247.3 | — | 247.5 | ||||||||||||||||||
Costs related to initial public offering | — | — | — | — | (7.2 | ) | — | (7.2 | ) | ||||||||||||||||
Common stock issued for awards under share-based compensation plans | — | — | 280,618 | — | 1.1 | — | 1.1 | ||||||||||||||||||
Net income | — | — | — | — | — | 4.4 | 4.4 | ||||||||||||||||||
Share-based compensation expense | — | — | — | — | 10.2 | — | 10.2 | ||||||||||||||||||
Balance, June 30, 2017 | — | — | 90,969,919 | 0.9 | 625.3 | (23.3 | ) | 602.9 | |||||||||||||||||
Common stock issued for awards under share-based compensation plans | — | — | 1,614,777 | — | 7.9 | — | 7.9 | ||||||||||||||||||
Common stock issued for acquisitions | — | — | 269,287 | — | 4.1 | — | 4.1 | ||||||||||||||||||
Net income | — | — | — | — | — | 134.2 | 134.2 | ||||||||||||||||||
Share-based compensation expense | — | — | — | — | 7.0 | — | 7.0 | ||||||||||||||||||
Balance, June 30, 2018 | — | $ | — | 92,853,983 | $ | 0.9 | $ | 644.3 | $ | 110.9 | $ | 756.1 | |||||||||||||
See Notes to the Consolidated Financial Statements.
76
PRESIDIO, INC.
NOTES TO CONSOLIDATED FINANCIAL STATEMENTS
Note 1. Nature of Business and Significant Accounting Policies
Description of the Company
Presidio, Inc., formerly named Aegis Holdings, Inc. (“Aegis”), is a Delaware corporation which was incorporated on November 20, 2014 by certain investment funds affiliated with or managed by Apollo Global Management, LLC and its subsidiaries, including Apollo Investment Fund VIII, L.P., along with their parallel investment funds (the “Apollo Funds”) to complete the acquisition of Presidio Holdings Inc. (“Presidio Holdings”). Presidio Holdings is a holding company for its wholly-owned subsidiary, Presidio LLC, and its operating subsidiaries, which are described below. Prior to its acquisition of Presidio Holdings on February 2, 2015 (the “Presidio Acquisition”), Presidio, Inc. had no operations or activity other than acquisition related costs. Subsequent to the Presidio Acquisition, Presidio, Inc. became the holding company and derives all of its operating income and cash flows from Presidio Holdings and its subsidiaries.
For the periods presented, the Company operated primarily through Presidio Networked Solutions LLC (“PNS”), a single indirect, wholly-owned subsidiary. PNS is a leading provider of life-cycle based IT solutions and services. The PNS business also includes the operations of Presidio Networked Solutions Group, LLC (“PNSG”). In addition, the Company operated an IT infrastructure leasing company, Presidio Technology Capital, LLC (“PTC”).
On April 3, 2018, the Company completed the acquisition of all of the issued and outstanding units of Red Sky Solutions, LLC, which expands our geographic footprint in the southwestern United States.
The Company also has an indirect, wholly-owned, non-operating subsidiary, Presidio Capital Funding LLC (“PCF”), which is utilized for the Receivables Securitization Facility described in Note 11. Presidio Holdings is a guarantor of certain indebtedness and a borrower of other indebtedness as described in Note 11. Refer to Note 22 for the condensed consolidating financial information of Presidio Holdings Inc. and subsidiaries.
The Company is headquartered in New York, New York and all of its direct and indirect subsidiaries are located in the United States.
Nature of Business
Presidio, Inc. is a leading provider of IT solutions to the middle market in North America. The Company enables business transformation through its expertise in IT solutions, with a specific focus on Digital Infrastructure, Cloud and Security solutions. The Company's solutions are delivered through a broad suite of professional services, including strategy, consulting, design and implementation. The Company complements its professional services with project management, technology acquisition, managed services, maintenance and support to offer a full lifecycle model. The Company's services-led, lifecycle model leads to ongoing client engagement.
The Company has three solution areas: (i) Digital Infrastructure, (ii) Cloud, and (iii) Security. Through its increasing focus on Cloud and Security solution areas, the Company believes it is well positioned to benefit from the rapid growth in demand for these technologies. Within its three solutions areas, the Company offers customers enterprise-class solutions that are critical to driving digital transformation and expanding business capabilities. Examples of such solutions include advanced networking, IoT, data analytics, data center modernization, hybrid and multi-cloud, cyber risk management and enterprise mobility. These solutions are enabled by the Company's expertise in foundational technologies, built upon its investments in network, data center, security, collaboration, and mobility.
The Company’s revenue from solutions consists of the resale of hardware, software, and third-party support service contracts, which is reported as product revenue, and the sale of professional, cloud and managed services, which is reported as service revenue. The Company implements IT solutions for its customers on a national and international basis, although the Company’s principal markets are located in the continental United States.
77
PRESIDIO, INC.
NOTES TO CONSOLIDATED FINANCIAL STATEMENTS
Stock Split
On February 24, 2017, the Board of Directors of the Company declared a 2-for-1 stock split of the Company’s common stock in the form of a stock dividend payable on each share of common stock issued and outstanding as of February 24, 2017. The number of shares subject to and the exercise price of the Company’s outstanding options were adjusted to equitably reflect the split. All common stock share and per-share data included in these financial statements give effect to the stock split.
Public Offerings
On March 15, 2017, the Company completed an initial public offering (“IPO”) in which the Company issued and sold 18,766,465 shares of common stock, inclusive of 2,099,799 shares issued and sold on March 21, 2017, pursuant to the underwriters’ option to purchase additional shares, at the public offering price of $14.00 per share. The Company received net proceeds of $247.5 million, after deducting underwriting discounts and commissions from the sale of its shares in the IPO. In addition, the Company incurred $7.2 million of offering expenses in connection with the IPO.
On November 21, 2017, the Company completed a secondary public offering of 8,000,000 shares of the Company’s common stock by certain funds affiliated with Apollo Global Management, LLC (the “Selling Stockholder”) at a price to the public of $14.25 per share. In addition, the underwriters to such secondary public offering purchased an additional 1,200,000 shares of common stock from the Selling Stockholder. The Company did not sell any shares and did not receive any proceeds from the offering. In conjunction with this secondary offering, the Company incurred $1.0 million of expenses, which is presented within transaction costs on the consolidated statement of operations for the fiscal year ended June 30, 2018.
Basis of Presentation
The accompanying consolidated financial statements have been prepared in conformity with accounting principles generally accepted in the United States of America (“U.S. GAAP”). All financial information presented in the financial statements and notes herein is presented in millions except for share and per share information and percentages.
In management’s opinion, all adjustments necessary for a fair presentation of the results of operations, financial position, and cash flows for the periods shown have been made. With the exception of acquisition related accounting, all other adjustments are of a normal recurring nature.
The Company has evaluated subsequent events through the issue date of these consolidated financial statements.
Principles of Consolidation
The Company’s consolidated financial statements include the accounts of Presidio, Inc. and its subsidiaries. All significant intercompany accounts and transactions have been eliminated in consolidation.
Reclassifications
We have reclassified some prior period amounts in our consolidated financial statements to conform to our current presentation.
Use of Estimates
The preparation of the Company’s consolidated financial statements requires management to make estimates and assumptions that affect the reported amounts of assets and liabilities, disclosure of contingent assets and liabilities at the date of the financial statements, and reported amounts of revenue and expenses during the reporting period. Estimates are used when accounting for items and matters including, but not limited to, revenue recognition, asset residual values, vendor rebates and consideration, goodwill, identifiable intangibles, measurement of income tax assets and liabilities and provisions for doubtful accounts, credit losses, inventory obsolescence, and other contingencies. Actual results could differ from management’s estimates.
Significant Accounting Policies
A summary of the Company’s significant accounting policies is as follows:
78
PRESIDIO, INC.
NOTES TO CONSOLIDATED FINANCIAL STATEMENTS
Revenue Recognition
The Company's revenue is generally derived from the sale of IT-solutions to customers. Incorporated in those solutions are third-party products including hardware, software and support service contracts and the sale of Company services and third-party services. Revenue is generally recognized when all of the following criteria have been met:
• | Persuasive evidence of an arrangement exists. Contracts, customer purchase orders, and statements of work are generally used to determine the existence of an arrangement. |
• | Delivery has occurred. Shipping documents and customer acceptance, when applicable, are used to verify product delivery and hours incurred are used to verify services are performed. |
• | The fee is fixed or determinable. The Company assesses whether the fee is fixed or determinable based on the payment terms associated with the transaction and whether the sales price is subject to refund or adjustment. |
• | Collectability is reasonably assured. The Company assesses collectability based primarily on the creditworthiness of the customer as determined by credit checks and analysis, as well as the customer’s payment history. |
As a provider of third-party products and services, the Company considers the principal versus agent accounting guidance to determine if the Company is the primary obligor in the arrangement and if revenue should be recognized gross or net of the associated costs. Applying the principal versus agent accounting guidance is a matter of judgment based on the consideration of several factors and indicators.
The Company's solutions may consist of a combination of deliverables including third-party products along with services delivered by the Company and/or third-parties. These types of arrangements generally contain multiple revenue generating activities or elements where delivery or performance may occur at different times or over different periods of time as discussed in the policies below. For arrangements that contain multiple elements, the total consideration of the arrangement is allocated to the deliverables which qualify as separate units of accounting. Generally, each of the above items qualifies as separate units of accounting since they provide stand-alone value to the customer and the delivery or performance of any undelivered items is considered probable and substantially in our control. The allocation of the arrangement consideration to the separate units of accounting is based on the relative selling price of each deliverable. The relative selling price is determined based on an assessment of the cost plus a reasonable margin. The identification of the deliverables, the separate units of accounting, the estimated selling prices and the allocation of the arrangement require management estimates and judgment.
Product Revenue
Revenue for hardware and software – Revenue from the sale of third-party hardware and third-party software products is generally recognized on a gross basis with the sales price to the customer recorded as revenue and the acquisition cost of the product recorded as cost of revenue, net of vendor rebates. Revenue is recognized when the title and risk of loss are passed to the customer. Hardware and software items can be delivered to customers in a variety of ways including drop-shipped by our vendor or supplier, shipped from our warehouse or via electronic delivery for software licenses. In certain cases, our solutions include the sale of software subscriptions where we are the agent in the arrangement with the customer and recognize the related revenue at the date of sale, net of the related cost of revenue. As the Company is under no obligation to perform additional services, such as post-customer support or upgrades, revenue is recognized at the time of sale as opposed to over the life of the software license. The Company maintains an estimate for sales returns and credit losses based on historical experience. The Company’s vendor partners provide warranties to our customers on equipment sold and as such we have not estimated a warranty reserve or deferred revenue for potential warranty work.
Revenue for third-party support service contracts – Revenue from the sale of third-party support service contracts is recognized net of the related cost of revenue. In a third-party support service contract, all services are performed by third-party providers and as a result, the Company concluded that it is acting as an agent and recognizes revenue on a net basis at the date of sale with revenue being equal to the gross margin on the transaction. As the Company is under no obligation to perform additional services, revenue is recognized at the time of sale as opposed to over the life of the third-party support agreement.
79
PRESIDIO, INC.
NOTES TO CONSOLIDATED FINANCIAL STATEMENTS
Revenue from leasing arrangements – Revenue from information technology products leased to customers is based on the type of lease entered into with each customer. Each lease is classified as either a direct financing lease, sales-type lease or operating lease. If a lease meets one or more of the four criteria listed below and both the collectability of the minimum lease payments is reasonably predictable and there are no material uncertainties surrounding the amount of unreimbursable costs yet to be incurred, the lease is classified as either a sales-type or direct financing lease; otherwise, it is classified as an operating lease:
• | the lease transfers ownership of the property to the lessee by the end of the lease term; |
• | the lease contains a bargain purchase option; |
• | the lease is equal to 75% or more of the estimated economic life of the leased property; or |
• | the present value at the beginning of the lease term of the minimum lease payments equals or exceeds 90% of the fair value of the leased property at the inception of the lease. |
Interest earned on direct financing leases is recognized over the term of the lease using the effective interest method. Revenue on sales-type leases is recognized at the inception of the lease at the present value of the minimum lease payments using the discount rate implicit in the lease, with the earned interest being recognized over the term of the lease using the effective interest method. Minimum lease payments comprise the rental payments that the lessee is obligated to make, excluding contingent rentals and any guarantee by the lessee to pay executory costs. Revenue from operating leases is recognized ratably on a straight-line basis over the term of the lease agreement. Revenue from the sale of the residual asset at the end of a lease term is recognized at the date of sale.
The interest income from direct financing and sales-type leases and the revenue recognized from sales-type leases, operating leases and residual asset sales are presented as product revenue in the consolidated statements of operations.
For additional information on the accounting treatment of leases, see the Financing Receivables and Operating Leases policies described in this footnote below as well as Note 6.
Sales taxes – The Company records sales and use taxes collected from customers for remittance to governmental authorities on a net basis within the Company’s consolidated statements of operations.
Shipping and freight – Shipping and freight costs billed to customers are recognized within revenue with the related shipping and freight costs incurred by the Company recorded as a cost of revenue.
Service Revenue
Revenue for Services – Revenue from professional services and cloud services is recognized as the services are performed. For time and material service contracts revenue is recognized at the contractual hourly rates for the labor hours performed during the period. For fixed price service contracts revenue is recognized on a proportional performance basis. Milestone payments are recognized against the labor hours completed compared to the total estimated hours for the scope of work with contract and revenue accrued or deferred as appropriate.
Revenue for managed services is recognized on a straight-line basis over the term of the arrangement. The Company may incur upfront costs associated with professional and managed services, including, but not limited to, purchasing support service contracts and software licenses. These costs are initially deferred as prepaid expenses or other assets and expensed over the period that services are being provided.
Cash and Cash Equivalents
The Company considers all highly liquid investments purchased with an original maturity of less than three months at the date of purchase to be cash equivalents. The Company’s cash management program utilizes zero balance accounts and overnight money market investments. The Company does not have any compensating balance requirements.
80
PRESIDIO, INC.
NOTES TO CONSOLIDATED FINANCIAL STATEMENTS
Accounts Receivable
Accounts receivable are carried at the original invoice amount less a provision for credit losses. Management determines the provision for credit losses by reviewing all outstanding amounts to identify troubled accounts, using historical experience applied to the aging of accounts, and considering current economic conditions that may affect a customer’s ability to pay. Accounts receivable are written off when deemed uncollectible. Recoveries of accounts receivable previously written off are recorded when received.
Accounts receivable are generally due within 30 days of the date of the invoice and typically do not bear interest. Any interest income received on accounts receivable is recorded as received or when collectability is reasonably assured.
Unbilled Accounts Receivable
Unbilled accounts receivable represent the revenue that has been earned but not yet billed to the customer as of the balance sheet date, less a provision for credit losses. Unbilled accounts receivable typically are comprised of receivables for hardware and software products delivered but not yet invoiced as a result of bill in full provisions, support service contract sales that are being billed over the contract term to customers, and revenue on professional service contracts in which revenue has been recognized in accordance with a proportional performance method but invoicing milestones have not yet been achieved. Management determines the provision for credit losses by reviewing unbilled amounts to identify troubled accounts, using historical experience and considering economic conditions that may affect a customer’s ability to pay. Unbilled receivables are written off when deemed uncollectible.
Inventory
During the fiscal year, the Company adopted ASU 2015-11, Inventory (Topic 330): Simplifying the Measurement of Inventory, which restricts the valuation of inventory to the lower of cost or net realizable value, which is the estimated selling price in the ordinary course of business less reasonably predictable costs of completion, disposal and transportation. The Company's inventory primarily consists of finished goods valued at the lower of cost or market, with cost determined on the first-in, first-out method (“FIFO”). The Company decreases the value of inventory when evidence exists that the net realizable value of inventory is lower than its cost, based upon an aging analysis of the inventory on hand, specifically known inventory-related risks, and assumptions about future demand and market conditions.
Property and Equipment
Property and equipment are stated at cost less accumulated depreciation, with the exception that property and equipment acquired in an acquisition are recorded at estimated fair value on the date of the acquisition.
Depreciation is computed using the straight-line method over the estimated useful lives of the assets. Estimated useful lives of three to seven years are used for equipment, software and furniture and fixtures. Depreciation and amortization of leasehold improvements are computed using the shorter of the estimated useful life or the remaining lease term.
Depreciation of certain equipment, software, and other property utilized directly in product revenue generation is recorded in cost of product revenue in the Company’s consolidated statements of operations. Similarly, depreciation expense associated with equipment and software directly utilized in support of cloud and managed services contracts is included in cost of service revenue within the Company’s consolidated statements of operations. All other depreciation and amortization are recorded in depreciation and amortization within operating expenses in the Company’s consolidated statements of operations.
Debt Issuance Costs
Debt issuance costs arising from the Company’s borrowings and credit agreements are amortized using the effective interest rate method over the term of the related debt financing. Debt issuance costs associated with non-revolving credit facilities are presented on a net basis along with the associated debt obligation in the consolidated balance sheets. Debt issuance costs associated with revolving credit facilities are presented net of accumulated amortization within other assets in the consolidated balance sheets.
81
PRESIDIO, INC.
NOTES TO CONSOLIDATED FINANCIAL STATEMENTS
Impairment of Long-lived Assets
The Company reviews its long-lived assets for impairment whenever events or circumstances indicate that the carrying amount of an asset or asset group may not be recoverable. Recoverability of long-lived assets is measured by a comparison of the carrying amount of the asset or asset group to the future undiscounted net cash flows expected to be generated by that asset or asset group. If such asset(s) are considered to be impaired, the impairment loss is measured as the amount by which the carrying amount of the asset(s) exceeds their estimated fair value. Assets to be disposed of are reported at the lower of the carrying amount or fair value, less cost to sell.
Identifiable Intangible Assets
Finite-lived intangible assets such as customer relationships assets, developed technology, trade names, and non-compete agreements are amortized over their estimated useful lives, generally on a straight-line basis. Finite-lived intangible assets are reviewed for impairment or obsolescence whenever events or circumstances indicate that the carrying amount of the asset may not be recoverable. Recoverability of intangible assets is measured by a comparison of the carrying amount of the asset to the future undiscounted net cash flows expected to be generated by that asset. If the asset is considered to be impaired, the impairment loss is measured as the amount by which the carrying amount of the asset exceeds the estimated fair value.
Goodwill and Other Indefinite-lived Intangibles
The Company records goodwill when the purchase price of a business acquisition exceeds the estimated fair value of net identified tangible and intangible assets acquired. Goodwill is assigned to a reporting unit on the acquisition date and assessed for impairment at least annually, or more frequently when events or changes in circumstances indicate that the fair value of a reporting unit has more likely than not declined below its carrying value. In accordance with ASC Topic 805, Business Combinations, if, at the time of issuance of any consolidated financial statements, the Company has not yet finalized the acquisition method of accounting and calculation of goodwill, the corresponding consolidated financial statements are prepared using provisional amounts. Upon finalizing the acquisition method of accounting, the Company applies any adjustments to the provisional amounts in the period in which the adjustments are determined.
The Company assesses goodwill for impairment at least annually on March 31 of each year for each reporting unit. During the year, the Company adopted ASU 2017-04, Intangibles - Goodwill and Other (Topic 350), which simplified the test for goodwill impairment. To perform its impairment assessment, the Company compared the fair value of our reporting unit with its carrying amount. If our carrying amount exceeds our fair value, an impairment charge would be recognized for the difference. When the fair value of our reporting unit exceeds the carrying amount, no impairment is recognized.
As of March 31, 2018, our estimated fair value exceeded our carrying value by approximately 96.6%. Our fair value was calculated based on our total market capitalization on March 31, 2018. On a qualitative basis, no economic, industry or our company-specific indicators were noted which would have led us to believe that it is more likely than not that goodwill was impaired since March 31, 2018.
Similar to goodwill, indefinite-lived intangible assets other than goodwill are assessed annually on March 31, or more frequently if indicated, for impairment. The impairment assessment first considers qualitative and quantitative factors to determine whether events and circumstances indicate that it is more likely than not that an indefinite-lived intangible asset is impaired, including, but not limited to, the following: (i) the performance of the underlying business related to the intangible asset; (ii) the use of the intangible asset to market to customers and transact with vendors; and (iii) the expectation that the intangible asset will continue to be used going forward. If after assessing the qualitative and quantitative factors the Company determines that it is more likely than not that the fair value of an indefinite-lived intangible asset is less than its carrying value, then the Company will write down the value of the intangible asset to its fair value. The fair value of the Company's indefinite-lived intangible asset is determined using the relief from royalty method. The significant estimates and assumptions utilized in the fair value estimates include revenue projections, the royalty rate and the weighted average cost of capital.
See Note 8 for additional information about the accounting for goodwill and indefinite-lived intangible assets, including the results of the Company’s impairment assessments.
82
PRESIDIO, INC.
NOTES TO CONSOLIDATED FINANCIAL STATEMENTS
Financing Receivables and Operating Leases
The Company’s lessor lease transactions are classified at the inception of the lease as either direct financing leases, sales-type leases or operating leases. At the inception of direct financing and sales-type leases, the net investment in leases is recorded, which consists of the minimum lease payments, the initial direct costs applicable for direct financing leases, the unguaranteed residual value of the leased asset and the unearned interest income.
Upon entering into a lease transaction, the Company generally assigns the customer lease payments to a financial institution along with a first priority security interest in the leased equipment (“discounting”). These assignments do not qualify for sale accounting in accordance with ASC 860, Transfers and Servicing, and as such are not derecognized from the consolidated balance sheet and instead reported as collateralized borrowings. Accordingly, the related assets remain on the Company’s balance sheets and continue to be reported and accounted for as if the sale or assignment had not occurred. The majority of our assigned lease payments are on a nonrecourse basis with the financial institutions. At the time the lease is discounted, the Company receives a cash payment from the financial institution equal to the present value of the lease payments discounted at a fixed interest rate, and a related liability is established equal to this cash payment received. The asset and liability are both decreased over the term of the lease as payments are received by the financial institution from the lessee. The typical term of our leases and the discounting arrangements is between two and five years.
Sales-type leases – At the inception of the lease, the present value of the non-cancelable rentals is recorded as product revenue. Equipment costs, less the present value of the estimated residual values, are recorded in cost of product revenue. The difference between the present value of the non-cancelable rentals and the minimum lease payments receivable and the difference between the present value of the estimated residual values and the future value of residuals are recorded as unearned income, which is amortized to product revenue over the lease term using the effective interest rate method.
Direct financing leases – At the inception of a lease, the difference between the cost of the equipment and the present value of the non-cancelable rentals is recorded as unearned income, which is amortized to product revenue over the lease term using an effective interest rate method.
Residual values – Residual values represent management’s estimates of the fair market or realizable values of equipment under leases at the maturity of the leases. Management reviews the residual values and they are reduced as necessary to reflect any decrease in the estimated fair market or realizable values. Residual values are evaluated on a quarterly basis and any impairment, other than temporary, is recorded in the period in which the impairment is determined. The resulting reduction in the net investment in leases is recognized as a loss in the period in which the estimate is changed. No upward revision of residual value is made subsequent to the inception of the lease.
Operating leases – At the inception of a lease, the equipment assigned to the lease is recorded at cost as equipment under operating leases presented within other assets in the Company’s consolidated balance sheets and is depreciated on a straight-line basis over its useful life. Monthly payments from customers are recorded as part of product revenue, with the depreciation expense associated with the equipment recorded in cost of product revenue within the Company’s consolidated statements of operations.
Provision for Sales Returns and Credit Losses
A provision for sales returns is maintained for potential future product returns. A corresponding provision is maintained for those product returns that the Company is able to return to our vendors or original equipment manufacturers. These provisions are based on an evaluation of historical trends in product return rates and are presented net as a reduction in accounts receivable and product revenue.
Provisions for credit losses are maintained for potentially uncollectible accounts receivable, unbilled receivables and financing receivables. The provisions are increased for potential credit losses, which increases expenses, and decreased by subsequent recoveries. The provisions for credit losses are decreased by write-offs and reductions to the provision for potential credit losses. Accounts are either written off or written down when the loss is both probable and determinable. Management’s determination of the adequacy of the provisions for credit losses for accounts receivable, unbilled receivables and financing receivables are based on the age of the receivable balance, the customer’s credit quality rating, an evaluation of historical credit losses, current economic conditions, and other relevant factors.
83
PRESIDIO, INC.
NOTES TO CONSOLIDATED FINANCIAL STATEMENTS
Income Taxes
Deferred taxes are calculated using the liability method, whereby deferred tax assets are recognized for deductible temporary differences, operating losses and tax credit carry-forwards, and deferred tax liabilities are recognized for taxable temporary differences. Temporary differences are the differences between the reported amounts of assets and liabilities in the Company’s consolidated balance sheets and their tax bases. Deferred tax assets are reduced by a valuation allowance when, in the opinion of management, it is more likely than not that some portion or all of the deferred tax assets will not be realized. Deferred tax assets and liabilities are presented based on the tax rates currently in effect and adjusted for changes in tax laws and rates on the date of enactment. Deferred tax assets and liabilities are classified as noncurrent and presented net in the consolidated balance sheets.
The Company evaluates its tax positions under a more-likely-than-not recognition threshold and measurement analysis before they can be recognized for financial statement reporting. Uncertain tax positions have been classified as current or non-current income tax liabilities based on the expectation of whether they will be paid in the next fiscal year. The Company recognizes interest and penalties related to income tax exposures as a component of income tax expense (benefit) in the Company’s consolidated statements of operations.
Share-based Compensation
The Company measures and recognizes share-based compensation expense for all share-based awards made to employees and directors using fair value based methods over the requisite service period. Prior to the fiscal year ended June 30, 2017 adoption of ASU 2016-09, Compensation – Stock Compensation (Topic 718): Improvements to Employee Share-Based Payment Accounting, the Company included an estimated forfeiture rate in its calculation of compensation expense. Subsequently, the Company recognizes forfeitures as they occur. The cost of equity-classified awards is based on the grant-date fair value calculated using a Black-Scholes or Monte Carlo valuation model, depending on the nature and classification of the award.
Share-based compensation expense for awards with a service-only condition is recognized over the employee’s requisite service period using a graded vesting method. For awards with a performance condition that affects vesting, the performance condition is not considered in determining the award’s grant-date fair value; however, the conditions are considered when estimating the quantity of awards that are expected to vest. No compensation expense is recorded for awards with performance conditions until the performance condition is determined to be probable of achievement. For awards with a market condition that affects vesting, the market condition is considered in determining the award’s grant-date fair value. Compensation expense for awards with a market condition is recognized straight-line over the derived or implied service period. For awards with both performance and market conditions, the market condition is incorporated into the fair value of the award, while the performance condition impacts the timing of expense recognition.
Prior to the fiscal year ended June 30, 2017 adoption of ASU 2016-09, Compensation – Stock Compensation (Topic 718): Improvements to Employee Share-Based Payment Accounting, the Company recorded excess tax benefits to additional paid in capital on the consolidated balance sheet. Subsequently, excess tax benefits are recorded as a component of income tax expense in the consolidated statement of operations. Additionally, subsequent to the adoption of ASU 2016-09, excess tax benefits are presented as an operating activity on the consolidated statement of cash flows, instead of as a financing activity.
In the case of modifications of awards, additional share-based compensation expense is based on the excess, if any, of the fair value of the modified award over the fair value of the original award immediately before its terms are modified.
Share-based compensation expense is classified as selling expenses or general and administrative expenses consistent with other compensation expense associated with the award recipient.
The Company uses the simplified method in estimating the expected life of its service-only condition awards because the Company does not have sufficient historical exercise data to provide a reasonable basis to estimate future exercise patterns.
Other Comprehensive Income
The Company did not have any components of other comprehensive income for any of the periods presented.
84
PRESIDIO, INC.
NOTES TO CONSOLIDATED FINANCIAL STATEMENTS
Earnings Per Share
Basic earnings per share is computed using the weighted-average number of shares of common stock outstanding during the period. Diluted earnings per share is computed using the weighted-average number of shares of common stock and dilutive potential shares of common stock outstanding during the period. Dilutive potential shares of common stock outstanding includes the dilutive effect of vested and unvested in-the-money service-only condition stock options and stock options with performance conditions once the performance condition is considered probable of achievement. Stock options with market conditions are included in the calculation of potential dilutive shares to the extent the market conditions are deemed to have been met based on information as of the end of the period as if it were the end of the contingency period. The dilutive effect of such equity-classified awards is calculated based on the average share price for each period using the treasury stock method. Under the treasury stock method, the amount the employee must pay for exercising stock options and the amount of compensation cost for future service that the Company has not yet recognized are collectively assumed to be used to repurchase shares. Prior to the fiscal year ended June 30, 2017 adoption of ASU 2016-09, Compensation – Stock Compensation (Topic 718): Improvements to Employee Share-Based Payment Accounting, the amount of excess tax benefits that would be recorded in additional paid-in capital when the award became deductible was considered an assumed proceed.
Shares issued under the Company's Employee Stock Purchase Plan are included as dilutive potential shares of common stock outstanding as of the beginning of the applicable offering period, to the extent they are not anti-dilutive.
Partner Incentive Program Consideration
The Company receives payments and credits from vendors for various programs, including rebates, volume incentive programs, and shared marketing expense programs. Each program varies in length and has varying conditions or achievement targets that determine the amount of consideration the Company is eligible for. The Company estimates and recognizes the amount of partner incentive program consideration earned when it is probable and reasonably estimable using the information available or historical data. Such partner incentive program consideration is recognized as a reduction of cost of revenue with respect to rebates, volume incentive programs and similar programs or as a reduction to operating expenses with respect to shared marketing expense programs.
Business Combinations
The Company accounts for business combinations and acquisitions using the acquisition method. The acquisition method requires that the total purchase price of the acquired entity be allocated to the assets acquired and liabilities assumed based on their fair values at the acquisition date. The assets acquired include the analysis and recognition of intangible assets such as customer relationships, trade names, developed technology and contractual rights and the liabilities assumed include contractual commitments and contingencies.
Any premium paid over the fair value of the net assets and liabilities acquired is recorded as goodwill in connection with the business combination. The results of operations for an acquired entity are included in the consolidated financial statements from the date of acquisition.
Fair Value Measurements
Fair value is defined under U.S. GAAP as the price that would be received to sell an asset or paid to transfer a liability in the principal or most advantageous market for the asset or liability in an orderly transaction between market participants at the measurement date. U.S. GAAP also provides a fair value hierarchy for valuation inputs to prioritize the inputs into three levels based on the extent to which inputs used in measuring fair value are observable in the market. Each fair value measurement is reported in one of the three levels, which is determined by the lowest level input that is significant to the fair value measurement in its entirety. These levels are:
Level 1: | Quoted prices (unadjusted) in active markets for identical assets or liabilities that the reporting entity has the ability to access at the measurement date; |
Level 2: | Inputs other than quoted prices included within Level 1 that are observable for the asset or liability, either directly or indirectly; and |
85
PRESIDIO, INC.
NOTES TO CONSOLIDATED FINANCIAL STATEMENTS
Level 3: | Unobservable inputs for the asset or liability. |
For those financial instruments with no quoted market prices available, fair value is estimated using present value calculations or other valuation methods. Determining the fair value incorporates management’s best judgment with respect to current economic conditions, discount rates and estimates of future cash flows.
The Company did not elect the fair value measurement option for any of its financial assets or liabilities.
Derivative Instruments
The Company may periodically use interest rate swap and cap agreements to reduce the impact of interest rate changes on its long-term debt.
All derivative instruments that are not clearly and closely related to the economic characteristics and risks of the host contract are recognized in the Company’s consolidated balance sheets at their fair value and are appropriately classified as current or non-current assets and liabilities. The Company has not elected hedge accounting for its derivative instruments, and as a result, changes in the fair value are recorded within the Company’s consolidated statements of operations within general and administrative expenses along with the periodic settlements on the variable rate asset or liability.
For the periods presented, the Company had no derivative agreements or activity.
Reportable Segments
Segment information is presented in accordance with a “management approach.” The “management approach” is based on the way that the Company’s chief operating decision-maker reviews operating segment information for use in making decisions, allocating resources and assessing performance. An operating segment is a component of the Company (i) that engages in business activities from which it may earn revenue and incur expense, (ii) whose operating results are regularly reviewed by the Company’s chief operating decision maker to make decisions about resources to be allocated to the segment and assess its performance, and (iii) for which discrete financial information is available.
Recent Accounting Pronouncements Adopted During the Fiscal Year
In July 2015, the Financial Accounting Standards Board (“FASB”) issued ASU 2015-11, Inventory (Topic 330): Simplifying the Measurement of Inventory, which restricts the valuation of inventory to the lower of cost or net realizable value, which is the estimated selling price in the ordinary course of business less reasonably predictable costs of completion, disposal and transportation. The standard has an effective date for fiscal years beginning after December 15, 2016 and interim periods within those fiscal years, with early adoption permitted. The Company adopted this standard in the three months ended September 30, 2017. The adoption of this standard had an immaterial impact on the Company’s consolidated financial statements.
In January 2017, the FASB issued ASU 2017-04, Intangibles—Goodwill and Other (Topic 350): Simplifying the Test for Goodwill Impairment. The amendments in this update eliminate Step 2 of the current two-step process, which measures a goodwill impairment loss by comparing the implied fair value of a reporting unit’s goodwill with the carrying amount of that goodwill. ASU 2017-04 is effective for the Company beginning in the first quarter of 2020 and allows for early adoption. The Company elected to early adopt this standard during the three months ended March 31, 2018. The adoption of this ASU did not have an impact on the Company's Consolidated Financial Statements.
Recent Accounting Pronouncements Not Yet Adopted as of June 30, 2018
In May 2014, the FASB issued ASU 2014-09, Revenue from Contracts with Customers (Topic 606), along with subsequent clarifying ASUs, which outline a single, comprehensive model for accounting for revenue from contracts with customers. Under the standard, revenue is to be recognized upon the transfer of promised goods or services to a customer, in an amount that reflects the consideration the entity expects to receive in exchange for those goods or services. In addition, the standard requires disclosure of the nature, amount, timing, and uncertainty of revenue and cash flows arising from contracts with customers. The standard, as amended, is effective for fiscal years beginning after December 15, 2017, and interim periods within those fiscal years, with early adoption permitted.
86
PRESIDIO, INC.
NOTES TO CONSOLIDATED FINANCIAL STATEMENTS
The standard allows entities to apply the standard retrospectively to each prior reporting period presented ("full retrospective adoption") or retrospectively with the cumulative effect of initially applying the standard recognized at the date of initial application ("modified retrospective adoption"). The Company formed an implementation committee to evaluate the differences compared to existing GAAP and to implement the processes associated with the adoption of this standard.
The Company is currently in the process of implementing appropriate changes to its business processes, systems and controls to support recognition and disclosure under the standard. The Company adopted the guidance on July 1, 2018, and utilized the full retrospective method.
The Company has finalized its accounting policies under the new standard which impacted revenue recognition as follows:
• | In certain transactions, the Company sells security software that is accompanied by third-party delivered software assurance that is deemed to be critical or essential to the core functionality of the security software license. In these cases, the Company has determined that the software license and the accompanying third-party delivered software assurance are a single performance obligation. The value of the product is primarily the accompanying support delivered by a third-party, and therefore, the Company is acting as an agent in these transactions and will recognize them on a net basis. The Company currently recognizes revenue from the sale of security software on a gross basis (i.e., acting as a principal). The adoption of the new standard results in a reduction to both Product revenue and Product cost of revenue with no impact on Product gross margin. |
• | The Company sells software enterprise license agreements (“ELAs”) that provide customers with access to manage their software license needs. The Company has determined that the ELA software sales are, individually, single performance obligations regardless of whether they are sold on a standalone basis or in connection with other hardware, software or services. The software licenses sold as part of an ELA are not operated or hosted by the Company and typically the manufacturer provides support services as part of the ELA transaction. Accordingly, the Company is acting as an agent in these transactions and will recognize them on a net basis. The Company currently recognizes revenue for ELAs sold as stand-alone solutions on a net basis (i.e., acting as an agent), while ELAs sold with other hardware, software or services are recognized on a gross basis. The adoption of the new standard results in a reduction to both Product revenue and Product cost of revenue with no impact on Product gross margin. |
• | The Company performs professional service engagements that may include subcontractors performing the services. In certain transactions, the Company currently recognizes revenue based on the milestones billed by the subcontractor when additional data is unavailable. The adoption of the new standard impacts the timing of revenue recognition for these transactions based on an appropriate input method aligned with when control transfers to the customer and the impact results in adjustments to Service revenue, Service cost of revenue and Service gross margin. |
• | The Company pays commissions to its sales personnel and the amount is generally derived from the profitability of the transaction. In certain cases, commissions are calculated and paid for contracts with performance periods that exceed one year and have been identified as costs to obtain the contracts. The adoption of the new standard results in the capitalization of these commissions and recognition of expense over a longer period of time resulting in a reduction in Selling expenses. |
87
PRESIDIO, INC.
NOTES TO CONSOLIDATED FINANCIAL STATEMENTS
The adoption of the ASU is expected to impact the Company's results as follows (in millions, except per-share data):
Fiscal Year Ended | ||||||||||||||||||||||||
June 30, 2017 | June 30, 2018 | |||||||||||||||||||||||
As Reported | ASU 2014-09 Adjustment | As Adjusted | As Reported | ASU 2014-09 Adjustment | As Adjusted | |||||||||||||||||||
Revenue | ||||||||||||||||||||||||
Product | $ | 2,373.2 | $ | (86.0 | ) | $ | 2,287.2 | $ | 2,336.5 | $ | (73.7 | ) | $ | 2,262.8 | ||||||||||
Service | 444.4 | 4.4 | 448.8 | 521.5 | (19.1 | ) | 502.4 | |||||||||||||||||
Total revenue | 2,817.6 | (81.6 | ) | 2,736.0 | 2,858.0 | (92.8 | ) | 2,765.2 | ||||||||||||||||
Cost of revenue | ||||||||||||||||||||||||
Product | 1,884.2 | (86.0 | ) | 1,798.2 | 1,856.3 | (73.7 | ) | 1,782.6 | ||||||||||||||||
Service | 347.5 | 4.0 | 351.5 | 416.7 | (18.1 | ) | 398.6 | |||||||||||||||||
Total cost of revenue | 2,231.7 | (82.0 | ) | 2,149.7 | 2,273.0 | (91.8 | ) | 2,181.2 | ||||||||||||||||
Gross margin | $ | 585.9 | $ | 0.4 | $ | 586.3 | $ | 585.0 | $ | (1.0 | ) | $ | 584.0 | |||||||||||
Selling expenses | $ | 276.2 | $ | (0.8 | ) | $ | 275.4 | $ | 273.7 | $ | (0.5 | ) | $ | 273.2 | ||||||||||
Operating income | $ | 108.1 | $ | 1.2 | $ | 109.3 | $ | 115.0 | $ | (0.5 | ) | $ | 114.5 | |||||||||||
Income tax expense (benefit) | $ | 2.6 | $ | 0.5 | $ | 3.1 | $ | (79.7 | ) | $ | (0.2 | ) | $ | (79.9 | ) | |||||||||
Net income (loss) | $ | 4.4 | $ | 0.7 | $ | 5.1 | $ | 134.2 | $ | (0.3 | ) | $ | 133.9 | |||||||||||
Earnings (loss) per share: | ||||||||||||||||||||||||
Basic | $ | 0.06 | $ | 0.01 | $ | 0.07 | $ | 1.46 | $ | — | $ | 1.46 | ||||||||||||
Diluted | $ | 0.05 | $ | 0.01 | $ | 0.06 | $ | 1.39 | $ | — | $ | 1.39 | ||||||||||||
As of June 30, 2017 | As of June 30, 2018 | |||||||||||||||||||||||
As Reported | ASU 2014-09 Adjustment | As Adjusted | As Reported | ASU 2014-09 Adjustment | As Adjusted | |||||||||||||||||||
Accounts receivable, net | $ | 576.3 | $ | (5.4 | ) | $ | 570.9 | $ | 613.3 | $ | (4.6 | ) | $ | 608.7 | ||||||||||
Unbilled accounts receivable, net | $ | 159.8 | $ | 18.6 | $ | 178.4 | $ | 156.7 | $ | 14.8 | $ | 171.5 | ||||||||||||
Prepaid expenses and other current assets | $ | 63.4 | $ | 16.4 | $ | 79.8 | $ | 80.7 | $ | 31.8 | $ | 112.5 | ||||||||||||
Total assets | $ | 2,650.7 | $ | 29.6 | $ | 2,680.3 | $ | 2,694.3 | $ | 42.0 | $ | 2,736.3 | ||||||||||||
Accrued expenses and other current liabilities | $ | 216.3 | $ | 22.1 | $ | 238.4 | $ | 193.2 | $ | 35.0 | $ | 228.2 | ||||||||||||
Deferred income tax liabilities | $ | 270.4 | $ | 3.0 | $ | 273.4 | $ | 177.7 | $ | 2.8 | $ | 180.5 | ||||||||||||
Total liabilities | $ | 2,047.8 | $ | 25.1 | $ | 2,072.9 | $ | 1,938.2 | $ | 37.8 | $ | 1,976.0 | ||||||||||||
Accumulated earnings (deficit) | $ | (23.3 | ) | $ | 4.5 | $ | (18.8 | ) | $ | 110.9 | $ | 4.2 | $ | 115.1 | ||||||||||
Total stockholders’ equity | $ | 602.9 | $ | 4.5 | $ | 607.4 | $ | 756.1 | $ | 4.2 | $ | 760.3 | ||||||||||||
Total liabilities and stockholders’ equity | $ | 2,650.7 | $ | 29.6 | $ | 2,680.3 | $ | 2,694.3 | $ | 42.0 | $ | 2,736.3 | ||||||||||||
The adoption of the ASU did not impact cash flow provided by operating activities for the years ended June 30, 2018 and 2017.
In February 2016, the FASB issued ASU 2016-02, Leases (Topic 842), which changes the accounting for leases in order to increase transparency and comparability among organizations by recognizing lease assets and lease liabilities on the balance
88
PRESIDIO, INC.
NOTES TO CONSOLIDATED FINANCIAL STATEMENTS
sheet and disclosing key information about leasing arrangements. The standard has an effective date for fiscal years beginning after December 15, 2018 and interim periods within those fiscal years, with early adoption permitted. The Company is currently evaluating the impact that the standard will have on the consolidated financial statements. The adoption of the standard is not expected to have a material impact on the Company’s leasing business from a lessor perspective.
Note 2. Acquisitions
Red Sky Solutions, LLC
On April 3, 2018, the Company completed the acquisition (“Red Sky Acquisition”) of all of the issued and outstanding units of Red Sky Solutions, LLC in exchange for $36.6 million paid in cash and approximately $4.1 million paid in 269,287 restricted shares of the Company’s common stock. As part of the Red Sky Acquisition, employees of Red Sky are eligible to obtain an earnout bonus based on a target EBITDA, subject to continued employment. Expense for this earnout is recorded in transaction costs, presented in the consolidated statement of operations. The acquisition expands our geographic footprint in the southwestern United States.
In accordance with the acquisition method, the acquired assets and assumed liabilities of the Red Sky business have been recognized at fair value as of April 3, 2018. The fair value of the acquired tangible assets and liabilities of Red Sky were determined to be consistent with their book value as of the date of the transaction. The fair values assigned to intangible assets were determined through use of a combination of the income, market and costs methods. The goodwill recognized from the transaction is primarily associated with Red Sky’s specialized and technical workforce. The acquisition of Red Sky was a taxable transaction and as a result, the goodwill and acquired intangible assets are deductible for income tax purposes.
The Company incurred $0.4 million of acquisition related costs during the fiscal year ended June 30, 2018 associated with the Red Sky Acquisition, which are presented as part of transaction costs in the consolidated statements of operations.
The following table summarizes the purchase price allocation for the Red Sky Acquisition (in millions):
Computation of purchase price: | ||||
Cash paid to sellers | $ | 36.6 | ||
Receivable due from escrow | (0.2 | ) | ||
Fair value of equity consideration | 4.1 | |||
Total consideration | $ | 40.5 | ||
Allocation of purchase price: | ||||
Fair value of assets acquired | ||||
Cash | $ | 3.0 | ||
Accounts receivable | 7.2 | |||
Unbilled accounts receivable | 0.3 | |||
Inventory | 0.2 | |||
Prepaid expenses and other current assets | 1.3 | |||
Property and equipment | 1.7 | |||
Goodwill | 19.6 | |||
Identifiable intangible assets | 18.5 | |||
Fair value of liabilities assumed | ||||
Accounts payable - trade | (8.5 | ) | ||
Accrued expenses and other current liabilities | (2.8 | ) | ||
Total net assets acquired | $ | 40.5 | ||
89
PRESIDIO, INC.
NOTES TO CONSOLIDATED FINANCIAL STATEMENTS
Emergent Networks, LLC
On August 31, 2017, the Company completed the acquisition of all of the issued and outstanding units of Emergent Networks, LLC (“Emergent”) for total consideration of approximately $9.3 million. The acquisition of Emergent expanded our geographic footprint in Minnesota. The Company incurred $0.1 million of acquisition related costs during the fiscal year ended June 30, 2018 associated with the acquisition of Emergent, which are presented as part of transaction costs in the consolidated statements of operations. In connection with this acquisition, the Company recognized $4.3 million of identifiable intangible assets and $2.6 million of goodwill.
Netech Corporation
On February 1, 2016, pursuant to an asset purchase agreement dated as of December 31, 2015, a wholly-owned subsidiary of the Company acquired certain assets and assumed certain liabilities of the Netech Corporation (“Netech Acquisition”) comprising the Netech business (“Netech”). Total consideration was $250.5 million, which included $240.1 million paid in cash and $11.0 million paid in 1,257,142 shares of the Company’s common stock. In the absence of a public trading market for our common stock at the time of the acquisition, the value of the common stock provided as consideration was determined contemporaneously using a combination of the market approach valuation method of comparable companies and an income approach valuation method based on discounted cash flows. The Netech Acquisition enables the Company to further broaden its portfolio of services and solutions and significantly expand its capabilities within the midwestern United States.
The Netech Acquisition was funded through the combination of a new $150.0 million senior credit facility, an incremental $25.0 million term loan borrowing under the Company’s existing senior credit facility, a borrowing under the Company’s accounts receivable securitization facility and available cash on hand.
In accordance with the acquisition method, the acquired assets and assumed liabilities of the Netech business have been recognized at fair value as of February 1, 2016. The fair values assigned to the assets and liabilities were derived using a combination of the income approach, the market approach and the cost approach. The significant estimates that were used in calculating the fair values include useful lives, estimated selling prices, disposal costs, costs to complete, and reasonable profit. The fair values assigned to intangible assets were determined through the use of the relief from royalty method and the excess earnings method. The goodwill recognized from the transaction is primarily associated with Netech’s specialized and technical workforce, its positioning in the marketplace, potential synergies and the Company’s belief in its potential for continued growth. The Netech Acquisition was a taxable transaction, and as a result, the goodwill and acquired intangible assets are deductible for income tax purposes.
90
PRESIDIO, INC.
NOTES TO CONSOLIDATED FINANCIAL STATEMENTS
The following table summarizes the purchase price allocation for the Netech Acquisition (in millions):
Computation of purchase price: | ||||
Cash paid to sellers | $ | 240.1 | ||
Receivable due from escrow | (0.6 | ) | ||
Fair value of equity consideration | 11.0 | |||
Total consideration | $ | 250.5 | ||
Allocation of purchase price: | ||||
Fair value of assets acquired: | ||||
Accounts receivable | $ | 70.2 | ||
Unbilled accounts receivable | 7.5 | |||
Inventory | 9.0 | |||
Prepaid expenses and other current assets | 5.0 | |||
Property and equipment | 2.3 | |||
Goodwill | 108.2 | |||
Identifiable intangible assets | 107.0 | |||
Other assets | 2.4 | |||
Fair value of liabilities assumed: | ||||
Accounts payable - trade | (2.3 | ) | ||
Accounts payable - floor plan | (40.5 | ) | ||
Accrued expenses and other current liabilities | (18.3 | ) | ||
Total net assets acquired | $ | 250.5 | ||
Gross contractual receivables acquired were $70.4 million of accounts receivable and $7.5 million of unbilled receivables.
The Company incurred $4.5 million of acquisition related costs during the fiscal year ended June 30, 2016 associated with the Netech Acquisition, which are presented as part of transaction costs in the consolidated statements of operations. In August 2016, the Company collected the $0.6 million that was due back to the Company from escrow accounts as a result of final post-closing purchase price adjustments related to the net working capital as of the closing date of February 1, 2016.
Sequoia Worldwide LLC
On November 23, 2015, the Company acquired certain assets and assumed certain liabilities of Sequoia Worldwide LLC (“Sequoia”) for total consideration of approximately $12.6 million, which included $11.2 million paid in cash and $1.4 million paid in 159,890 shares of the Company’s common stock. In the absence of a public trading market for our common stock at the time of acquisition, the value of the common stock provided as consideration was determined contemporaneously using a market approach valuation method of comparable companies. The acquisition of Sequoia, a firm with deep cloud consulting and integration domain expertise, allows the Company to provide hybrid cloud strategies and service delivery models for our clients.
The fair values assigned to intangible assets were determined through the use of the relief from royalty method and the excess earnings method. The goodwill recognized from the transaction is primarily associated with Sequoia’s specialized and technical workforce. The acquisition of Sequoia was a taxable transaction and as a result, the goodwill and acquired intangible assets are deductible for income tax purposes. Transaction costs associated with the acquisition were immaterial.
91
PRESIDIO, INC.
NOTES TO CONSOLIDATED FINANCIAL STATEMENTS
The following table summarizes the purchase price allocation for the Sequoia acquisition (in millions):
Computation of purchase price: | ||||
Cash paid to sellers | $ | 11.2 | ||
Fair value of equity consideration | 1.4 | |||
Total consideration | $ | 12.6 | ||
Allocation of purchase price: | ||||
Assets assumed | $ | 0.1 | ||
Purchased identifiable intangible assets | 1.0 | |||
Goodwill | 11.5 | |||
Total net assets acquired | $ | 12.6 | ||
Note 3. Disposition of Business
On October 22, 2015, the Company completed the sale of the Atlantix business to a third party for $36.3 million in net proceeds resulting in a $6.8 million loss on the disposal presented within interest and other (income) expense in the consolidated statement of operations. Based on qualitative and quantitative considerations, Atlantix was not considered to be a discontinued operation for financial reporting purposes. The carrying amounts of the assets and liabilities included as part of the disposal were as follows (in millions):
Carrying amount of assets disposed | |||
Accounts receivable | $ | 13.4 | |
Inventory | 7.4 | ||
Prepaid expenses and other current assets | 1.1 | ||
Property and equipment | 7.0 | ||
Equipment under operating leases, net | 0.3 | ||
Identifiable intangible assets, net | 26.4 | ||
Carrying amount of liabilities disposed | |||
Accounts payable - trade | (3.2 | ) | |
Accrued expenses and other current liabilities | (9.3 | ) | |
Net assets disposed | $ | 43.1 | |
Note 4. Accounts and Unbilled Receivables
Accounts receivable consisted of the following (in millions):
June 30, 2017 | June 30, 2018 | ||||||
Gross accounts receivable | $ | 580.0 | $ | 616.4 | |||
Provision for sales returns and credit losses | (3.7 | ) | (3.1 | ) | |||
Total accounts receivable, net | $ | 576.3 | $ | 613.3 | |||
Unbilled receivables consisted of the following (in millions):
June 30, 2017 | June 30, 2018 | ||||||
Gross unbilled accounts receivable | $ | 160.6 | $ | 157.0 | |||
Provision for sales returns and credit losses | (0.8 | ) | (0.3 | ) | |||
Total unbilled accounts receivable, net | $ | 159.8 | $ | 156.7 | |||
92
PRESIDIO, INC.
NOTES TO CONSOLIDATED FINANCIAL STATEMENTS
Note 5. Prepaid Expense and Other Current Assets
Prepaid expenses and other current assets consisted of the following (in millions):
June 30, 2017 | June 30, 2018 | ||||||
Partner incentive program receivable | $ | 26.2 | $ | 32.7 | |||
Prepaid income taxes | — | 4.9 | |||||
Deferred product costs and other current assets | 37.2 | 43.1 | |||||
Total prepaid expenses and other current assets | $ | 63.4 | $ | 80.7 | |||
Note 6. Financing Receivables and Operating Leases
The Company records the lease receivables related to discounted sales-type or direct financing leases as financing receivables, and the related liability resulting from discounting customer payment streams as discounted financing receivables, in the Company’s consolidated balance sheets. Discounted customer payment streams are typically collateralized by a security interest in the underlying assets being leased. At June 30, 2018 and 2017, the interest rates on discounted leases ranged from 0.0% to 10.0% and 2.0% to 10.5%, respectively.
Financing receivables – The assets and related liabilities for discounted and not discounted sales-type and direct financing leases to financial institutions were as follows (in millions):
June 30, 2017 | Discounted to financial institutions | Not discounted to financial institutions | Total | ||||||||
Minimum lease payments | $ | 197.2 | $ | 4.2 | $ | 201.4 | |||||
Estimated net residual values | — | 7.2 | 7.2 | ||||||||
Unearned income | (9.4 | ) | (0.8 | ) | (10.2 | ) | |||||
Provision for credit losses | — | (0.6 | ) | (0.6 | ) | ||||||
Total, net | $ | 187.8 | $ | 10.0 | $ | 197.8 | |||||
Reported as: | |||||||||||
Current | $ | 80.8 | $ | 3.4 | $ | 84.2 | |||||
Long-term | 107.0 | 6.6 | 113.6 | ||||||||
Total, net | $ | 187.8 | $ | 10.0 | $ | 197.8 | |||||
Discounted financing receivables: | |||||||||||
Nonrecourse | $ | 183.7 | $ | — | $ | 183.7 | |||||
Recourse | — | — | — | ||||||||
Total | $ | 183.7 | $ | — | $ | 183.7 | |||||
Reported as: | |||||||||||
Current | $ | 79.3 | $ | — | $ | 79.3 | |||||
Long-term | 104.4 | — | 104.4 | ||||||||
Total, net | $ | 183.7 | $ | — | $ | 183.7 | |||||
93
PRESIDIO, INC.
NOTES TO CONSOLIDATED FINANCIAL STATEMENTS
June 30, 2018 | Discounted to financial institutions | Not discounted to financial institutions | Total | ||||||||
Minimum lease payments | $ | 207.5 | $ | 2.7 | $ | 210.2 | |||||
Estimated net residual values | — | 7.6 | 7.6 | ||||||||
Unearned income | (11.4 | ) | (0.9 | ) | (12.3 | ) | |||||
Provision for credit losses | — | (0.4 | ) | (0.4 | ) | ||||||
Total, net | $ | 196.1 | $ | 9.0 | $ | 205.1 | |||||
Reported as: | |||||||||||
Current | $ | 85.4 | $ | 2.9 | $ | 88.3 | |||||
Long-term | 110.7 | 6.1 | 116.8 | ||||||||
Total, net | $ | 196.1 | $ | 9.0 | $ | 205.1 | |||||
Discounted financing receivables: | |||||||||||
Nonrecourse | $ | 192.6 | $ | — | $ | 192.6 | |||||
Recourse | — | — | — | ||||||||
Total | $ | 192.6 | $ | — | $ | 192.6 | |||||
Reported as: | |||||||||||
Current | $ | 84.5 | $ | — | $ | 84.5 | |||||
Long-term | 108.1 | — | 108.1 | ||||||||
Total, net | $ | 192.6 | $ | — | $ | 192.6 | |||||
The discounted financing receivables associated with sales-type and direct financing type leases are presented in the consolidated balance sheets together with the discounted financing receivables associated with operating leases, which is discussed below.
Minimum lease payments for discounted and non-discounted sales-type and direct financing leases were as follows (in millions):
Years ending June 30, | Discounted to financial institutions | Not discounted to financial institutions | Total | ||||||||
2019 | $ | 91.4 | $ | 1.1 | $ | 92.5 | |||||
2020 | 60.8 | 0.4 | 61.2 | ||||||||
2021 | 33.7 | 0.5 | 34.2 | ||||||||
2022 | 15.7 | 0.4 | 16.1 | ||||||||
2023 | 5.9 | 0.3 | 6.2 | ||||||||
2024 and thereafter | — | — | — | ||||||||
Total | $ | 207.5 | $ | 2.7 | $ | 210.2 | |||||
Operating leases – Equipment under operating leases and accumulated depreciation presented within other assets in the consolidated balance sheets was as follows (in millions):
June 30, 2017 | June 30, 2018 | ||||||
Equipment under operating leases | $ | 4.6 | $ | 3.4 | |||
Accumulated depreciation | (2.9 | ) | (1.9 | ) | |||
Total equipment under operating leases, net | $ | 1.7 | $ | 1.5 | |||
94
PRESIDIO, INC.
NOTES TO CONSOLIDATED FINANCIAL STATEMENTS
Depreciation and amortization expense associated with equipment under operating leases that is included in cost of product revenue within the Company’s consolidated statements of operations was $1.4 million for the fiscal year ended June 30, 2018, $1.7 million for the fiscal year ended June 30, 2017 and $2.5 million for the fiscal year ended June 30, 2016.
The minimum lease payments related to operating leases discounted or non-discounted were as follows (in millions):
Years ending June 30, | Discounted to financial institutions | Not discounted to financial institutions | Total | ||||||||
2019 | $ | 0.7 | $ | — | $ | 0.7 | |||||
2020 | 0.4 | — | 0.4 | ||||||||
2021 | 0.1 | — | 0.1 | ||||||||
2022 | — | — | — | ||||||||
2023 | — | — | — | ||||||||
2024 and thereafter | — | — | — | ||||||||
Total | $ | 1.2 | $ | — | $ | 1.2 | |||||
Liabilities for discounted operating leases was follows (in millions):
June 30, 2017 | June 30, 2018 | ||||||
Discounted operating leases: | |||||||
Current | $ | 0.7 | $ | 0.7 | |||
Noncurrent | 0.2 | 0.5 | |||||
Total | $ | 0.9 | $ | 1.2 | |||
Note 7. Property and Equipment
Property and equipment and accumulated depreciation and amortization was as follows (in millions):
Estimated useful lives | June 30, 2017 | June 30, 2018 | |||||||
Furniture and fixtures | 3 to 7 years | $ | 5.3 | $ | 8.4 | ||||
Equipment | 3 to 7 years | 22.2 | 28.5 | ||||||
Software | 3 years | 19.9 | 24.4 | ||||||
Leasehold improvements | Life of lease | 13.3 | 16.4 | ||||||
Total property and equipment | 60.7 | 77.7 | |||||||
Accumulated depreciation and amortization | (28.6 | ) | (41.8 | ) | |||||
Total property and equipment, net | $ | 32.1 | $ | 35.9 | |||||
Depreciation and amortization associated with property and equipment that is included in depreciation and amortization within the Company’s consolidated statement of operations was $9.3 million for the fiscal year ended June 30 2018, $8.2 million for the fiscal year ended June 30, 2017 and $8.8 million for the fiscal year ended June 30, 2016.
Depreciation and amortization expense associated with property and equipment directly utilized in support of managed services and managed cloud contracts that is included in cost of service revenue within the Company’s consolidated statement of operations was $4.4 million for the fiscal year ended June 30, 2018, $3.7 million for the fiscal year ended June 30, 2017 and $3.2 million for the fiscal year ended June 30, 2016.
95
PRESIDIO, INC.
NOTES TO CONSOLIDATED FINANCIAL STATEMENTS
Note 8. Goodwill and Identifiable Intangible Assets
Goodwill
Goodwill consisted of the following (in millions):
Gross carrying value | Accumulated impairment charges | Total, net | |||||||||
Balance, June 30, 2016 | 781.5 | — | 781.5 | ||||||||
Acquisitions | — | — | — | ||||||||
Impairment charges | — | — | — | ||||||||
Balance, June 30, 2017 | 781.5 | — | 781.5 | ||||||||
Acquisitions | 22.2 | — | 22.2 | ||||||||
Impairment charges | — | — | — | ||||||||
Balance, June 30, 2018 | $ | 803.7 | $ | — | $ | 803.7 | |||||
No acquisitions were made during the fiscal year ended June 30, 2017. For the fiscal year ended June 30, 2018, goodwill increased by $22.2 million in connection with new acquisitions, of which $19.6 million was associated with the Red Sky Acquisition and $2.6 million was associated with the acquisition of Emergent.
The Company performed an impairment assessment as of March 31 of each year to determine whether it was more likely than not that the fair value of the Company’s reporting unit was less than its carrying amount. Based on the results of these assessments, the Company determined that it was not more likely than not that the fair value of the reporting unit was less than its carrying amount. As a result, the Company concluded that no impairment of its goodwill existed at those dates and, accordingly, no impairment losses have been recorded during any of the periods presented.
Identifiable Intangible Assets
Identifiable intangible assets consisted of the following (in millions):
June 30, 2017 | Range of life (years) | Gross amount | Accumulated amortization | Total, net | |||||||||
Finite-lived intangible assets: | |||||||||||||
Customer relationships | 5 – 10 | $ | 703.2 | $ | (159.8 | ) | $ | 543.4 | |||||
Developed technology | 5 | 3.6 | (1.6 | ) | 2.0 | ||||||||
Trade names | 1 – 2 | 5.1 | (3.6 | ) | 1.5 | ||||||||
Indefinite-lived intangible assets: | |||||||||||||
Trade names | Indefinite | 205.0 | — | 205.0 | |||||||||
Total intangible assets | $ | 916.9 | $ | (165.0 | ) | $ | 751.9 | ||||||
96
PRESIDIO, INC.
NOTES TO CONSOLIDATED FINANCIAL STATEMENTS
June 30, 2018 | Range of life (years) | Gross amount | Accumulated amortization | Total, net | |||||||||
Finite-lived intangible assets: | |||||||||||||
Customer relationships | 5 – 10 | $ | 724.2 | $ | (231.4 | ) | $ | 492.8 | |||||
Developed technology | 5 | 3.6 | (2.3 | ) | 1.3 | ||||||||
Trade names | 2 | 1.8 | (0.6 | ) | 1.2 | ||||||||
Indefinite-lived intangible assets: | |||||||||||||
Trade names | Indefinite | 205.0 | — | 205.0 | |||||||||
Total intangible assets | $ | 934.6 | $ | (234.3 | ) | $ | 700.3 | ||||||
Amortization associated with intangible assets was $74.4 million for the fiscal year ended June 30, 2018, $73.6 million for the fiscal year ended June 30, 2017 and $67.2 million for the fiscal year ended June 30, 2016. The weighted-average remaining useful life of the finite-lived intangible assets was 6.6 years as of June 30, 2018.
The Company performed an impairment assessment as of March 31 of each year on the indefinite-lived trade names to determine whether it was more likely than not that the fair value of the trade names was less than their carrying amounts. Based on the results of these assessments, the Company determined that it was not more likely than not that the fair value of its trade names was less than their carrying amount. As a result, the Company concluded that no impairment of its trade names existed at those dates. The Company did not identify or record any impairment losses related to its trade names during any of the periods presented.
Based on the finite-lived intangible assets recorded at June 30, 2018, the annual amortization expense is expected to be as follows (in millions):
Years ending June 30, | |||
2019 | $ | 75.2 | |
2020 | 74.3 | ||
2021 | 73.6 | ||
2022 | 73.5 | ||
2023 | 72.8 | ||
2024 and thereafter | 125.9 | ||
Total | $ | 495.3 | |
Note 9. Accounts Payable - Floor Plan
The accounts payable – floor plan balances on the consolidated balance sheets relate to an agreement with a financial institution that provides an indirect wholly-owned subsidiary of the Company with funding for discretionary inventory purchases from approved vendors. Payables are due within 90 days and are non-interest bearing provided they are paid when due. In accordance with the agreement, the financial institution has been granted a senior security interest in the indirect wholly-owned subsidiary’s inventory purchased under the agreement and accounts receivable arising from the sale thereof. Payments on the facility are guaranteed by Presidio LLC and subsidiaries. As of June 30, 2018, the aggregate availability for purchases under the floor plan is the lesser of $325.0 million or the liquidation value of the pledged assets. The balances outstanding under the accounts payable – floor plan facility were $210.6 million and $264.9 million as of June 30, 2018 and 2017, respectively.
97
Note 10. Accrued Expenses and Other Current Liabilities
Accrued expenses and other current liabilities consisted of the following (in millions):
June 30, 2017 | June 30, 2018 | ||||||
Accrued compensation | $ | 64.5 | $ | 61.1 | |||
Accrued interest | 11.7 | 8.3 | |||||
Accrued equipment purchases/vendor expenses | 78.3 | 56.9 | |||||
Accrued income taxes | 7.3 | 5.7 | |||||
Accrued non-income taxes | 7.4 | 8.2 | |||||
Customer deposits, current portion | 5.1 | 3.5 | |||||
Unearned revenue | 40.0 | 47.6 | |||||
Other accrued expenses and current liabilities | 2.0 | 1.9 | |||||
Total accrued expenses and other current liabilities | $ | 216.3 | $ | 193.2 | |||
Note 11. Long-Term Debt and Credit Agreements
Long-term debt consisted of the following (in millions):
June 30, 2017 | June 30, 2018 | ||||||
Revolving credit facility | $ | — | $ | — | |||
Receivable securitization facility | — | — | |||||
Term loan facility, due February 2022 | 626.6 | — | |||||
Term loan facility, due February 2024 | — | 686.6 | |||||
Senior notes, 10.25% due February 2023 | 125.0 | — | |||||
Total long-term debt | 751.6 | 686.6 | |||||
Unamortized debt issuance costs | (20.9 | ) | (15.4 | ) | |||
Total long-term debt, net of debt issuance costs | $ | 730.7 | $ | 671.2 | |||
Reported as: | |||||||
Current | $ | — | $ | — | |||
Long-term | 730.7 | 671.2 | |||||
Total long-term debt, net of debt issuance costs | $ | 730.7 | $ | 671.2 | |||
February 2015 Credit Facilities
On February 2, 2015, Presidio LLC and PNS (the “Borrowers”), two wholly-owned subsidiaries of the Company, entered into a senior secured credit facility (the “February 2015 Credit Agreement”) which provided a $600.0 million term loan (“February 2015 Term Loan”) with a seven year maturity and a $50.0 million revolving credit facility (“February 2015 Revolver”) with a five year maturity (collectively referred to as the “February 2015 Credit Facilities”).
On February 1, 2016, as part of the Netech Acquisition discussed in Note 2, the Borrowers entered into Incremental Assumption Agreement and Amendment No. 2 to the February 2015 Credit Agreement for an incremental $25.0 million term loan borrowing. The $25.0 million incremental term loan under the credit facility is subject to the same terms and conditions as the then-existing term loans under the February 2015 Credit Agreement.
On May 27, 2016, the Borrowers entered into Incremental Assumption Agreement and Amendment No. 3 (the “May 2016 Amendment”) to the February 2015 Credit Agreement for an incremental $140.0 million term loan borrowing. The proceeds of the incremental term loan were used to, among other things, repay in full the remaining $115.0 million outstanding on the credit facility incurred in connection with the Netech Acquisition. The $140.0 million incremental term loan under the credit facility is subject to the same terms and conditions as the then-existing term loans under the February 2015 Credit Agreement.
98
PRESIDIO, INC.
NOTES TO CONSOLIDATED FINANCIAL STATEMENTS
On January 19, 2017, the Borrowers entered into Incremental Assumption Agreement and Amendment No. 4 (the “January 2017 Amendment”) to, among other things, lower the applicable margin for all term loans outstanding under the February 2015 Credit Agreement to 3.50% in the case of LIBOR rate borrowings and 2.50% in the case of base rate borrowings. In addition, the January 2017 Amendment provided that from and after the date that Presidio Holdings delivers a certificate to the administrative agent certifying that (i) a qualifying initial public offering has occurred and (ii) as of the date of such certificate, the net total leverage ratio, calculated on a pro forma basis, is less than 4.00 to 1.00, the applicable margin for term loans outstanding under the February 2015 Credit Agreement would be reduced by an additional 0.25%. In addition, the January 2017 Amendment reset the amortization payments at a rate of 1.00% per annum, payable quarterly on the principal amount of term loans outstanding as of the date of the January 2017 Amendment, which principal amount was $703.6 million.
On January 5, 2018, the Borrowers entered into an Incremental Assumption Agreement and Amendment No. 6 (the “Sixth Amendment” or the “January 2018 Amendment”) amending the February 2015 Credit Agreement, by and among the Borrowers, the guarantors party thereto, the lenders party thereto and Credit Suisse AG, Cayman Islands Branch, as administrative agent.
Pursuant to the Sixth Amendment, the Borrowers (i) refinanced all $576.6 million in aggregate principal amount of term loans outstanding under the Credit Agreement (the “Existing Term Loans”) and (ii) borrowed $140.0 million in aggregate principal amount of incremental term loans, in each case with new term loans (the “New Term Loans”) under the February 2015 Credit Agreement.
The New Term Loans have an interest rate of LIBOR plus 2.75% (with a LIBOR floor of 1.0%) or base rate plus 1.75% (reduced from the interest rates of LIBOR plus 3.25% or base rate plus 2.25% applicable to the Existing Term Loans), and a maturity date of February 2, 2024 (two years longer than the maturity date of the Existing Term Loans). The New Term Loans were issued at a price equal to 99.75% of their face value.
In accordance with the terms of the February 2015 Credit Agreement, the Borrowers may request one or more incremental term loan facilities and/or increase commitments under the February 2015 Revolver in an aggregate amount of up to the sum of $125.0 million plus additional amounts so long as, (i) in the case of loans under additional credit facilities secured by liens (other than to the extent such liens are expressly subordinated in writing to the liens on the collateral securing the February 2015 Credit Agreement), the consolidated net first lien secured leverage ratio would be no greater than 3.75 to 1.00 and (ii) in the case of loans under additional credit facilities that would not be included in the computation of the consolidated net first lien secured leverage ratio, the consolidated net secured leverage ratio would be no greater than 4.25 to 1.00, subject to certain conditions and receipt of commitments by existing or additional lenders.
The Borrowers may voluntarily repay outstanding loans under the February 2015 Credit Agreement at any time without prepayment premium or penalty except in connection with a repricing event, subject to customary “breakage” costs with respect to LIBOR rate loans.
All obligations under the February 2015 Credit Agreement are unconditionally guaranteed by Presidio Holdings and each of its existing and future direct and indirect, wholly-owned domestic subsidiaries, subject to certain exceptions. The obligations are secured by substantially all assets of the Borrowers and each guarantor, including capital stock of the Borrowers and subsidiary guarantors, in each case subject to certain exceptions. The February 2015 Credit Agreement is subject to an intercreditor agreement with the accounts payable – floor plan that provides that certain security interests in assets securing the February 2015 Credit Agreement shall be subordinate to the security interests on the collateral securing the obligations under the accounts payable – floor plan described in Note 9.
The February 2015 Credit Agreement contains certain customary affirmative covenants, negative covenants and events of default. The negative covenants in the February 2015 Credit Agreement include, among other things, limitations (subject in each case to exceptions) on the ability of the Borrowers, the guarantors and their restricted subsidiaries to:
• | incur additional debt or issue certain preferred shares; |
• | create liens on certain assets; |
• | make certain loans or investments (including acquisitions); |
• | pay dividends on or make distributions in respect of capital stock or make other restricted payments; |
• | consolidate, merge, sell or otherwise dispose of all or substantially all of their assets; |
99
PRESIDIO, INC.
NOTES TO CONSOLIDATED FINANCIAL STATEMENTS
• | sell assets; |
• | enter into certain transactions with affiliates; |
• | enter into sale-leaseback transactions; |
• | change lines of business; |
• | restrict dividends from their subsidiaries or restrict liens; |
• | change their fiscal year; and |
• | modify the terms of certain debt or organizational agreements. |
February 2015 Term Loan – Borrowings under the February 2015 Term Loan bear interest at a rate equal to, at the Borrowers’ option, either:
(a) | the LIBOR rate determined by reference to the cost of funds for Eurodollar deposits for the interest period relevant to such borrowing, adjusted for certain additional costs, subject to a 1.00% floor in the case of term loans, plus an applicable margin; or |
(b) | the base rate determined by reference to the highest of: |
(i) | the federal funds rate plus 0.50%, |
(ii) | the prime rate, or |
(iii) | one-month adjusted LIBOR plus 1.00%; plus an applicable margin. |
The applicable margin for term loans is 2.75% in the case of LIBOR rate borrowings and 1.75% in the case of base rate borrowings as of June 30, 2018, resulting from the January 2018 Amendment. As of June 30, 2018, due to voluntary prepayments made on the term loans subsequent to the January 2018 Amendment, $11.2 million of amortization payments are due prior to the maturity of the February 2015 Term Loan.
The February 2015 Credit Agreement requires the Borrowers to prepay outstanding term loan borrowings, subject to certain exceptions, with:
• | 75% (which percentage will be reduced to 50% if the consolidated net first lien secured leverage ratio is less than or equal to 3.00 to 1.00, reduced to 25% if the consolidated net first lien secured leverage ratio is less than or equal to 2.50 to 1.00, and reduced to 0% if the consolidated net first lien secured leverage ratio is less than or equal to 2.00 to 1.00) of the Borrowers’ annual excess cash flow, as defined under the February 2015 Credit Agreement; |
• | 100% of the net cash proceeds of all non-ordinary course asset sales, other dispositions of property or certain casualty events, in each case subject to certain exceptions and provided that the Company may (a) reinvest within 12 months or (b) commit to reinvest those proceeds within 12 months and so reinvest such proceeds within 18 months in assets to be used in the business, or certain other permitted investments; and |
• | 100% of the net cash proceeds of any issuance or incurrence of debt, other than proceeds from debt permitted under the February 2015 Credit Agreement. |
For the fiscal year ended June 30, 2018, there are no additional prepayments required based on the Borrowers’ calculation of the annual excess cash flow.
The February 2015 Term Loan was originally a $600.0 million term loan with a seven year maturity of February 2, 2022. The borrowing was issued at 97.0% of par, resulting in an original issue discount of $18.0 million. The Company incurred $15.0 million of deferred financing costs associated with the original term loan, resulting in total deferred issuance costs of $33.0 million.
100
PRESIDIO, INC.
NOTES TO CONSOLIDATED FINANCIAL STATEMENTS
The $140.0 million borrowing entered into pursuant to the May 2016 Amendment was issued at 99.5% of par, resulting in $0.7 million of original issue discount. In accordance with debt modification accounting, the Company recorded an additional $0.1 million in deferred issuance costs associated with the amendment.
In association with the January 2018 Amendment, the Company incurred $2.9 million in professional fees which are presented within transaction costs on the Company's consolidated statement of operations and capitalized $2.4 million of debt issuance costs, inclusive of original issuance discount, presented on a net basis along with the associated debt obligations on the Company's consolidated balance sheet.
The Company has made $80.0 million in aggregate voluntary prepayments of term loans under the February 2015 Credit Agreement during the fiscal year ended June 30, 2018, resulting in $2.1 million loss on extinguishment of debt reflected in the Company’s consolidated statement of operations associated with the write-off of debt issuance costs.
February 2015 Revolver– The February 2015 Revolver provides a $50.0 million revolving credit facility with a $25.0 million sublimit available for letters of credit and a swingline loan sub facility maturing February 2, 2020.
Borrowings under the February 2015 Revolver bear interest at a rate equal to, at the Borrowers’ option, either:
(a) | the LIBOR rate determined by reference to the cost of funds for Eurodollar deposits for the interest period relevant to such borrowing, adjusted for certain additional costs, subject to a 1.00% floor in the case of term loans; or |
(b) | the base rate determined by reference to the highest of: |
(i) | the federal funds rate plus 0.50%, |
(ii) | the prime rate, or |
(iii) | one-month adjusted LIBOR plus 1.00%, plus an applicable margin. |
The applicable margin for revolving loans is 4.25% in the case of LIBOR rate borrowings and 3.25% in the case of base rate borrowings (with margins for revolving loans subject to certain reductions based on a net first lien leverage ratio).
In addition to paying interest on the outstanding principal under the February 2015 Revolver, the Borrowers are required to pay a commitment fee equal to 0.50% (subject to a step-down to 0.375% based on achievement of a specified net first lien leverage ratio) in respect of the unutilized commitments under the facility. The Borrowers are also required to pay customary agency fees as well as letter of credit participation fees computed at a rate per annum equal to the applicable margin for LIBOR rate borrowings on the dollar equivalent of the daily stated amount of outstanding letters of credit, plus such letter of credit issuer’s customary documentary and processing fees and charges and customary fronting fees.
All borrowings under the February 2015 Revolver are subject to the satisfaction of customary conditions, including the absence of a default and the accuracy of representations and warranties.
The February 2015 Revolver requires that Presidio Holdings, after an initial grace period and subject to a testing threshold, comply on a quarterly basis with a maximum first lien net senior secured leverage ratio. The testing threshold is met if, at the end of any applicable fiscal quarter, the sum of outstanding exposure under the February 2015 Revolver exceeds 30% of the outstanding commitments under the revolving credit facility at such time.
In conjunction with entering into the February 2015 Credit Agreement, the Company incurred $1.3 million in deferred financing costs associated with the February 2015 Revolver.
As of June 30, 2018 and 2017, there were no outstanding borrowings on the February 2015 Revolver and there were $1.8 million and $1.5 million in letters of credit outstanding, respectively. The Company is in compliance with the covenants and had and $48.2 million and $48.5 million available for borrowings under the facility as of June 30, 2018 and 2017, respectively.
101
PRESIDIO, INC.
NOTES TO CONSOLIDATED FINANCIAL STATEMENTS
Senior and Senior Subordinated Notes
In conjunction with the Presidio Acquisition, on February 2, 2015, Presidio Holdings issued a series of senior notes (“Senior Notes”) in an aggregate principal amount of $250.0 million, and a series of senior subordinated notes (“Senior Subordinated Notes”) in an aggregate amount of $150.0 million (collectively referred to as the “Notes”), each of which were to mature on February 15, 2023.
On February 15, 2017, the Company entered into a senior subordinated notes purchase agreement with Deutsche Bank AG, who was the holder of 100% of the remaining $111.8 million of outstanding Senior Subordinated Notes, pursuant to which the Company agreed to use the net proceeds of the IPO to repurchase, and Deutsche Bank AG agreed to sell, all of the outstanding Senior Subordinated Notes at the Senior Subordinated Notes Repurchase Price as defined in the indenture. On March 15, 2017 (the “Repurchase Date”), the Company used proceeds from the initial public offering, together with cash on hand, to repurchase and cancel the $111.8 million in aggregate principal amount of outstanding 10.25% Senior Subordinated Notes at a repurchase price equal to 110.25% of the principal amount, plus accrued and unpaid interest to, but excluding, the Repurchase Date. In connection with the cancellation, the Company satisfied and discharged its obligations under the indenture. As a result of the repurchase and cancellation of the Senior Subordinated Notes, the Company recorded a $13.5 million loss on extinguishment of debt which includes the repurchase premium of $11.5 million and the write-off of $2.0 million of related debt issuance costs.
On February 17, 2017, the Company provided notice to the trustee of the Senior Notes that on March 20, 2017 (the “Redemption Date”), the Company intended to redeem up to $97.5 million in aggregate principal amount of its 10.25% Senior Notes, subject to the satisfaction or waiver of certain conditions. Pursuant to the IPO, such conditions were satisfied and so on March 20, 2017, $97.5 million in aggregate principal amount of the Senior Notes were redeemed at a redemption price equal to 110.25% of the principal amount of the Senior Notes being redeemed, plus accrued and unpaid interest to, but excluding, the Redemption Date. As a result of the redemption of the $97.5 million in aggregate principal amount of Senior Notes, the Company recorded a $11.8 million loss on extinguishment of debt which includes the redemption premium of $10.0 million and the write-off of $1.8 million of related debt issuance costs.
Proceeds from the New Term Loans obtained pursuant to the January 2018 Amendment noted above were used to (i) refinance all of the Existing Term Loans, (ii) redeem all of the $125.0 million remaining outstanding Senior Notes in accordance with the optional redemption provisions contained in the indenture governing the Senior Notes and (iii) pay the redemption premium on the Senior Notes, accrued and unpaid interest, and other fees and expenses payable in connection with the foregoing. In connection with the redemption of the Senior Notes, the Company recorded a loss on extinguishment of debt of $12.6 million, of which $1.9 million related to write-offs of unamortized debt issuance costs.
Receivables Securitization Facility
The Company maintains an accounts receivable securitization facility (“Receivables Securitization Facility”) originally issued in April 2008 whereby each of PNS and Atlantix (prior to its disposal) sells its trade receivables on a continuous basis to a wholly-owned non-operating subsidiary of the Company, Presidio Capital Funding, LLC (“PCF”). PCF then grants, without recourse, a senior undivided security interest in the pooled receivables to the administrative agent of the facility, PNC Bank, while maintaining a subordinated undivided security interest in any over-collateralization of the pooled receivables. Presidio LLC services the receivables for PCF at market rates, and accordingly, no servicing asset or liability has been recorded. Upon and after the sale or contribution of the accounts receivable to PCF, such accounts receivable are assets of PCF and, as such, are not available to creditors of the Company or its other subsidiaries.
The Receivables Securitization Facility provides for borrowing capacity subject to a borrowing limit that is based on eligible receivables, as defined in the securitization agreements. Interest is calculated daily but payable monthly based on a Eurodollar borrowing rate plus a utilized program fee of 1.40%. The Company also incurs a commitment fee of 0.50% or 0.40%, depending on utilization. At June 30, 2018, the interest rate was 3.49% and the commitment fee was 0.50%.
In connection with the Presidio Acquisition, the committed amount of the Receivables Securitization Facility was increased from $150.0 million to $200.0 million, and the maturity date was extended from March 31, 2017 to the date three years after the closing of the Presidio Acquisition, which is February 2, 2018. The February 2, 2015 amendment to the Receivables Securitization Facility resulted in $0.8 million of additional debt issuance costs.
102
PRESIDIO, INC.
NOTES TO CONSOLIDATED FINANCIAL STATEMENTS
On February 8, 2016, the Receivables Securitization Facility was amended to increase the commitment amount from $200.0 million to $250.0 million. All other terms and conditions remained unchanged. The Company incurred $0.1 million in deferred financing costs associated with the February 8, 2016 amendment.
Accounts receivable purchased by PCF are subject to the satisfaction of customary conditions, including the absence of a termination event and the accuracy of representations and warranties. The obligations under the Receivables Securitization Facility are secured by PCF’s right, title and interest in the pool of receivables and certain related assets. The facility requires that Presidio LLC comply with a minimum fixed charge coverage ratio of 1.0 to 1.0 if its excess liquidity, as defined in the facility, falls below $35.0 million for at least five consecutive days. The Company was in compliance with this covenant as of June 30, 2017.
On November 28, 2017, the Company entered into Amendment No. 2 to the Second Amended and Restated Receivables Purchase Agreement and Reaffirmation of Performance Guaranty which, among other things, extended the maturity of the facility to November 28, 2020. The Company incurred $0.6 million in deferred financing costs associated with this amendment.
As of June 30, 2018 and 2017, respectively, there were no outstanding borrowings under the Receivables Securitization Facility. The Company had $248.0 million and $175.5 million available under the Receivables Securitization Facility based on the collateral available as of June 30, 2018 and 2017, respectively.
Debt Issuance Costs
The Company amortizes original issue discount and deferred financing costs (collectively, "debt issuance cost") using the effective interest method over the life of the related debt instrument, and such amortization is included in interest expense in the consolidated statements of operations.
The following table details the debt issuance costs for the periods presented (in millions):
Other Assets | Long-Term Debt | ||||||||||||||||||||||||||
Revolving credit facilities | Term loan, due February 2019 | Term loan facility, due February 2022 | Term loan facility, due February 2024 | Senior Notes | Senior subordinated notes | Total | |||||||||||||||||||||
Balance, June 30, 2015 | $ | 2.9 | $ | — | $ | 30.4 | $ | — | $ | 6.0 | $ | 3.5 | $ | 42.8 | |||||||||||||
Additions | 0.1 | 8.4 | 1.0 | — | — | — | 9.5 | ||||||||||||||||||||
Extinguishments | — | (7.7 | ) | — | — | (0.6 | ) | (0.9 | ) | (9.2 | ) | ||||||||||||||||
Amortization | (1.1 | ) | (0.7 | ) | (4.7 | ) | — | (0.8 | ) | (0.3 | ) | (7.6 | ) | ||||||||||||||
Balance, June 30, 2016 | 1.9 | — | 26.7 | — | 4.6 | 2.3 | 35.5 | ||||||||||||||||||||
Additions | — | — | — | — | — | — | — | ||||||||||||||||||||
Extinguishments | — | — | (3.2 | ) | — | (1.8 | ) | (2.0 | ) | (7.0 | ) | ||||||||||||||||
Amortization | (0.8 | ) | — | (4.8 | ) | — | (0.6 | ) | (0.3 | ) | (6.5 | ) | |||||||||||||||
Balance, June 30, 2017 | 1.1 | — | 18.7 | — | 2.2 | — | 22.0 | ||||||||||||||||||||
Modifications | — | — | (15.3 | ) | 15.3 | — | — | — | |||||||||||||||||||
Additions | 0.8 | — | — | 2.4 | — | — | 3.2 | ||||||||||||||||||||
Extinguishments | — | — | (1.4 | ) | (0.7 | ) | (1.9 | ) | — | (4.0 | ) | ||||||||||||||||
Amortization | (0.7 | ) | — | (2.0 | ) | (1.5 | ) | (0.3 | ) | — | (4.5 | ) | |||||||||||||||
Balance, June 30, 2018 | $ | 1.2 | $ | — | $ | — | $ | 15.5 | $ | — | $ | — | $ | 16.7 | |||||||||||||
103
PRESIDIO, INC.
NOTES TO CONSOLIDATED FINANCIAL STATEMENTS
Long-Term Debt Maturities
As of June 30, 2018, the maturities of long-term debt were as follows (in millions):
Years ending June 30, | |||
2019 | $ | — | |
2020 | — | ||
2021 | — | ||
2022 | 0.4 | ||
2023 | 7.2 | ||
2024 and thereafter | 679.0 | ||
Total | $ | 686.6 | |
Note 12. Fair Value Measurements
For certain of the Company’s financial instruments, including cash and cash equivalents, accounts and unbilled receivables, accounts payable – trade, accounts payable – floor plan, and other accrued liabilities, the carrying amount approximates fair value due to the short-term maturities of these instruments. Additionally, the Company’s financing receivables and liabilties and acquisition-related liabilities were measured at their respective fair values upon initial recognition.
The fair value hierarchy for the Company’s financial assets and liabilities measured at fair value were as follows as of June 30, 2017 (in millions):
Fair Value Measurements | |||||||||||||||
Carrying Value | Level 1 | Level 2 | Level 3 | ||||||||||||
Liabilities: | |||||||||||||||
Term loan | 626.6 | — | 627.4 | — | |||||||||||
Senior notes | 125.0 | — | 138.8 | — | |||||||||||
Total | $ | 751.6 | $ | — | $ | 766.2 | $ | — | |||||||
The fair value hierarchy for the Company’s financial assets and liabilities measured at fair value were as follows as of June 30, 2018 (in millions):
Fair Value Measurements | |||||||||||||||
Carrying Value | Level 1 | Level 2 | Level 3 | ||||||||||||
Liabilities: | |||||||||||||||
Term loan | $ | 686.6 | $ | — | $ | 684.1 | $ | — | |||||||
Total | $ | 686.6 | $ | — | $ | 684.1 | $ | — | |||||||
The fair value of the Company’s term loans and senior notes are estimated based on quoted market prices for the debt, which is traded in over-the-counter secondary markets that are not considered active. The carrying value of the Company’s term loans and senior notes exclude unamortized debt issuance costs.
For certain of the Company’s nonfinancial assets, including goodwill, intangible assets, and property and equipment, the Company may be required to assess the fair values of these assets, on a recurring or nonrecurring basis, and record an impairment if the carrying value exceeds the fair value. In determining the fair value of these assets, the Company may use a combination of valuation methods which include Level 3 inputs. For the periods presented, there were no impairments charges. See Notes 1 and 8 for additional information regarding the Company’s determination of fair value regarding goodwill and indefinite-lived intangible assets.
104
PRESIDIO, INC.
NOTES TO CONSOLIDATED FINANCIAL STATEMENTS
In conjunction with the acquisitions discussed in Note 2, the Company used a combination of valuation methods which include Level 3 inputs in determining the fair values of the assets and liabilities acquired as well as the fair value of the consideration transferred, which included equity and equity instruments.
Note 13. Commitments and Contingencies
Operating leases– The Company leases office space in 68 locations under operating leases which were generally five to seven years in duration at lease inception, with an average remaining life of 3.1 years at June 30, 2018. Total rent expense charged to operations was $10.5 million for the fiscal year ended June 30, 2018, $11.2 million for the fiscal year ended June 30, 2017 and $9.0 million for the fiscal year ended June 30, 2016.
Future minimum rental payments required under the leases are as follows (in millions):
Years ending June 30, | |||
2019 | $ | 11.3 | |
2020 | 10.9 | ||
2021 | 9.4 | ||
2022 | 7.0 | ||
2023 | 5.3 | ||
2024 and thereafter | 10.4 | ||
Total | $ | 54.3 | |
Claims and assessments– In the normal course of business, the Company is subject to certain claims and assessments that arise in the ordinary course of business. The Company records a liability when the Company believes that it is both probable that a loss has been incurred and the amount can be reasonably estimated. Significant judgment is required to determine the outcome and the estimated amount of a loss related to such matters. Management believes that there are no claims or assessments outstanding which would materially affect the consolidated results of operations or financial position of the Company.
Note 14. Stockholders' Equity
Common Stock
Holders of common stock are entitled to one vote per share on all matters to be voted upon by the stockholders. The holders of common stock will not have cumulative voting rights in the election of directors. Holders of common stock are entitled to ratably receive dividends if, and when, dividends are declared from time to time by our Board of Directors out of funds legally available for that purpose, after payment of dividends required to be paid on outstanding preferred stock, if any. Under Delaware law, the Company can only pay dividends either out of “surplus” or the current or immediately preceding year’s net profits. Surplus is defined as the excess, if any, at any given time, of the total assets of a corporation over its total liabilities and statutory capital. The value of a corporation’s assets can be measured in a number of ways and may not necessarily equal their book value. Upon liquidation, dissolution or winding-up, the holders of common stock are entitled to receive ratably the assets available for distribution to the stockholders after payment of liabilities and accrued but unpaid dividends and liquidation preferences on any outstanding preferred stock. Common stock does not have preemptive or conversion rights. There are no redemption or sinking fund provisions applicable to the common stock.
Preferred Stock
As of June 30, 2018, no preferred stock has been issued by the Company.
Dividends
In accordance with the terms of the credit agreements and the notes indentures, Presidio Holdings has certain limitations on its ability to declare and pay dividends. These limitations include restrictions on the transfer of cash and/or other property between Presidio LLC, Presidio Holdings and Presidio, Inc.
105
PRESIDIO, INC.
NOTES TO CONSOLIDATED FINANCIAL STATEMENTS
All dividends declared are subject to Board approval and will depend on the Company’s results of operations, financial condition, business prospects, capital requirements, contractual restrictions, potential indebtedness the Company may incur, restrictions imposed by applicable law, tax considerations, and other factors that the Company’s Board of Directors deems relevant.
Note 15. Share-Based Compensation
Effective as of February 24, 2017, the Company's Board of Directors adopted the Amended and Restated 2015 Long-Term Incentive Plan (the “2015 LTIP”), the 2017 Long-Term Incentive Plan (the “2017 LTIP”) and the Employee Stock Purchase Plan (the “ESPP”). Following the adoption of the 2017 LTIP Plan, no additional grants will be made under the 2015 LTIP. Prior to the adoption of the initial 2015 LTIP on February 2, 2015, concurrent with the Presidio Acquisition, the Predecessor's equity awards were issued under the Presidio Holdings Inc. LTIP ("Presidio Holdings LTIP").
2017 LTIP
The 2017 LTIP authorizes the issuance of up to 7,200,000 shares of common stock pursuant to the grant or exercise of incentive stock options, nonqualified stock options, stock appreciation rights, restricted stock, restricted stock units, and other equity-based awards. The maximum number of shares of common stock that may be delivered pursuant to incentive stock options is 1,600,000 shares of common stock. In addition, no participant may be granted stock options or stock appreciation rights covering in excess of 1,600,000 shares, restricted stock, restricted stock units, or performance stock units covering in excess of 550,000 shares, or other long-term incentive awards covering in excess of 550,000 shares, in each such case, during any given fiscal year of the Company. Furthermore, no non-employee director may be granted awards under the 2017 LTIP that have a grant date fair value in excess of $500,000 in any given fiscal year.
The 2017 LTIP has a term expiring on February 24, 2027. The Board of Directors may amend, alter, or discontinue the 2017 LTIP, but no amendment, alteration, or discontinuance may materially impair the rights of an equity award previously granted under the 2017 LTIP without the award holder’s consent, except such amendments made to comply with applicable law.
As indicated above, several types of awards are available for grant under the 2017 LTIP. As of June 30, 2018, nonqualified stock options and restricted stock units ("RSUs") have been granted pursuant to the 2017 LTIP as discussed further below.
Stock Options - Stock options granted under the 2017 LTIP may either be incentive stock options or nonqualified stock options. The exercise price of stock options cannot be less than 100% of the fair market value of the stock underlying the stock options on the date of grant. Optionees may pay the exercise price in cash or by “cashless exercise” through a broker or by withholding shares otherwise receivable on exercise. The term of stock options may not have a term longer than ten years from the date of grant. Generally, and subject to the terms of the applicable award agreement, unvested stock options will terminate upon the termination of employment and vested stock options will remain exercisable for 90 days after the award holder’s termination for any other reason. Vested stock options also will terminate upon the award holder’s termination for cause (as defined in the 2017 LTIP). Stock options are transferable only by will or by the laws of descent and distribution, or pursuant to a qualified domestic relations order or, in the case of nonqualified stock options, as otherwise expressly permitted by the committee including, if so permitted, pursuant to a transfer to the participant’s family members, to a charitable organization, whether directly or indirectly, or by means of a trust or partnership or otherwise.
Restricted Stock Units - Restricted stock units granted under the 2017 LTIP are awards denominated in shares that will be settled, subject to the terms and conditions of the restricted stock units, either by delivery of shares to the participant or by the payment of cash based upon the fair market value of a specified number of shares. Except as set forth in the applicable award agreement, any restricted stock units still subject to restriction will terminate upon an award holder's termination of employment for any reason during the restriction period. During the restriction period set by the Committee, the award holder shall not be permitted to sell, assign, transfer, pledge, or otherwise encumber restricted stock units.
As of June 30, 2018, 2,085,764 non-qualified stock options were outstanding under the 2017 LTIP. The outstanding 2017 LTIP stock option grants vest in four equal installments on each of the anniversaries of the grant date, subject to continued services through such vesting date. As of June 30, 2018, 150,000 service-based restricted stock units were outstanding under the 2017 LTIP. The outstanding 2017 LTIP restricted stock units vest in two equal installments on each of the anniversaries of the grant date, subject to continued services through such vesting date.
106
PRESIDIO, INC.
NOTES TO CONSOLIDATED FINANCIAL STATEMENTS
2015 LTIP
The nonqualified stock options issued under the 2015 LTIP are comprised of (i) fully vested stock options that were rolled over from the Presidio Holdings LTIP at the time of the Presidio Acquisition (the “Rolled options”) and (ii) stock options issued proportionally as 50% Tranche A stock options, 25% Tranche B stock options and 25% Tranche C stock options, except for awards issued to non-employee directors that were issued as three-year service-based awards. The Tranche A options are service-based stock options and vest in five equal installments on each of the first five anniversaries of the grant date, subject to the employee’s continued employment or the director’s continued service with the Company through these dates. The Tranche B and Tranche C stock options are performance-based and market-based stock options, with vesting being contingent upon the achievement of certain market conditions by the Apollo Funds in cash pursuant to a liquidity event, subject to the employee’s continued employment with the Company through the date of achievement. In the event of a change in control, any Tranche A options that have not previously vested shall become fully vested and exercisable at the time of such change in control, subject to the employee’s continued employment with the Company through this date. Any Tranche B and Tranche C stock options that have not vested prior to, or become vested at the time of, a change in control shall be converted into time-vesting options that vest in equal annual installments on each anniversary of the change in control occurring during the remainder of the stock option term, subject to the employee’s continued employment with the Company through these dates. Subsequent to the IPO, all stock options remained outstanding and continued to vest in accordance with their original vesting terms.
As of June 30, 2018, 6,315,468 nonqualified stock options were outstanding under the 2015 LTIP, of which 946,152 were Rolled options that were fully vested, 2,343,348 were Tranche A stock options and 3,025,968 were Tranche B stock options and Tranche C stock options. In conjunction with the IPO, the performance condition for the Tranche B and Tranche C stock options was deemed met, but as of June 30, 2018, the market condition for vesting had not yet been realized.
Nonqualified Option Activity
A summary of the nonqualified stock option activity for the fiscal year ended June 30, 2018 was as follows:
Service and Rolled options outstanding | ||||||||||||||||||||||||||||||||
Total outstanding options | Vested (exercisable) options | Nonvested options | ||||||||||||||||||||||||||||||
Weighted-average | Weighted-average | Weighted-average | ||||||||||||||||||||||||||||||
Number of options | Exercise price | Fair value | Number of options | Exercise price | Fair value | Number of options | Exercise price | Fair value | ||||||||||||||||||||||||
Balance, June 30, 2017 | 6,801,591 | 6.88 | 3.20 | 2,756,683 | 2.98 | 3.03 | 4,044,908 | 9.53 | 3.32 | |||||||||||||||||||||||
Granted | 451,992 | 15.13 | 5.53 | — | — | — | 451,992 | 15.13 | 5.53 | |||||||||||||||||||||||
Vested | — | — | — | 1,095,473 | 8.76 | 2.82 | (1,095,473 | ) | 8.76 | 2.82 | ||||||||||||||||||||||
Exercised | (1,389,341 | ) | 3.43 | 2.90 | (1,389,341 | ) | 3.43 | 2.90 | — | — | — | |||||||||||||||||||||
Forfeited | (457,233 | ) | 9.14 | 2.86 | — | — | — | (457,233 | ) | 9.14 | 2.86 | |||||||||||||||||||||
Expired | (31,745 | ) | 3.19 | 3.52 | (31,745 | ) | 3.19 | 3.52 | — | — | — | |||||||||||||||||||||
Balance, June 30, 2018 | 5,375,264 | $ | 8.29 | $ | 3.50 | 2,431,070 | $ | 5.32 | $ | 3.00 | 2,944,194 | $ | 10.74 | $ | 3.91 | |||||||||||||||||
107
PRESIDIO, INC.
NOTES TO CONSOLIDATED FINANCIAL STATEMENTS
Performance and Market options outstanding | ||||||||||||||||||||||||||||||
Total outstanding options | Vested (exercisable) options | Nonvested options | ||||||||||||||||||||||||||||
Weighted-average | Weighted-average | Weighted-average | ||||||||||||||||||||||||||||
Number of options | Exercise price | Fair value | Number of options | Exercise price | Fair value | Number of options | Exercise price | Fair value | ||||||||||||||||||||||
Balance, June 30, 2017 | 3,453,036 | 5.56 | 2.09 | — | — | — | 3,453,036 | 5.56 | 2.09 | |||||||||||||||||||||
Granted | — | — | — | — | — | — | — | — | — | |||||||||||||||||||||
Vested | — | — | — | — | — | — | — | — | — | |||||||||||||||||||||
Exercised | — | — | — | — | — | — | — | — | — | |||||||||||||||||||||
Forfeited | (427,068 | ) | 5.29 | 1.96 | — | — | — | (427,068 | ) | 5.29 | 1.96 | |||||||||||||||||||
Expired | — | — | — | — | — | — | — | — | — | |||||||||||||||||||||
Balance, June 30, 2018 | 3,025,968 | $ | 5.60 | $ | 2.11 | — | 3,025,968 | $ | 5.60 | $ | 2.11 | |||||||||||||||||||
Vested and Expected to Vest
A summary of nonqualified stock options that are vested or expected to vest was as follows:
Number of options | Weighted-average exercise price | Intrinsic value (in millions) | Weighted-average remaining contract term (in years) | |||||||||
Balance, June 30, 2018 | 7,634,664 | $ | 7.52 | $ | 42.6 | 6.3 | ||||||
Intrinsic Values
A summary of the intrinsic values of nonqualified stock options was as follows (in millions):
Service & Rolled options outstanding | Performance and market options outstanding | ||||||||||||||||||
Exercised during the period end | Total outstanding options | Vested (exercisable) options | Nonvested options | Nonvested options | |||||||||||||||
June 30, 2016 | $ | 0.2 | $ | 24.6 | $ | 15.4 | $ | 9.2 | $ | 11.7 | |||||||||
June 30, 2017 | $ | 3.1 | $ | 50.6 | $ | 31.2 | $ | 19.4 | $ | 30.2 | |||||||||
June 30, 2018 | $ | 16.2 | $ | 28.3 | $ | 19.3 | $ | 9.0 | $ | 22.7 | |||||||||
Fair Value Assumptions
The weighted-average assumptions used in the Black-Scholes and Monte Carlo valuations to calculate the fair value of the awards granted during the periods were as follows:
Fiscal Year Ended June 30, | ||||||||
June 30, 2016 | June 30, 2017 | June 30, 2018 | ||||||
Nonqualified stock options: | ||||||||
Expected life (in years)(1) | 6.5 | 6.4 | 6.3 | |||||
Expected volatility | 32.2 | % | 32.3 | % | 32.5 | % | ||
Average risk-free interest rate | 1.8 | % | 2.2 | % | 2.4 | % | ||
Dividend yield | — | % | — | % | — | % | ||
___________________________________
108
PRESIDIO, INC.
NOTES TO CONSOLIDATED FINANCIAL STATEMENTS
(1) | The expected life assumption for the performance and market stock options used in the Monte Carlo simulation varied based on the outcomes of each scenario performed. |
The expected stock price volatility is based on a combination of the historical volatility of the Company since its March 2017 IPO and an average of the historical volatility of public companies in industries similar to the Company prior to its IPO. The risk-free interest rate is based on U.S. Treasury yields in effect at the time of grant over the expected term of the option. The Company has insufficient historical data regarding the expected life of options and therefore uses the simplified method to calculate the expected life.
Share-Based Compensation Expense
The following table summarizes the share-based compensation expense and the related income tax benefit as follows (in millions):
Fiscal Year Ended June 30, | |||||||||||
2016 | 2017 | 2018 | |||||||||
Nonqualified stock options | $ | 2.2 | $ | 10.2 | $ | 5.7 | |||||
Restricted stock units | $ | — | $ | — | $ | 1.3 | |||||
Total | $ | 2.2 | $ | 10.2 | $ | 7.0 | |||||
Reported as: | |||||||||||
Selling expenses | $ | 0.9 | $ | 4.2 | $ | 1.4 | |||||
General and administrative expenses | 1.3 | 6.0 | 5.6 | ||||||||
Total | $ | 2.2 | $ | 10.2 | $ | 7.0 | |||||
Income tax benefit for share-based compensation | $ | 0.9 | $ | 4.0 | $ | 2.3 | |||||
As of June 30, 2018, there was $6.9 million of unrecognized compensation costs related to service based awards from the 2015 LTIP and the 2017 LTIP nonqualified stock option awards which is expected to be recognized as expense over a weighted-average period of 1.9 years.
The occurrence of the initial public offering deemed the performance condition associated with the performance and market stock options to be probable and as a result, the Company recognized $7.3 million in compensation expense associated with these awards during the fiscal year ended June 30, 2017. As of June 30, 2018, there was no unrecognized compensation expense related to the performance and market stock options as all compensation expense was recognized in connection with the initial public offering. As of June 30, 2018, the market condition for vesting has not been realized.
Employee Stock Purchase Plan
The ESPP permits employees to purchase common stock through payroll deductions during quarterly offerings periods, or during such other offering periods as the Compensation Committee may determine. Participants may authorize payroll deductions of a specific percentage of compensation between 1% and 15%, with such deductions being accumulated for quarterly purchase periods beginning on the first business day of each offering period and ending on the last business day of each offering period.
Under the terms of the ESPP, the purchase price per share will equal 95.0% of the fair market value of a share of common stock on the last business day of each offering period, although the Compensation Committee has discretion to change the purchase price with respect to future offering periods. In no event can the purchase price per share be less than the lesser of (a) 85.0% of the fair market value of a share of common stock on the first day of the applicable offering period or (b) 85.0% of the fair market value of a share of common stock on the last day of the applicable offering period.
At June 30, 2018, there were 1,274,564 shares available for issuance under this plan. On June 30, 2018, we held $0.6 million of contributions made by employees that were used to purchase 46,118 shares on July 3, 2018.
109
PRESIDIO, INC.
NOTES TO CONSOLIDATED FINANCIAL STATEMENTS
Other Long-Term Incentive Awards
Under the 2017 LTIP, the committee will be able to grant other types of equity-based awards based upon our common stock, including unrestricted stock, convertible debentures, and dividend equivalent rights. In addition, the committee may also grant other long-term incentive awards that are solely dollar-denominated, either alone or in conjunction with other awards granted under the 2017 LTIP. The maximum value of the property, including cash, that may be paid or distributed to any participant pursuant to a grant of any such long-term incentive award in any one calendar year is $10.0 million.
Note 16. Earnings (Loss) Per Share
The following is a reconciliation of the weighted-average number of shares used to compute basic and diluted net earnings (loss) per share (in millions, except for share and per share data):
Fiscal Year Ended June 30, | |||||||||||
2016 | 2017 | 2018 | |||||||||
Numerator | |||||||||||
Earnings (loss) | $ | (3.4 | ) | $ | 4.4 | $ | 134.2 | ||||
Denominator | |||||||||||
Weighted-average shares - basic | 71,117,962 | 77,517,700 | 91,891,295 | ||||||||
Effect of dilutive securities | |||||||||||
Stock options(1) | — | 4,344,139 | 4,336,283 | ||||||||
Weighted-average shares - diluted | 71,117,962 | 81,861,839 | 96,227,578 | ||||||||
Earnings (loss) per share: | |||||||||||
Basic | $ | (0.05 | ) | $ | 0.06 | $ | 1.46 | ||||
Diluted | $ | (0.05 | ) | $ | 0.05 | $ | 1.39 | ||||
___________________________________
(1) All options are considered anti-dilutive in years with a net loss.
Potentially dilutive securities that have been excluded from the computation of diluted weighted-average shares of common stock outstanding because their inclusion would have been anti-dilutive consists of the following:
Fiscal Year Ended June 30, | ||||||||
2016 | 2017 | 2018 | ||||||
Stock options excluded from EPS because of anti- dilution | 5,301,576 | 2,069,551 | 2,112,224 | |||||
Stock options excluded from EPS because performance or market condition had not been met(1) | 3,534,712 | 317,675 | 766,568 | |||||
Total stock options excluded from EPS | 8,836,288 | 2,387,226 | 2,878,792 | |||||
___________________________________
(1) For the fiscal year ended June 30, 2016, all performance and market stock options were excluded from EPS as the performance condition was not considered probable. For the fiscal years ended June 30, 2018 and 2017, the performance condition for all performance and market stock options had been deemed met due to the completion of the Company's IPO. As a result, the performance and market options are included in the Company's EPS calculation to the extent the market condition was deemed to have been met on June 30, 2018 and 2017 as if it was the end of the contingency period.
110
PRESIDIO, INC.
NOTES TO CONSOLIDATED FINANCIAL STATEMENTS
Note 17. Income Taxes
The following table summarizes the expense (benefit) for income taxes (in millions):
Fiscal Year Ended June 30, | |||||||||||
2016 | 2017 | 2018 | |||||||||
Current: | |||||||||||
Federal | $ | 18.4 | $ | 16.8 | $ | 9.0 | |||||
State | 5.0 | 3.6 | 4.5 | ||||||||
Deferred: | |||||||||||
Federal | (17.4 | ) | (16.0 | ) | (92.1 | ) | |||||
State | (2.2 | ) | (1.8 | ) | (1.1 | ) | |||||
Total income tax expense (benefit) | $ | 3.8 | $ | 2.6 | $ | (79.7 | ) | ||||
The difference between the tax provision at the statutory federal income tax rate and the effective rate on income was as follows:
Fiscal Year Ended June 30, | ||||||||
2016 | 2017 | 2018 | ||||||
Statutory federal income tax rate | 35.0 | % | 35.0 | % | 28.1 | % | ||
Increase (decrease) in rate resulting from: | ||||||||
State taxes, net of federal benefits | 175.0 | 7.1 | 5.0 | |||||
Permanent adjustments | 250.0 | 11.4 | 2.0 | |||||
Stock compensation adjustments | — | (11.4 | ) | (6.7 | ) | |||
Deferred tax impacts of TCJA | — | — | (172.6 | ) | ||||
State tax rate change on deferred items | 340.0 | 1.5 | — | |||||
Provision to return adjustments | 125.0 | (4.7 | ) | (0.7 | ) | |||
Uncertain tax positions | 25.0 | (3.2 | ) | (0.4 | ) | |||
Other | — | 1.4 | (0.9 | ) | ||||
Effective tax rate | 950.0 | % | 37.1 | % | (146.2 | )% | ||
Recent U.S. federal income tax legislation, commonly referred to as The Tax Cuts and Jobs Act (“TCJA”), was enacted on December 22, 2017 which, among other things, reduces the U.S. federal corporate tax rate from 35.0% to 21.0% effective on January 1, 2018. The rate change is administratively effective at the beginning of Presidio’s fiscal year on July 1, resulting in a blended rate of 28.1% for the fiscal year ending June 30, 2018, which is accounted for in the interim and annual periods that include December 22, 2017. As the Company has a June 30 fiscal year-end, the U.S. federal corporate tax rate for our fiscal year ended June 30, 2019 will be 21.0%.
The Company recognized a provisional amount of $94.1 million of income tax benefit for the fiscal year ended June 30, 2018 relating to the revaluation of deferred tax asset and liability balances due to the change in tax rates enacted in the period. The Company is still analyzing certain aspects of the TCJA and refining its calculations, which could potentially affect the measurement of these balances. The changes included in the TCJA are broad and complex and could materially affect the estimates recorded for the quarter and year to date periods, due to, among other things, changes in legislative interpretations or further guidance issued on the application of certain provisions of the TCJA. The Securities Exchange Commission has issued rules that would allow for a measurement period of up to one year after the enactment date of the TCJA to finalize the recording of the related tax impacts.
The Company’s effective tax rate of (146.2)% for the fiscal year ended June 30, 2018 differed from the U.S. federal statutory tax rate primarily due to the $94.1 million income tax benefit impact of revaluation of deferred tax asset and liability balances. The other differences include the favorable excess tax benefit deduction for the fiscal year ended June 30, 2018 related to share-based compensation of $3.7 million, the impact of state taxes and the impact of permanent differences.
111
PRESIDIO, INC.
NOTES TO CONSOLIDATED FINANCIAL STATEMENTS
The Company’s effective income tax rate of 37.1% for the fiscal year ended June 30, 2017 differed from the U.S. federal statutory rate primarily due to state income taxes and non-deductible meals and entertainment expenses which is offset by the favorable stock compensation excess benefit deduction.
The Company’s effective income tax rate of 950.0% for the fiscal year ended June 30, 2016 differed from the U.S. federal statutory rate primarily due to the impact on the nominally small pre-tax income of unfavorable permanent differences and the impact of the revaluation of deferred tax balances related to the state effective tax rate change.
Deferred income taxes reflect the net effects of temporary differences between the carrying amounts of assets and liabilities for financial reporting purposes and the amounts used for income tax purposes. The significant components of the Company’s deferred tax assets (liabilities) were as follows (in millions):
Fiscal Year Ended June 30, | |||||||
2017 | 2018 | ||||||
Non-current | |||||||
Deferred tax assets: | |||||||
Accrued expenses | $ | 16.5 | $ | 5.4 | |||
Bad debt | 1.5 | 0.9 | |||||
Share-based compensation | 7.5 | 5.5 | |||||
Acquisition related | 3.8 | 2.3 | |||||
Net operating losses | — | — | |||||
Total deferred tax assets | 29.3 | 14.1 | |||||
Deferred tax liabilities: | |||||||
Intangibles | (252.3 | ) | (156.9 | ) | |||
Leases | (34.2 | ) | (29.4 | ) | |||
Debt issuance costs | (8.6 | ) | (2.8 | ) | |||
Depreciation | (3.4 | ) | (0.5 | ) | |||
Other | (1.2 | ) | (2.2 | ) | |||
Total deferred tax liabilities | (299.7 | ) | (191.8 | ) | |||
Total deferred tax assets (liabilities) | $ | (270.4 | ) | $ | (177.7 | ) | |
The Company believes that it is more likely than not, based on the weight of available evidence, that the deferred tax assets as shown will be realized when future taxable income is generated through the reversal of existing taxable temporary differences and income that is expected to be generated by businesses that have a history of generating taxable income. As of June 30, 2018 and 2017, no valuation allowances have been recorded against the deferred tax assets.
The Company records a liability for uncertain tax positions if it is not more likely than not that the position will be sustained in an audit, including resolution of related appeals or litigation, if any. For positions that are more likely than not to be sustained, the liability recorded is measured as the largest benefit amount that is more than 50% likely to be realized upon ultimate settlement. As of both June 30, 2018 and June 30, 2017, the Company had unrecognized tax benefits including interest and penalties of $1.1 million, respectively. As of June 30, 2018, the Company believes that it is reasonably possible that the total amounts of unrecognized tax benefits will decrease by $0.2 million all of which will impact the effective tax rate within the next 12 months related to statutes of limitations on certain federal and state income tax returns expiring. The total amount of unrecognized tax benefits that, if recognized, would affect the effective tax rate is $1.1 million. The liability for uncertain tax positions is presented within other liabilities in the consolidated balance sheets.
112
PRESIDIO, INC.
NOTES TO CONSOLIDATED FINANCIAL STATEMENTS
A reconciliation of the beginning and ending amount of gross unrecognized tax benefits excluding interest and penalties is as follows (in millions):
Fiscal Year Ended June 30, | |||||||||||
2016 | 2017 | 2018 | |||||||||
Balance, beginning of the period | $ | 1.5 | $ | 1.3 | $ | 0.9 | |||||
Increases for tax positions taken on acquired entities | — | — | — | ||||||||
Increases for tax positions taken in current period | — | — | — | ||||||||
Increases for tax positions taken in a previous period | 0.3 | — | 0.9 | ||||||||
Expiration of statute of limitations | (0.5 | ) | (0.4 | ) | (0.7 | ) | |||||
Balance, end of period | $ | 1.3 | $ | 0.9 | $ | 1.1 | |||||
Interest and penalties recognized as part of income taxes from continuing operations was a net benefit of less than $0.1 million for the fiscal years ended June 30, 2018 and 2017. The cumulative interest and penalties recorded on the Company’s consolidated balance sheets was less than $0.1 million as of June 30, 2018 and $0.2 million as of June 30, 2017.
The Company files a consolidated federal income tax return and various consolidated state income tax returns. The Company’s federal and material state income tax years remain open to examination for the fiscal year ended June 30, 2014. The Company is currently under examination by the Internal Revenue Service for fiscal year ended June 30, 2015. We currently do not believe that the outcome of the examination will have a material impact on our financial statements.
Note 18. Major Customers and Suppliers
The Company’s revenue is derived from arrangements with enterprise, commercial, service provider, state, and U.S. government customers. No customer accounted for more than 10% of the Company’s revenue during the years ended June 30, 2018, 2017 and 2016. All accounts receivable are made on an unsecured basis and no customer balance comprised more than 10% of accounts receivable as of June 30, 2018 or 2017.
The Company’s solutions include products and services purchased directly and indirectly from manufacturers. Our purchases from a single manufacturer comprised approximately 64% our purchases from all manufacturers for the fiscal year ended June 30, 2018, 67% for the fiscal year ended June 30, 2017, and 67% for the fiscal year ended June 30, 2016. No other manufacturers accounted for more than 10% of the Company’s purchases during these periods.
Note 19. Related Party Transactions
Apollo Global Management, LLC (together with its subsidiaries, “Apollo”) is a leading alternative investment management firm which owns and operates businesses across a variety of industries. The Company recorded revenue to parties affiliated with Apollo or its directors of $1.8 million for the fiscal year ended June 30, 2018, $7.3 million for the fiscal year ended June 30, 2017 and $2.0 million for the fiscal year ended June 30, 2016. As of June 30, 2018 and June 30, 2017, the outstanding receivables associated with parties affiliated with Apollo or its directors were $1.7 million and $1.7 million, respectively.
On January 19, 2017, in connection with the January 2017 Amendment, the Company paid certain fees totaling approximately $0.1 million to Apollo Global Securities, LLC, an affiliate of Apollo, for certain engagement and co-manager services provided in connection with such refinancing. Additionally, in connection with its role as an underwriter in the Company's IPO, the Company paid $0.2 million in fees to Apollo Global Securities, LLC.
Prior to March 15, 2017, an alternative investment vehicle formed by the limited partners of the Apollo Funds owned substantially all of the economic interests in the Senior Subordinated Notes pursuant to certain derivative arrangements entered into with Deutsche Bank AG, who was the holder of 100% of the Senior Subordinated Notes. As of March 15, 2017, the Company repurchased and canceled all of the aggregate principal amount of outstanding Subordinated Notes and, as a result, satisfied and discharged its obligations under the indenture. See Note 11 for additional information.
113
PRESIDIO, INC.
NOTES TO CONSOLIDATED FINANCIAL STATEMENTS
At issuance of the credit facility associated with the acquisition of Netech in February 2016, members of the Company’s management held $5.5 million of the $150.0 million term loan borrowing. This debt was fully repaid with the credit facility terminated at June 30, 2016. In issuing the credit facility, the Company incurred $0.5 million in deferred financing fees associated with an affiliate of Apollo.
At issuance, Presidio, Inc. held the $25.0 million term loan borrowing issued by Presidio Holdings under the Incremental Assumption Agreement and Amendment No. 2 to the Company’s February 2015 Credit Agreement. As of June 30, 2016, Presidio, Inc. had sold its holdings of the debt to an unaffiliated third party for a loss of $0.1 million as a result of the sale.
The Company leases an office that is owned by members of the Company’s management. The office location was carried over from a prior acquisition and the Company has continued to renew the lease. Rent expense for the office was $0.3 million for the fiscal year ended June 30, 2018, $0.3 million for the fiscal year ended June 30, 2017 and $0.3 million for the fiscal year ended June 30, 2016.
Note 20. Retirement Plan
The Company sponsors a defined contribution 401(k) plan covering substantially all employees of the Company who are age 21 or older and are not classified as excluded employees (which classification includes union employees, leased employees and certain nonresident aliens). Participants can elect to contribute a specific percentage or dollar amount and have that amount deposited into the plan as an elective deferral. All employee deferrals and Company contributions are subject to IRS limitations.
The Company provides a fixed matching contribution equal to 25% of the employee’s elective deferrals on up to 6% of compensation. In addition to the fixed matching contribution, the Company may make an additional discretionary contribution equal to a uniform percentage or dollar amount of the employee’s elective deferral. The annual discretionary matching contribution is based on Company performance and may be an additional 25% on up to 6% of compensation. Employment on the last day of the year is required to receive the annual discretionary match and it is typically funded approximately ten months following the end of the calendar year to which it relates.
Employer contributions in the plan generally vest equally over a five-year period based on plan years in which an employee works at least 1,000 hours.
Total employer contribution expense was $3.0 million for the fiscal year ended June 30, 2018, $2.1 million for the fiscal year ended June 30, 2017 and $6.1 million for the fiscal year ended June 30, 2016.
Note 21. Segment Information
Since October 22, 2015, the Company has operated as one reportable segment based on our assessment of how our chief operating decision maker allocates resources and assesses performance across the Company.
Geographic Areas
Revenue earned by the Company from customers outside of the United States is not material for any of the periods presented. Additionally, the Company does not have long-lived assets outside of the United States.
114
PRESIDIO, INC.
NOTES TO CONSOLIDATED FINANCIAL STATEMENTS
Revenue by Solution Area
The following table presents total revenue by solution area (in millions):
Fiscal Year Ended June 30, | |||||||||||
2016 | 2017 | 2018 | |||||||||
Revenue by solution area: | |||||||||||
Cloud | $ | 391.7 | $ | 501.1 | $ | 450.3 | |||||
Security | 249.4 | 324.1 | 376.9 | ||||||||
Digital infrastructure | 2,073.8 | 1,992.4 | 2,030.8 | ||||||||
Total revenue | $ | 2,714.9 | $ | 2,817.6 | $ | 2,858.0 | |||||
The type of solution sold by the Company to its customers is based upon internal classifications.
Note 22. Supplemental Consolidating Information
The following financial statements set forth condensed consolidating financial information for the Company. The condensed consolidating financial information is presented as Presidio Holdings Inc. and subsidiaries, as borrowers or guarantors of the February 2015 Credit Agreement and Note Indenture, and Presidio, Inc., as the registrant, as well as the consolidating intercompany eliminations between the entities.
The following condensed consolidating financing information was prepared on the same basis as the consolidated financial statements (in millions):
115
PRESIDIO, INC.
NOTES TO CONSOLIDATED FINANCIAL STATEMENTS
Condensed Consolidating Balance Sheet | |||||||||||||||
As of June 30, 2017 | |||||||||||||||
Presidio, Inc. | Presidio Holdings Inc. & Subsidiaries | Intercompany Adjustments | Consolidated | ||||||||||||
Assets | |||||||||||||||
Current Assets | |||||||||||||||
Cash and cash equivalents | $ | 0.7 | $ | 26.8 | $ | — | $ | 27.5 | |||||||
Accounts receivable, net | — | 576.3 | — | 576.3 | |||||||||||
Unbilled accounts receivable, net | — | 159.8 | — | 159.8 | |||||||||||
Financing receivables, current portion | — | 84.2 | — | 84.2 | |||||||||||
Inventory | — | 27.7 | — | 27.7 | |||||||||||
Prepaid expenses and other current assets | 1.3 | 69.1 | (7.0 | ) | 63.4 | ||||||||||
Total current assets | 2.0 | 943.9 | (7.0 | ) | 938.9 | ||||||||||
Property and equipment, net | — | 32.1 | — | 32.1 | |||||||||||
Deferred tax asset | 2.7 | — | (2.7 | ) | — | ||||||||||
Financing receivables, less current portion | — | 113.6 | — | 113.6 | |||||||||||
Goodwill | — | 781.5 | — | 781.5 | |||||||||||
Identifiable intangible assets, net | — | 751.9 | — | 751.9 | |||||||||||
Other assets | 605.2 | 32.7 | (605.2 | ) | 32.7 | ||||||||||
Total assets | $ | 609.9 | $ | 2,655.7 | $ | (614.9 | ) | $ | 2,650.7 | ||||||
Liabilities and Stockholders’ Equity | |||||||||||||||
Current Liabilities | |||||||||||||||
Accounts payable – trade | — | 350.5 | — | 350.5 | |||||||||||
Accounts payable – floor plan | — | 264.9 | — | 264.9 | |||||||||||
Accrued expenses and other current liabilities | 7.0 | 216.3 | (7.0 | ) | 216.3 | ||||||||||
Discounted financing receivables, current portion | — | 79.9 | — | 79.9 | |||||||||||
Total current liabilities | 7.0 | 911.6 | (7.0 | ) | 911.6 | ||||||||||
Long-term debt, net of debt issuance costs | — | 730.7 | — | 730.7 | |||||||||||
Discounted financing receivables, less current portion | — | 104.7 | — | 104.7 | |||||||||||
Deferred income tax liabilities | — | 273.1 | (2.7 | ) | 270.4 | ||||||||||
Other liabilities | — | 30.4 | — | 30.4 | |||||||||||
Total liabilities | 7.0 | 2,050.5 | (9.7 | ) | 2,047.8 | ||||||||||
Total stockholders’ equity | 602.9 | 605.2 | (605.2 | ) | 602.9 | ||||||||||
Total liabilities and stockholders’ equity | $ | 609.9 | $ | 2,655.7 | $ | (614.9 | ) | $ | 2,650.7 | ||||||
116
PRESIDIO, INC.
NOTES TO CONSOLIDATED FINANCIAL STATEMENTS
Condensed Consolidating Balance Sheet | |||||||||||||||
As of June 30, 2018 | |||||||||||||||
Presidio, Inc. | Presidio Holdings Inc. & Subsidiaries | Intercompany Adjustments | Consolidated | ||||||||||||
Assets | |||||||||||||||
Current Assets | |||||||||||||||
Cash and cash equivalents | $ | 0.1 | $ | 36.9 | $ | — | $ | 37.0 | |||||||
Accounts receivable, net | — | 613.3 | — | 613.3 | |||||||||||
Unbilled accounts receivable, net | — | 156.7 | — | 156.7 | |||||||||||
Financing receivables, current portion | — | 88.3 | — | 88.3 | |||||||||||
Inventory | — | 27.7 | — | 27.7 | |||||||||||
Prepaid expenses and other current assets | 2.9 | 79.6 | (1.8 | ) | 80.7 | ||||||||||
Total current assets | 3.0 | 1,002.5 | (1.8 | ) | 1,003.7 | ||||||||||
Property and equipment, net | — | 35.9 | — | 35.9 | |||||||||||
Deferred tax asset | 1.5 | — | (1.5 | ) | — | ||||||||||
Financing receivables, less current portion | — | 116.8 | — | 116.8 | |||||||||||
Goodwill | — | 803.7 | — | 803.7 | |||||||||||
Identifiable intangible assets, net | — | 700.3 | — | 700.3 | |||||||||||
Other assets | 751.6 | 33.9 | (751.6 | ) | 33.9 | ||||||||||
Total assets | $ | 756.1 | $ | 2,693.1 | $ | (754.9 | ) | $ | 2,694.3 | ||||||
Liabilities and Stockholders’ Equity | |||||||||||||||
Current Liabilities | |||||||||||||||
Accounts payable – trade | — | 457.7 | — | 457.7 | |||||||||||
Accounts payable – floor plan | — | 210.6 | — | 210.6 | |||||||||||
Accrued expenses and other current liabilities | — | 195.0 | (1.8 | ) | 193.2 | ||||||||||
Discounted financing receivables, current portion | — | 85.2 | — | 85.2 | |||||||||||
Total current liabilities | — | 948.5 | (1.8 | ) | 946.7 | ||||||||||
Long-term debt, net of debt issuance costs | — | 671.2 | — | 671.2 | |||||||||||
Discounted financing receivables, less current portion | — | 108.6 | — | 108.6 | |||||||||||
Deferred income tax liabilities | — | 179.2 | (1.5 | ) | 177.7 | ||||||||||
Other liabilities | — | 34.0 | — | 34.0 | |||||||||||
Total liabilities | — | 1,941.5 | (3.3 | ) | 1,938.2 | ||||||||||
Total stockholders’ equity | 756.1 | 751.6 | (751.6 | ) | 756.1 | ||||||||||
Total liabilities and stockholders’ equity | $ | 756.1 | $ | 2,693.1 | $ | (754.9 | ) | $ | 2,694.3 | ||||||
117
PRESIDIO, INC.
NOTES TO CONSOLIDATED FINANCIAL STATEMENTS
Condensed Consolidating Statement of Operations | |||||||||||||||
Fiscal Year Ended June 30, 2017 | |||||||||||||||
Presidio, Inc. | Presidio Holdings Inc. & Subsidiaries | Intercompany Adjustments | Consolidated | ||||||||||||
Total revenue | $ | — | $ | 2,817.6 | $ | — | $ | 2,817.6 | |||||||
Total cost of revenue | — | 2,231.7 | — | 2,231.7 | |||||||||||
Gross margin | — | 585.9 | — | 585.9 | |||||||||||
Operating expenses | |||||||||||||||
Selling, general and administrative, and transaction costs | 0.5 | 395.5 | — | 396.0 | |||||||||||
Depreciation and amortization | — | 81.8 | — | 81.8 | |||||||||||
Total operating expenses | 0.5 | 477.3 | — | 477.8 | |||||||||||
Operating income (loss) | (0.5 | ) | 108.6 | — | 108.1 | ||||||||||
Interest and other (income) expense | |||||||||||||||
Interest expense | — | 72.5 | — | 72.5 | |||||||||||
Loss on extinguishment of debt | — | 28.5 | — | 28.5 | |||||||||||
Other (income) expense, net | (4.7 | ) | 0.1 | 4.7 | 0.1 | ||||||||||
Total interest and other (income) expense | (4.7 | ) | 101.1 | 4.7 | 101.1 | ||||||||||
Income before income taxes | 4.2 | 7.5 | (4.7 | ) | 7.0 | ||||||||||
Income tax expense (benefit) | (0.2 | ) | 2.8 | — | 2.6 | ||||||||||
Net income | $ | 4.4 | $ | 4.7 | $ | (4.7 | ) | $ | 4.4 | ||||||
Condensed Consolidating Statement of Operations | |||||||||||||||
Fiscal Year Ended June 30, 2018 | |||||||||||||||
Presidio, Inc. | Presidio Holdings Inc. & Subsidiaries | Intercompany Adjustments | Consolidated | ||||||||||||
Total revenue | $ | — | $ | 2,858.0 | $ | — | $ | 2,858.0 | |||||||
Total cost of revenue | — | 2,273.0 | — | 2,273.0 | |||||||||||
Gross margin | — | 585.0 | — | 585.0 | |||||||||||
Operating expenses | |||||||||||||||
Selling, general and administrative, and transaction costs | 1.7 | 384.6 | — | 386.3 | |||||||||||
Depreciation and amortization | — | 83.7 | — | 83.7 | |||||||||||
Total operating expenses | 1.7 | 468.3 | — | 470.0 | |||||||||||
Operating income (loss) | (1.7 | ) | 116.7 | — | 115.0 | ||||||||||
Interest and other (income) expense | |||||||||||||||
Interest expense | — | 46.0 | — | 46.0 | |||||||||||
Loss on extinguishment of debt | — | 14.8 | — | 14.8 | |||||||||||
Other (income) expense, net | (136.2 | ) | (0.3 | ) | 136.2 | (0.3 | ) | ||||||||
Total interest and other (income) expense | (136.2 | ) | 60.5 | 136.2 | 60.5 | ||||||||||
Income before income taxes | 134.5 | 56.2 | (136.2 | ) | 54.5 | ||||||||||
Income tax expense (benefit) | 0.3 | (80.0 | ) | — | (79.7 | ) | |||||||||
Net income | $ | 134.2 | $ | 136.2 | $ | (136.2 | ) | $ | 134.2 | ||||||
118
PRESIDIO, INC.
NOTES TO CONSOLIDATED FINANCIAL STATEMENTS
Condensed Consolidating Statement of Cash Flows | |||||||||||||||
Fiscal Year Ended June 30, 2017 | |||||||||||||||
Presidio, Inc. | Presidio Holdings Inc. & Subsidiaries | Intercompany Eliminations | Consolidated | ||||||||||||
Net cash provided by (used in) operating activities | $ | (0.1 | ) | $ | 51.1 | $ | — | $ | 51.0 | ||||||
Cash flows from investing activities: | . | ||||||||||||||
Proceeds from collection of escrow related to acquisition of business | — | 0.6 | — | 0.6 | |||||||||||
Capital contribution to subsidiary | (162.7 | ) | — | 162.7 | — | ||||||||||
Investment in debt of subsidiary | (123.3 | ) | — | 123.3 | — | ||||||||||
Return of intercompany loan | 12.1 | — | (12.1 | ) | — | ||||||||||
Additions of equipment under sales-type and direct financing leases | — | (100.1 | ) | — | (100.1 | ) | |||||||||
Proceeds from collection of financing receivables | — | 9.8 | — | 9.8 | |||||||||||
Additions to equipment under operating leases | — | (2.0 | ) | — | (2.0 | ) | |||||||||
Proceeds from disposition of equipment under operating leases | — | 1.5 | — | 1.5 | |||||||||||
Purchases of property and equipment | — | (11.4 | ) | — | (11.4 | ) | |||||||||
Net cash used in investing activities | (273.9 | ) | (101.6 | ) | 273.9 | (101.6 | ) | ||||||||
Cash flows from financing activities: | |||||||||||||||
Proceeds from initial public offering, net of underwriter discounts and commissions | 247.5 | — | — | 247.5 | |||||||||||
Payment of initial public offering costs | — | (7.2 | ) | — | (7.2 | ) | |||||||||
Proceeds from issuance of comment stock under share-based compensation plans | 1.1 | — | — | 1.1 | |||||||||||
Capital contribution from parent | — | 162.7 | (162.7 | ) | — | ||||||||||
Proceeds from the discounting of financing receivables | — | 108.6 | — | 108.6 | |||||||||||
Retirements of discounted financing receivables | — | (5.0 | ) | — | (5.0 | ) | |||||||||
Net repayments on the receivables securitization facility | — | (5.0 | ) | — | (5.0 | ) | |||||||||
Repayments of senior and subordinated notes | — | (107.5 | ) | (123.3 | ) | (230.8 | ) | ||||||||
Repayment of intercompany loan | — | (12.1 | ) | 12.1 | — | ||||||||||
Repayments of term loans | — | (105.7 | ) | — | (105.7 | ) | |||||||||
Net repayments on the floor plan facility | — | 41.6 | — | 41.6 | |||||||||||
Net cash provided by financing activities | 248.6 | 70.4 | (273.9 | ) | 45.1 | ||||||||||
Net increase (decrease) in cash and cash equivalents | (25.4 | ) | 19.9 | — | (5.5 | ) | |||||||||
Cash and cash equivalents: | |||||||||||||||
Beginning of the period | 26.1 | 6.9 | — | 33.0 | |||||||||||
End of the period | $ | 0.7 | $ | 26.8 | $ | — | $ | 27.5 | |||||||
119
PRESIDIO, INC.
NOTES TO CONSOLIDATED FINANCIAL STATEMENTS
Condensed Consolidating Statement of Cash Flows | |||||||||||||||
Fiscal Year Ended June 30, 2018 | |||||||||||||||
Presidio, Inc. | Presidio Holdings Inc. & Subsidiaries | Intercompany Eliminations | Consolidated | ||||||||||||
Net cash provided by (used in) operating activities | $ | (5.3 | ) | $ | 197.3 | $ | — | $ | 192.0 | ||||||
Cash flows from investing activities: | |||||||||||||||
Acquisition of businesses, net of cash and cash equivalents acquired | — | (42.8 | ) | — | (42.8 | ) | |||||||||
Proceeds from collection of escrow related to acquisition of business | — | 0.2 | — | 0.2 | |||||||||||
Additions of equipment under sales-type and direct financing leases | — | (108.3 | ) | — | (108.3 | ) | |||||||||
Proceeds from collection of financing receivables | — | 4.1 | — | 4.1 | |||||||||||
Additions to equipment under operating leases | — | (1.6 | ) | — | (1.6 | ) | |||||||||
Proceeds from disposition of equipment under operating leases | — | 0.7 | — | 0.7 | |||||||||||
Purchases of property and equipment | — | (14.4 | ) | — | (14.4 | ) | |||||||||
Net cash used in investing activities | — | (162.1 | ) | — | (162.1 | ) | |||||||||
Cash flows from financing activities: | |||||||||||||||
Proceeds from issuance of comment stock under share-based compensation plans | 4.7 | 3.3 | — | 8.0 | |||||||||||
Proceeds from the discounting of financing receivables | — | 114.6 | — | 114.6 | |||||||||||
Retirements of discounted financing receivables | — | (10.0 | ) | — | (10.0 | ) | |||||||||
Deferred financing cost on receivables securitization facility | — | (1.2 | ) | — | (1.2 | ) | |||||||||
Repayments of senior and subordinated notes | — | (135.7 | ) | — | (135.7 | ) | |||||||||
Borrowings on term loans, net of original issue discount | — | 138.2 | — | 138.2 | |||||||||||
Repayments of term loans | — | (80.0 | ) | — | (80.0 | ) | |||||||||
Net repayments on the floor plan facility | — | (54.3 | ) | — | (54.3 | ) | |||||||||
Net cash provided by (used in) financing activities | 4.7 | (25.1 | ) | — | (20.4 | ) | |||||||||
Net increase (decrease) in cash and cash equivalents | (0.6 | ) | 10.1 | — | 9.5 | ||||||||||
Cash and cash equivalents: | |||||||||||||||
Beginning of the period | 0.7 | 26.8 | — | 27.5 | |||||||||||
End of the period | $ | 0.1 | $ | 36.9 | $ | — | $ | 37.0 | |||||||
120
PRESIDIO, INC.
NOTES TO CONSOLIDATED FINANCIAL STATEMENTS
23. Quarterly Financial Data (Unaudited)
Three Months Ended | |||||||||||||||
September 30, 2016 | December 31, 2016 | March 31, 2017 | June 30, 2017 | ||||||||||||
(in millions, except per-share amounts) | |||||||||||||||
Total revenue | $ | 737.7 | $ | 721.8 | $ | 628.8 | $ | 729.3 | |||||||
Gross margin | 148.6 | 142.9 | 142.1 | 152.3 | |||||||||||
Operating income | 30.3 | 27.5 | 14.4 | 35.9 | |||||||||||
Net income (loss) | 5.6 | 3.4 | (15.0 | ) | 10.4 | ||||||||||
Net income (loss), per common share, basic | $ | 0.08 | $ | 0.05 | $ | (0.20 | ) | $ | 0.11 | ||||||
Net income (loss), per common share, diluted | $ | 0.08 | $ | 0.05 | $ | (0.20 | ) | $ | 0.11 | ||||||
Three Months Ended | |||||||||||||||
September 30, 2017 | December 31, 2017 | March 31, 2018 | June 30, 2018 | ||||||||||||
(in millions, except per-share amounts) | |||||||||||||||
Total revenue | $ | 765.0 | $ | 661.6 | $ | 665.1 | $ | 766.3 | |||||||
Gross margin | 156.4 | 137.4 | 139.4 | 151.8 | |||||||||||
Operating income | 44.1 | 23.3 | 18.3 | 29.3 | |||||||||||
Net income | 19.8 | 99.2 | 0.6 | 14.6 | |||||||||||
Net income, per common share, basic | $ | 0.22 | $ | 1.08 | $ | 0.01 | $ | 0.16 | |||||||
Net income, per common share, diluted | $ | 0.21 | $ | 1.03 | $ | 0.01 | $ | 0.15 | |||||||
The sum of the earnings (loss) per share amounts may not equal the annual amounts due to changes in the number of weighted average common shares outstanding during the year.
On February 24, 2017, the Board of Directors of the Company declared a 2-for-1 stock split of the Company’s common stock in the form of a stock dividend payable on each share of common stock issued and outstanding as of February 24, 2017. The number of shares subject to and the exercise price of the Company’s outstanding options were adjusted to equitably reflect the split. All per-share data included in these financial statements give effect to the stock split and have been adjusted retroactively for all periods presented.
24. Subsequent Events
On September 5, 2018, the Company, entered into a stock repurchase agreement (the “Stock Repurchase Agreement”) with AP VIII Aegis Holdings, L.P. (“Aegis LP”), an affiliate of investment funds affiliated with Apollo Global Management, LLC. Pursuant to the Stock Repurchase Agreement, the Company agreed to repurchase 10,750,000 shares of our common stock from Aegis LP for aggregate consideration of approximately $160 million, representing a purchase price of $14.75 per share of common stock (the “Repurchase”). To fund the Repurchase, the Company intends to use proceeds of $160 million of additional term loans under an incremental term loan B facility to be established pursuant to the February 2015 Credit Agreement, subject to customary closing conditions. The Stock Repurchase Agreement, the Repurchase and the related transactions were approved by the Company’s board of directors and a committee of independent directors.
The Repurchase is expected to close in mid-September 2018. Following consummation of the Repurchase, Aegis LP will continue to own 47,050,000 shares of our common stock, or approximately 57% of our shares of common stock outstanding.
121
PRESIDIO, INC.
SCHEDULE I - CONDENSED FINANCIAL INFORMATION OF REGISTRANT
UNCONSOLIDATED CONDENSED BALANCE SHEETS
(in millions, except for share and per share data)
As of June 30, 2017 | As of June 30, 2018 | ||||||
Assets | |||||||
Current Assets | |||||||
Cash and cash equivalents | $ | 0.7 | $ | 0.1 | |||
Prepaid expenses and other current assets | 1.3 | 2.9 | |||||
Total current assets | 2.0 | 3.0 | |||||
Deferred income tax assets | 2.7 | 1.5 | |||||
Investment in subsidiaries | 605.2 | 751.6 | |||||
Total assets | $ | 609.9 | $ | 756.1 | |||
Liabilities and Stockholders' Equity | |||||||
Current Liabilities | |||||||
Accrued expenses and other current liabilities | $ | 7.0 | $ | — | |||
Total current liabilities | 7.0 | — | |||||
Total liabilities | 7.0 | — | |||||
Stockholders' Equity | |||||||
Preferred stock: | |||||||
$0.01 par value; 100 shares authorized, zero shares issued and outstanding at June 30, 2018 and June 30, 2017 | — | — | |||||
Common stock: | |||||||
$0.01 par value; 250,000,000 shares authorized and 92,853,983 shares issued and outstanding at June 30, 2018, 250,000,000 shares authorized and 90,969,919 shares issued and outstanding at June 30, 2017 | 0.9 | 0.9 | |||||
Additional paid-in capital | 625.3 | 644.3 | |||||
Accumulated earnings (deficit) | (23.3 | ) | 110.9 | ||||
Total stockholders' equity | 602.9 | 756.1 | |||||
Total liabilities and stockholders' equity | $ | 609.9 | $ | 756.1 | |||
The accompanying notes to Schedule I are an integral part of these financial statements.
122
PRESIDIO, INC.
SCHEDULE I - CONDENSED FINANCIAL INFORMATION OF REGISTRANT
UNCONSOLIDATED CONDENSED STATEMENTS OF OPERATIONS
(in millions)
Fiscal Year Ended June 30, | |||||||||||
2016 | 2017 | 2018 | |||||||||
Operating expenses | |||||||||||
Selling, general and administrative, and transaction costs | $ | 0.3 | $ | 0.5 | $ | 1.7 | |||||
Total operating expenses | 0.3 | 0.5 | 1.7 | ||||||||
Operating income (loss) | (0.3 | ) | (0.5 | ) | (1.7 | ) | |||||
Interest and other (income) expense | |||||||||||
Unrealized loss (income) on equity investment in subsidiaries | 3.2 | (4.7 | ) | (136.2 | ) | ||||||
Other (income) expense, net | (0.3 | ) | — | — | |||||||
Total interest and other (income) expense | 2.9 | (4.7 | ) | (136.2 | ) | ||||||
Income (loss) before income taxes | (3.2 | ) | 4.2 | 134.5 | |||||||
Income tax (benefit) expense | 0.2 | (0.2 | ) | 0.3 | |||||||
Net income (loss) | $ | (3.4 | ) | $ | 4.4 | $ | 134.2 | ||||
The accompanying notes to Schedule I are an integral part of these financial statements.
123
PRESIDIO, INC.
SCHEDULE I - CONDENSED FINANCIAL INFORMATION OF REGISTRANT
UNCONSOLIDATED CONDENSED STATEMENTS OF CASH FLOWS
(in millions)
Fiscal Year Ended June 30, | |||||||||||
2016 | 2017 | 2018 | |||||||||
Net cash provided by operating activities | $ | 0.3 | $ | (0.1 | ) | $ | (5.3 | ) | |||
Cash flows from investing activities: | |||||||||||
Capital contribution to subsidiary | — | (162.7 | ) | — | |||||||
Investment in debt of subsidiary | (25.0 | ) | (123.3 | ) | — | ||||||
Return of intercompany loan | — | 12.1 | — | ||||||||
Proceeds from sale of debt investment | 24.9 | — | — | ||||||||
Net cash used in investing activities | (0.1 | ) | (273.9 | ) | — | ||||||
Cash flows from financing activities: | |||||||||||
Proceeds from issuance of common stock | — | 248.6 | 4.7 | ||||||||
Repurchases of common stock | (0.1 | ) | — | — | |||||||
Net cash (used in) provided by investing activities | (0.1 | ) | 248.6 | 4.7 | |||||||
Net increase (decrease) in cash and cash equivalents | 0.1 | (25.4 | ) | (0.6 | ) | ||||||
Cash and cash equivalents, beginning of the period | 26.0 | 26.1 | 0.7 | ||||||||
Cash and cash equivalents, end of the period | $ | 26.1 | $ | 0.7 | $ | 0.1 | |||||
The accompanying notes to Schedule I are an integral part of these financial statements.
124
PRESIDIO, INC.
SCHEDULE I - CONDENSED FINANCIAL INFORMATION OF REGISTRANT
NOTES TO THE UNCONSOLIDATED CONDENSED FINANCIAL STATEMENTS
Note 1. Nature of Business and Significant Accounting Policies
Description of the Company
Presidio, Inc., formerly named Aegis Holdings, Inc. (“Aegis”), is a Delaware corporation that was incorporated on November 20, 2014 by certain investment funds affiliated with or managed by Apollo Global Management, LLC, including Apollo Investment Fund VIII, L.P., along with their parallel investment funds (the “Apollo Funds”) to complete the acquisition of Presidio Holdings Inc. (“Presidio Holdings”). Presidio, Inc. is a holding company with direct ownership of a single wholly-owned subsidiary, Presidio Holdings. Presidio Holdings, through its operating subsidiaries, conducts operations and generates income and cash flows, while Presidio, Inc. conducts no separate operations on a standalone basis.
Basis of Presentation
Pursuant to the terms of the credit agreements discussed in Note 11 of the consolidated financial statements, Presidio Holdings and its subsidiaries have restrictions on their ability to, among other things, incur additional indebtedness, make distributions to Presidio, Inc., or make certain intercompany loans and advances. As a result of these restrictions, these parent company financial statements have been prepared in accordance with Rule 12-04 of Regulation S-X, since the restricted net assets of Presidio, Inc.’s subsidiaries (as defined in Rule 4-08(e)(3) of Regulation S-X) exceeds 25% of the Company’s consolidated net assets as of June 30, 2018. All financial information presented in the financial statements and notes herein is presented in millions except for share and per share information and percentages.
Principles of Consolidation
On a standalone basis, Presidio, Inc. records its investment in Presidio Holdings under the equity method of accounting. Under the equity method, the investment in subsidiaries is stated at cost plus any contributions and its equity share in undistributed net income (loss) of the subsidiaries minus any dividends received. Presidio, Inc.’s share of net income (loss) of its unconsolidated subsidiaries is included in net income (loss) on equity investment in subsidiaries in the statements of operations. Intercompany balances and transactions have not been eliminated. The accompanying financial information should be read in conjunction with the consolidated financial statements and related notes included in this filing.
Public Offerings
On March 15, 2017, the Company completed an initial public offering (“IPO”) in which the Company issued and sold 18,766,465 shares of common stock, inclusive of 2,099,799 shares issued and sold on March 21, 2017, pursuant to the underwriters’ option to purchase additional shares, at the public offering price of $14.00 per share. The Company received net proceeds of $247.5 million, after deducting underwriting discounts and commissions from the sale of its shares in the IPO. In addition, the Company incurred $7.2 million of offering expenses in connection with the IPO.
Also in March 2017, the Company used proceeds from the IPO, together with cash on hand, to repurchase from the holder thereof all of the approximately $112.2 million in aggregate principal amount of outstanding Senior Subordinated Notes at a repurchase price equal to 110.25% of the principal amount of the Senior Subordinated Notes being repurchased, plus accrued and unpaid interest to, but excluding, the date of repurchase. Immediately thereafter, the Company contributed to the capital of Presidio Holdings all of the Senior Subordinated Notes, and Presidio Holdings delivered or caused to be delivered to the applicable trustee all of the Senior Subordinated Notes for cancellation.
On November 21, 2017, the Company completed a secondary public offering of 8,000,000 shares of the Company’s common stock by certain funds affiliated with Apollo Global Management, LLC (the “Selling Stockholder”) at a price to the public of $14.25 per share. In addition, the underwriters to such secondary public offering purchased an additional 1,200,000 shares of common stock from the Selling Stockholder. The Company did not sell any shares and did not receive any proceeds from the offering. In conjunction with this secondary offering, the Company incurred $1.0 million of expenses, which is presented within transaction costs on the consolidated statement of operations for the fiscal year ended June 30, 2018.
125
PRESIDIO, INC.
SCHEDULE I - CONDENSED FINANCIAL INFORMATION OF REGISTRANT
NOTES TO THE UNCONSOLIDATED CONDENSED FINANCIAL STATEMENTS
Significant Accounting Policies
The accounting policies used in the preparation of the parent financial statements are generally consistent with those used in the preparation of the consolidated financial statements of the Company.
In conjunction with the acquisition of Presidio Holdings, Presidio, Inc. has applied the acquisition method of accounting in accordance with FASB ASC Topic 805, Business Combinations, and has also elected the application of push-down accounting. As a result, the fair value adjustments and goodwill recognized from the transactions are recorded in the financial statements of its subsidiaries and presented as part of Presidio, Inc.’s investment in subsidiaries on the balance sheet.
As discussed in Note 17 of the annual consolidated financial statements, Presidio, Inc. and its subsidiaries file a consolidated federal income tax return and various consolidated state income tax returns. Taxes are allocated to the members of the consolidated return, based on an estimate of the amounts that would be reported if the members were separately filing their tax returns. As a result, for the fiscal years ended June 30, 2018, 2017 and 2016, Presidio, Inc.’s income tax benefit and deferred tax assets excludes any taxes associated with Presidio, Inc.’s investment in its subsidiaries.
During the year ended June 30, 2018, we did not declare or pay any distributions to stockholders. We intend to declare quarterly dividends to holders of common stock. However, any future declaration and payment of future dividends to holders of common stock will be at the discretion of the Board of Directors and will depend on many factors, including our financial condition, earnings, capital requirements, level of indebtedness, statutory and contractual restrictions applying to the payment of dividends, and other considerations that the Board of Directors deems relevant. Presidio, Inc., as a holding company, has no direct operations and our ability to pay dividends is limited to our available cash on hand and any funds received from subsidiaries. The terms of the indebtedness may restrict Presidio, Inc.’s ability to pay dividends, or may restrict the subsidiaries from paying dividends to Presidio, Inc. Under Delaware law, dividends may be payable only out of surplus, which is net assets minus liabilities and capital, or, if there is no surplus, out of net profits for the fiscal year in which the dividend is declared and/or the preceding fiscal year.
126
PRESIDIO, INC.
SCHEDULE II - VALUATION AND QUALIFYING ACCOUNTS
(in millions)
Balance at beginning of period | Charged to costs and expenses | Charged to other accounts | Deductions and other adjustments | Balance at end of period | |||||||||||||||
Fiscal Year Ended June 30, 2016 | |||||||||||||||||||
Provision for sales returns and credit losses | $ | 3.8 | $ | 1.9 | $ | — | $ | (1.9 | ) | $ | 3.8 | ||||||||
Provision for inventory obsolescence | — | 0.1 | — | — | 0.1 | ||||||||||||||
Provision for residual value and credit losses on financing receivables | 2.0 | — | — | (0.3 | ) | 1.7 | |||||||||||||
Fiscal Year Ended June 30, 2017 | |||||||||||||||||||
Provision for sales returns and credit losses | $ | 3.8 | $ | 2.4 | $ | — | $ | (1.7 | ) | $ | 4.5 | ||||||||
Provision for inventory obsolescence | 0.1 | 0.5 | — | — | 0.6 | ||||||||||||||
Provision for residual value and credit losses on financing receivables | 1.7 | — | — | (0.5 | ) | 1.2 | |||||||||||||
Fiscal Year Ended June 30, 2018 | |||||||||||||||||||
Provision for sales returns and credit losses | $ | 4.5 | $ | 1.0 | $ | — | $ | (2.1 | ) | $ | 3.4 | ||||||||
Provision for inventory obsolescence | 0.6 | 0.1 | — | (0.4 | ) | 0.3 | |||||||||||||
Provision for residual value and credit losses on financing receivables | 1.2 | — | — | (0.5 | ) | 0.7 | |||||||||||||
127
Item 9. Changes in and Disagreements with Accountants on Accounting and Financial Disclosure
None.
Item 9A. Controls and Procedures
Evaluation of Disclosure Controls and Procedures
The Company’s management, with the participation of the Company’s Chief Executive Officer and Chief Financial Officer, have evaluated the effectiveness of the Company’s disclosure controls and procedures (as such term is defined in Rules13a-15(e) or Rule 15d-15(e) under the Securities Exchange Act of 1934, as amended (“the Exchange Act”)) as of the end of the period covered by this report. Based on such evaluation, the Company’s Chief Executive Officer and Chief Financial Officer have concluded that, as of the end of such period, the Company’s disclosure controls and procedures are effective in recording, processing, summarizing, and reporting, on a timely basis, information required to be disclosed by the Company in the reports that it files or submits under the Exchange Act, and that information is accumulated and communicated to the Chief Executive Officer and Chief Financial Officer, as appropriate, to allow timely discussions regarding required disclosure.
Changes in Internal Control over Financial Reporting
There were no changes in our internal control over financial reporting identified in management’s evaluation pursuant to Rules 13a-15(d) of the Exchange Act during the period covered by this Annual Report on Form 10-K that materially affected, or are reasonably likely to materially affect, our internal control over financial reporting.
Management’s Annual Report on Internal Control over Financial Reporting
Management is responsible for establishing and maintaining adequate internal control over financial reporting (as defined in Rule 13a-15(f) and Rule 15d-15(f) under the Securities Exchange Act of 1934, as amended). Because of its inherent limitations, internal control over financial reporting may not prevent or detect misstatements. Also, projections of any evaluation of effectiveness to future periods are subject to the risk that controls may become inadequate because of changes in conditions or that the degree of compliance with the policies or procedures may deteriorate.
In order to evaluate the effectiveness of internal control over financial reporting, management conducted an assessment using the criteria established in Internal Control - Integrated Framework (2013), issued by the Committee of Sponsoring Organizations of the Treadway Commission.
Based on its assessment, management concluded that, as of June 30, 2018, the Company’s internal control over financial reporting is effective. RSM LLP, independent registered public accounting firm, has audited the Consolidated Financial Statements of the Company and the Company’s internal control over financial reporting and has included their reports herein.
Item 9B. Other Information
None.
128
PART III
Item 10. Directors, Executive Officers and Corporate Governance
The information required by this item will be included in our definitive proxy statement for the 2018 Annual Meeting of Stockholders and is incorporated herein by reference. We will file such definitive proxy statement with the SEC pursuant to Regulation 14A within 120 days after our fiscal year ended June 30, 2018.
Item 11. Executive Compensation
The information required by this item will be included in our definitive proxy statement for the 2018 Annual Meeting of Stockholders and is incorporated herein by reference. We will file such definitive proxy statement with the SEC pursuant to Regulation 14A within 120 days after our fiscal year ended June 30, 2018.
Item 12. Security Ownership of Certain Beneficial Owners and Management and Related Stockholder Matters
The information required by this item will be included in our definitive proxy statement for the 2018 Annual Meeting of Stockholders and is incorporated herein by reference. We will file such definitive proxy statement with the SEC pursuant to Regulation 14A within 120 days after our fiscal year ended June 30, 2018.
Item 13. Certain Relationships and Related Transactions, and Director Independence
The information required by this item will be included in our definitive proxy statement for the 2018 Annual Meeting of Stockholders and is incorporated herein by reference. We will file such definitive proxy statement with the SEC pursuant to Regulation 14A within 120 days after our fiscal year ended June 30, 2018.
Item 14. Principal Accounting Fees and Services
The information required by this item will be included in our definitive proxy statement for the 2018 Annual Meeting of Stockholders and is incorporated herein by reference. We will file such definitive proxy statement with the SEC pursuant to Regulation 14A within 120 days after our fiscal year ended June 30, 2018.
129
Part IV
Item 15. Exhibits, Financial Statement Schedules
(a) Financial Statement Schedules
The following documents are filed as part of this report:
(1) Consolidated Financial Statements:
Page | |
(2) Financial Statement Schedules:
All other schedules are omitted since the required information is not present or is not present in amounts sufficient to require submission of the schedule.
(b) Exhibits
The information required by this Item is set forth on the exhibit index.
130
EXHIBIT INDEX
Incorporated by Reference | ||||||||
Exhibit Number | Exhibit Description | Form | Exhibit | Filing Date | ||||
3.1 | S-8 | 3.1 | 3/13/2017 | |||||
3.2 | S-8 | 3.2 | 3/13/2017 | |||||
4.1 | S-1 | 4.1 | 11/22/2016 | |||||
4.2 | S-1 | 4.2 | 11/22/2016 | |||||
4.3 | S-1 | 4.3 | 11/22/2016 | |||||
4.4 | S-1 | 4.4 | 11/22/2016 | |||||
4.5 | S-1 | 4.5 | 1/24/2017 | |||||
4.6 | 8-K | 4.2 | 3/15/2017 | |||||
4.7 | 8-K | 4.1 | 3/15/2017 | |||||
10.1 | S-1 | 10.1 | 12/27/2016 | |||||
10.2 | S-1 | 10.2 | 11/22/2016 | |||||
10.3 | S-1 | 10.3 | 11/22/2016 | |||||
10.4 | S-1 | 10.4 | 11/22/2016 | |||||
10.5 | S-1 | 10.13 | 1/24/2017 | |||||
10.6 | S-1 | 10.5 | 11/22/2016 | |||||
10.7 | S-1 | 10.6 | 11/22/2016 | |||||
10.8 | S-1 | 10.7 | 11/22/2016 | |||||
131
Incorporated by Reference | ||||||||
Exhibit Number | Exhibit Description | Form | Exhibit | Filing Date | ||||
10.9 | S-1 | 10.8 | 12/27/2016 | |||||
10.10 | S-1 | 10.9 | 11/22/2016 | |||||
10.11 | S-1 | 10.10 | 11/22/2016 | |||||
+10.12 | S-1 | 10.11 | 2/15/2017 | |||||
10.12.1 | 10-K | 10.12.1 | 9/21/2017 | |||||
10.13 | S-1 | 10.12 | 11/22/2016 | |||||
*10.14 | S-1 | 10.14 | 1/24/2017 | |||||
*10.15 | S-8 | 99.1 | 3/13/2017 | |||||
*10.16 | S-1 | 10.16 | 2/15/2017 | |||||
*10.17 | S-1 | 10.17 | 2/15/2017 | |||||
*10.18 | 8-K | 10.5 | 3/15/2017 | |||||
*10.19 | S-8 | 99.2 | 3/13/2017 | |||||
*10.20 | 8-K | 10.11 | 3/15/2017 | |||||
*10.21 | 8-K | 10.12 | 3/15/2017 | |||||
*10.22 | 8-K | 10.6 | 3/15/2017 | |||||
*10.23 | S-1 | 10.22 | 2/15/2017 | |||||
*10.24 | 8-K | 10.7 | 3/9/2017 | |||||
*10.25 | 8-K | 10.8 | 3/9/2017 | |||||
*10.26 | 8-K | 10.9 | 3/9/2017 | |||||
*10.27 | S-8 | 99.3 | 3/13/2017 | |||||
*10.28 | S-1 | 10.27 | 2/15/2017 | |||||
*10.29 | S-1 | 10.28 | 2/15/2017 | |||||
10.30 | S-1 | 10.29 | 2/15/2017 | |||||
*10.31 | S-1 | 10.30 | 2/15/2017 | |||||
10.32 | 10-K | 10.32 | 9/21/2017 | |||||
10.33 | 10-Q | 10.1 | 2/8/2018 | |||||
132
Incorporated by Reference | ||||||||
Exhibit Number | Exhibit Description | Form | Exhibit | Filing Date | ||||
10.34 | 10-Q | 10.2 | 2/8/2018 | |||||
*10.35 | 8-K | 10.1 | 1/16/2018 | |||||
*10.36 | 8-K | 10.2 | 1/16/2018 | |||||
**21.1 | ||||||||
**23.1 | ||||||||
***31.1 | ||||||||
***31.2 | ||||||||
***32.1 | ||||||||
***32.2 | ||||||||
**101.INS | XBRL Instance Document. | |||||||
**101.SCH | XBRL Taxonomy Extension Schema Linkbase Document. | |||||||
**101.CAL | XBRL Taxonomy Calculation Linkbase Document. | |||||||
**101.DEF | XBRL Taxonomy Extension Definition Linkbase Document. | |||||||
**101.LAB | XBRL Taxonomy Label Linkbase Document. | |||||||
**101.PRE | XBRL Taxonomy Presentation Linkbase Document. | |||||||
* Indicates management contract or compensatory plan or agreement.
** Filed herewith.
*** Furnished herewith.
+ | Portions of this exhibit have been omitted pursuant to a confidential treatment request. This information has been filed separately with the SEC. |
133
SIGNATURES
Pursuant to the requirements of Section 13 or 15(d) of the Securities Exchange Act of 1934, the registrant has duly caused this report to be signed on its behalf by the undersigned, thereunto duly authorized.
PRESIDIO, INC. | ||
Dated: September 6, 2018 | By: | /s/ Robert Cagnazzi |
Robert Cagnazzi | ||
Chief Executive Officer | ||
(Principal Executive Officer) | ||
Pursuant to the requirements of the Securities Exchange Act of 1934, this report has been signed below by the following persons on behalf of the registrant and in the capacities indicated on September 6, 2018.
Signature | Title | |
/s/ Robert Cagnazzi | Chief Executive Officer and Chairman of the Board of Directors | |
Robert Cagnazzi | ||
/s/ Neil. O Johnston | Executive Vice President and Chief Financial Officer | |
Neil O. Johnston | (Principal Financial Officer) | |
/s/ Benjamin Pawson | Controller and Chief Accounting Officer | |
Benjamin Pawson | (Principal Accounting Officer) | |
/s/ Heather Berger | Director | |
Heather Berger | ||
/s/ Christopher L. Edson | Director | |
Christopher L. Edson | ||
/s/ Salim Hirji | Director | |
Salim Hirji | ||
/s/ Steven Lerner | Director | |
Steven Lerner | ||
/s/ Matthew H. Nord | Director | |
Matthew H. Nord | ||
/s/ Pankaj Patel | Director | |
Pankaj Patel | ||
/s/ Michael A. Reiss | Director | |
Michael A. Reiss | ||
/s/ Todd H. Siegel | Director | |
Todd H. Siegel | ||
134