Attached files
| file | filename |
|---|---|
| 8-K - 8-K - KEMET CORP | fy2019_q2x8kxrodmanandrens.htm |
Rodman & Renshaw The St. Regis New York, NY September 6th, 2018 20th Annual Global Investment Conference © KEMET Electronics. All Rights Reserved. 1
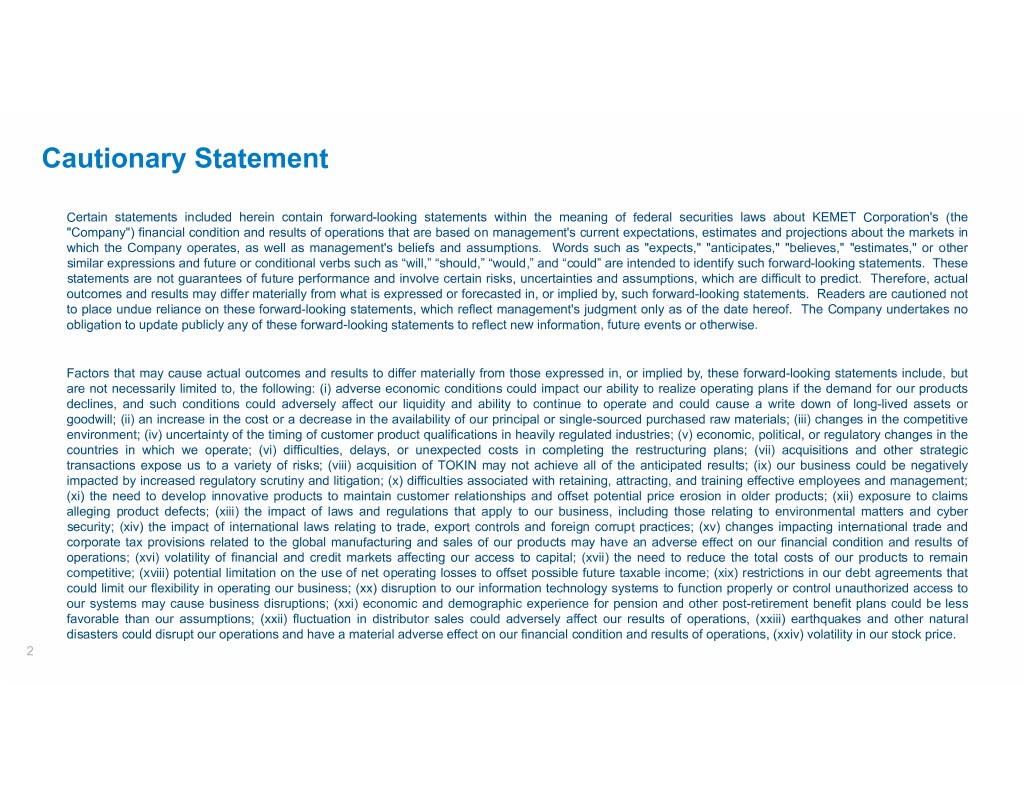
Cautionary Statement Certain statements included herein contain forward-looking statements within the meaning of federal securities laws about KEMET Corporation's (the "Company") financial condition and results of operations that are based on management's current expectations, estimates and projections about themarketsin which the Company operates, as well as management's beliefs and assumptions. Words such as "expects," "anticipates," "believes," "estimates," or other similar expressions and future or conditional verbs such as “will,” “should,” “would,” and “could” are intended to identify such forward-looking statements. These statements are not guarantees of future performance and involve certain risks, uncertainties and assumptions, which are difficult to predict. Therefore, actual outcomes and results may differ materially from what is expressed or forecasted in, or implied by, such forward-looking statements. Readers are cautioned not to place undue reliance on these forward-looking statements, which reflect management's judgment only as of the date hereof. The Company undertakesno obligation to update publicly any of these forward-looking statements to reflect new information, future events or otherwise. Factors that may cause actual outcomes and results to differ materially from those expressed in, or implied by, these forward-looking statements include, but are not necessarily limited to, the following: (i) adverse economic conditions could impact our ability to realize operating plans if the demand for our products declines, and such conditions could adversely affect our liquidity and ability to continue to operate and could cause a write down of long-lived assets or goodwill; (ii) an increase in the cost or a decrease in the availability of our principal or single-sourced purchased raw materials; (iii) changes in the competitive environment; (iv) uncertainty of the timing of customer product qualifications in heavily regulated industries; (v) economic, political, or regulatory changes in the countries in which we operate; (vi) difficulties, delays, or unexpected costs in completing the restructuring plans; (vii) acquisitions and other strategic transactions expose us to a variety of risks; (viii) acquisition of TOKIN may not achieve all of the anticipated results; (ix) our business could be negatively impacted by increased regulatory scrutiny and litigation; (x) difficulties associated with retaining, attracting, and training effective employees and management; (xi) the need to develop innovative products to maintain customer relationships and offset potential price erosion in older products; (xii) exposure to claims alleging product defects; (xiii) the impact of laws and regulations that apply to our business, including those relating to environmental matters and cyber security; (xiv) the impact of international laws relating to trade, export controls and foreign corrupt practices; (xv) changes impacting international trade and corporate tax provisions related to the global manufacturing and sales of our products may have an adverse effect on our financial condition and results of operations; (xvi) volatility of financial and credit markets affecting our access to capital; (xvii) the need to reduce the total costs of our products to remain competitive; (xviii) potential limitation on the use of net operating losses to offset possible future taxable income; (xix) restrictions in our debt agreements that could limit our flexibility in operating our business; (xx) disruption to our information technology systems to function properly or control unauthorized access to our systems may cause business disruptions; (xxi) economic and demographic experience for pension and other post-retirement benefit plans could beless favorable than our assumptions; (xxii) fluctuation in distributor sales could adversely affect our results of operations, (xxiii) earthquakes and other natural disasters could disrupt our operations and have a material adverse effect on our financial condition and results of operations, (xxiv) volatility in our stock price. 2
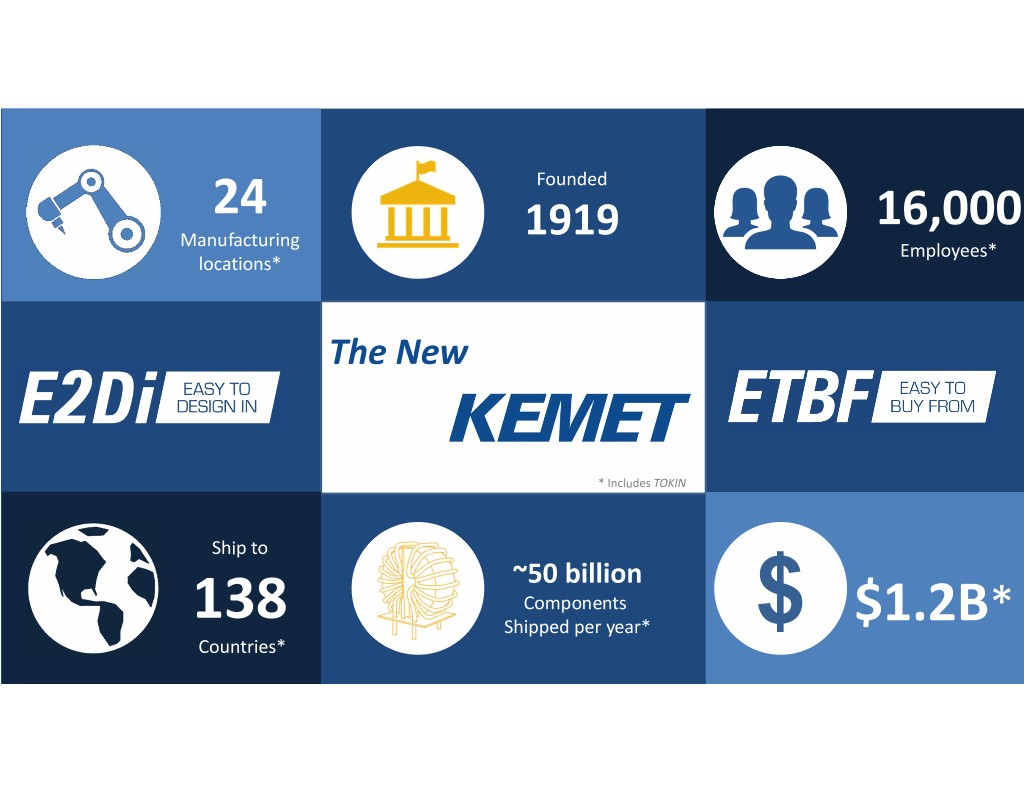
Founded 24 16,000 Manufacturing 1919 Employees* locations* The New * Includes TOKIN Ship to ~50 billion Components 138 Shipped per year* $ $1.2B* Countries*
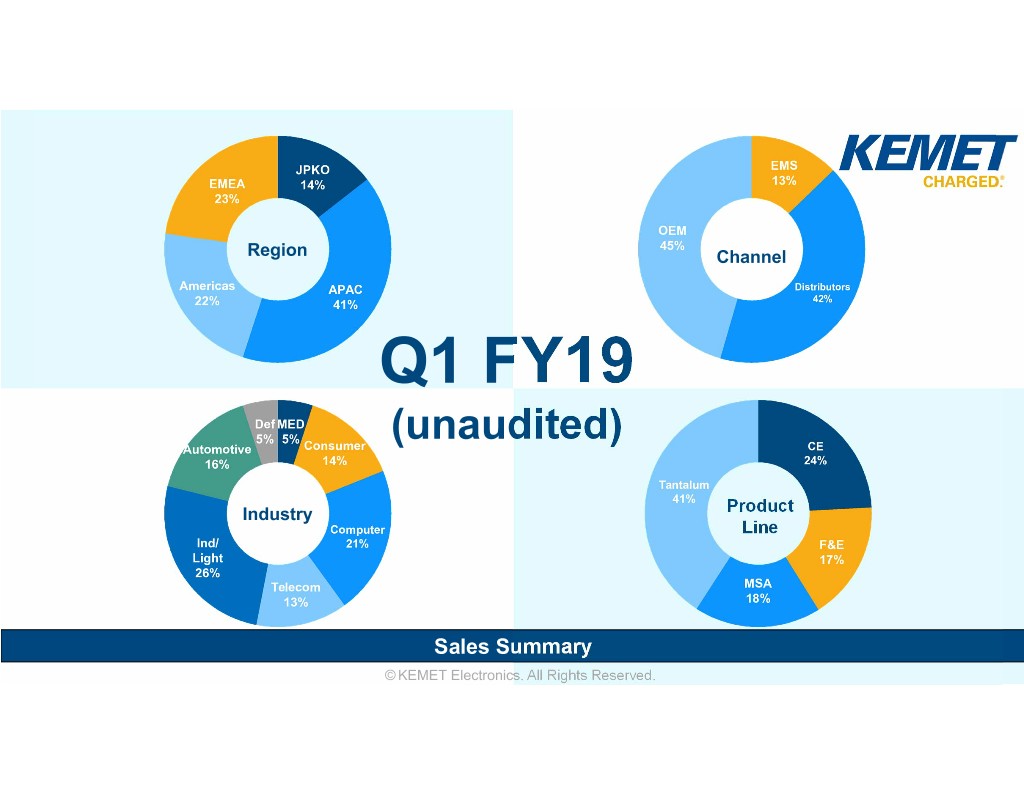
Region Channel Q1 FY19 (unaudited) Industry Product Line Sales Summary © KEMET Electronics. All Rights Reserved.
“Components have absolutely taken off….” Warren Buffet – May 2018
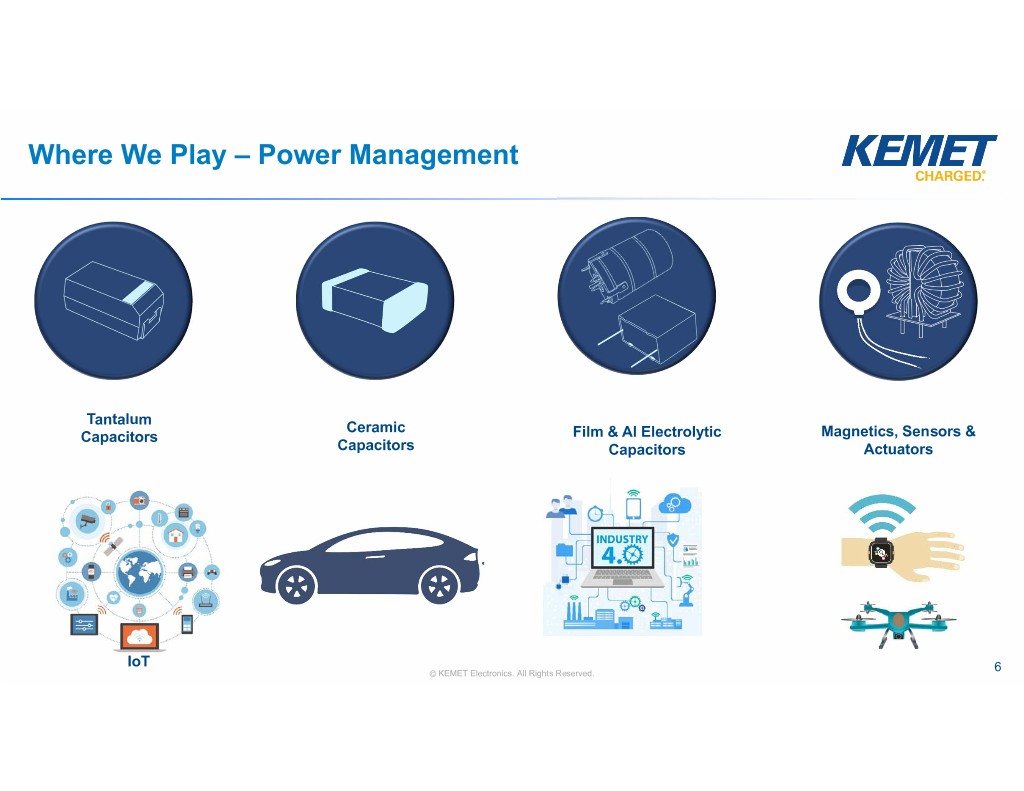
Where We Play – Power Management Tantalum Ceramic Capacitors Film & Al Electrolytic Magnetics, Sensors & Capacitors Capacitors Actuators IoT © KEMET Electronics. All Rights Reserved. 6
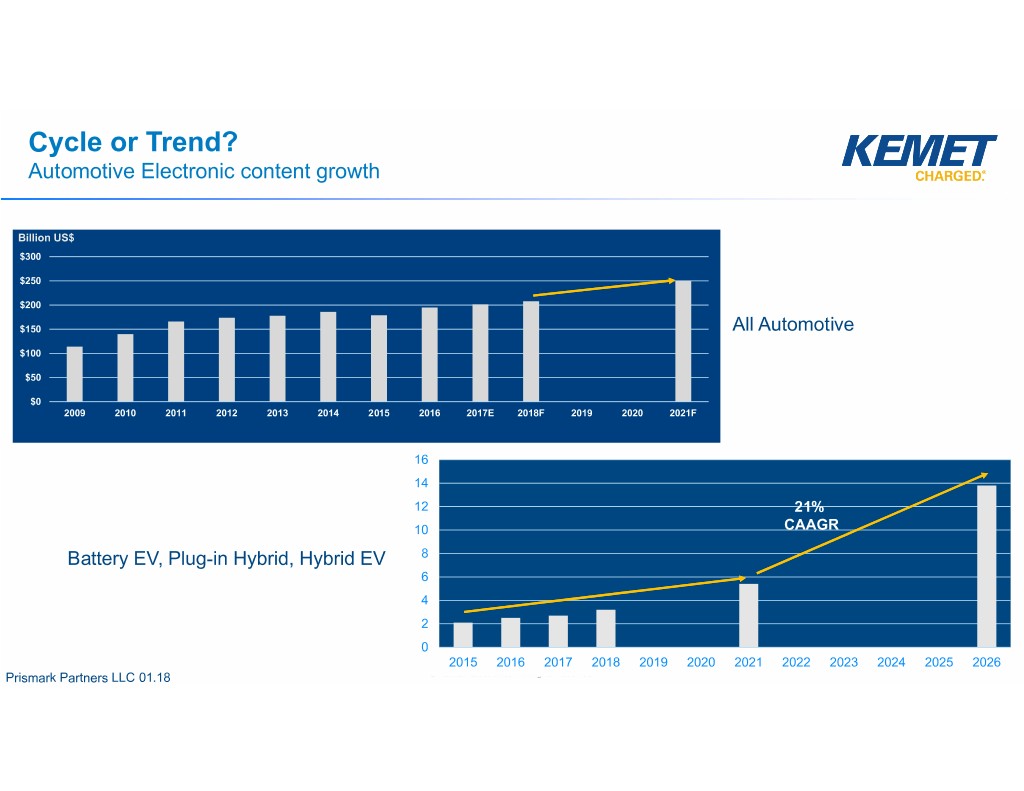
Cycle or Trend? Automotive Electronic content growth Billion US$ $300 $250 $200 $150 All Automotive $100 $50 $0 2009 2010 2011 2012 2013 2014 2015 2016 2017E 2018F 2019 2020 2021F 16 14 12 21% 10 CAAGR Battery EV, Plug-in Hybrid, Hybrid EV 8 6 4 2 0 2015 2016 2017 2018 2019 2020 2021 2022 2023 2024 2025 20267 Prismark Partners LLC 01.18 © KEMET Electronics. All Rights Reserved.
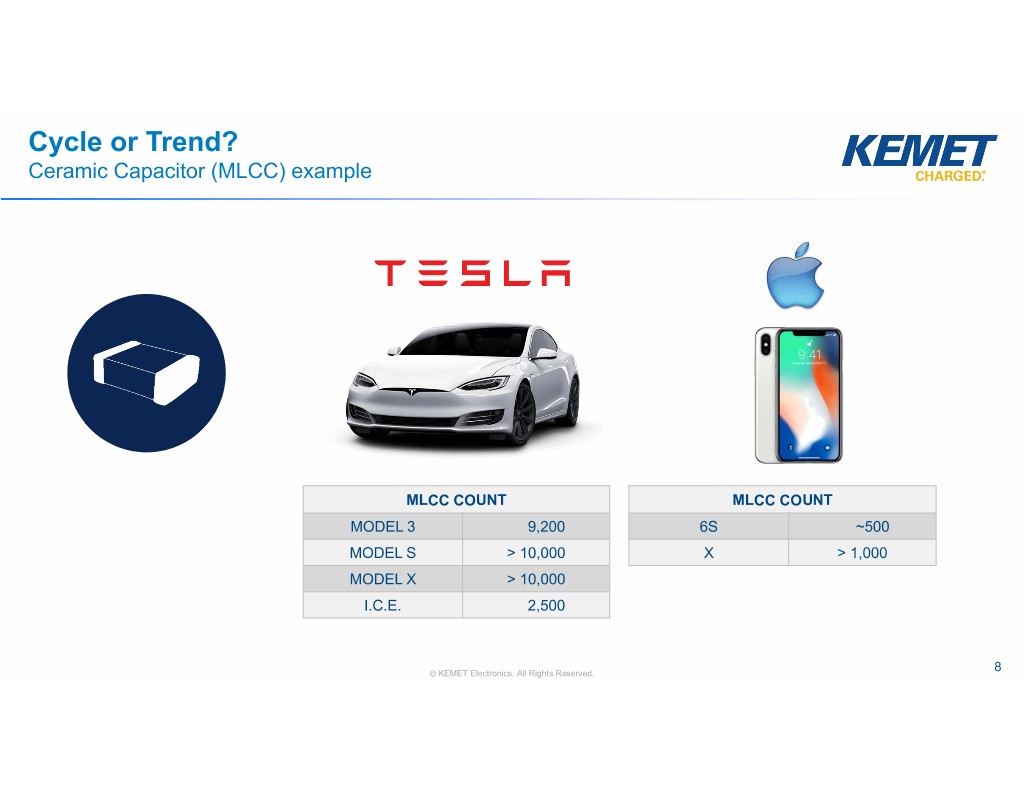
Cycle or Trend? Ceramic Capacitor (MLCC) example MLCC COUNT MLCC COUNT MODEL 3 9,200 6S ~500 MODEL S > 10,000 X> 1,000 MODEL X > 10,000 I.C.E. 2,500 © KEMET Electronics. All Rights Reserved. 8
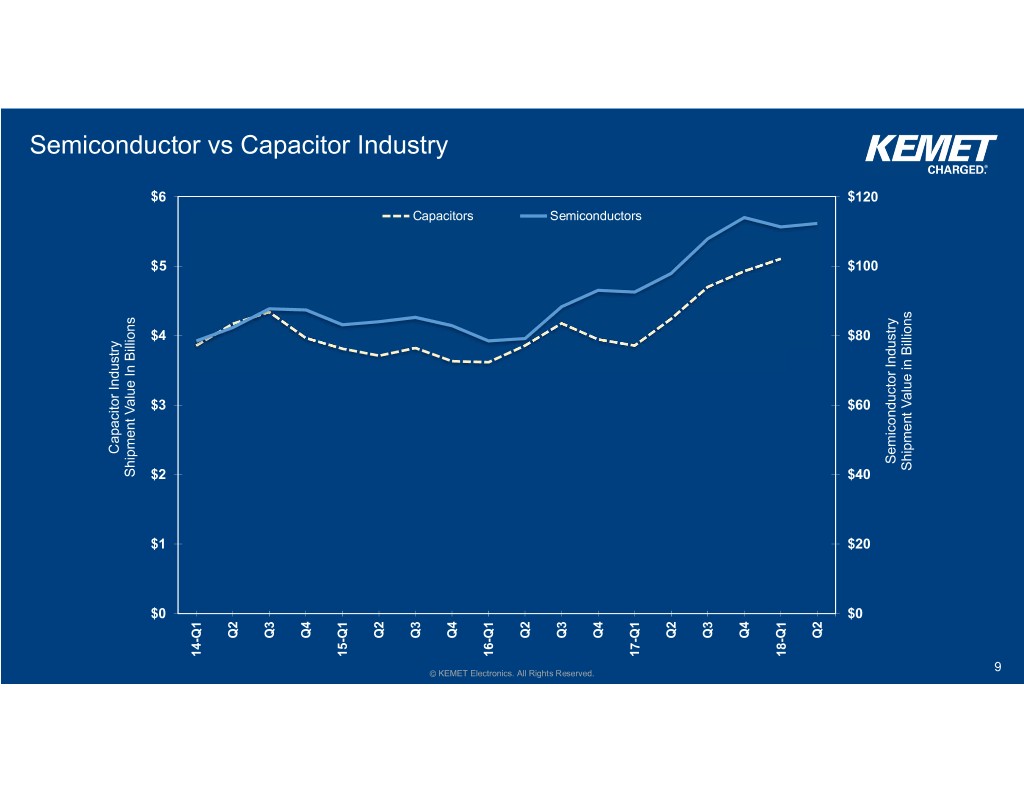
Semiconductor vs Capacitor Industry $6 $120 Capacitors Semiconductors $5 $100 $4 $80 $3 $60 Capacitor Industry Capacitor Semiconductor Industry Semiconductor Shipment Value in Billions in Value Shipment Shipment Value In Billions In Value Shipment $2 $40 $1 $20 $0 $0 Q2 Q3 Q4 Q2 Q3 Q4 Q2 Q3 Q4 Q2 Q3 Q4 Q2 14-Q1 15-Q1 16-Q1 17-Q1 18-Q1 © KEMET Electronics. All Rights Reserved. 9
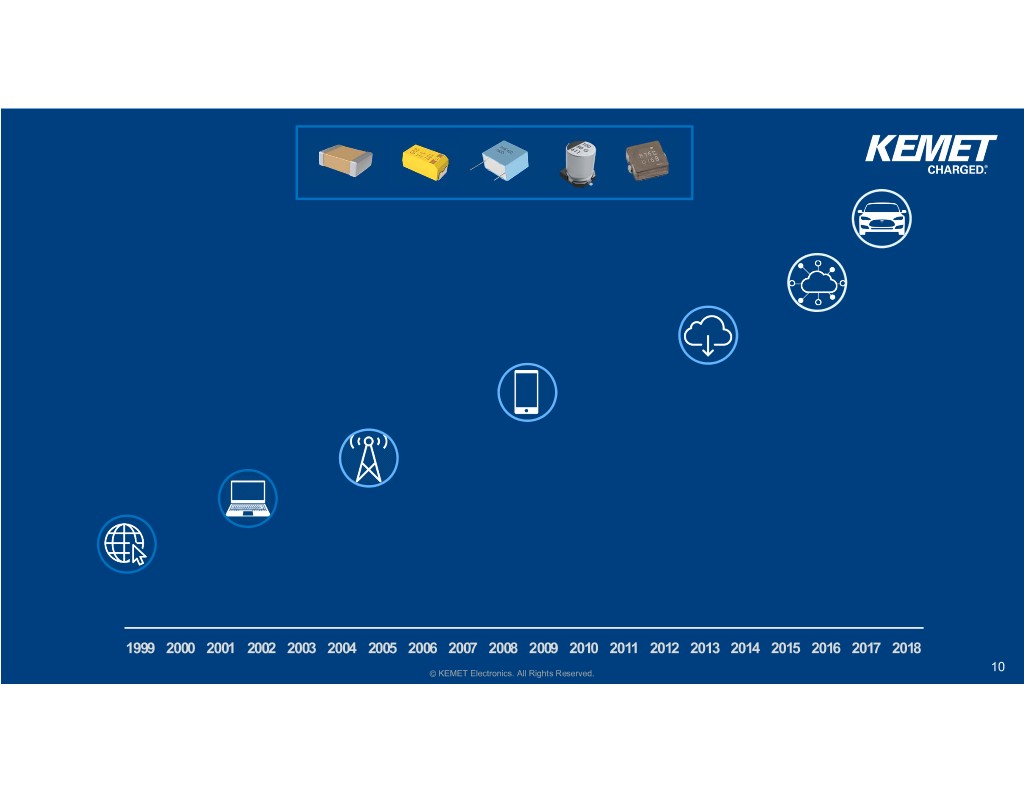
1999 2000 2001 2002 2003 2004 2005 2006 2007 2008 2009 2010 2011 2012 2013 2014 2015 2016 2017 2018 © KEMET Electronics. All Rights Reserved. 10
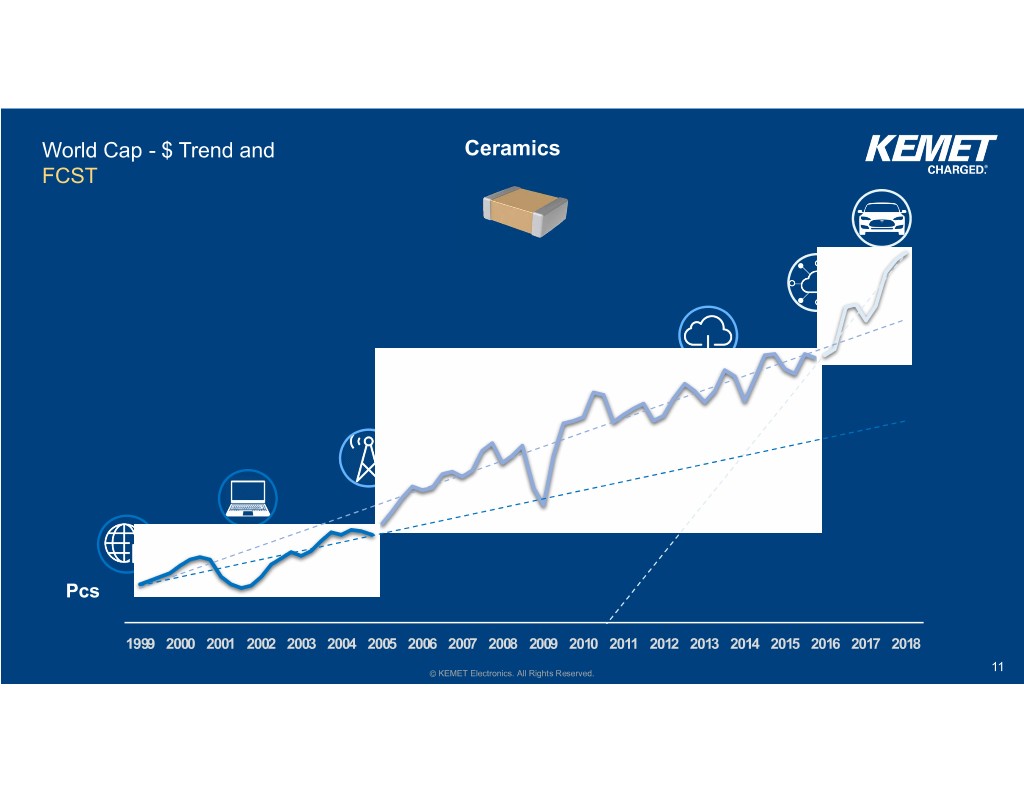
World Cap - $ Trend and Ceramics FCST Pcs 1999 2000 2001 2002 2003 2004 2005 2006 2007 2008 2009 2010 2011 2012 2013 2014 2015 2016 2017 2018 © KEMET Electronics. All Rights Reserved. 11
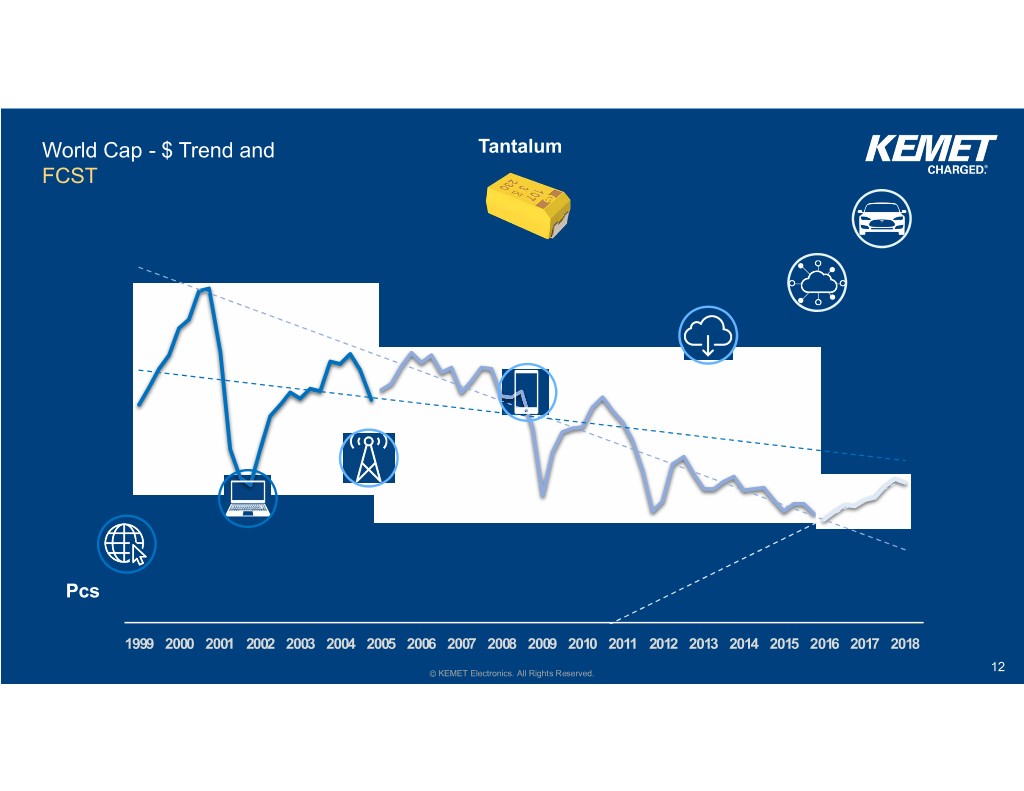
World Cap - $ Trend and Tantalum FCST Pcs 1999 2000 2001 2002 2003 2004 2005 2006 2007 2008 2009 2010 2011 2012 2013 2014 2015 2016 2017 2018 © KEMET Electronics. All Rights Reserved. 12
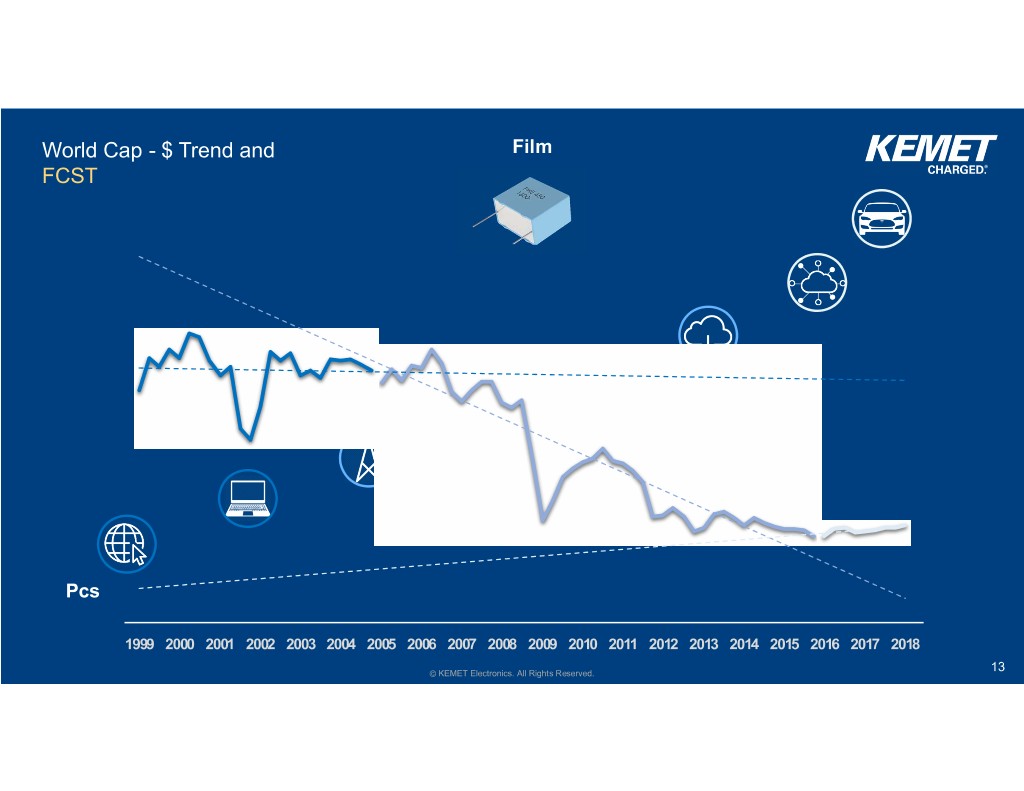
World Cap - $ Trend and Film FCST Pcs 1999 2000 2001 2002 2003 2004 2005 2006 2007 2008 2009 2010 2011 2012 2013 2014 2015 2016 2017 2018 © KEMET Electronics. All Rights Reserved. 13
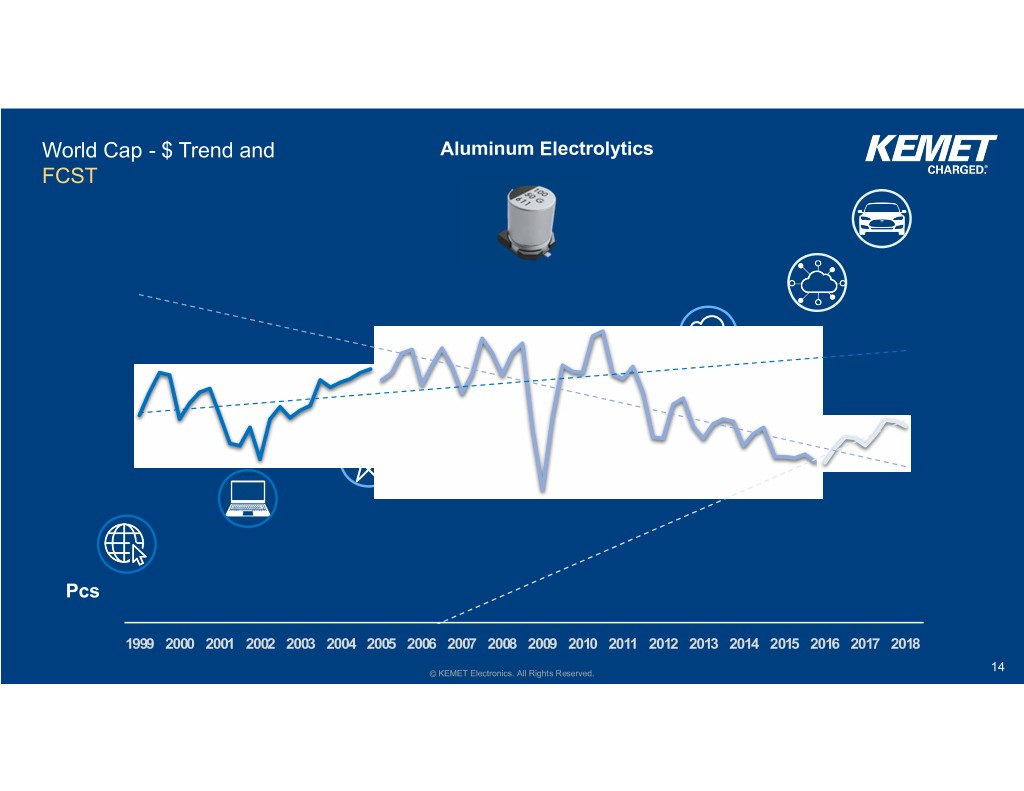
World Cap - $ Trend and Aluminum Electrolytics FCST Pcs 1999 2000 2001 2002 2003 2004 2005 2006 2007 2008 2009 2010 2011 2012 2013 20142015201620172018 © KEMET Electronics. All Rights Reserved. 14
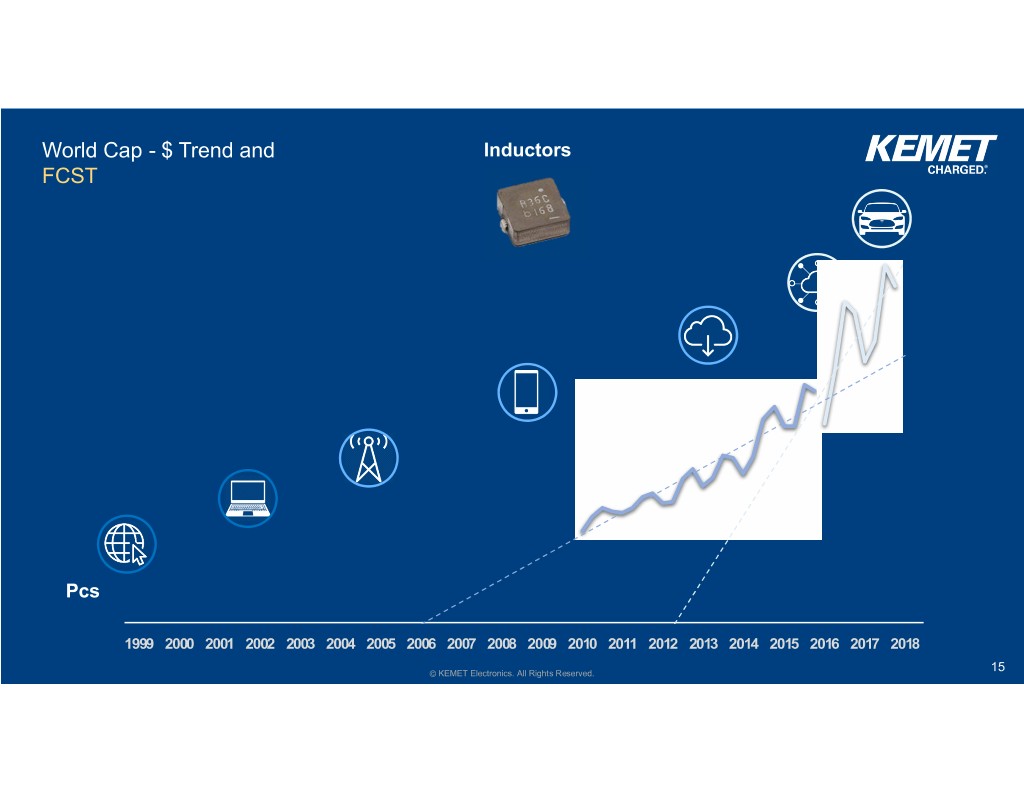
World Cap - $ Trend and Inductors FCST Pcs 1999 2000 2001 2002 2003 2004 2005 2006 2007 2008 2009 2010 2011 2012 2013 20142015201620172018 © KEMET Electronics. All Rights Reserved. 15
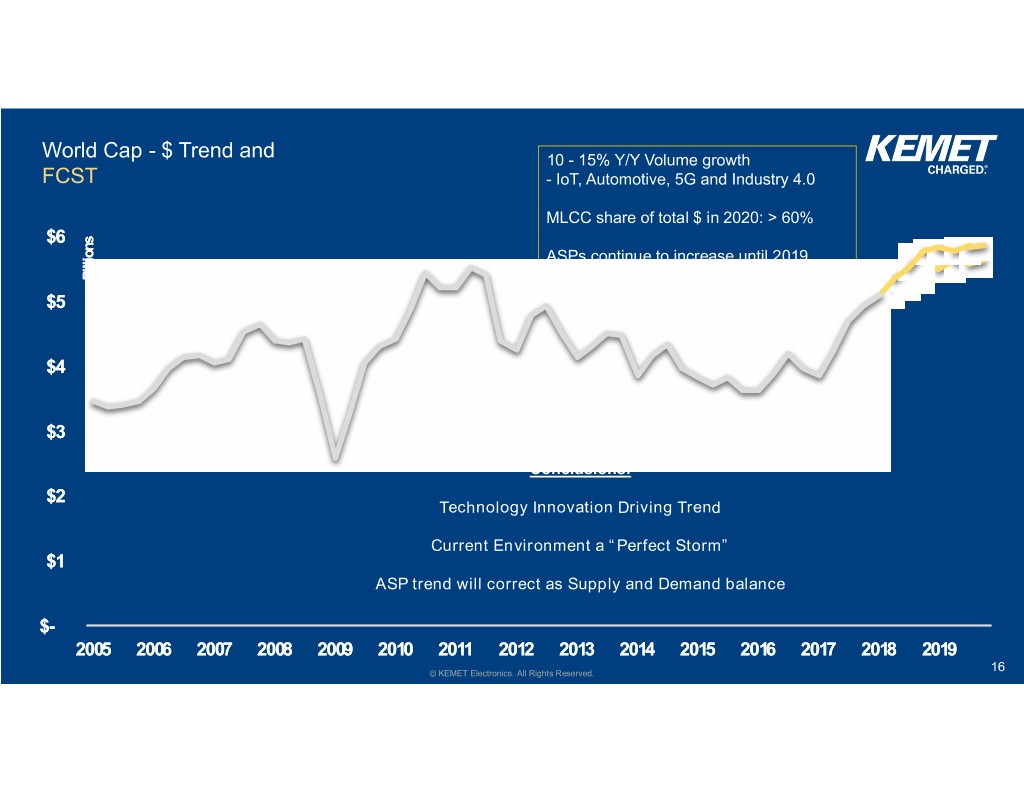
World Cap - $ Trend and 10 - 15% Y/Y Volume growth FCST - IoT, Automotive, 5G and Industry 4.0 MLCC share of total $ in 2020: > 60% $6 ASPs continue to increase until 2019 Billions Billions -While supply & demand balance $5 $4 $3 Conclusions: $2 Technology Innovation Driving Trend Current Environment a “Perfect Storm” $1 ASP trend will correct as Supply and Demand balance $- 2005 2006 2007 2008 2009 2010 2011 2012 2013 2014 2015 2016 2017 2018 2019 © KEMET Electronics. All Rights Reserved. 16
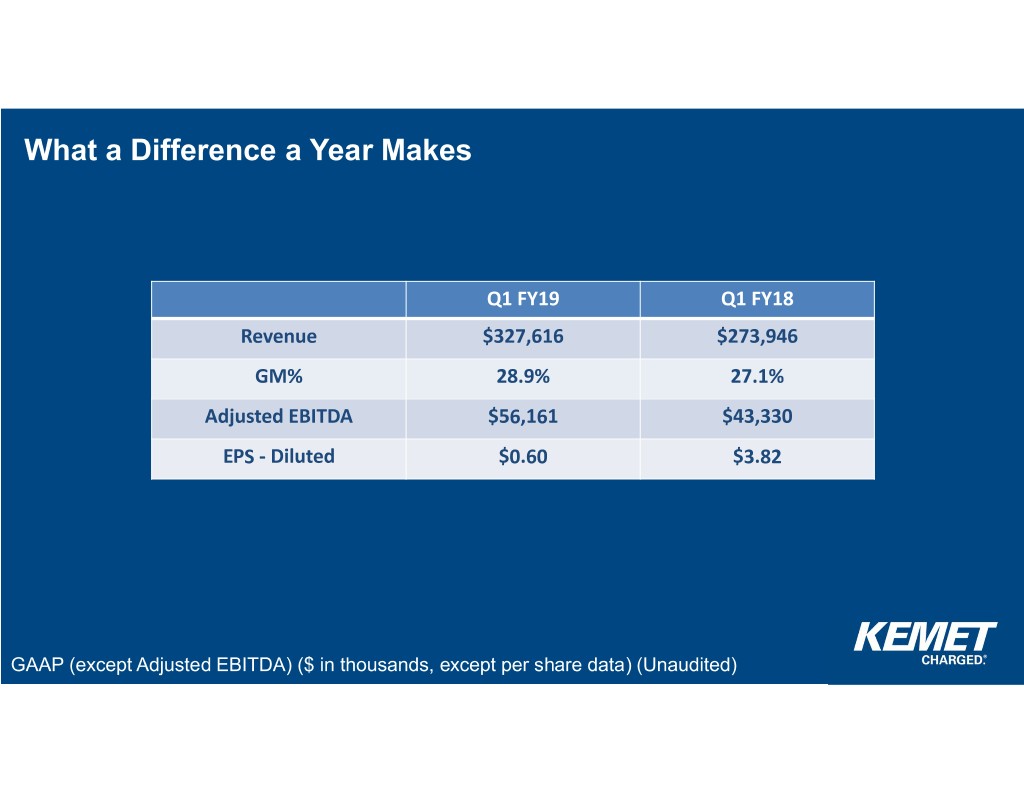
What a Difference a Year Makes Q1 FY19 Q1 FY18 Revenue $327,616 $273,946 GM% 28.9% 27.1% Adjusted EBITDA $56,161 $43,330 EPS ‐ Diluted $0.60 $3.82 GAAP (except Adjusted EBITDA) ($ in thousands, except per share data) (Unaudited)
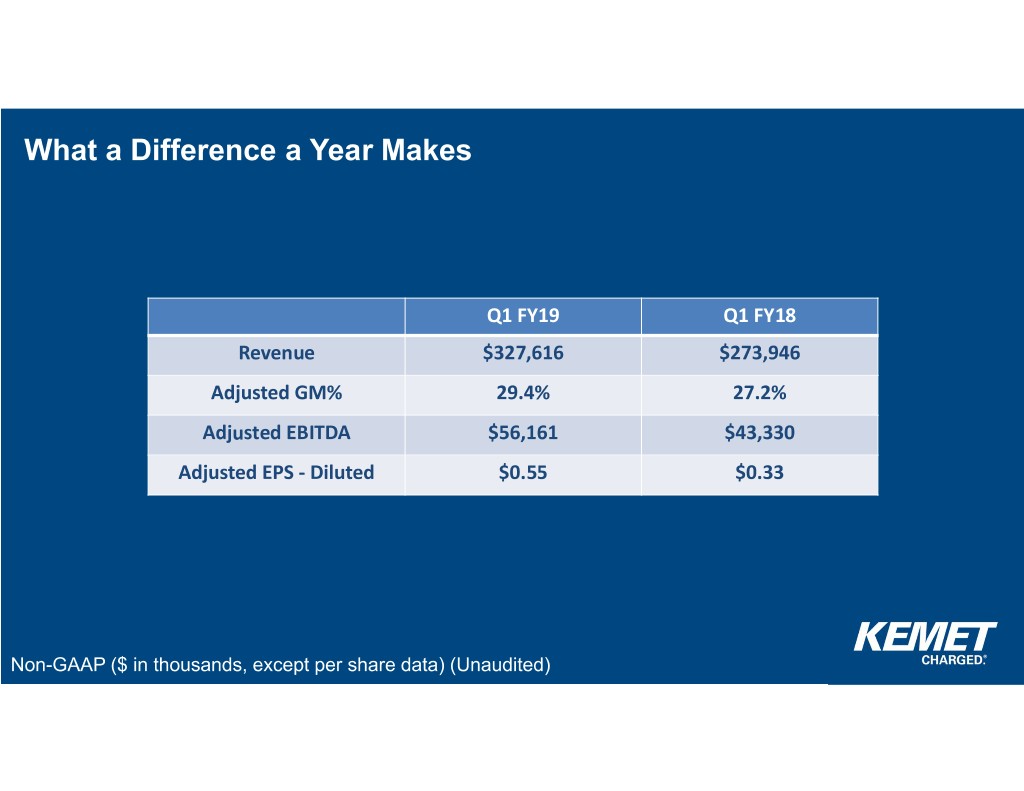
What a Difference a Year Makes Q1 FY19 Q1 FY18 Revenue $327,616 $273,946 Adjusted GM% 29.4% 27.2% Adjusted EBITDA $56,161 $43,330 Adjusted EPS ‐ Diluted $0.55 $0.33 Non-GAAP ($ in thousands, except per share data) (Unaudited)
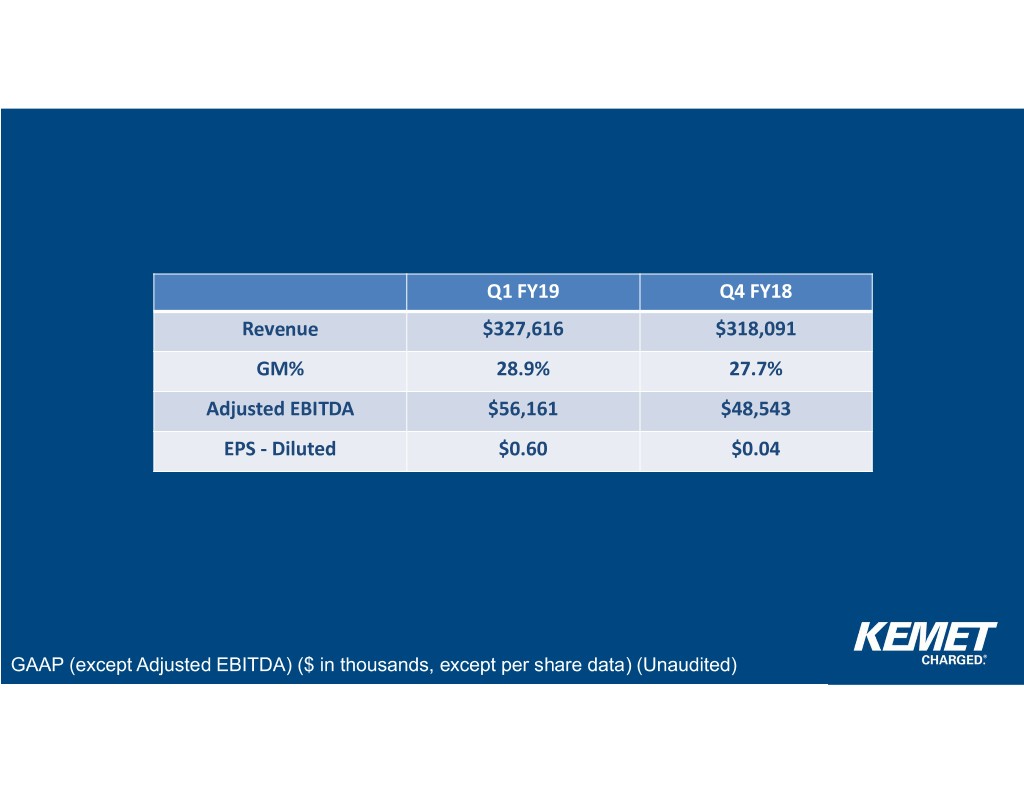
Q1 FY19 Q4 FY18 Revenue $327,616 $318,091 GM% 28.9% 27.7% Adjusted EBITDA $56,161 $48,543 EPS ‐ Diluted $0.60 $0.04 GAAP (except Adjusted EBITDA) ($ in thousands, except per share data) (Unaudited)
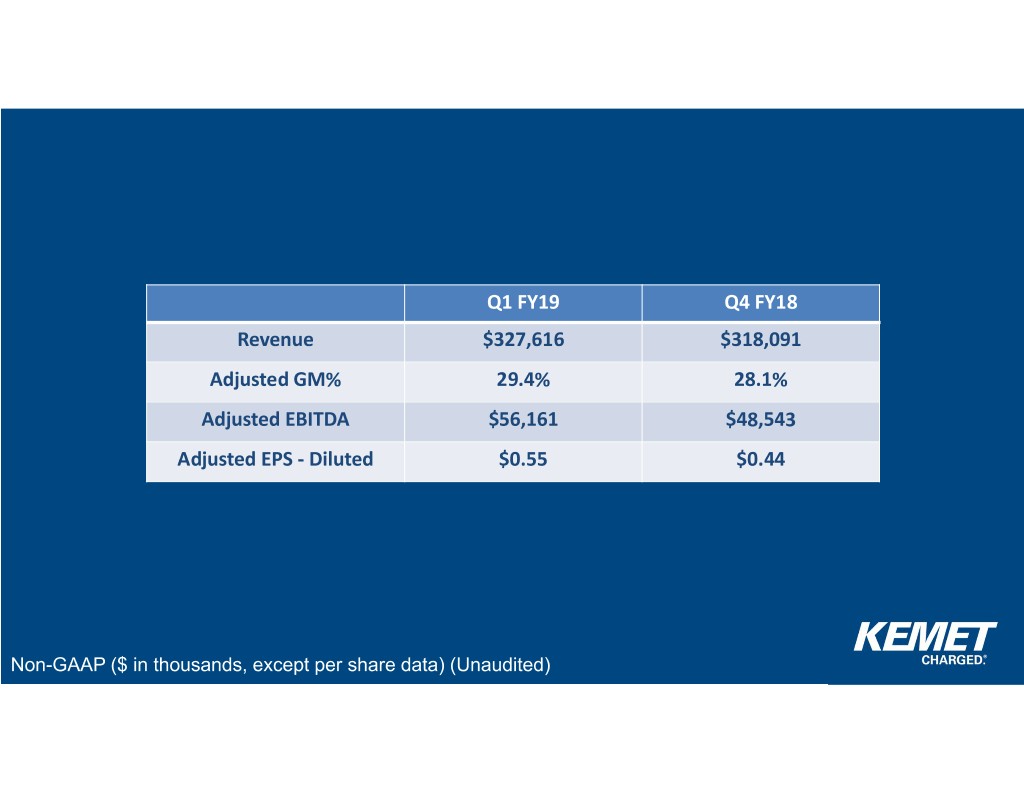
Q1 FY19 Q4 FY18 Revenue $327,616 $318,091 Adjusted GM% 29.4% 28.1% Adjusted EBITDA $56,161 $48,543 Adjusted EPS ‐ Diluted $0.55 $0.44 Non-GAAP ($ in thousands, except per share data) (Unaudited)
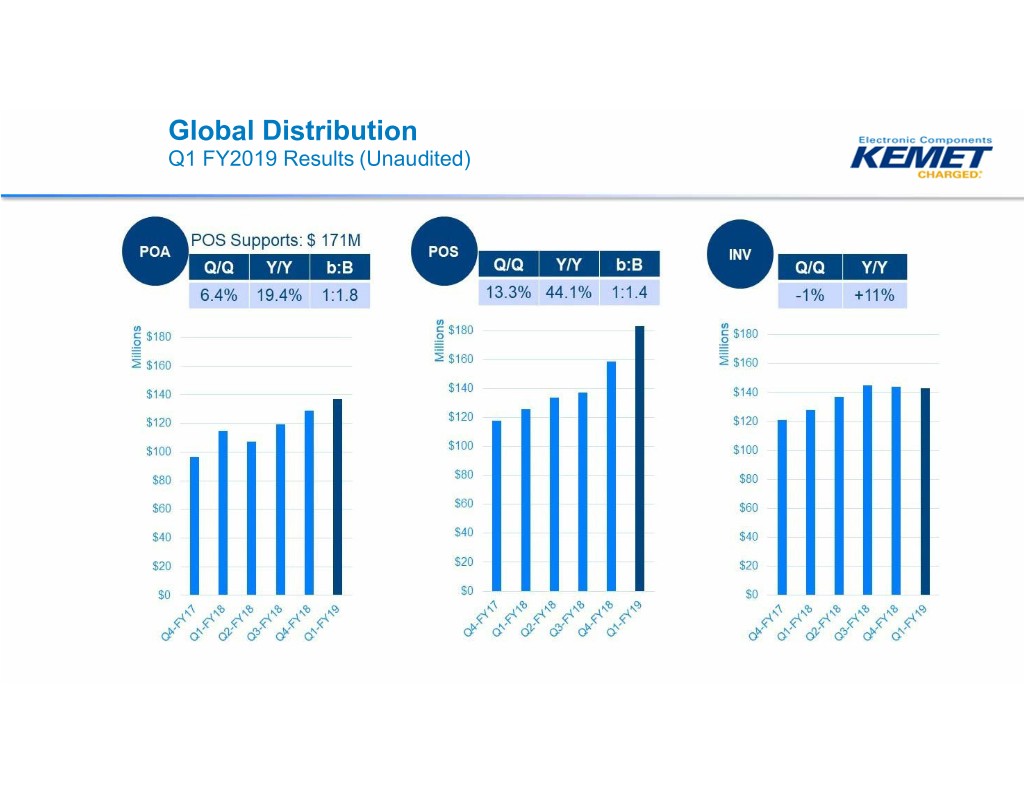
Global Distribution Q1 FY2019 Results (Unaudited)
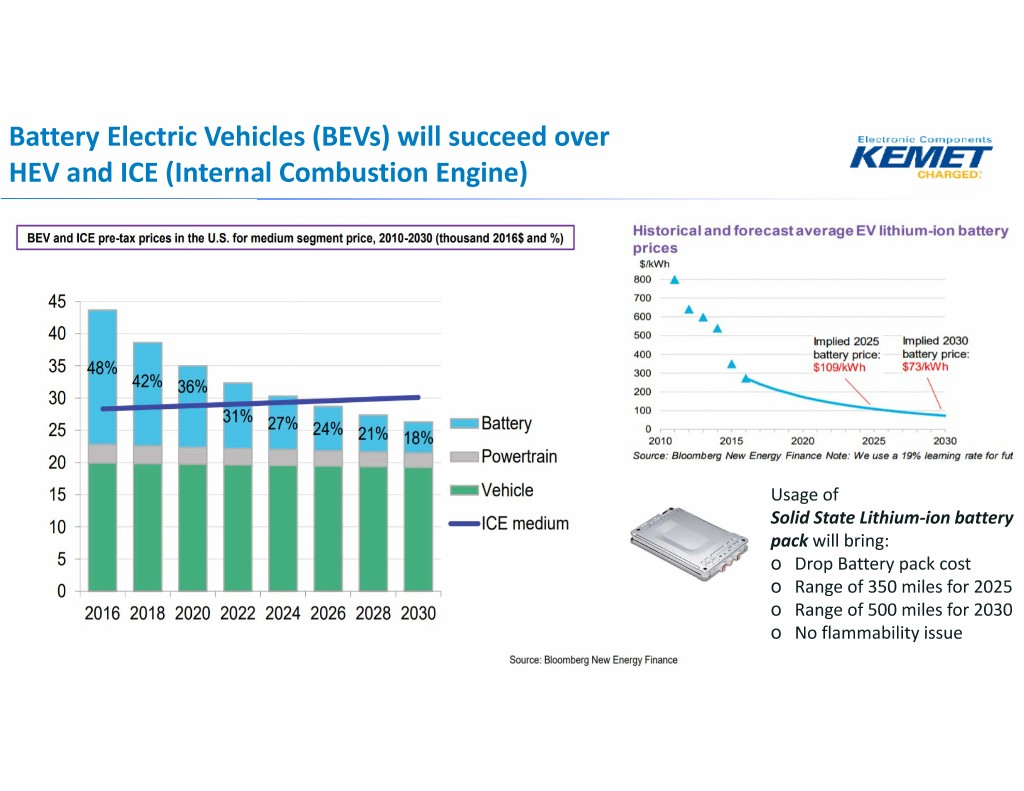
Battery Electric Vehicles (BEVs) will succeed over HEV and ICE (Internal Combustion Engine) Usage of Solid State Lithium‐ion battery pack will bring: o Drop Battery pack cost o Range of 350 miles for 2025 o Range of 500 miles for 2030 o No flammability issue
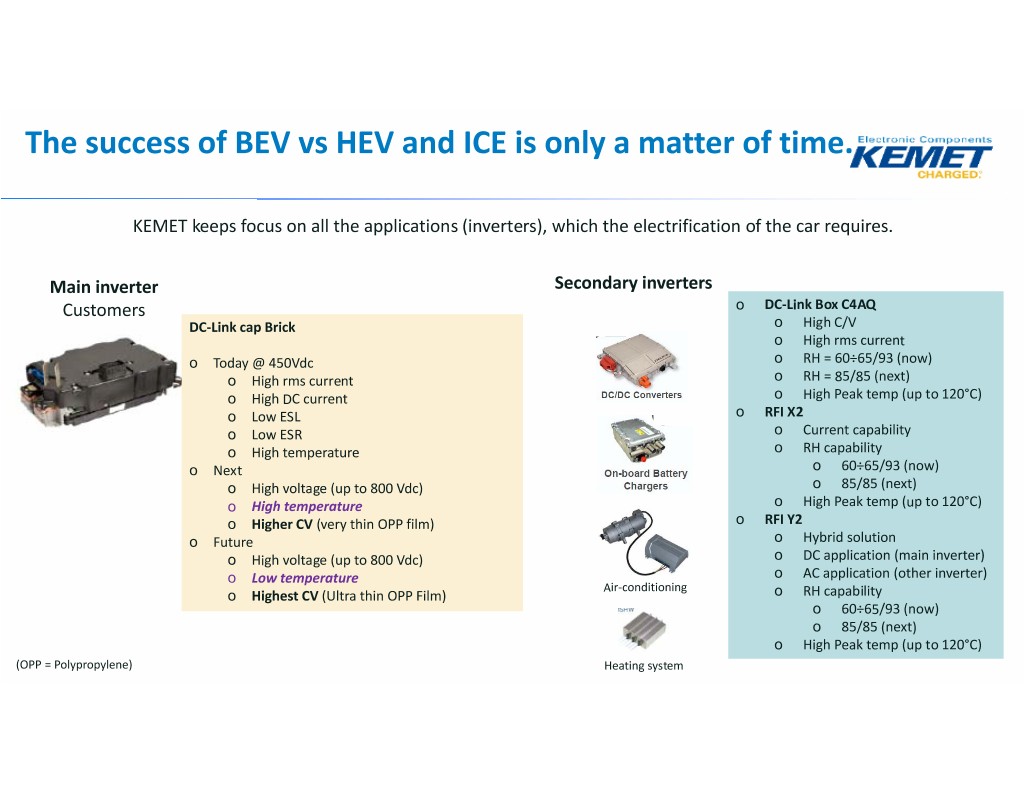
The success of BEV vs HEV and ICE is only a matter of time. KEMET keeps focus on all the applications (inverters), which the electrification of the car requires. Main inverter Secondary inverters Customers o DC‐Link Box C4AQ DC‐Link cap Brick o High C/V o High rms current o Today @ 450Vdc o RH = 60÷65/93 (now) o High rms current o RH = 85/85 (next) o High DC current o High Peak temp (up to 120°C) o Low ESL o RFI X2 o Low ESR o Current capability o High temperature o RH capability o Next o 60÷65/93 (now) o High voltage (up to 800 Vdc) o 85/85 (next) o High temperature o High Peak temp (up to 120°C) o Higher CV (very thin OPP film) o RFI Y2 o Future o Hybrid solution o High voltage (up to 800 Vdc) o DC application (main inverter) o Low temperature o AC application (other inverter) Air‐conditioning o Highest CV (Ultra thin OPP Film) o RH capability o 60÷65/93 (now) o 85/85 (next) o High Peak temp (up to 120°C) (OPP = Polypropylene) Heating system
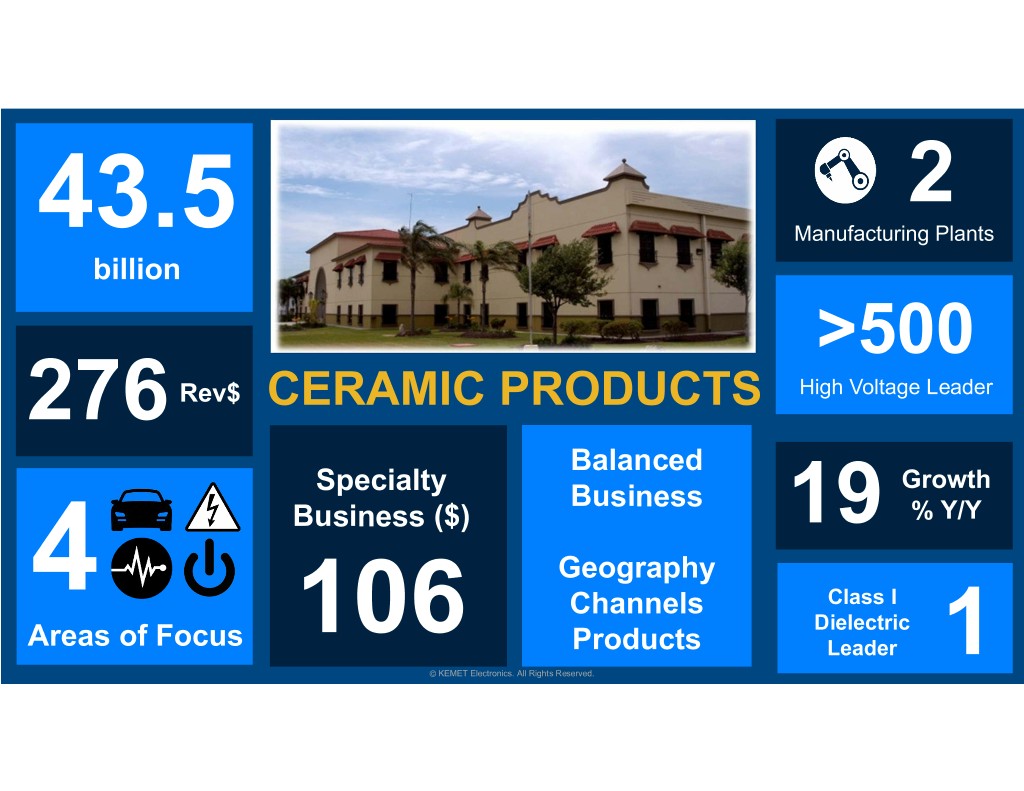
2 43.5 Manufacturing Plants billion >500 276 Rev$ CERAMIC PRODUCTS High Voltage Leader Balanced Specialty Growth Business Business ($) 19 % Y/Y Geography 4 Class I Channels Areas of Focus 106 Dielectric Products Leader 124 © KEMET Electronics. All Rights Reserved.

KEMET Confidential
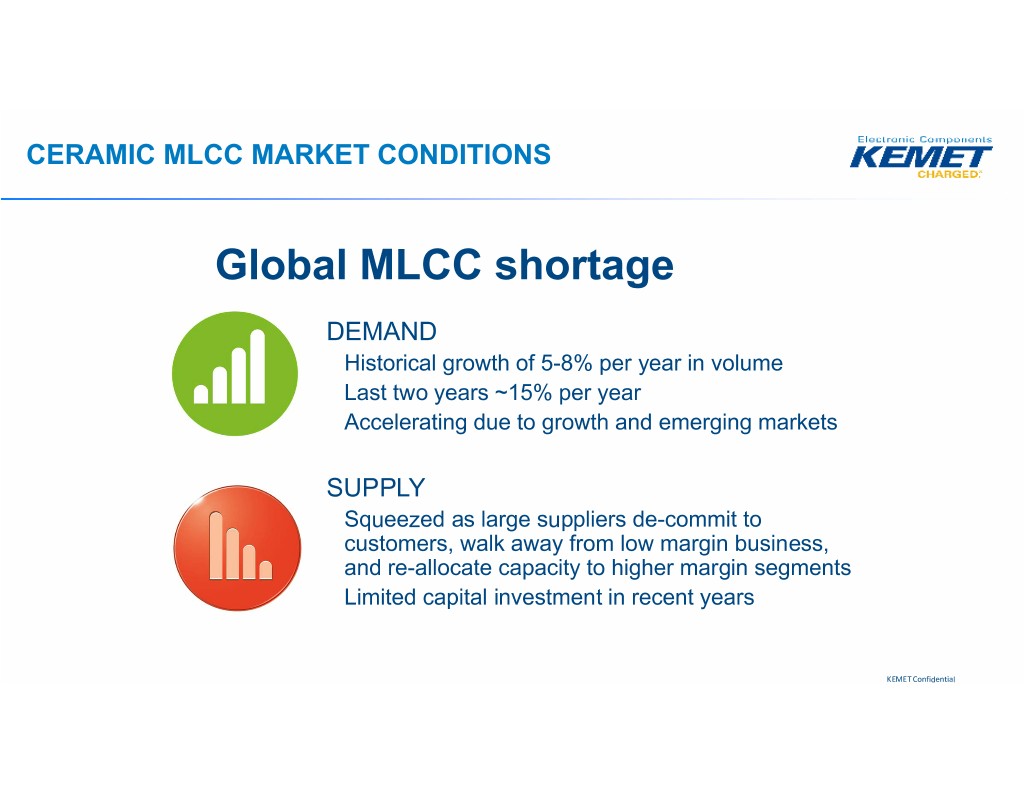
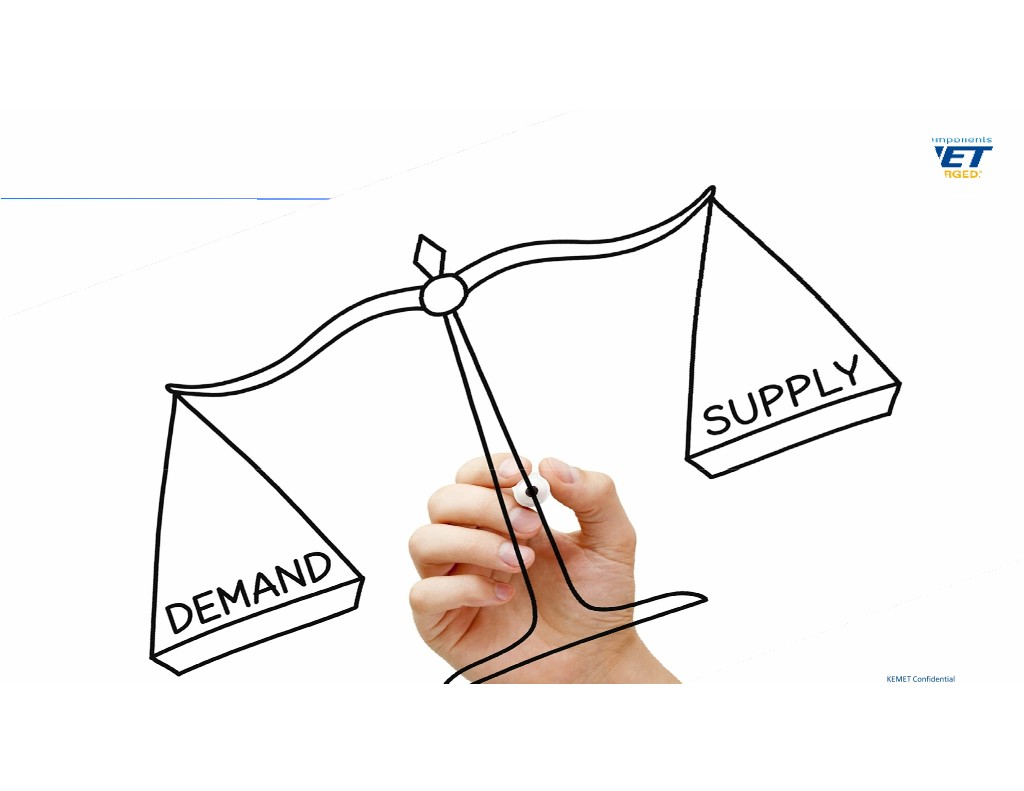
CERAMIC MLCC MARKET CONDITIONS Global MLCC shortage DEMAND Historical growth of 5-8% per year in volume Last two years ~15% per year Accelerating due to growth and emerging markets SUPPLY Squeezed as large suppliers de-commit to customers, walk away from low margin business, and re-allocate capacity to higher margin segments Limited capital investment in recent years KEMET Confidential
KEMET did not create the market shortage KEMET cannot fix the shortage © KEMET Electronics. All Rights Reserved. 28
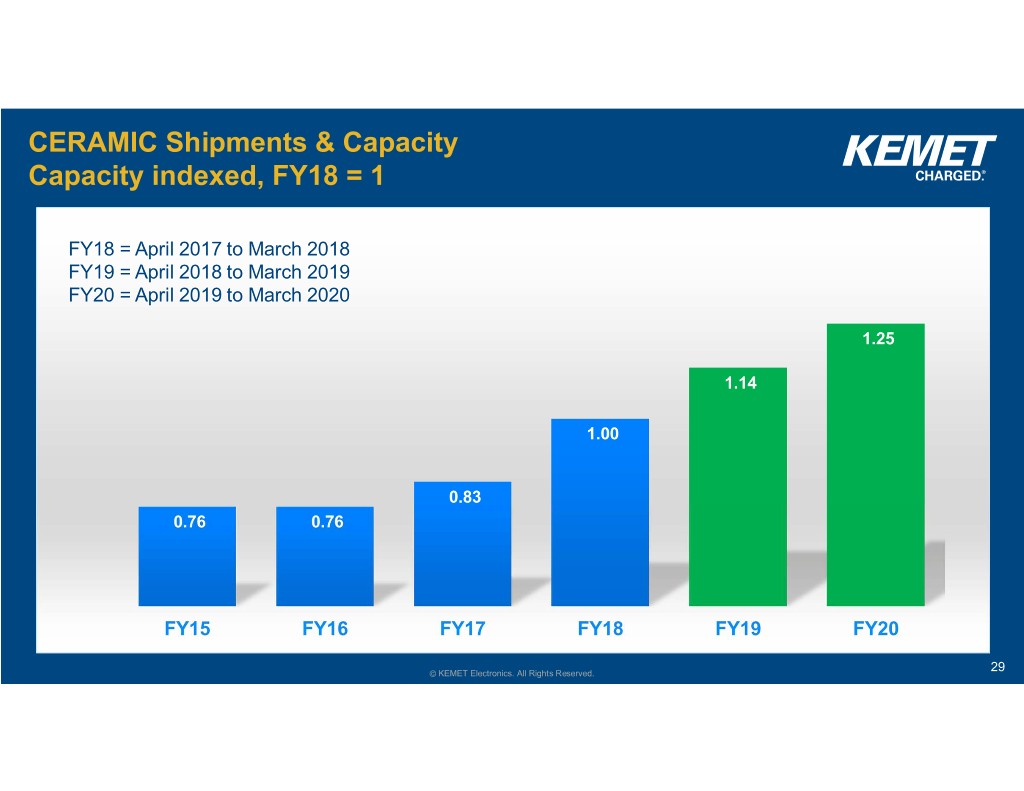
CERAMIC Shipments & Capacity Capacity indexed, FY18 = 1 © KEMET Electronics. All Rights Reserved. 29
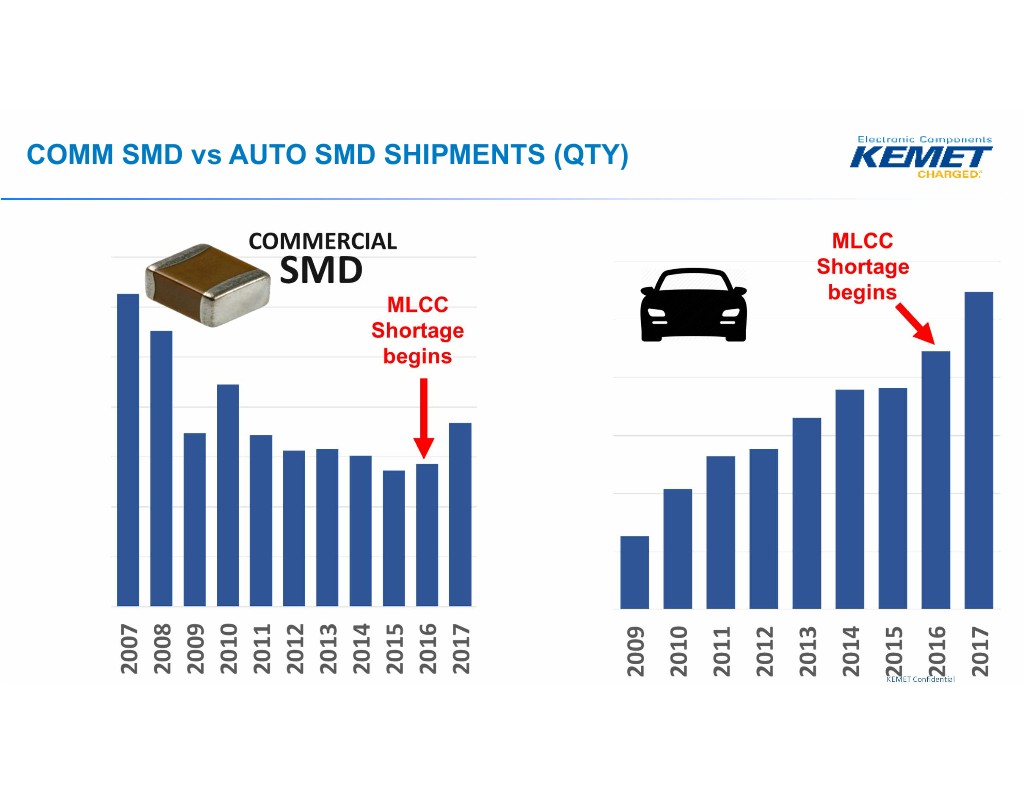
COMM SMD vs AUTO SMD SHIPMENTS (QTY) KEMET Confidential

Appendix
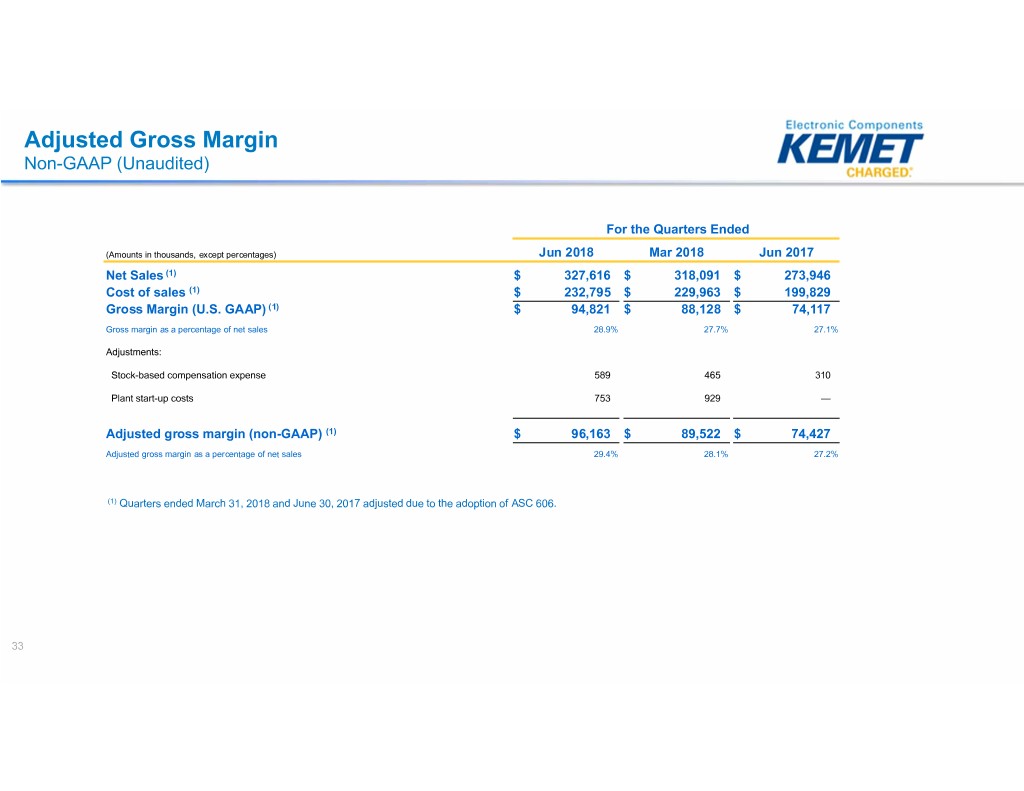
Adjusted Gross Margin Non-GAAP (Unaudited) For the Quarters Ended (Amounts in thousands, except percentages) Jun 2018 Mar 2018 Jun 2017 Net Sales (1) $ 327,616 $ 318,091 $ 273,946 Cost of sales (1) $ 232,795 $ 229,963 $ 199,829 Gross Margin (U.S. GAAP) (1) $ 94,821 $ 88,128 $ 74,117 Gross margin as a percentage of net sales 28.9% 27.7% 27.1% Adjustments: Stock-based compensation expense 589 465 310 Plant start-up costs 753 929 — Adjusted gross margin (non-GAAP) (1) $ 96,163 $ 89,522 $ 74,427 Adjusted gross margin as a percentage of net sales 29.4% 28.1% 27.2% (1) Quarters ended March 31, 2018 and June 30, 2017 adjusted due to the adoption of ASC 606. 33
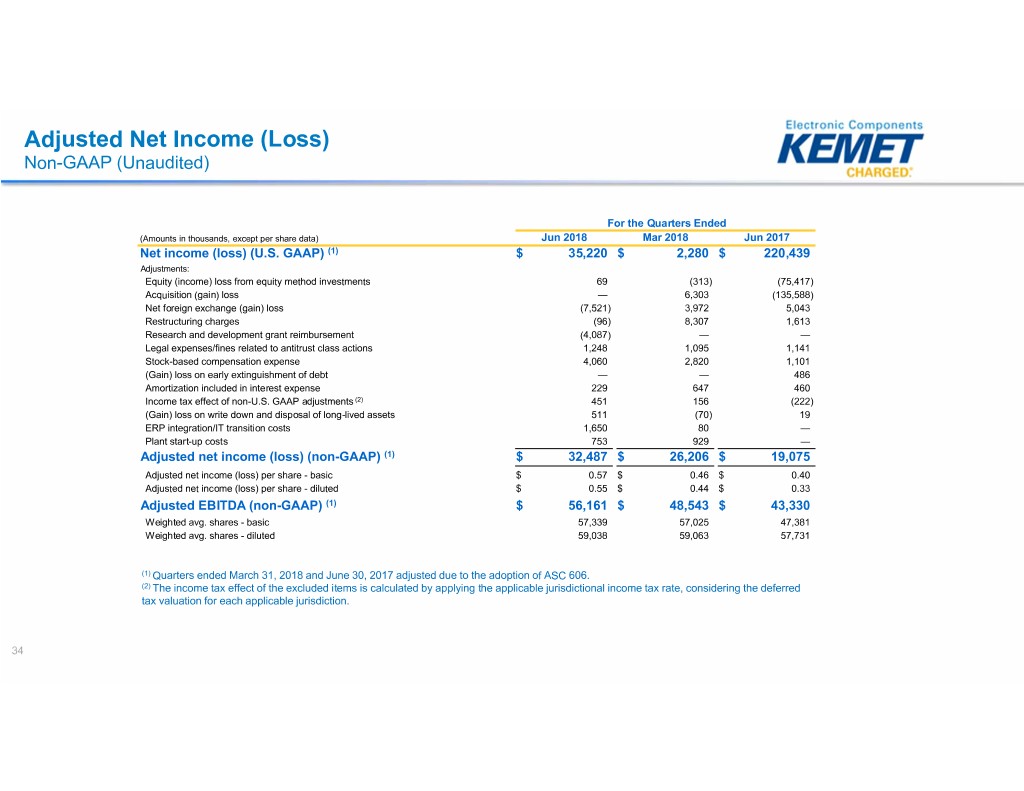
Adjusted Net Income (Loss) Non-GAAP (Unaudited) For the Quarters Ended (Amounts in thousands, except per share data) Jun 2018 Mar 2018 Jun 2017 Net income (loss) (U.S. GAAP) (1) $ 35,220 $ 2,280 $ 220,439 Adjustments: Equity (income) loss from equity method investments 69 (313) (75,417) Acquisition (gain) loss — 6,303 (135,588) Net foreign exchange (gain) loss (7,521) 3,972 5,043 Restructuring charges (96) 8,307 1,613 Research and development grant reimbursement (4,087) — — Legal expenses/fines related to antitrust class actions 1,248 1,095 1,141 Stock-based compensation expense 4,060 2,820 1,101 (Gain) loss on early extinguishment of debt — — 486 Amortization included in interest expense 229 647 460 Income tax effect of non-U.S. GAAP adjustments (2) 451 156 (222) (Gain) loss on write down and disposal of long-lived assets 511 (70) 19 ERP integration/IT transition costs 1,650 80 — Plant start-up costs 753 929 — Adjusted net income (loss) (non-GAAP) (1) $ 32,487 $ 26,206 $ 19,075 Adjusted net income (loss) per share - basic $ 0.57 $ 0.46 $ 0.40 Adjusted net income (loss) per share - diluted $ 0.55 $ 0.44 $ 0.33 Adjusted EBITDA (non-GAAP) (1) $ 56,161 $ 48,543 $ 43,330 Weighted avg. shares - basic 57,339 57,025 47,381 Weighted avg. shares - diluted 59,038 59,063 57,731 (1) Quarters ended March 31, 2018 and June 30, 2017 adjusted due to the adoption of ASC 606. (2) The income tax effect of the excluded items is calculated by applying the applicable jurisdictional income tax rate, considering the deferred tax valuation for each applicable jurisdiction. 34
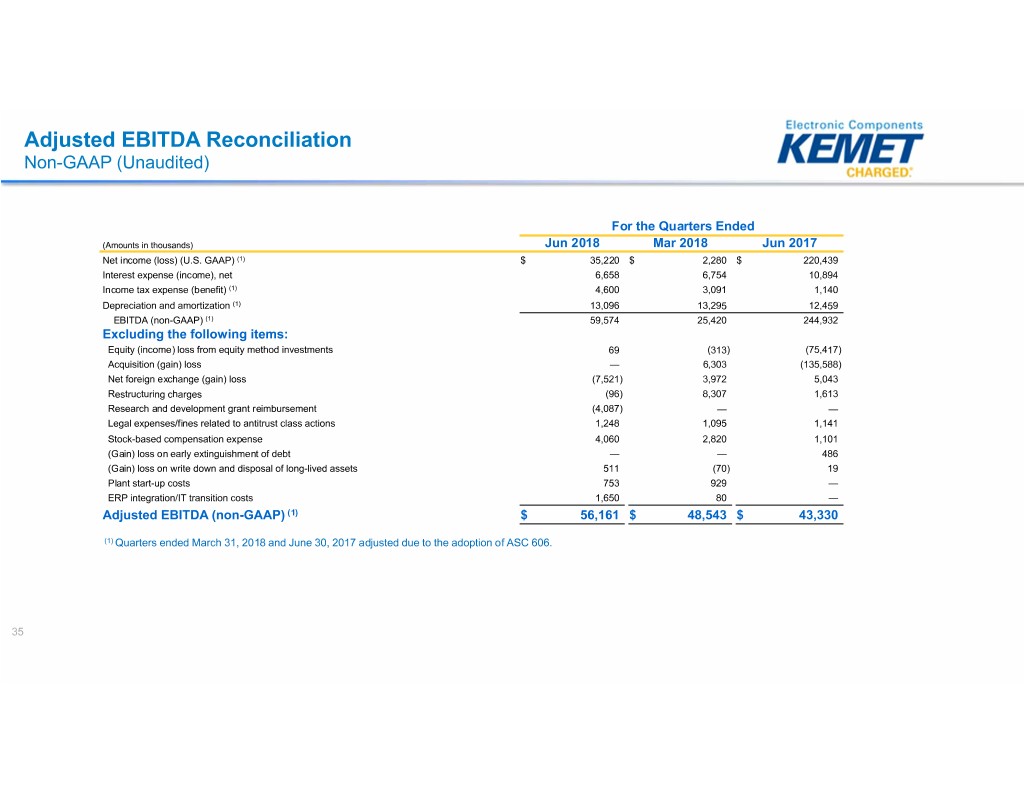
Adjusted EBITDA Reconciliation Non-GAAP (Unaudited) For the Quarters Ended (Amounts in thousands) Jun 2018 Mar 2018 Jun 2017 Net income (loss) (U.S. GAAP) (1) $ 35,220 $ 2,280 $ 220,439 Interest expense (income), net 6,658 6,754 10,894 Income tax expense (benefit) (1) 4,600 3,091 1,140 Depreciation and amortization (1) 13,096 13,295 12,459 EBITDA (non-GAAP) (1) 59,574 25,420 244,932 Excluding the following items: Equity (income) loss from equity method investments 69 (313) (75,417) Acquisition (gain) loss — 6,303 (135,588) Net foreign exchange (gain) loss (7,521) 3,972 5,043 Restructuring charges (96) 8,307 1,613 Research and development grant reimbursement (4,087) — — Legal expenses/fines related to antitrust class actions 1,248 1,095 1,141 Stock-based compensation expense 4,060 2,820 1,101 (Gain) loss on early extinguishment of debt — — 486 (Gain) loss on write down and disposal of long-lived assets 511 (70) 19 Plant start-up costs 753 929 — ERP integration/IT transition costs 1,650 80 — Adjusted EBITDA (non-GAAP) (1) $ 56,161 $ 48,543 $ 43,330 (1) Quarters ended March 31, 2018 and June 30, 2017 adjusted due to the adoption of ASC 606. 35
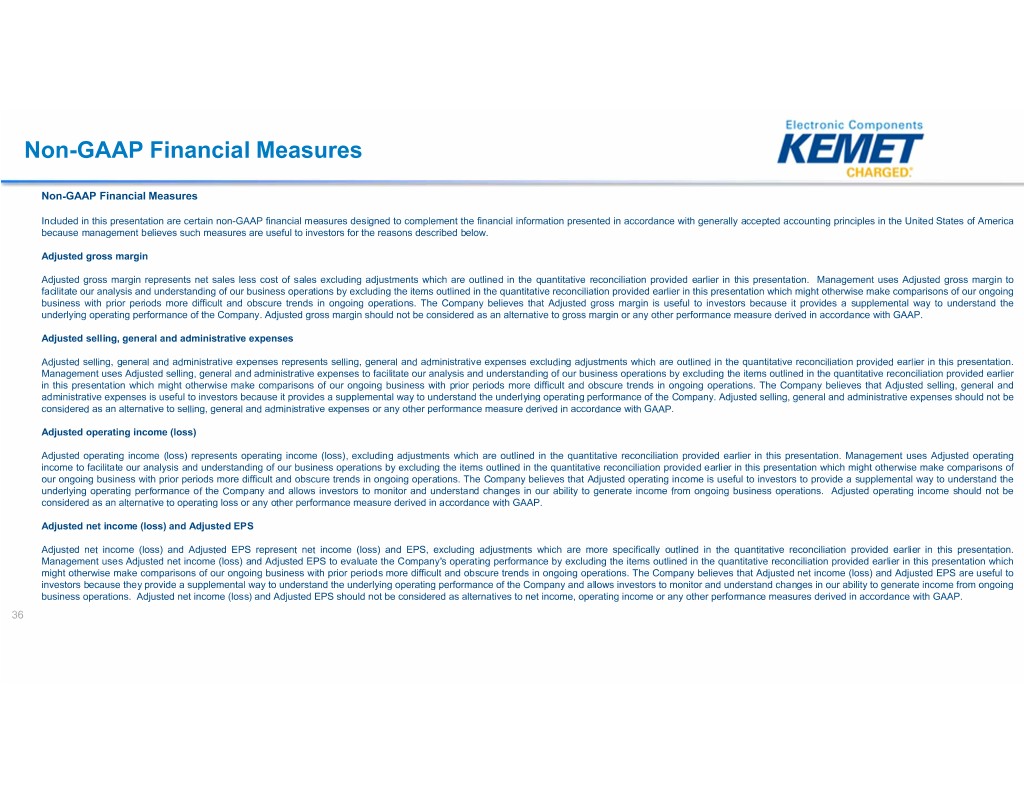
Non-GAAP Financial Measures Non-GAAP Financial Measures Included in this presentation are certain non-GAAP financial measures designed to complement the financial information presented in accordance with generally accepted accounting principles in the United States of America because management believes such measures are useful to investors for the reasons described below. Adjusted gross margin Adjusted gross margin represents net sales less cost of sales excluding adjustments which are outlined in the quantitative reconciliation provided earlier in this presentation. Management uses Adjusted gross margin to facilitate our analysis and understanding of our business operations by excluding the items outlined in the quantitative reconciliation provided earlier in this presentation which might otherwise make comparisons of our ongoing business with prior periods more difficult and obscure trends in ongoing operations. The Company believes that Adjusted gross margin is useful to investors because it provides a supplemental way to understand the underlying operating performance of the Company. Adjusted gross margin should not be considered as an alternative to gross margin or any other performance measure derived in accordance with GAAP. Adjusted selling, general and administrative expenses Adjusted selling, general and administrative expenses represents selling, general and administrative expenses excluding adjustments which are outlined in the quantitative reconciliation provided earlier in this presentation. Management uses Adjusted selling, general and administrative expenses to facilitate our analysis and understanding of our business operations by excluding the items outlined in the quantitative reconciliation provided earlier in this presentation which might otherwise make comparisons of our ongoing business with prior periods more difficult and obscure trends in ongoing operations. The Company believes that Adjusted selling, general and administrative expenses is useful to investors because it provides a supplemental way to understand the underlying operating performance of the Company. Adjusted selling, general and administrative expenses should not be considered as an alternative to selling, general and administrative expenses or any other performance measure derived in accordance with GAAP. Adjusted operating income (loss) Adjusted operating income (loss) represents operating income (loss), excluding adjustments which are outlined in the quantitative reconciliation provided earlier in this presentation. Management uses Adjusted operating income to facilitate our analysis and understanding of our business operations by excluding the items outlined in the quantitative reconciliation provided earlier in this presentation which might otherwise make comparisons of our ongoing business with prior periods more difficult and obscure trends in ongoing operations. The Company believes that Adjusted operating income is useful to investors to provide a supplemental way to understand the underlying operating performance of the Company and allows investors to monitor and understand changes in our ability to generate income from ongoing business operations. Adjusted operating income should not be considered as an alternative to operating loss or any other performance measure derived in accordance with GAAP. Adjusted net income (loss) and Adjusted EPS Adjusted net income (loss) and Adjusted EPS represent net income (loss) and EPS, excluding adjustments which are more specifically outlined in the quantitative reconciliation provided earlier in this presentation. Management uses Adjusted net income (loss) and Adjusted EPS to evaluate the Company's operating performance by excluding the items outlined in the quantitative reconciliation provided earlier in this presentation which might otherwise make comparisons of our ongoing business with prior periods more difficult and obscure trends in ongoing operations. The Company believes that Adjusted net income (loss) and Adjusted EPS are useful to investors because they provide a supplemental way to understand the underlying operating performance of the Company and allows investors to monitor and understand changes in our ability to generate income from ongoing business operations. Adjusted net income (loss) and Adjusted EPS should not be considered as alternatives to net income, operating income or any other performance measures derived in accordance with GAAP. 36
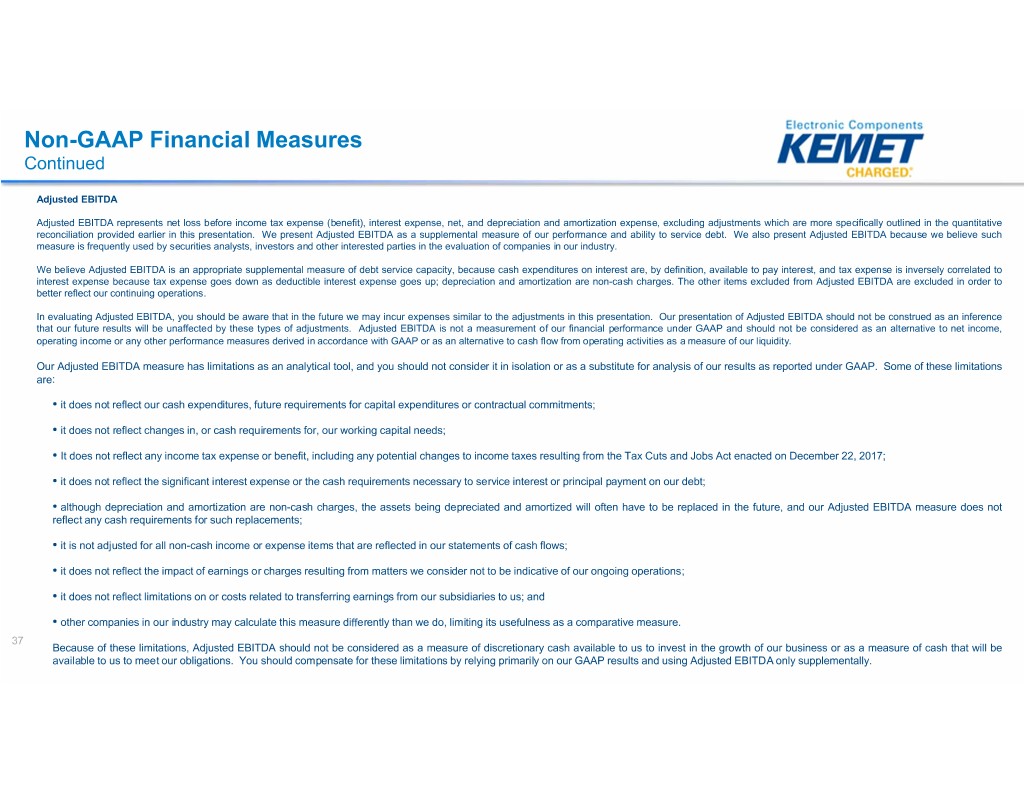
Non-GAAP Financial Measures Continued Adjusted EBITDA Adjusted EBITDA represents net loss before income tax expense (benefit), interest expense, net, and depreciation and amortization expense, excluding adjustments which are more specifically outlined in the quantitative reconciliation provided earlier in this presentation. We present Adjusted EBITDA as a supplemental measure of our performance and ability to service debt. We also present Adjusted EBITDA because we believe such measure is frequently used by securities analysts, investors and other interested parties in the evaluation of companies in our industry. We believe Adjusted EBITDA is an appropriate supplemental measure of debt service capacity, because cash expenditures on interest are, by definition, available to pay interest, and tax expense is inversely correlated to interest expense because tax expense goes down as deductible interest expense goes up; depreciation and amortization are non-cash charges. The other items excluded from Adjusted EBITDA are excluded in order to better reflect our continuing operations. In evaluating Adjusted EBITDA, you should be aware that in the future we may incur expenses similar to the adjustments in this presentation. Our presentation of Adjusted EBITDA should not be construed as an inference that our future results will be unaffected by these types of adjustments. Adjusted EBITDA is not a measurement of our financial performance under GAAP and should not be considered as an alternative to net income, operating income or any other performance measures derived in accordance with GAAP or as an alternative to cash flow from operating activities as a measure of our liquidity. Our Adjusted EBITDA measure has limitations as an analytical tool, and you should not consider it in isolation or as a substitute for analysis of our results as reported under GAAP. Some of these limitations are: • it does not reflect our cash expenditures, future requirements for capital expenditures or contractual commitments; • it does not reflect changes in, or cash requirements for, our working capital needs; • It does not reflect any income tax expense or benefit, including any potential changes to income taxes resulting from the Tax Cuts and Jobs Act enacted on December 22, 2017; • it does not reflect the significant interest expense or the cash requirements necessary to service interest or principal payment on our debt; • although depreciation and amortization are non-cash charges, the assets being depreciated and amortized will often have to be replaced in the future, and our Adjusted EBITDA measure does not reflect any cash requirements for such replacements; • it is not adjusted for all non-cash income or expense items that are reflected in our statements of cash flows; • it does not reflect the impact of earnings or charges resulting from matters we consider not to be indicative of our ongoing operations; • it does not reflect limitations on or costs related to transferring earnings from our subsidiaries to us; and • other companies in our industry may calculate this measure differently than we do, limiting its usefulness as a comparative measure. 37 Because of these limitations, Adjusted EBITDA should not be considered as a measure of discretionary cash available to us to invest in the growth of our business or as a measure of cash that will be available to us to meet our obligations. You should compensate for these limitations by relying primarily on our GAAP results and using Adjusted EBITDA only supplementally.
