Attached files
| file | filename |
|---|---|
| EX-99.1 - RELEASE, DATED SEPTEMBER 6, 2018 - Genie Energy Ltd. | f8k090518ex99-1_genie.htm |
| 8-K - CURRENT REPORT - Genie Energy Ltd. | f8k090518_genieenergy.htm |
Exhibit 99.2

Genie Energy Ltd (NYSE: GNE) Investor Presentation September 2018
2 2 Safe Harbor Statement This presentation contains forward - looking statements. Statements that are not historical facts are forward - looking statements and such forward - looking statements are statements made pursuant to the Safe Harbor Provisions of the Private Securities Litigation Reform Act of 1995. Examples of forward - looking statements include: • statements about Genie’s and its divisions’ future performance; • projections of Genie’s and its divisions’ results of operations or financial condition; • statements regarding Genie’s plans, objectives or goals, including those relating to its strategies, initiatives, competition, acquisitions, dispositions and/or its products; and • expectations concerning the permitting, timing and development of exploration projects. Words such as "believe," "anticipate," "plan," "expect," "intend," "target," "estimate," "project," "predict," "forecast," "g uid eline," "aim," "will," "should," “likely,” "continue" and similar expressions are intended to identify forward - looking statements but ar e not the exclusive means of identifying such statements. Readers are cautioned not to place undue reliance on these forward - looking statements and all such forward - looking statements are qualified in their entirety by reference to the following cautionary statements. Forward - looking statements are based on Genie’s current expectations, estimates and assumptions and because forward - looking statements address future results, events and conditions, they, by their very nature, involve inherent risks and uncertainties, many of which are unforeseeable and beyond the Genie’s control. Such known and unknown risks, uncertainties and other factors may cause Genie’s actual results, performance or other achievements to differ materially from the anticipat ed results, performance or achievements expressed, projected or implied by these forward - looking statements. These factors include those discussed under the headings "Risk Factors" and “Management’s Discussion and Analysis of Financial Condition and Results of Operations in Genie’s periodic filings made with the Securities and Exchange Commission. Genie cautions that such factors are not exhaustive and that other risks and uncertainties may cause actual results to differ materially from those in forward - looking statements. Forward - looking statements speak only as of the date they are made and are statements of Genie’s current expectations concerning future results, events and conditions and Genie is under no obligation to update any of the forward - looking statements, whether as a result of new information, future events or otherwise. 2
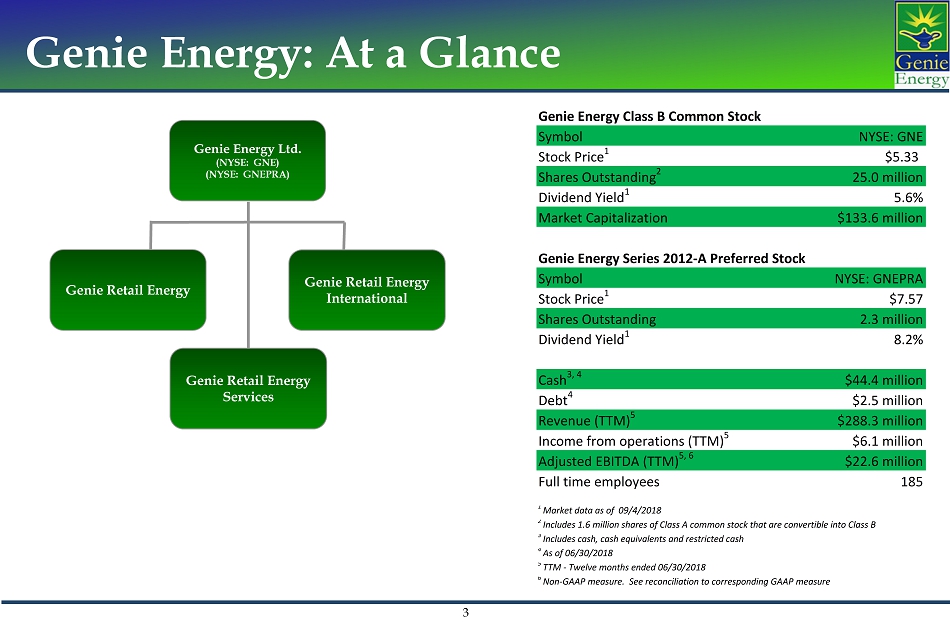
3 3 Genie Energy: At a Glance 3 Genie Retail Energy Services Genie Energy Ltd. (NYSE: GNE) (NYSE: GNEPRA) Genie Retail Energy Genie Retail Energy International Genie Energy Class B Common Stock Symbol NYSE: GNE Stock Price 1 $5.33 Shares Outstanding 2 25.0 million Dividend Yield 1 5.6% Market Capitalization $133.6 million Genie Energy Series 2012-A Preferred Stock Symbol NYSE: GNEPRA Stock Price 1 $7.57 Shares Outstanding 2.3 million Dividend Yield 1 8.2% Cash 3, 4 $44.4 million Debt 4 $2.5 million Revenue (TTM) 5 $288.3 million Income from operations (TTM) 5 $6.1 million Adjusted EBITDA (TTM) 5, 6 $22.6 million Full time employees 185 1 Market data as of 09/4/2018 2 Includes 1.6 million shares of Class A common stock that are convertible into Class B 3 Includes cash, cash equivalents and restricted cash 4 As of 06/30/2018 5 TTM - Twelve months ended 06/30/2018 6 Non-GAAP measure. See reconciliation to corresponding GAAP measure
4 4 Investment Thesis 4 • Strategic Transition: Genie Energy has successfully restructured its operations to focus on growth within the Retail Energy business • Legacy O&G technology operations have been sold or reduced, final test in permitting stage • Strong growth in core business: Genie Retail Energy is expanding domestic and international operations • Domestic: Organic net meter adds, geographic expansion and strategic acquisitions • International : JV launched in Great Britain, acquired license in Japan • Services: Growing energy brokerage and expanding solar offerings • Attractive dividend: Yield on Genie common and preferred stock supported by strong cash flows and balance sheet
5 Genie Retail Energy controls a leading portfolio of retail energy providers (REP) • Entered the REP industry in 2004, now among the largest independent residential REPs • Operations in deregulated markets across 13 U.S. states and the district of Columbia • History of strong financial performance Value proposition • Customers: Power of choice, value added services and potential savings • Utilities: Removes load - based risk while generating fees from services Managed - risk model • Many utilities offer purchase of receivables programs – reducing credit risk • Asset – light business model minimizes capital - at - risk • Geographic diversity mitigates regulatory and weather related risks Genie Retail Energy - Overview
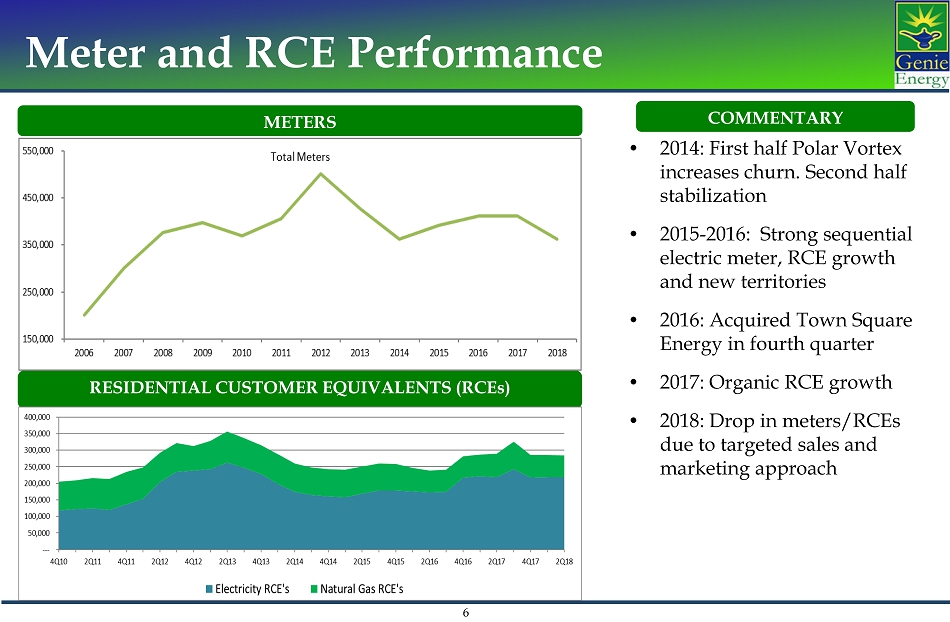
6 6 Meter and RCE Performance METERS RESIDENTIAL CUSTOMER EQUIVALENTS (RCEs) COMMENTARY • 2014: First half Polar Vortex increases churn. Second half stabilization • 2015 - 2016: Strong sequential electric meter, RCE growth and new territories • 2016: Acquired Town Square Energy in fourth quarter • 2017: Organic RCE growth • 2018: Drop in meters/RCEs due to targeted sales and marketing approach 6
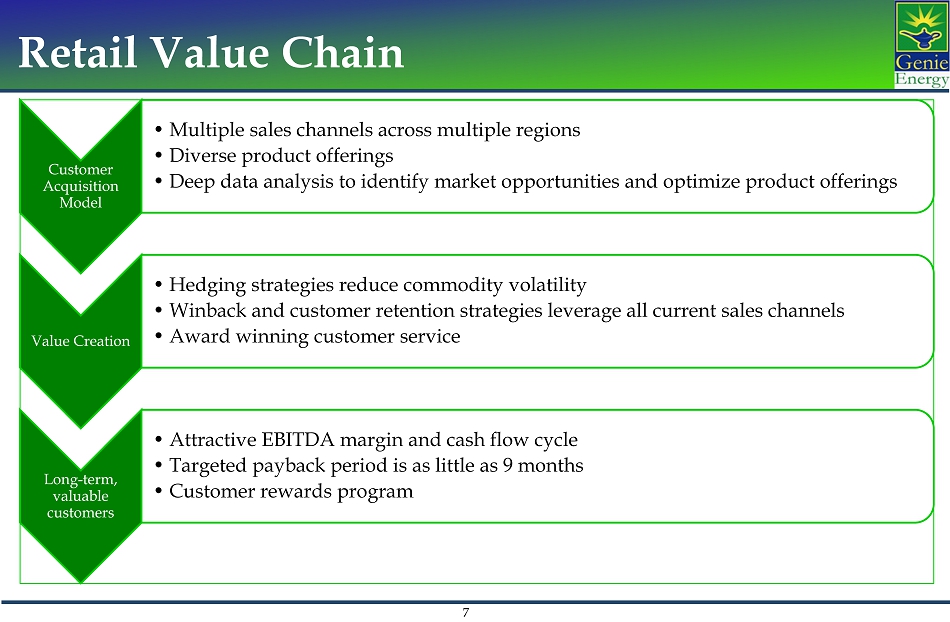
7 Customer Acquisition Model • Multiple sales channels across multiple regions • Diverse product offerings • Deep data analysis to identify market opportunities and optimize product offerings Value Creation • Hedging strategies reduce commodity volatility • Winback and customer retention strategies leverage all current sales channels • Award winning customer service Long - term, valuable customers • Attractive EBITDA margin and cash flow cycle • Targeted payback period is as little as 9 months • Customer rewards program Retail Value Chain
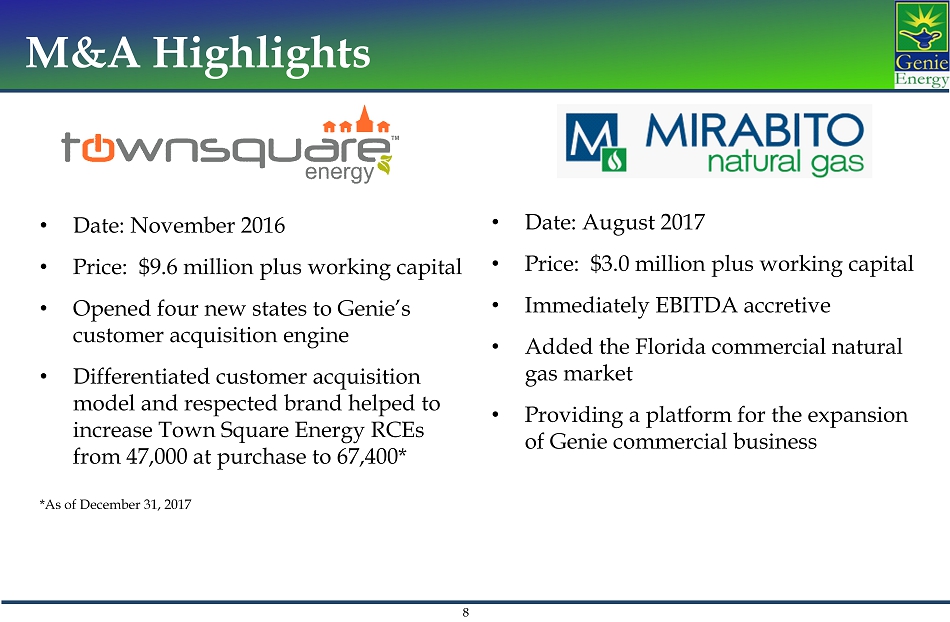
8 8 M&A Highlights 8 • Date: November 2016 • Price: $9.6 million plus working capital • Opened four new states to Genie’s customer acquisition engine • Differentiated customer acquisition model and respected brand helped to increase Town Square Energy RCEs from 47,000 at purchase to 67,400* *As of December 31, 2017 • Date: August 2017 • Price: $3.0 million plus working capital • Immediately EBITDA accretive • Added the Florida commercial natural gas market • Providing a platform for the expansion of Genie commercial business
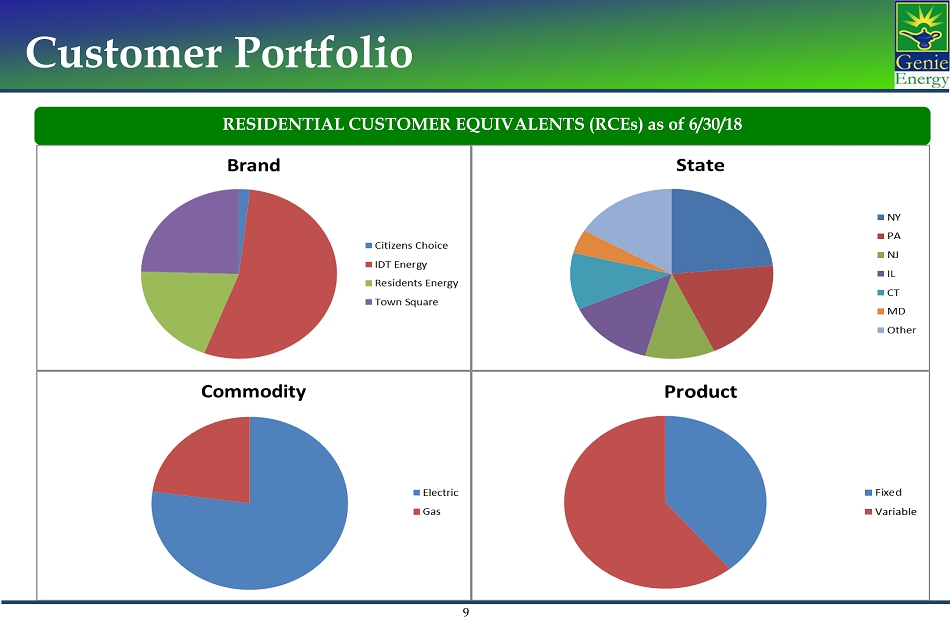
9 9 Customer Portfolio RESIDENTIAL CUSTOMER EQUIVALENTS (RCEs) as of 6/30/18 9

10 10 Genie Retail Energy Markets 10
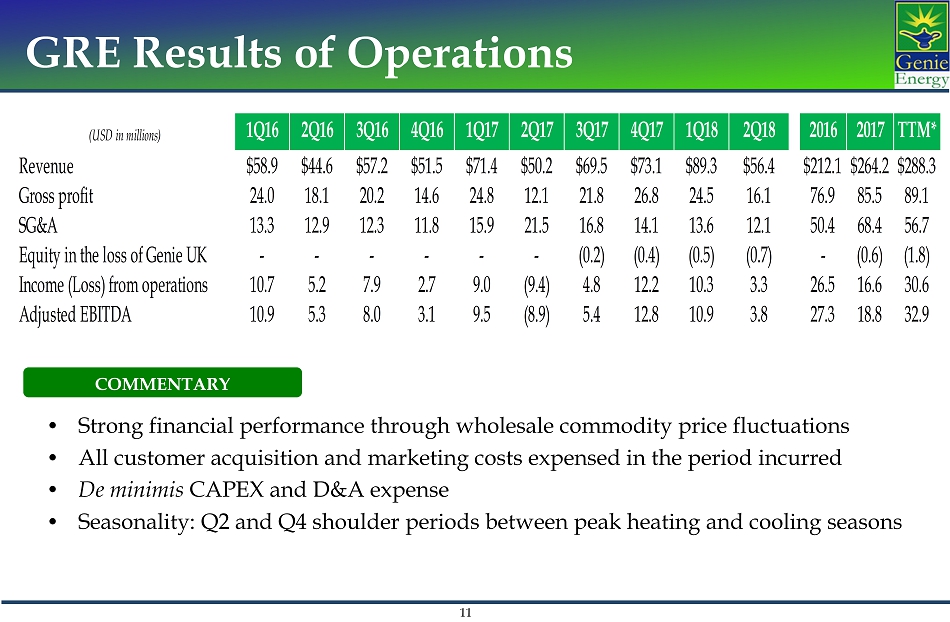
11 11 GRE Results of Operations 11 COMMENTARY • Strong financial performance through wholesale commodity price fluctuations • All customer acquisition and marketing costs expensed in the period incurred • De minimis CAPEX and D&A expense • Seasonality: Q2 and Q4 shoulder periods between peak heating and cooling seasons (USD in millions) 1Q16 2Q16 3Q16 4Q16 1Q17 2Q17 3Q17 4Q17 1Q18 2Q18 2016 2017 TTM* Revenue $58.9 $44.6 $57.2 $51.5 $71.4 $50.2 $69.5 $73.1 $89.3 $56.4 $212.1 $264.2 $288.3 Gross profit 24.0 18.1 20.2 14.6 24.8 12.1 21.8 26.8 24.5 16.1 76.9 85.5 89.1 SG&A 13.3 12.9 12.3 11.8 15.9 21.5 16.8 14.1 13.6 12.1 50.4 68.4 56.7 Equity in the loss of Genie UK - - - - - - (0.2) (0.4) (0.5) (0.7) - (0.6) (1.8) Income (Loss) from operations 10.7 5.2 7.9 2.7 9.0 (9.4) 4.8 12.2 10.3 3.3 26.5 16.6 30.6 Adjusted EBITDA 10.9 5.3 8.0 3.1 9.5 (8.9) 5.4 12.8 10.9 3.8 27.3 18.8 32.9
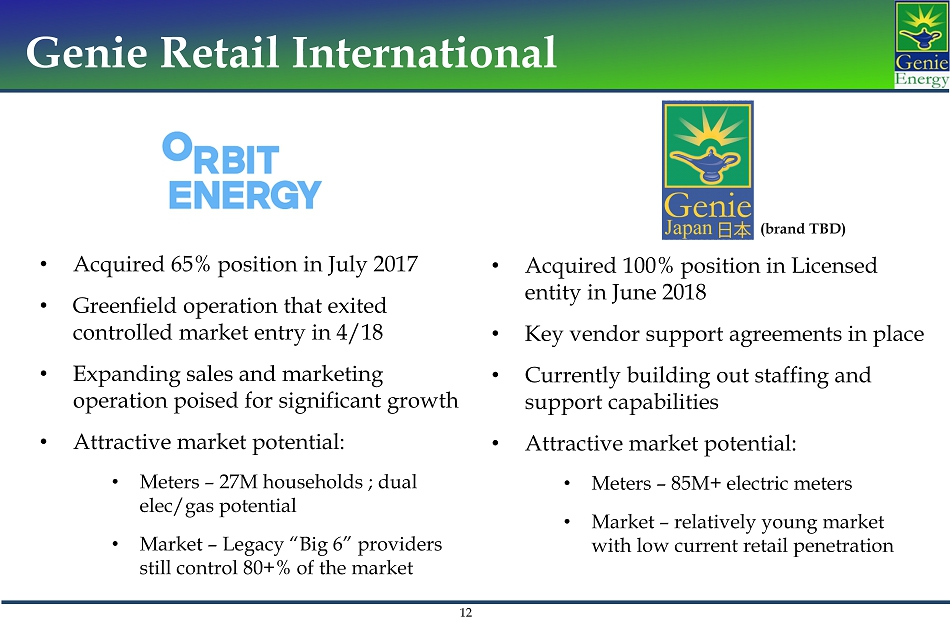
12 12 Genie Retail International 12 • Acquired 65% position in July 2017 • Greenfield operation that exited controlled market entry in 4/18 • Expanding sales and marketing operation poised for significant growth • Attractive market potential: • Meters – 27M households ; dual elec/gas potential • Market – Legacy “Big 6” providers still control 80+% of the market • Acquired 100% position in Licensed entity in June 2018 • Key vendor support agreements in place • Currently building out staffing and support capabilities • Attractive market potential: • Meters – 85M+ electric meters • Market – relatively young market with low current retail penetration (brand TBD)

13 13 Genie Retail Energy Services GRES markets a full suite of energy solutions to business customers with an expanding portfolio of products: • Diversegy – Energy brokerage, efficiency consulting and LED installation • Genie Solar Energy - End to end solar solutions from initial project design though installation • Prism Solar Technologies - designs and manufactures solar systems in the United States featuring its innovative bifacial solar modules GRES products represent an incremental revenue opportunity to REP model and allow for a deepening of the customer relationship 13
14 14 Why Own Genie Energy? Special Situation Investors: • Successful transition to a pure - play retail energy provider model while curtailing oil and gas (O&G) exploration program • Reduced O&G exploration expense will positively impact Adjusted EBITDA and cash flows in 2018 • Well - established public company comps facilitate valuation in retail energy space Dividend Investors: • Attractive dividend yield supported by strong retail energy cash flows and liquid balance sheet Growth Investors: • Proven retail energy model with strong growth prospects • Expanding international presence with a ventures in Great Britain and Japan • Capacity to finance continued expansion from working capital 14
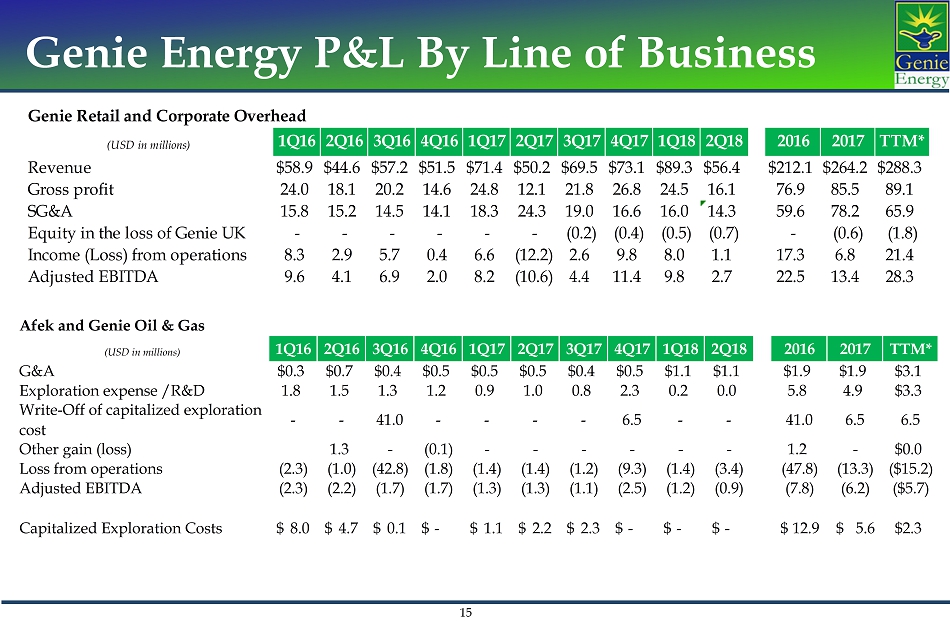
15 15 Genie Energy P&L By Line of Business 15 Genie Retail and Corporate Overhead (USD in millions) 1Q16 2Q16 3Q16 4Q16 1Q17 2Q17 3Q17 4Q17 1Q18 2Q18 2016 2017 TTM* Revenue $58.9 $44.6 $57.2 $51.5 $71.4 $50.2 $69.5 $73.1 $89.3 $56.4 $212.1 $264.2 $288.3 Gross profit 24.0 18.1 20.2 14.6 24.8 12.1 21.8 26.8 24.5 16.1 76.9 85.5 89.1 SG&A 15.8 15.2 14.5 14.1 18.3 24.3 19.0 16.6 16.0 14.3 59.6 78.2 65.9 Equity in the loss of Genie UK - - - - - - (0.2) (0.4) (0.5) (0.7) - (0.6) (1.8) Income (Loss) from operations 8.3 2.9 5.7 0.4 6.6 (12.2) 2.6 9.8 8.0 1.1 17.3 6.8 21.4 Adjusted EBITDA 9.6 4.1 6.9 2.0 8.2 (10.6) 4.4 11.4 9.8 2.7 22.5 13.4 28.3 Afek and Genie Oil & Gas (USD in millions) 1Q16 2Q16 3Q16 4Q16 1Q17 2Q17 3Q17 4Q17 1Q18 2Q18 2016 2017 TTM* G&A $0.3 $0.7 $0.4 $0.5 $0.5 $0.5 $0.4 $0.5 $1.1 $1.1 $1.9 $1.9 $3.1 Exploration expense /R&D 1.8 1.5 1.3 1.2 0.9 1.0 0.8 2.3 0.2 0.0 5.8 4.9 $3.3 Write-Off of capitalized exploration cost - - 41.0 - - - - 6.5 - - 41.0 6.5 6.5 Other gain (loss) 1.3 - (0.1) - - - - - - 1.2 - $0.0 Loss from operations (2.3) (1.0) (42.8) (1.8) (1.4) (1.4) (1.2) (9.3) (1.4) (3.4) (47.8) (13.3) ($15.2) Adjusted EBITDA (2.3) (2.2) (1.7) (1.7) (1.3) (1.3) (1.1) (2.5) (1.2) (0.9) (7.8) (6.2) ($5.7) Capitalized Exploration Costs 8.0$ 4.7$ 0.1$ -$ 1.1$ 2.2$ 2.3$ -$ -$ -$ 12.9$ 5.6$ $2.3
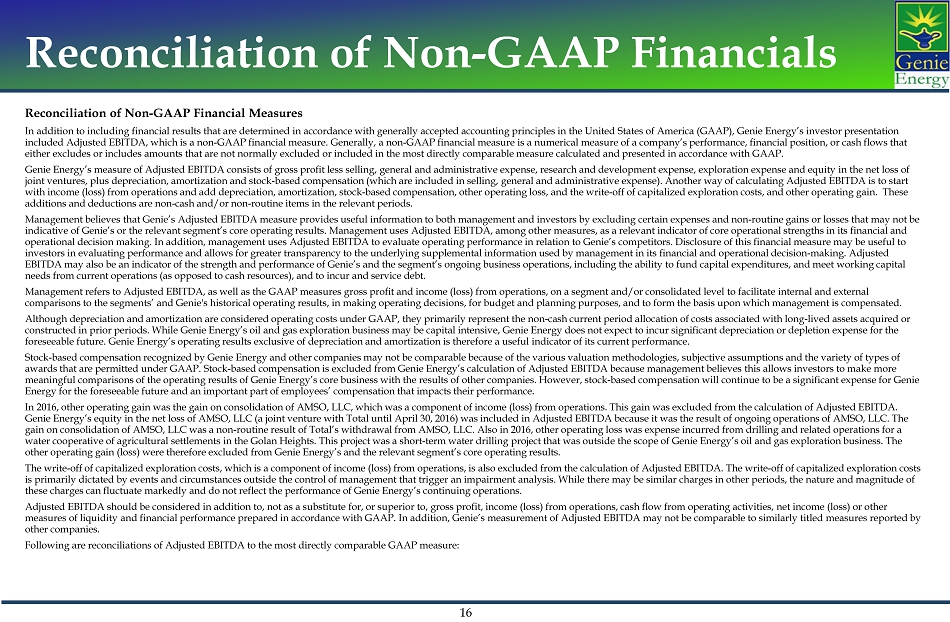
Reconciliation of Non - GAAP Financials Reconciliation of Non - GAAP Financial Measures In addition to including financial results that are determined in accordance with generally accepted accounting principles in th e United States of America (GAAP), Genie Energy’ s investor presentation included Adjusted EBITDA, which is a non - GAAP financial measure. Generally, a non - GAAP financial measure is a numerical measure of a company ’ s performance, financial position, or cash flows that either excludes or includes amounts that are not normally excluded or included in the most directly comparable measure calcul ate d and presented in accordance with GAAP. Genie Energy’s measure of Adjusted EBITDA consists of gross profit less selling, general and administrative expense, research an d development expense, exploration expense and equity in the net loss of joint ventures, plus depreciation, amortization and stock - based compensation (which are included in selling, general and adminis trative expense). Another way of calculating Adjusted EBITDA is to start with income (loss) from operations and add depreciation, amortization, stock - based compensation, other operating loss, and the w rite - off of capitalized exploration costs, and other operating gain. These additions and deductions are non - cash and/or non - routine items in the relevant periods. Management believes that Genie’ s Adjusted EBITDA measure provides useful information to both management and investors by excluding certain expenses and non - rou tine gains or losses that may not be indicative of Genie ’ s or the relevant segment ’ s core operating results. Management uses Adjusted EBITDA, among other measures, as a relevant indicator of core operational str engths in its financial and operational decision making. In addition, management uses Adjusted EBITDA to evaluate operating performance in relation to Ge nie ’ s competitors. Disclosure of this financial measure may be useful to investors in evaluating performance and allows for greater transparency to the underlying supplemental information used by ma nag ement in its financial and operational decision - making. Adjusted EBITDA may also be an indicator of the strength and performance of Genie ’ s and the segment ’ s ongoing business operations, including the ability to fund capital expenditures, and meet working capital needs from current operations (as opposed to cash resources), and to incur and service debt. Management refers to Adjusted EBITDA, as well as the GAAP measures gross profit and income (loss) from operations, on a segme nt and/or consolidated level to facilitate internal and external comparisons to the segments’ and Genie's historical operating results, in making operating decisions, for budget and planning purposes, and to form the ba si s upon which management is compensated. Although depreciation and amortization are considered operating costs under GAAP, they primarily represent the non - cash current period allocation of costs associated with long - lived assets acquired or constructed in prior periods. While Genie Energy’s oil and gas exploration business may be capital intensive, Genie Energy do es not expect to incur significant depreciation or depletion expense for the foreseeable future. Genie Energy’s operating results exclusive of depreciation and amortization is therefore a useful indicat or of its current performance. Stock - based compensation recognized by Genie Energy and other companies may not be comparable because of the various valuation m ethodologies, subjective assumptions and the variety of types of awards that are permitted under GAAP. Stock - based compensation is excluded from Genie Energy’s calculation of Adjusted EBITDA be cause management believes this allows investors to make more meaningful comparisons of the operating results of Genie Energy’s core business with the results of other companies. However, st ock - based compensation will continue to be a significant expense for Genie Energy for the foreseeable future and an important part of employees’ compensation that impacts their performance. In 2016, other operating gain was the gain on consolidation of AMSO, LLC, which was a component of income (loss) from operati ons . This gain was excluded from the calculation of Adjusted EBITDA. Genie Energy’s equity in the net loss of AMSO, LLC (a joint venture with Total until April 30, 2016) was included in Adjusted EB ITDA because it was the result of ongoing operations of AMSO, LLC. The gain on consolidation of AMSO, LLC was a non - routine result of Total’s withdrawal from AMSO, LLC. Also in 2016, other operating loss was expense incurred from drilling and related operations for a water cooperative of agricultural settlements in the Golan Heights. This project was a short - term water drilling project that wa s outside the scope of Genie Energy’s oil and gas exploration business. The other operating gain (loss) were therefore excluded from Genie Energy’s and the relevant segment’s core operating results. The write - off of capitalized exploration costs, which is a component of income (loss) from operations, is also excluded from the calculation of Adjusted EBITDA. The write - off of capitalized exploration costs is primarily dictated by events and circumstances outside the control of management that trigger an impairment analysis. Whil e t here may be similar charges in other periods, the nature and magnitude of these charges can fluctuate markedly and do not reflect the performance of Genie Energy’s continuing operations. Adjusted EBITDA should be considered in addition to, not as a substitute for, or superior to, gross profit, income (loss) fro m o perations, cash flow from operating activities, net income (loss) or other measures of liquidity and financial performance prepared in accordance with GAAP. In addition, Genie’ s measurement of Adjusted EBITDA may not be comparable to similarly titled measures reported by other companies. Following are reconciliations of Adjusted EBITDA to the most directly comparable GAAP measure: 16
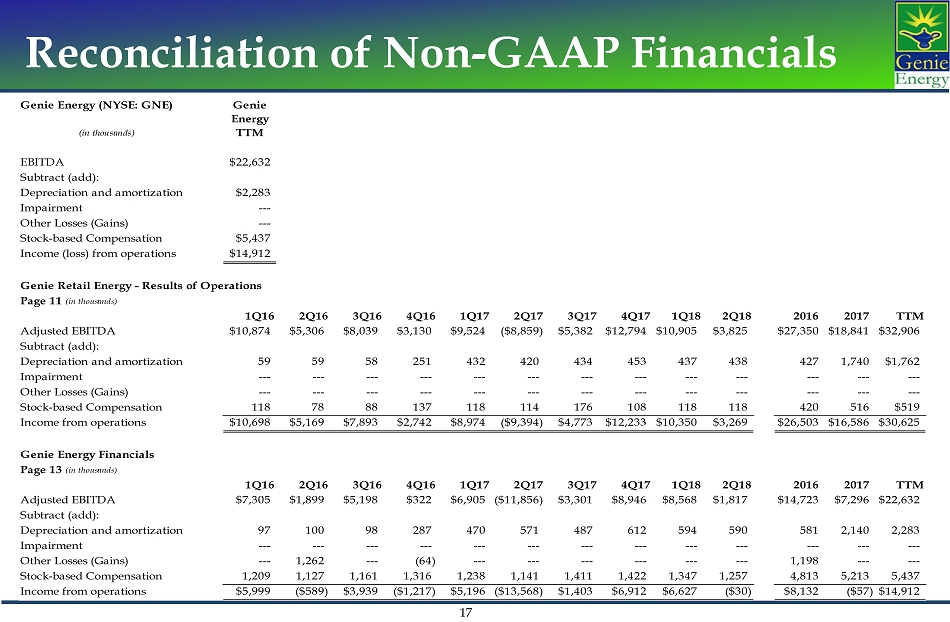
Reconciliation of Non - GAAP Financials 17 Genie Energy (NYSE: GNE) Genie Energy (in thousands) TTM EBITDA $22,632 Subtract (add): Depreciation and amortization $2,283 Impairment --- Other Losses (Gains) --- Stock-based Compensation $5,437 Income (loss) from operations $14,912 Genie Retail Energy - Results of Operations Page 11 (in thousands) 1Q16 2Q16 3Q16 4Q16 1Q17 2Q17 3Q17 4Q17 1Q18 2Q18 2016 2017 TTM Adjusted EBITDA $10,874 $5,306 $8,039 $3,130 $9,524 ($8,859) $5,382 $12,794 $10,905 $3,825 $27,350 $18,841 $32,906 Subtract (add): Depreciation and amortization 59 59 58 251 432 420 434 453 437 438 427 1,740 $1,762 Impairment --- --- --- --- --- --- --- --- --- --- --- --- --- Other Losses (Gains) --- --- --- --- --- --- --- --- --- --- --- --- --- Stock-based Compensation 118 78 88 137 118 114 176 108 118 118 420 516 $519 Income from operations $10,698 $5,169 $7,893 $2,742 $8,974 ($9,394) $4,773 $12,233 $10,350 $3,269 $26,503 $16,586 $30,625 Genie Energy Financials Page 13 (in thousands) 1Q16 2Q16 3Q16 4Q16 1Q17 2Q17 3Q17 4Q17 1Q18 2Q18 2016 2017 TTM Adjusted EBITDA $7,305 $1,899 $5,198 $322 $6,905 ($11,856) $3,301 $8,946 $8,568 $1,817 $14,723 $7,296 $22,632 Subtract (add): Depreciation and amortization 97 100 98 287 470 571 487 612 594 590 581 2,140 2,283 Impairment --- --- --- --- --- --- --- --- --- --- --- --- --- Other Losses (Gains) --- 1,262 --- (64) --- --- --- --- --- --- 1,198 --- --- Stock-based Compensation 1,209 1,127 1,161 1,316 1,238 1,141 1,411 1,422 1,347 1,257 4,813 5,213 5,437 Income from operations $5,999 ($589) $3,939 ($1,217) $5,196 ($13,568) $1,403 $6,912 $6,627 ($30) $8,132 ($57)$14,912
Michael Stein Chief Executive Officer Avi Goldin Chief Financial Officer