Attached files
| file | filename |
|---|---|
| 8-K - 8-K - Altabancorp | pub-8k_20180905.htm |

People’s Utah Bancorp Len Williams, President & CEO Mark Olson, EVP & CFO Investor Presentation September 5, 2018
Forward Looking Statements This presentation contains forward-looking statements within the meaning of the Private Securities Litigation Reform Act of 1995. These forward-looking statements are subject to risks and uncertainties, including, but not limited to: The credit and concentration risks of our lending activities; Changes in general economic conditions, either nationally or in our market areas; Competitive market pricing factors and interest rate risks; Market interest rate volatility; Investments in new branches and new business opportunities; Balance sheet (for example, loans) concentrations; Fluctuations in demand for loans and other financial services in our market areas; Changes in legislative or regulatory requirements or the results of regulatory examinations; The ability to recruit and retain key management and staff; Risks associated with our ability to implement our expansion strategy and merger integration; Stability of funding sources and continued availability of borrowings; Adverse changes in the securities markets; The inability of key third-party providers to perform their obligations to us; Changes in accounting policies and practices and the use of estimates in determining fair value of certain of our assets, which estimates may prove to be incorrect and result in significant declines in valuation; and These and other risks as may be detailed from time to time in our filings with the Securities and Exchange Commission. The Company cautions readers not to place undue reliance on any forward-looking statements. Moreover, you should treat these statements as speaking only as of the date they are made and based only on information then actually known to the Company. The Company does not undertake and specifically disclaims any obligation to revise any forward-looking statements to reflect the occurrence of anticipated or unanticipated events or circumstances after the date of such statements. These risks could cause our actual results in 2018 and beyond to differ materially from those expressed in any forward-looking statements by, or on behalf of, us, and could negatively affect the Company’s operating results, financial condition and stock price performance.
Company Overview Over 100+ years operating history Headquarters in Utah County Largest community bank in Utah Only public community bank in Utah 26 full service branch locations located throughout Utah and Southern Idaho Strong core deposit base with 36% noninterest bearing, and 35 bps cost of funds year to date 2018 Provide highly personalized service to small and medium sized businesses and individuals
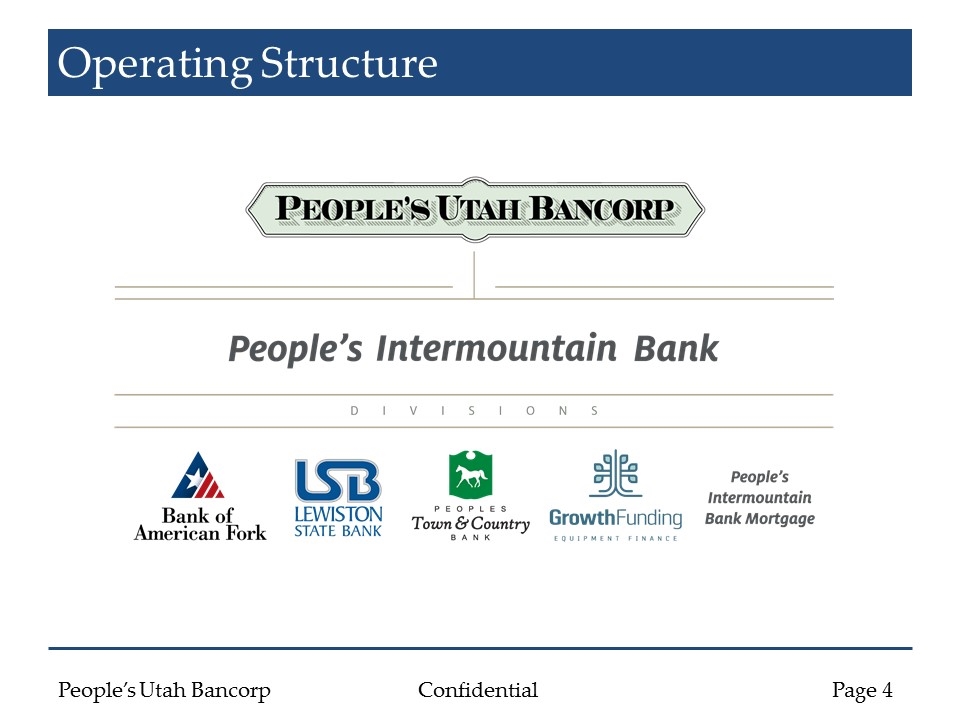
Operating Structure
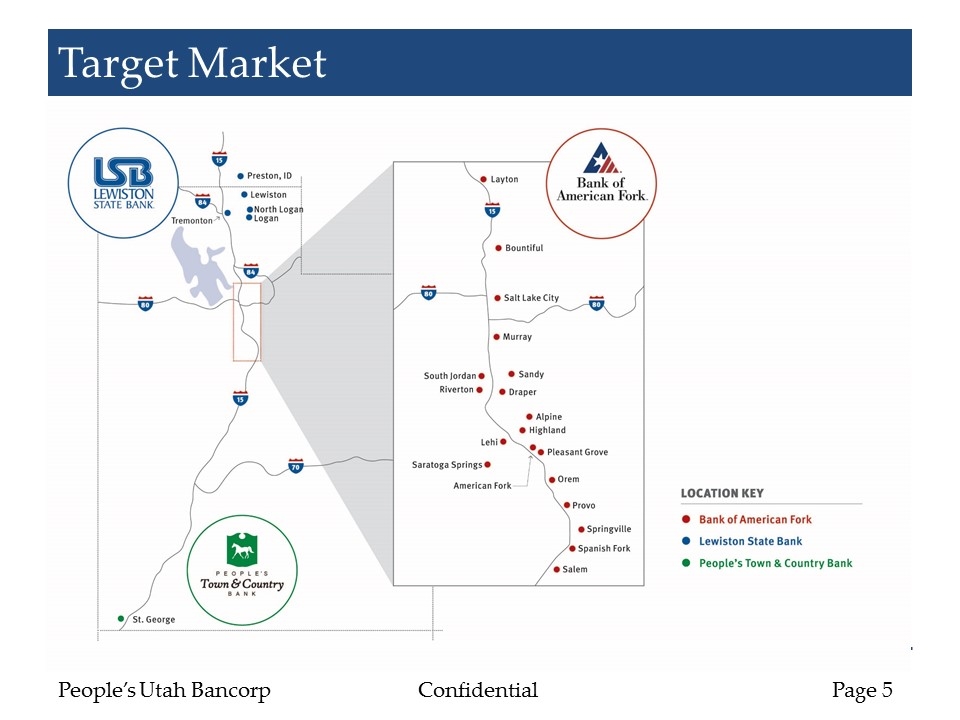
Target Market
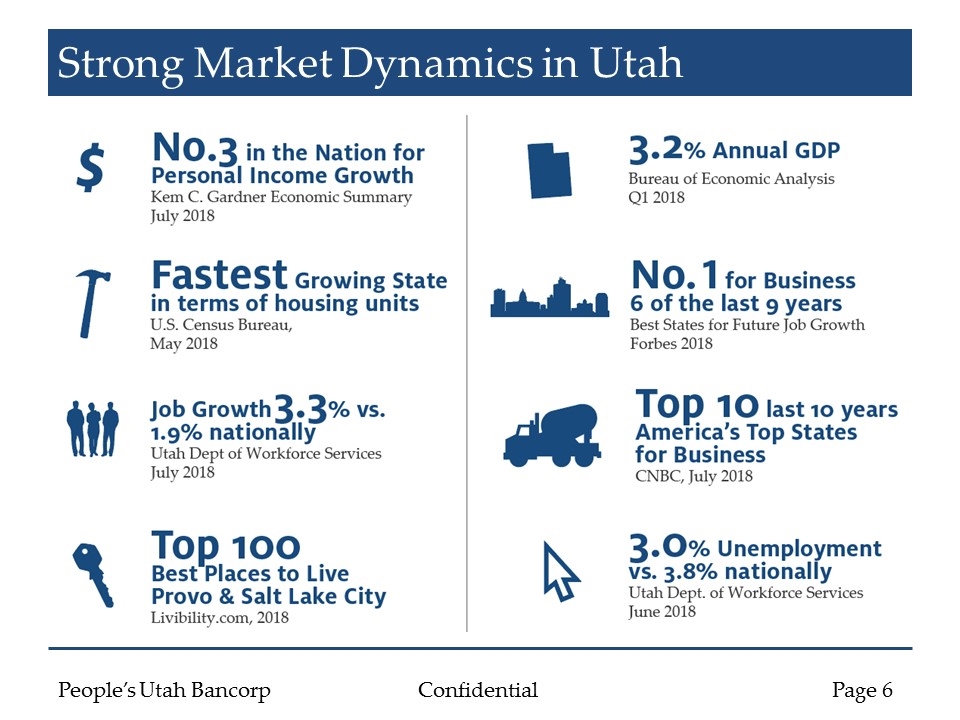
Strong Market Dynamics in Utah
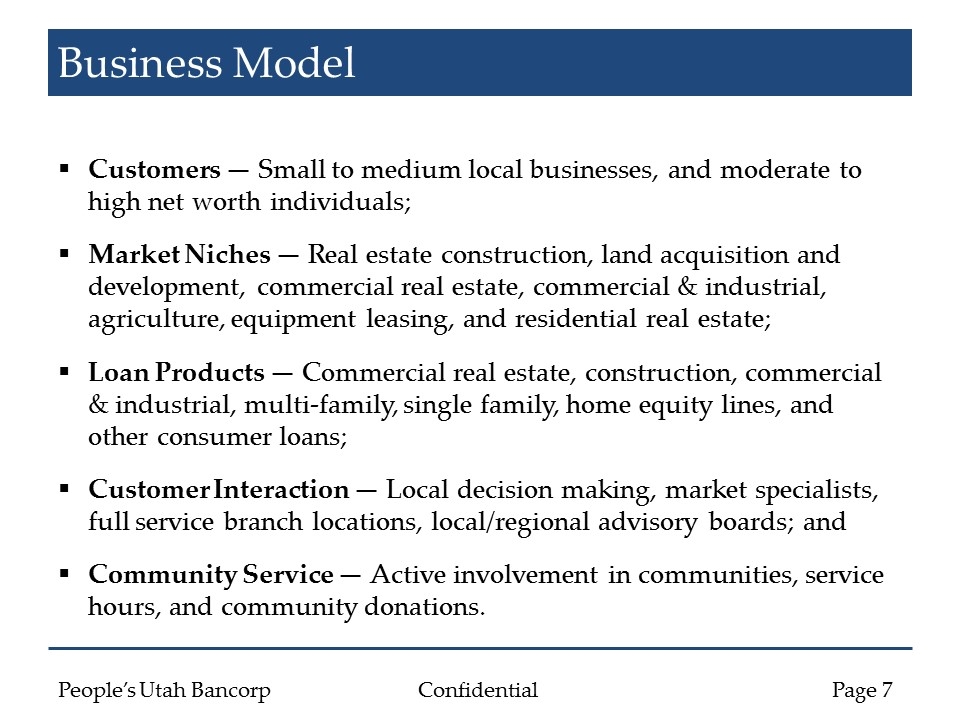
Business Model Customers — Small to medium local businesses, and moderate to high net worth individuals; Market Niches — Real estate construction, land acquisition and development, commercial real estate, commercial & industrial, agriculture, equipment leasing, and residential real estate; Loan Products — Commercial real estate, construction, commercial & industrial, multi-family, single family, home equity lines, and other consumer loans; Customer Interaction — Local decision making, market specialists, full service branch locations, local/regional advisory boards; and Community Service — Active involvement in communities, service hours, and community donations.
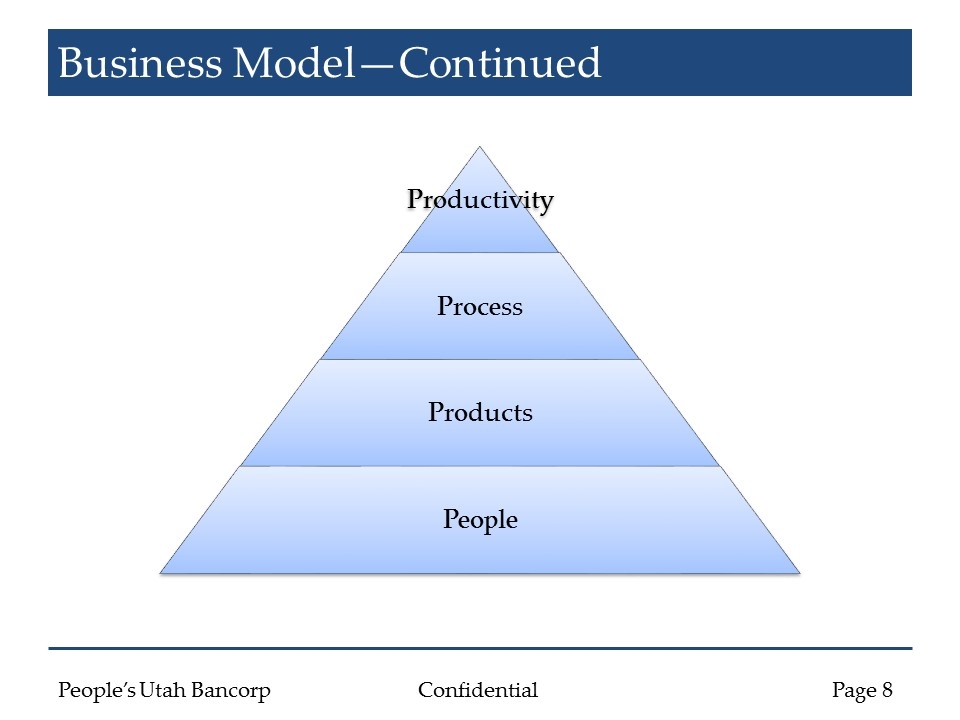
Business Model—Continued Productivity Process Products People
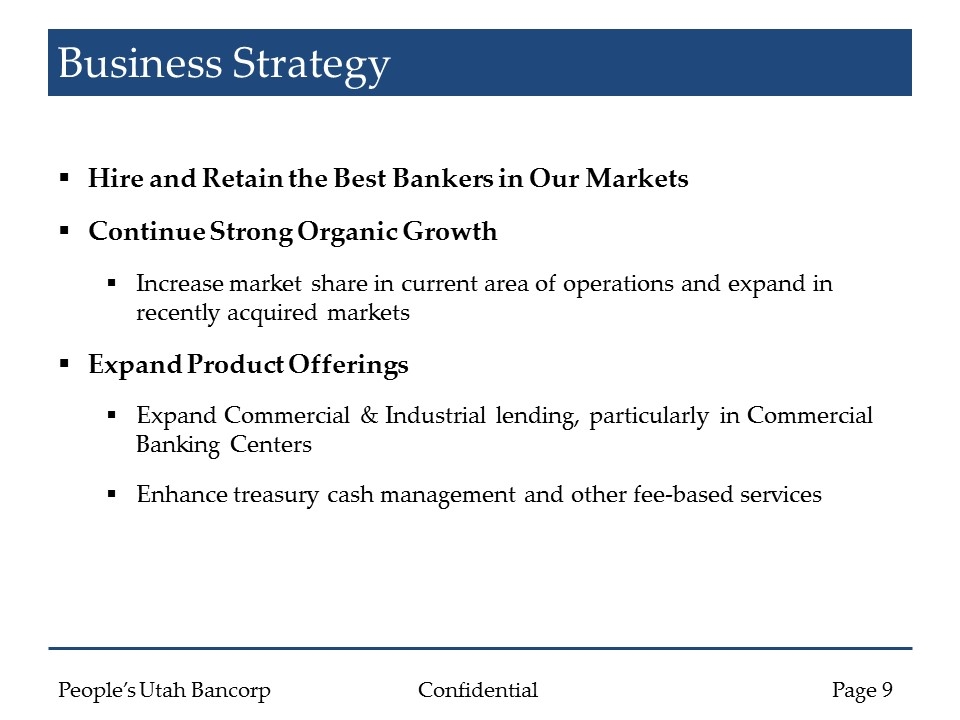
Business Strategy Hire and Retain the Best Bankers in Our Markets Continue Strong Organic Growth Increase market share in current area of operations and expand in recently acquired markets Expand Product Offerings Expand Commercial & Industrial lending, particularly in Commercial Banking Centers Enhance treasury cash management and other fee-based services
Business Strategy—continued Enhance Operating Efficiencies Leverage existing operating structure over recently acquired portfolios Ensure operating model is scalable Utilize technology to lower overall operating costs, while enhancing customer experience Active Pursue Acquisition Opportunities Transactions that are within the Intermountain West Tangible book value dilution earned back in less than 4 years Earnings accretion within 1 year
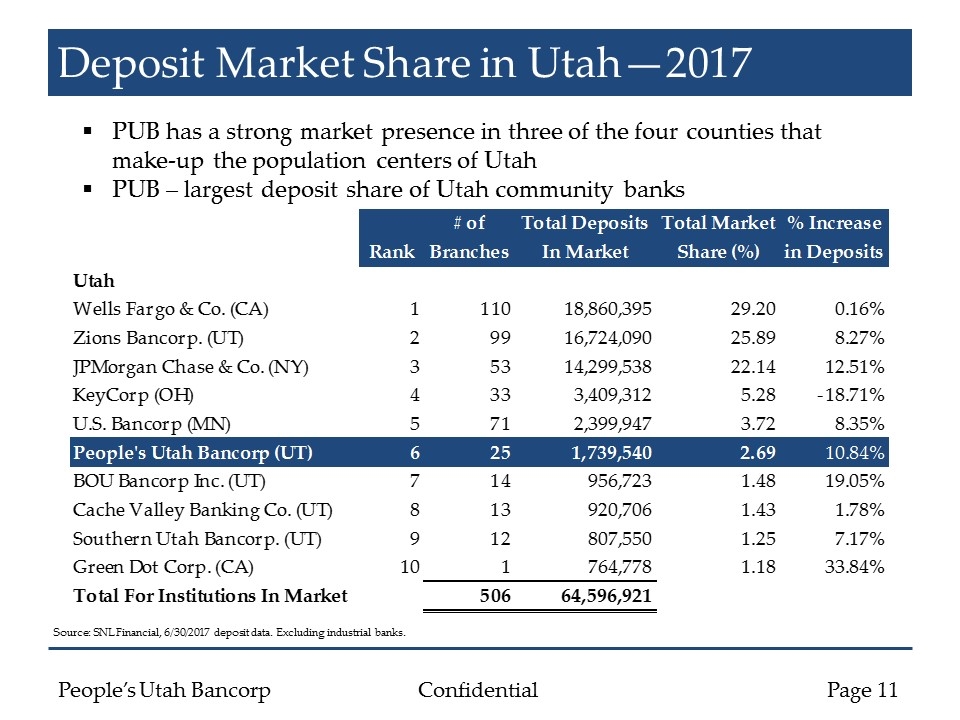
Deposit Market Share in Utah—2017 PUB has a strong market presence in three of the four counties that make-up the population centers of Utah PUB – largest deposit share of Utah community banks Source: SNL Financial, 6/30/2017 deposit data. Excluding industrial banks.
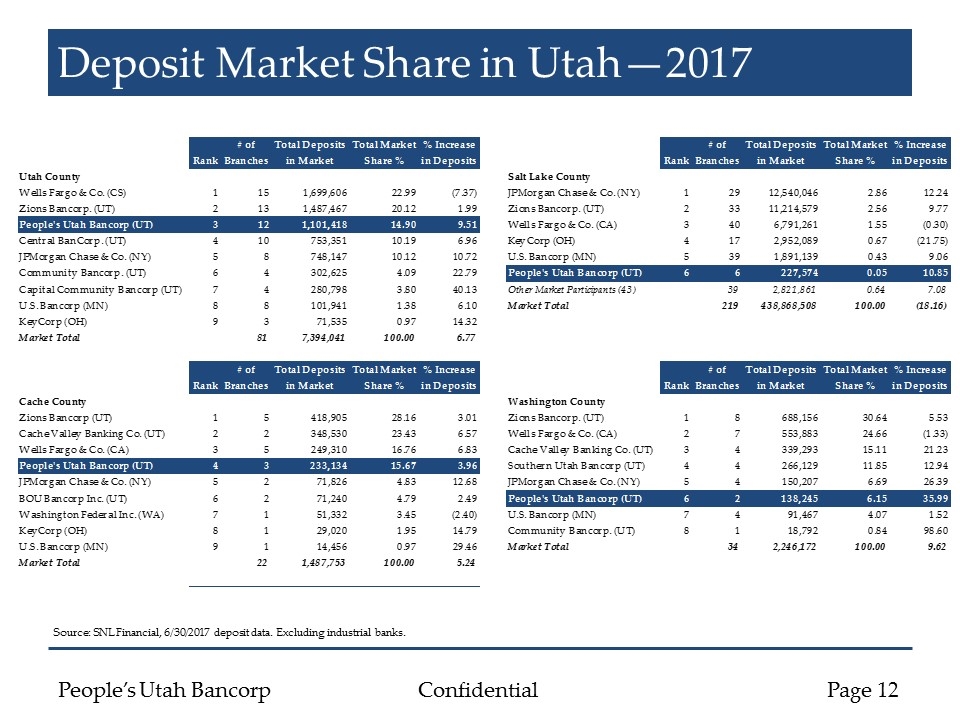
Deposit Market Share in Utah—2017 Source: SNL Financial, 6/30/2017 deposit data. Excluding industrial banks.
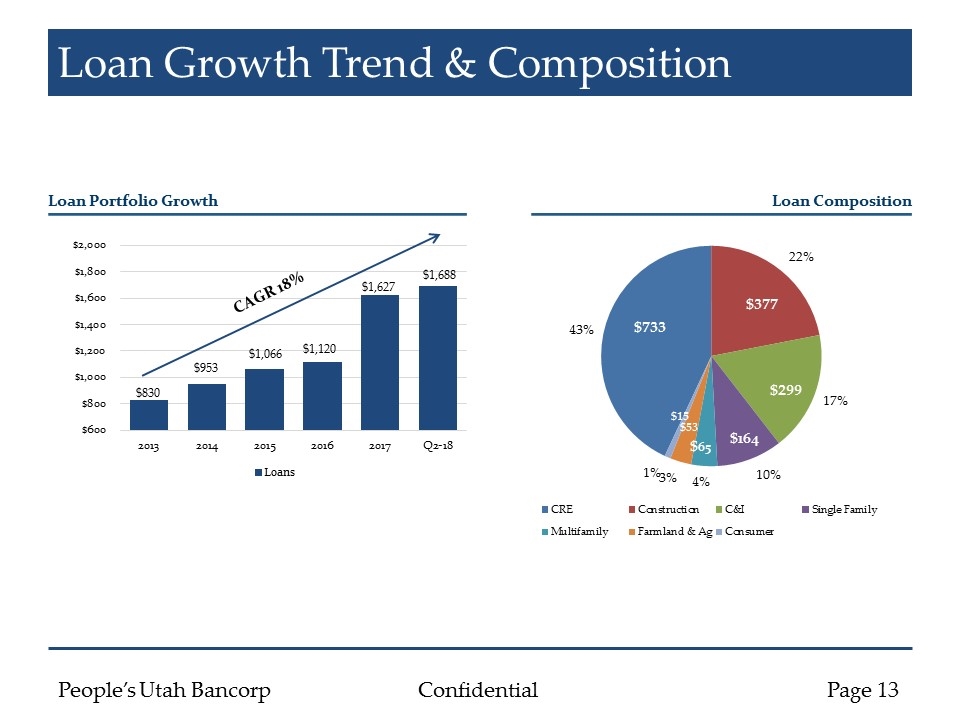
Loan Growth Trend & Composition Loan Portfolio Growth $830 $953 $1,066 $1,120 $1,627 CAGR 18% Loan Composition $1,688
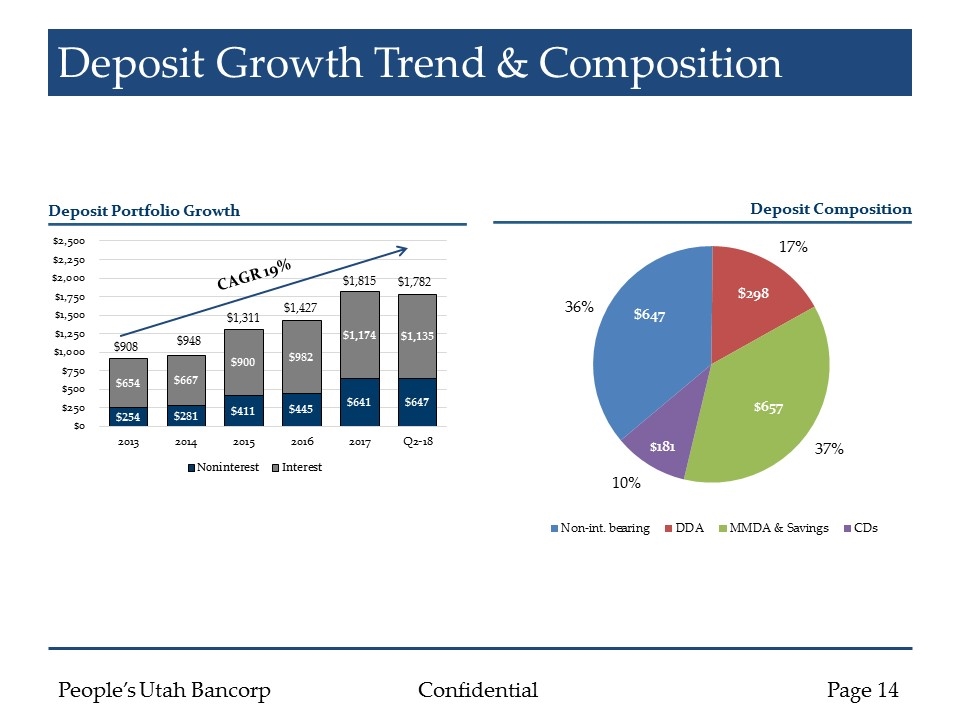
Deposit Growth Trend & Composition Deposit Portfolio Growth CAGR 19% $908 $948 $1,311 $1,427 $1,782 Deposit Composition $1,815
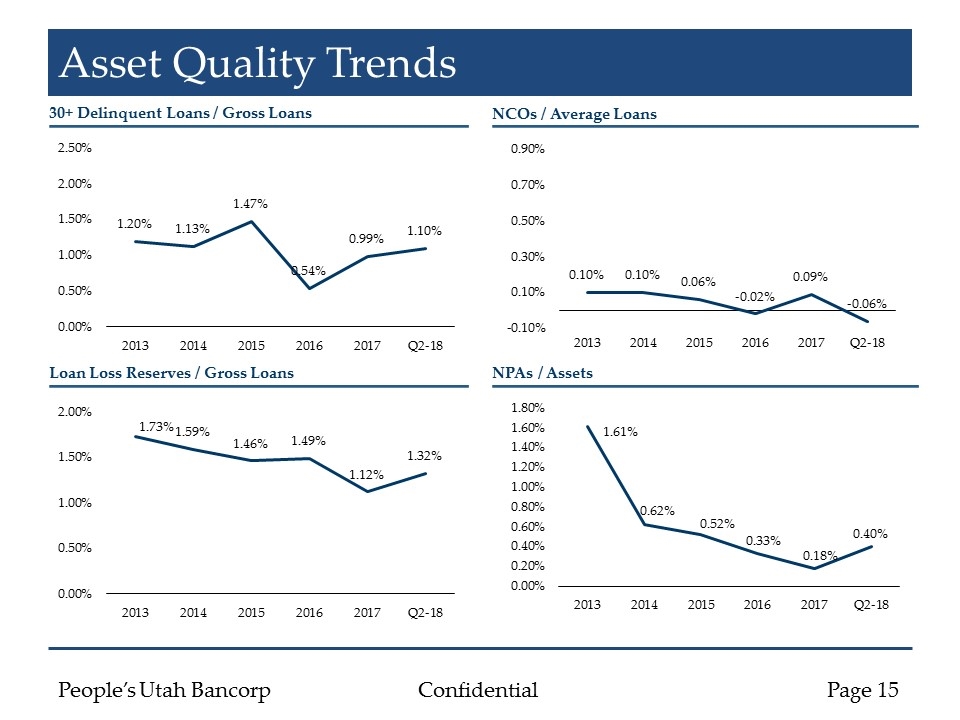
Asset Quality Trends 30+ Delinquent Loans / Gross Loans NCOs / Average Loans Loan Loss Reserves / Gross Loans NPAs / Assets
Financial Performance
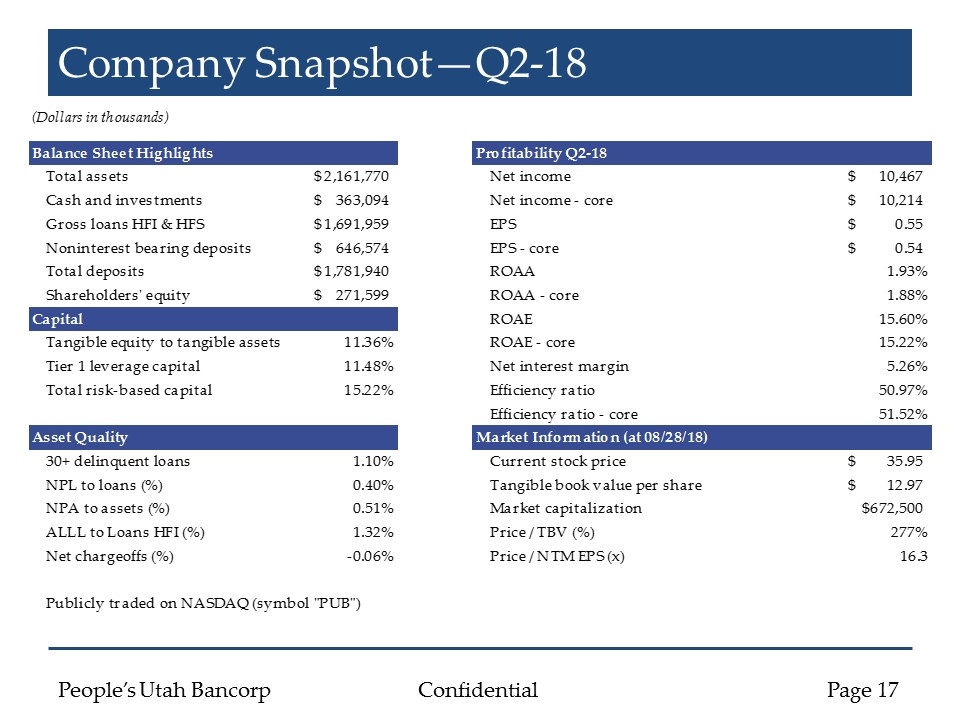
Company Snapshot—Q2-18
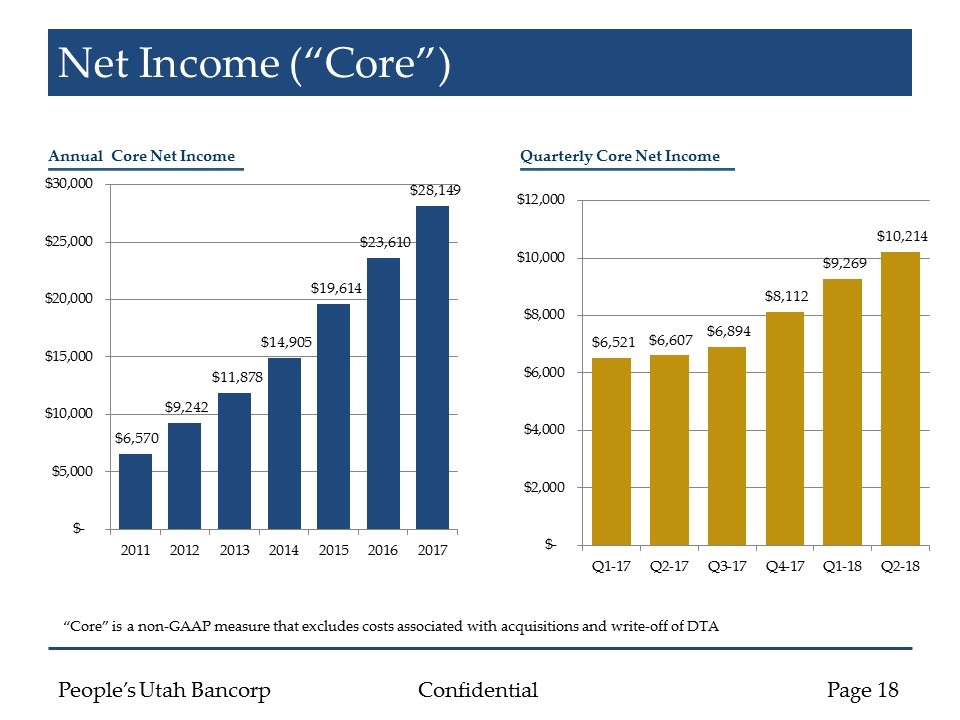
Net Income (“Core”) Annual Core Net Income Quarterly Core Net Income “Core” is a non-GAAP measure that excludes costs associated with acquisitions and write-off of DTA
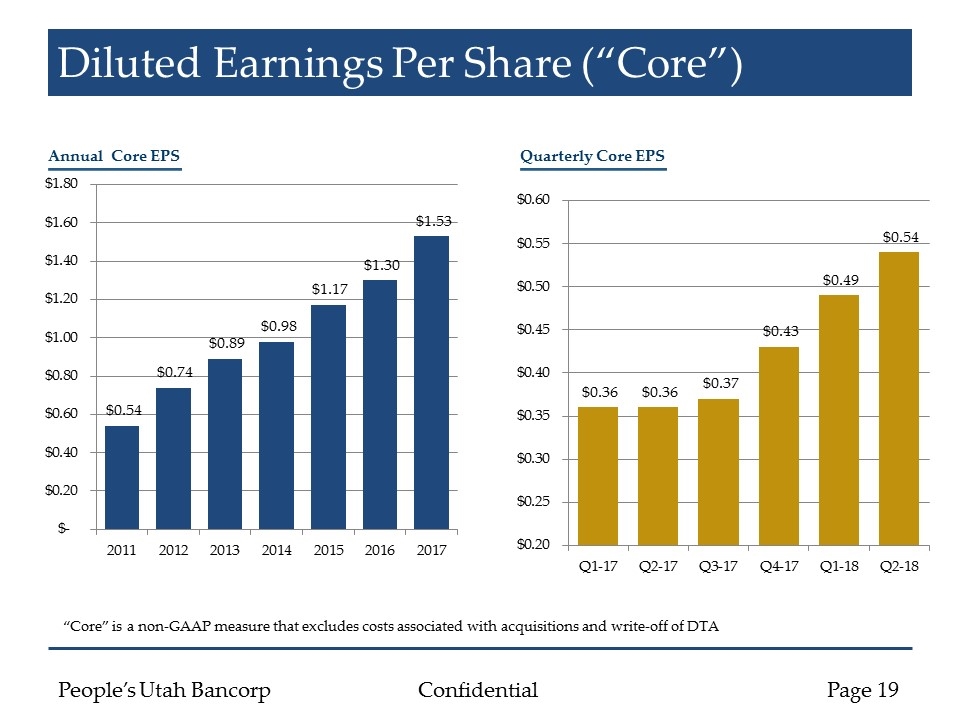
Diluted Earnings Per Share (“Core”) Annual Core EPS Quarterly Core EPS “Core” is a non-GAAP measure that excludes costs associated with acquisitions and write-off of DTA
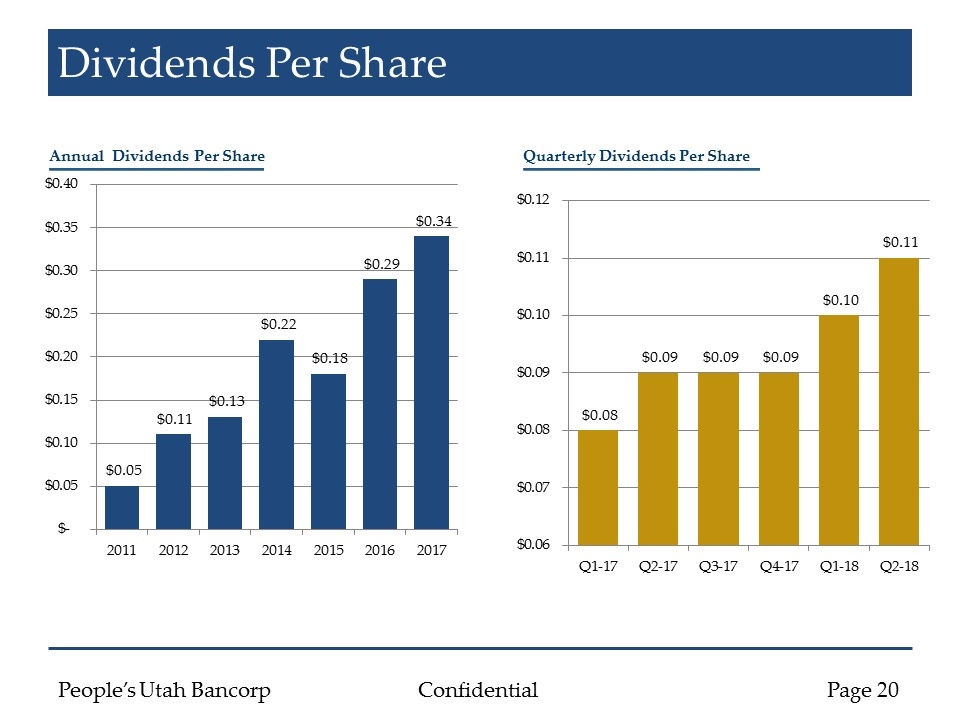
Dividends Per Share Annual Dividends Per Share Quarterly Dividends Per Share
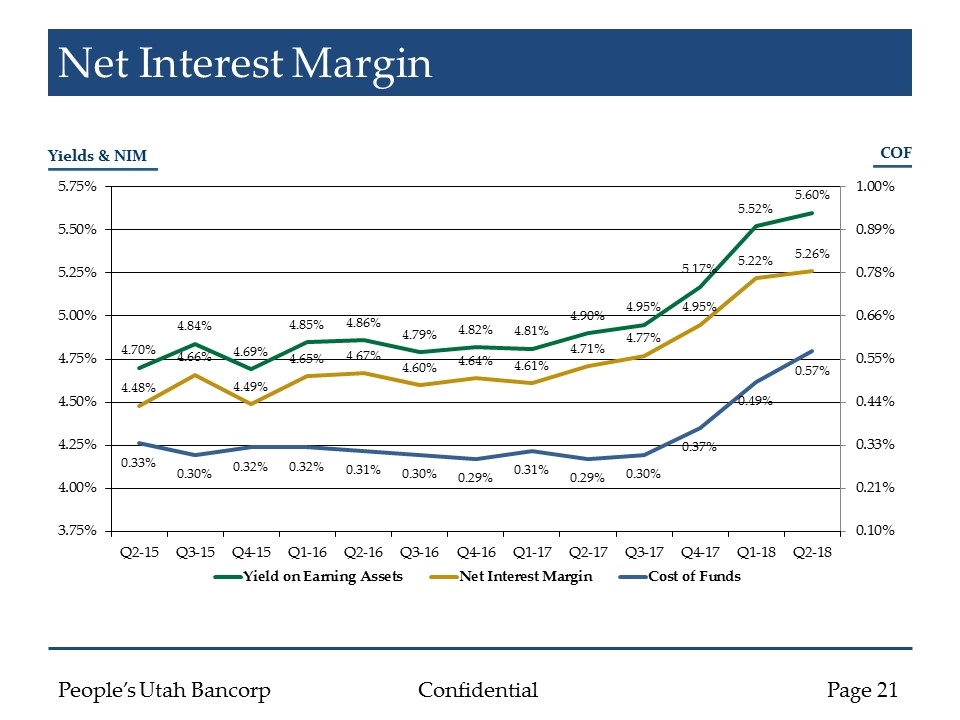
Net Interest Margin Yields & NIM COF
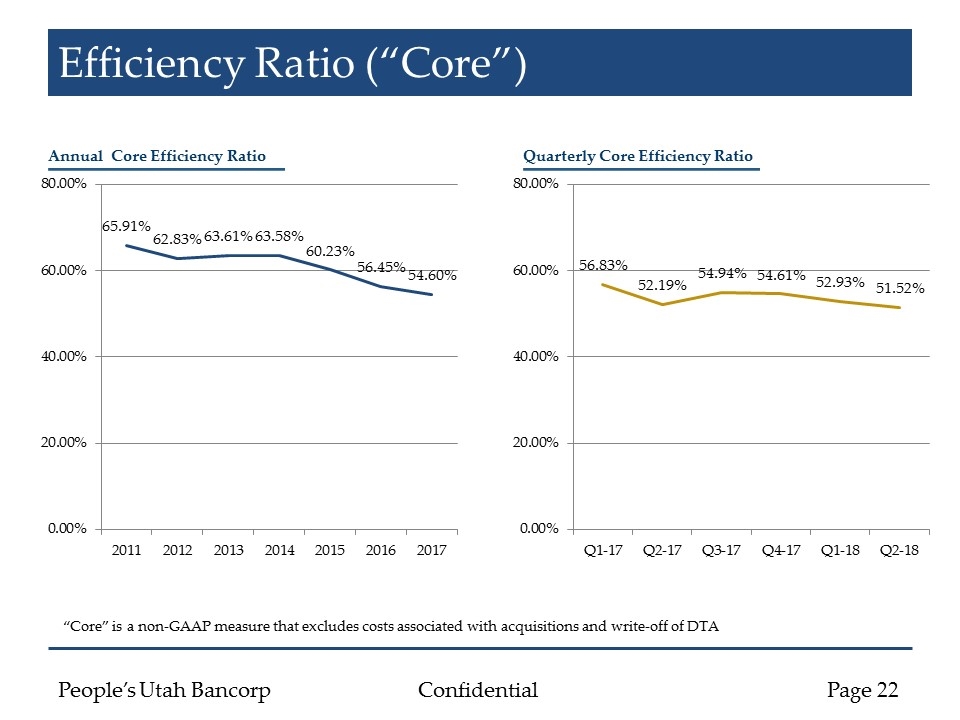
Efficiency Ratio (“Core”) Annual Core Efficiency Ratio Quarterly Core Efficiency Ratio “Core” is a non-GAAP measure that excludes costs associated with acquisitions and write-off of DTA
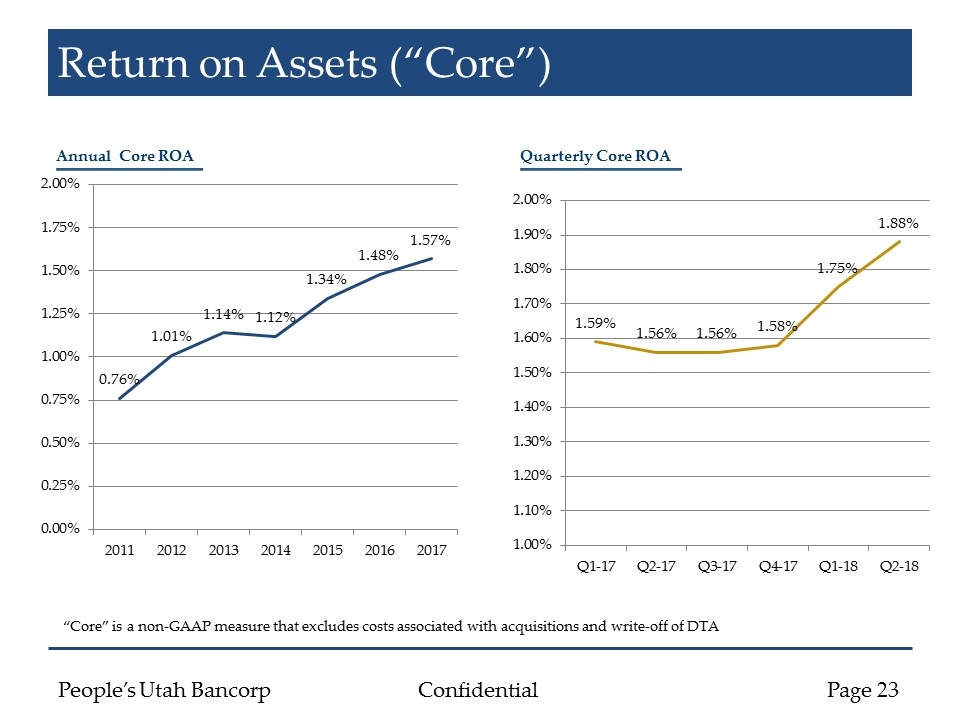
Return on Assets (“Core”) Annual Core ROA Quarterly Core ROA “Core” is a non-GAAP measure that excludes costs associated with acquisitions and write-off of DTA
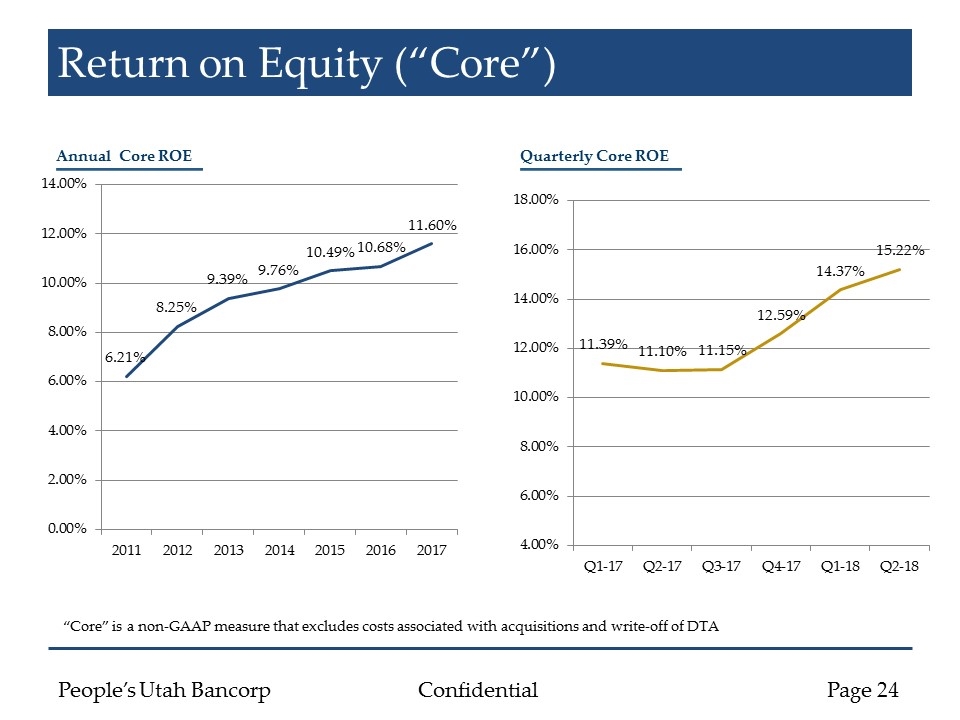
Return on Equity (“Core”) Annual Core ROE Quarterly Core ROE “Core” is a non-GAAP measure that excludes costs associated with acquisitions and write-off of DTA
