Attached files
| file | filename |
|---|---|
| EX-99.2 - EXHIBIT 99.2 - LEXINGTON REALTY TRUST | ex992-pressrelease9x4x18.htm |
| EX-10.4 - EXHIBIT 10.4 - LEXINGTON REALTY TRUST | ex104-jvagreement.htm |
| EX-10.3 - EXHIBIT 10.3 - LEXINGTON REALTY TRUST | ex103-contributionagreement.htm |
| EX-10.2 - EXHIBIT 10.2 - LEXINGTON REALTY TRUST | ex102-purchaseandsaleagree.htm |
| EX-10.1 - EXHIBIT 10.1 - LEXINGTON REALTY TRUST | ex101-purchaseandsaleagree.htm |
| 8-K - 8-K - LEXINGTON REALTY TRUST | lxplcifform8-k9518.htm |

September 4, 2018 Lexington Realty Trust Announces Disposition of 21-Property Office Portfolio for $726 Million to Joint Venture
Disclosure This presentation contains certain forward-looking statements within the meaning of Section 27A of the Securities Act of 1933, as amended, and Section 21E of the Securities Exchange Act of 1934, as amended, which involve known and unknown risks, uncertainties or other factors not under Lexington Realty Trust’s (“Lexington” or “LXP”) control which may cause actual results, performance or achievements of Lexington to be materially different from the results, performance, or other expectations implied by these forward- looking statements. These factors include, but are not limited to, those factors and risks detailed in Lexington’s filings with the Securities and Exchange Commission. Except as required by law, Lexington undertakes no obligation to (1) publicly release the results of any revisions to those forward-looking statements which may be made to reflect events or circumstances after the occurrence of unanticipated events or (2) update or supplement forward-looking statements that become untrue because of subsequent events. Accordingly, there is no assurance that Lexington’s expectations will be realized. For information on non-GAAP measures, please see the definitions at the end of the presentation. 2
Disclosure This presentation should be read in conjunction with Lexington’s Quarterly Supplemental Information for the second quarter of 2018 as furnished to the Securities and Exchange Commission (“SEC”) on a Current Report on Form 8-K dated August 8, 2018 (the “Quarterly Supplemental Information”). The information in this presentation is presented “As Adjusted” from the Quarterly Supplemental Information for the following: . The disposition of the 21-asset office portfolio as of the beginning of the applicable period (including the Richmond, Virginia asset held in escrow pending lender confirmation that it is a permitted transfer); . The three properties sold subsequent to June 30, 2018 as disclosed in Lexington’s Quarterly Report on Form 10-Q filed with the SEC on August 8, 2018 as if sold as of the beginning of the applicable period, however, excludes all other third quarter 2018 individual property dispositions; . The three properties acquired during the quarter ended June 30, 2018 as if they were acquired as of the beginning of the applicable period; and . The use of proceeds from the sale of the assets subsequent to June 30, 2018 (including the 21-asset office portfolio) to repay approximately $175 million outstanding under Lexington’s line of credit ($195.0 million outstanding at June 30, 2018 and $20 million repaid subsequent to quarter end) and to deposit the remaining proceeds with an Exchange Accommodation Titleholder for potential like- kind exchanges pursuant to Section 1031 of the Internal Revenue Code (however, no properties have been identified for an exchange to date). The footnotes included in the Quarterly Supplemental Information are excluded from this presentation, but are applicable to this presentation to the extent the information in the Quarterly Supplemental Information is presented herein “As Adjusted”. 3

Transaction Details . Lexington disposed of 21-property suburban office portfolio for $726 million to newly formed joint venture (one property held in escrow pending lender confirmation of a permitted transfer) . GAAP and cash capitalization rates of 8.6% and 8.1%, respectively . Lexington received approximately $565 million of net cash proceeds ($38 million held in escrow for the escrowed property and $264 million held by a qualified section 1031 intermediary) that will be used to fund new high-quality industrial acquisitions and repay debt . Joint venture is 80% owned by affiliates of Davidson Kempner Capital Management LP (“DKCM”) with Lexington retaining a 20% interest. . DKCM is a U.S. registered investment firm based in New York with affiliate offices in London, Hong Kong and Dublin. . Lexington will collect asset management fees for portfolio management and participate in promote structure created by joint venture . Joint venture assumed $46 million of non-recourse secured financing and is expected to assume another $57 million of non-recourse secured financing . Joint venture borrowed $363 million of new non-recourse debt . As a result of transaction, Lexington increased 2018 disposition guidance up to an estimated $1 billion at average GAAP and cash capitalization rates of approximately 8.7% and 8.3%, respectively 4
Transaction Benefits . Expected to increase Lexington’s industrial exposure to 60% of consolidated GAAP rent while reducing suburban office exposure to 35% of GAAP rent . Accelerates Lexington’s business plan to recycle capital out of suburban office portfolio to become a single-tenant industrial focused net-lease REIT . Goal to be at a 85% industrial/15% office revenue split by year-end 2019 . Simplifies consolidated portfolio with more focus on industrial platform . Provides Lexington working capital of approximately $565 million to fund industrial acquisitions and repay debt . Improves leverage metrics significantly . Generates attractive asset management fee of 85bps (on equity) . Creates potential upside for Lexington through retained 20% ownership interest and promote structure 5

Office Portfolio Joint Venture Snapshot Metrics Joint Venture Portfolio # of Properties 21 Total Square Feet 3.8 million Average Building Size (square feet) 182,000 Average Age (years) 23 Average Lease Duration(years) 9.5 % Leased 98.6% Rent per Square Foot - Cash $15.38 Price per square foot $190.00 GAAP Rental Revenue (YTD 6/30/2018) $31.6 million NOI (YTD 6/30/2018) – GAAP $30.7 million NOI (YTD 6/30/2018) – Cash $28.5 million 2018 Adjusted Company FFO (YTD 6/30/2018) $27.9 million - $0.11 per diluted common share 6

Office Portfolio Joint Venture Locations Geographic Location Tenants Tenant City State East Midwest AvidXchange Charlotte NC 4 properties Atlantic Health Rockaway NJ TMG Health Jessup PA McGuireWoods Richmond VA Amazon Huntington WV Midwest Career Education Schaumburg IL NV PA NJ Corporation IL OH MS Consultants Columbus OH CO WV VA Inventiv Health Westerville OH MO BIVI St. Joseph MO NC South Georgia Power McDonough GA GA East Experian Holdings Allen TX Motel 6 Carrollton TX TX 5 properties Nissan Irving TX TXU Irving TX Schlumberger Houston TX West United States of America Houston TX 5 properties West Arrow Electronics Centennial CO South TriZetto Englewood CO 7 properties GHX Louisville CO Alenco Parachute CO Nevada Power Las Vegas NV 7

Joint Venture Capitalization & Sources/Uses Joint Venture Capitalization Lexington Sources & Uses LXP Net Cash Proceeds ($ in Millions) Joint Venture Structure ($ in Millions) Gross Sales Proceeds $ 726 Capitalized Venture Value (purchase price/venture costs) $ 734 Assumed Debt (103) Transaction Costs (4) Existing Debt (103) Joint Venture Equity Investment (54) Total Lexington Net Cash Proceeds $ 565 New Joint Venture Debt (363) Joint Venture Equity $ 268 LXP Uses ($ in Millions) Credit Line Repayment1 $ 175 20% Lexington Interest $ 54 Excess for Reinvestment/Debt 390 Reduction 80% DKCM Interest $ 214 Total $ 565 1. At 6/30/2018, $195 million outstanding on credit facility. Credit line outstanding reduced by $20 million prior to close of transaction. 8
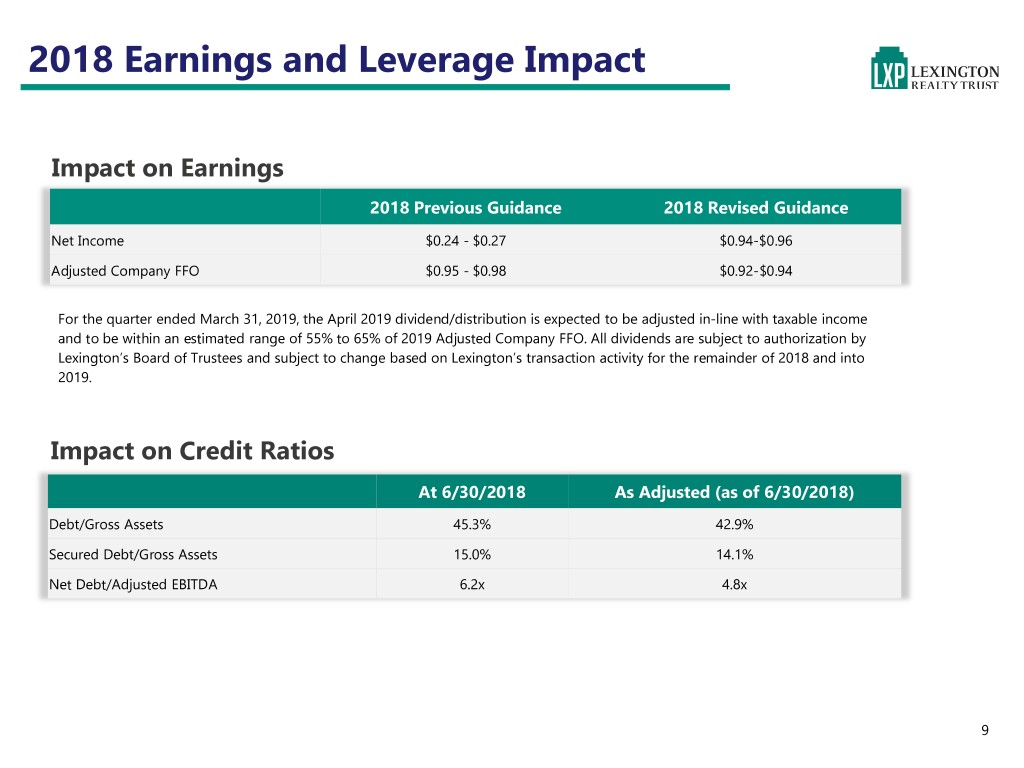
2018 Earnings and Leverage Impact Impact on Earnings 2018 Previous Guidance 2018 Revised Guidance Net Income $0.24 - $0.27 $0.94-$0.96 Adjusted Company FFO $0.95 - $0.98 $0.92-$0.94 For the quarter ended March 31, 2019, the April 2019 dividend/distribution is expected to be adjusted in-line with taxable income and to be within an estimated range of 55% to 65% of 2019 Adjusted Company FFO. All dividends are subject to authorization by Lexington’s Board of Trustees and subject to change based on Lexington’s transaction activity for the remainder of 2018 and into 2019. Impact on Credit Ratios At 6/30/2018 As Adjusted (as of 6/30/2018) Debt/Gross Assets 45.3% 42.9% Secured Debt/Gross Assets 15.0% 14.1% Net Debt/Adjusted EBITDA 6.2x 4.8x 9

Meaningful Progress Continues… Substantial step toward single-tenant net leased industrial REIT 2013 2017 As Adjusted 6/30/2018 44% 25% Industrial 60% Industrial Industrial 35% Office 6% Other 4% Multi- 8% 61% 52% Tenant Multi- Office Office Tenant 1% Other 2% Other 2% Multi- Tenant 10

Second Quarter Investor Presentation September 2018 11

Investment Features Single-Tenant, Net-Lease Industrial Strategy High-Quality, Diversified Portfolio Long-Term Growth Potential Active Portfolio Management Consistent Operating Performance Flexible Balance Sheet 12

Investment Strategy INVESTMENT . Three-pronged growth strategy—build-to-suit, sale-leaseback, industrial purchases . Long-term net leases, typically 7-20 years FOCUS . Single-tenant properties SECTOR FOCUS . Industrial INCOME & . Provide dividends that are attractive relative to fixed income alternatives GROWTH . Grow cash flow through investment activity, annual rental growth and interest savings PORTFOLIO . Significantly reduce suburban office exposure with a goal towards becoming a pure play MANAGEMENT single-tenant industrial net-lease REIT . Focus on maximizing value of office portion of portfolio CAPITAL . Disposition proceeds to fund new industrial investments and repay debt RECYCLING ASSET . Focus on tenant relationships . Manage lease expirations and weighted-average lease term MANAGEMENT . Sustain high levels of occupancy . Maintain modest leverage BALANCE SHEET . Access to secured and investment-grade unsecured debt with balanced maturities . Incorporate primarily long-term, fixed-rate debt 13
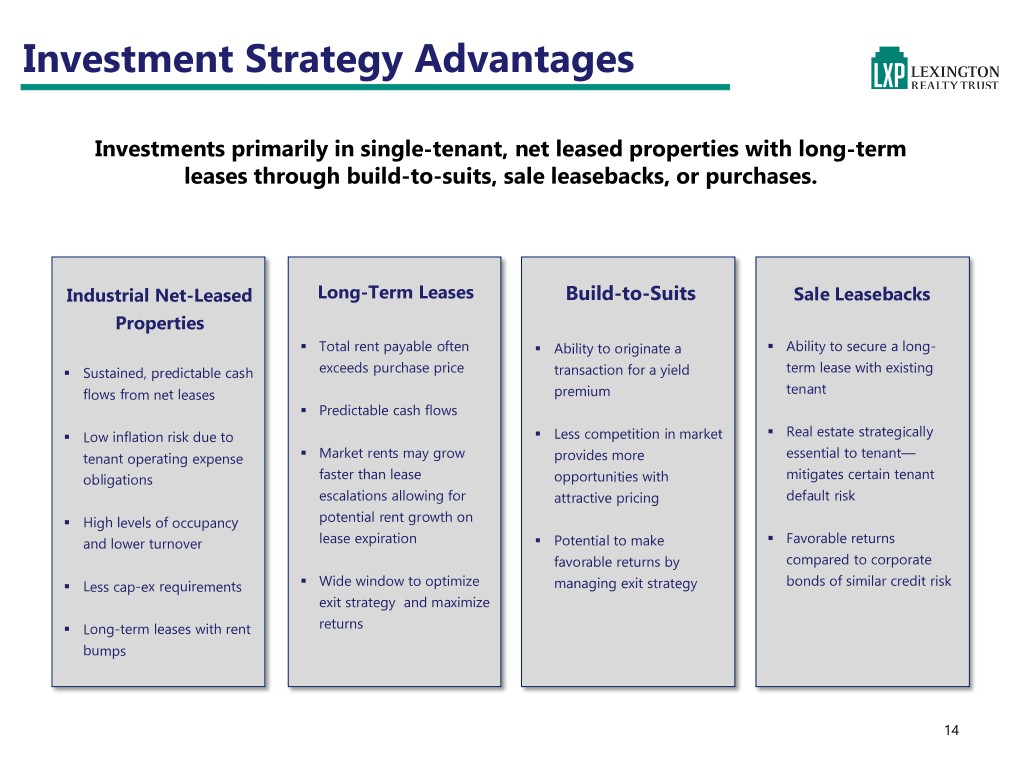
Investment Strategy Advantages Investments primarily in single-tenant, net leased properties with long-term leases through build-to-suits, sale leasebacks, or purchases. Industrial Net-Leased Long-Term Leases Build-to-Suits Sale Leasebacks Properties . Total rent payable often . Ability to originate a . Ability to secure a long- . Sustained, predictable cash exceeds purchase price transaction for a yield term lease with existing flows from net leases premium tenant . Predictable cash flows . Low inflation risk due to . Less competition in market . Real estate strategically tenant operating expense . Market rents may grow provides more essential to tenant— obligations faster than lease opportunities with mitigates certain tenant escalations allowing for attractive pricing default risk . High levels of occupancy potential rent growth on and lower turnover lease expiration . Potential to make . Favorable returns favorable returns by compared to corporate . Less cap-ex requirements . Wide window to optimize managing exit strategy bonds of similar credit risk exit strategy and maximize . Long-term leases with rent returns bumps 14

Portfolio Transformation Continues Through focused strategy, continue to show meaningful progress towards creating a best-in-class industrial net-lease REIT. As Adjusted Portfolio Metrics 2013 Q2 2018 Status Industrial Exposure 25.3% 60.2% Office Exposure 61.3% 34.5% % of Revenue from Long-Term Leases 32.1% 35.7% Average Lease Duration(years) 8.2 8.6 Unencumbered NOI 55.3% 72.7% Weighted-Avg. Debt Maturity(years) 7.0 6.7 Weighted-Avg. Interest Rate 4.7% 3.9% 15

Well-Diversified Portfolio (As Adjusted 6/30/2018) Geographic Diversification Revenue Sources by Property Type 5.3% 2 2 3 1 1 1 1 3 7 1 Industrial 1 2 2 1 7 Office 6 5 2 3 1 6 4 1 6 34.5% Other 6 4 16 1 9 7 3 6 60.2% 1 14 3 5 Top 10 Markets(%) Top 10 Industries(%) Houston/Sugar Land/Baytown TX 9.7 Consumer Products 18.5 Memphis TN-MS-AR 8.3 Auto 17.8 Kansas City MO-KS 5.0 Food 15.2 Detroit/Warren/Livonia MI 4.5 Transportation/Logistics 7.8 Kennewick/Pasco/Richland WA 4.2 Finance/Insurance 6.0 NY/Northern NJ/Long Island NY-NJ-PA 3.6 Service 5.8 Nashville/Davidson/Murfreesboro/Franklin TN 3.1 Technology 5.6 Dallas/Fort Worth/Arlington TX 2.8 Construction/Materials 5.1 Philly/Camden/Wilmington PA-NJ-DE-MD 2.6 Aerospace/Defense 3.3 Atlanta/Sandy Springs/Marietta GA 2.2 Telecommunications 3.3 16
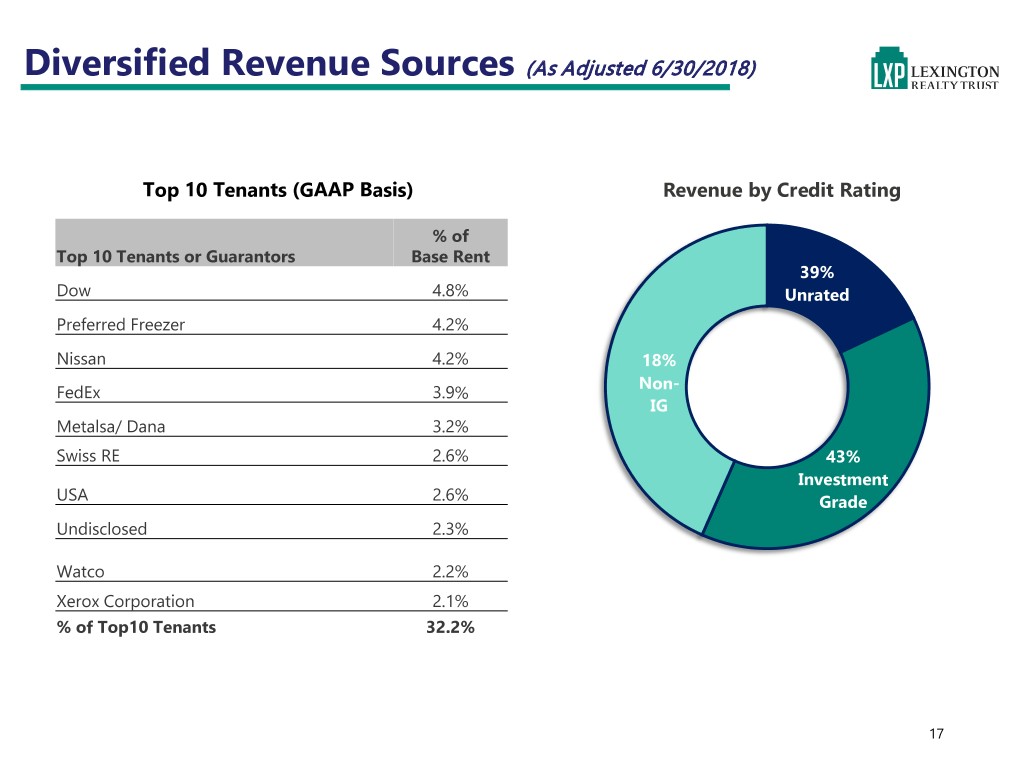
Diversified Revenue Sources (As Adjusted 6/30/2018) Top 10 Tenants (GAAP Basis) Revenue by Credit Rating % of Top 10 Tenants or Guarantors Base Rent 39% Dow 4.8% Unrated Preferred Freezer 4.2% Nissan 4.2% 18% Non- FedEx 3.9% IG Metalsa/ Dana 3.2% Swiss RE 2.6% 43% Investment USA 2.6% Grade Undisclosed 2.3% Watco 2.2% Xerox Corporation 2.1% % of Top10 Tenants 32.2% 17

Industrial Portfolio (As Adjusted 6/30/2018) Portfolio Metrics Lease Escalations # of Properties 82 4% Total Square Footage 37.5M 7% Annual Escalations Net Operating Income(six months as of 6/30/2018) $87.9M Flat Rent 19% % Leased 99.9% Other Escalations Average Weighted Lease Term(years) 10.1 70% Stepdown Investment Grade Tenancy 35.6% % of Annual Base Rent 60.2% Lease Rollover Schedule Property Type $15.0 13% Warehouse/Distribution $10.0 9% 7% 6% 6% 6% 6% 14% Manufacturing $5.0 3% 2% 1% 1% ($ in ($ in millions) Cold Storage/Freezer $0.0 13% Light Manufacturing 64% 18

Consolidated Office Portfolio (As Adjusted 6/30/2018) Portfolio Metrics Lease Escalations # of Properties 40 3% Total Square Footage 6.2M 17% Annual Escalations Net Operating Income(six months as of 6/30/2018) $51.0M Flat Rent % Leased 99.4% 59% Other Escalations 21% Average Weighted Lease Term(years) 6.0 Stepdown Investment Grade Tenancy 61.3% % of Annual Base Rent 34.5% Top 10 Markets(%) Lease Rollover Schedule Houston/Sugar Land/Baytown TX 15.0 $12.0 21% Kansas City MO-KS 13.2 $10.0 Philly/Camden/Wilmington PA-NJ-DE-MD 6.6 15% $8.0 Memphis TN-MS-AR 6.6 San Jose/Sunnvale/Santa Clara CA $6.0 6.2 8% 8% 6% 7% NY/N. New Jersey/Long Island NY-NJ-PA 5.7 ($ in ($ in millions) $4.0 5% 5% Wash./Arlington/Alexandria DC-VA-MD-WV 4.5 $2.0 2% 0% Columbus IN 4.2 $0.0 Charlotte/Concord/Gastonia NC-SC 3.7 Dallas/Ft Worth/Arlington TX 3.7 19

Execution: Strong Acquisition Activity Historically strong acquisition activity with attractive pricing. Property Build-to-Suit Completion and Acquisition Volume and Cash Capitalization Rate $800 8.4% $727.6 9.0% $700 7.6% 7.4% 8.0% $590.4 6.8% $600 5.8% 7.0% $483.0 6.0% $500 6.4% 5.9% $390.0 5.0% $400 4.0% ($ in millions) $300 $247.0 $212.3 3.0% $200 $136.8 2.0% $100 1.0% $0 0.0% 2012 2013 2014 2015 2016 2017 2018 Purchase/Forward Commitment/Build-to- Initial Month Approx. Lease Primary Tenant/ Guarantor Location Sq. Ft. (000’s) Property Type Suit (BTS) Basis (mm) Acquired/Completed Term (Yrs) Spectrum Brands Pet Group Edwardsville, IL 1,018 Industrial Purchase $44.1 June 12 Hamilton Beach Brands Olive Branch, MS 1,170 Industrial Purchase $48.6 April 3 Sephora USA Olive Branch, MS 716 Industrial Purchase $44.1 April 11 Total 2,904 $136.8 8.4 20

Portfolio Repositioning Activity (As Adjusted 6/30/2018) Have consistently used proceeds from non-core dispositions to recycle capital into higher-quality properties. Property Disposition Volume and Cash Capitalization Rate $1,000 $966 10.0% $900 9.0% 8.1% $800 7.2% 8.0% (millions) 6.5% $700 6.3% $663 7.7% 7.0% $600 6.0% 5.1% $500 5.0% 3.6% $400 4.0% $282 Disposition Volume Volume Disposition $300 $265 $242 3.0% $200 $176 $167 2.0% $100 1.0% $0 0.0% 2012 2013 2014 2015 2016 2017 YTD 20181 1. Includes all sales through date of this presentation. 21

Stable and Predictable Cash Flows (As Adjusted 6/30/2018) Weighted-Average Lease Term Scheduled Rental Increases (In Years) 3% 9.5 9.1 9.1 11% 9.0 8.6 8.6 8.6 Annual increases 8.5 8.2 Flat 20% 8.0 Other scheduled increases 7.5 Stepdowns 2013 2014 2015 2016 2017 Q2 2018 66% Long-term Lease Revenue Lease Type 60% 50% 44% 40% 37% 37% 37% 36% 32% 36% Leases Under 10 Years 30% Remaining 20% Leases Over 10 Years Remaining 10% 0% 64% 2013 2014 2015 2016 2017 Q2 2018 22

Managing Lease Expirations (As Adjusted 6/30/2018) Diligent focus on addressing upcoming expirations. Lease Expiration Schedule – Consolidated Single-Tenant Properties $18,000 10.7% $16,000 9.9% $14,000 9.1% $12,000 6.5% In 000’s In $10,000 6.2% GAAP Rent $8,000 4.7% 4.4% $6,000 3.6% 3.0% $4,000 2.1% $2,000 $- 2018 2019 2020 2021 2022 2023 2024 2025 2026 2027 Q2 2018 23
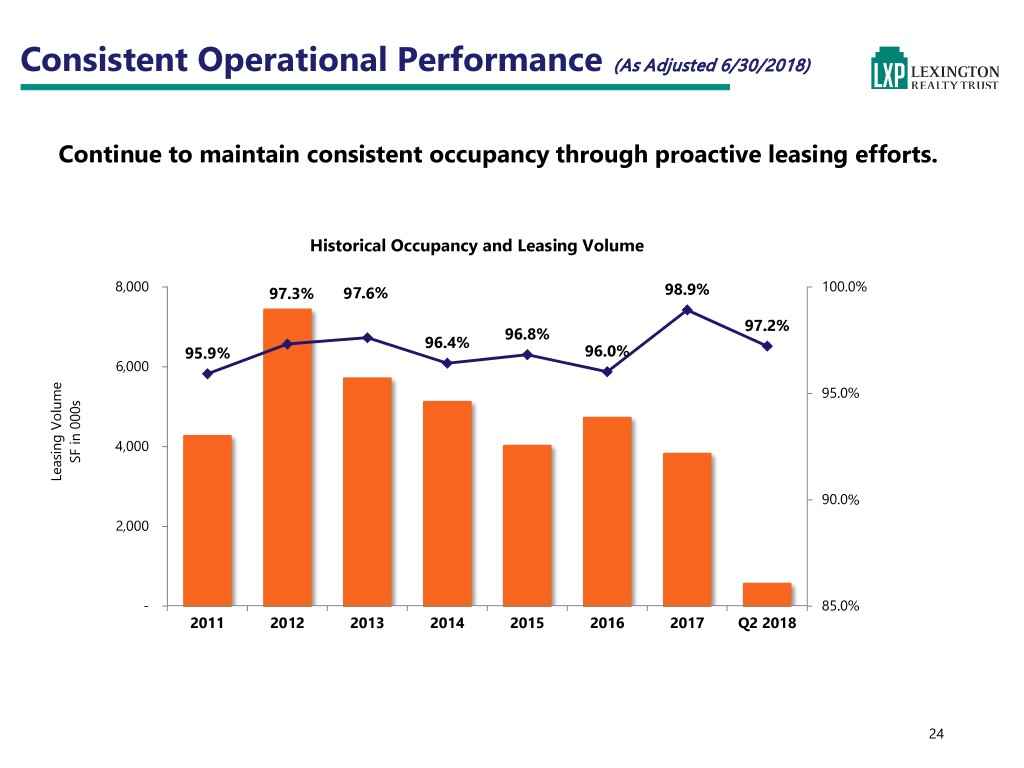
Consistent Operational Performance (As Adjusted 6/30/2018) Continue to maintain consistent occupancy through proactive leasing efforts. Historical Occupancy and Leasing Volume 8,000 97.3% 97.6% 98.9% 100.0% 97.2% 96.8% 96.4% 95.9% 96.0% 6,000 95.0% 4,000 SF in 000s in SF Leasing Leasing Volume 90.0% 2,000 - 85.0% 2011 2012 2013 2014 2015 2016 2017 Q2 2018 24

Flexible Capital Structure (As Adjusted 6/30/2018) Maintain maximum flexibility to access most advantageous source of capital. Preferred Amount ($ in Interest Rate/ Trust Equity, Debt Millions) Coupon Preferred, 2.3% 3.1% Unsecured Credit Facility Due 2019 $ - Libor + 1% Unsecured Term Loan Due 2020 300.0 3.139% Unsecured Unsecured Term Loan Due 2021 300.0 2.607% Bond Debt, 12.0% Unsecured bonds due 2023 250.0 4.250% Unsecured bonds due 2024 250.0 4.400% Unsecured Term Debt, Mortgages 605.5 4.514% 14.4% Common Trust Preferred 129.1 4.059% Equity, Total – Debt $ 1,834.6 3.894% 53.6% Mortgage Debt, 14.6% Preferred Preferred C $ 96.8 6.50% Total – Preferred $ 96.8 Total – Common equity1 $2,232.9 Total $4,164.3 25 1. Data includes OP Units and reflects a common share price of $9.17 at August 24, 2018.

Balance Sheet Strategy (As Adjusted 6/30/2018) Focus on extending maturities, unencumbering assets, maintaining investment-grade ratings and selectively utilizing secured financing. Consolidated Debt Maturity Profile ($000’s) Credit Metrics Summary Unencumbered Assets $2.7B Unencumbered NOI 72.7% $350,000 (Debt + Preferred)/Gross Assets 45.1% 3.1% 2.6% $300,000 4.3% 4.4% Debt/Gross Assets 42.9% $250,000 Secured Debt/Gross Assets 14.1% $200,000 Net Debt/Adjusted EBITDA 4.8x $150,000 4.0% 5.7% $100,000 (Net Debt + Preferred)/ 5.2x $50,000 6.2% 6.1% Adjusted EBITDA 5.9% 5.0% 5.4% 3.7% $- Unsecured Debt/ 6.1x 2018 2019 2020 2021 2022 2023 2024 2025 2026 2027 Unencumbered NOI Credit Facilities Availability $505.0M Actual Mortgage Balloon Debt Corporate Debt 26
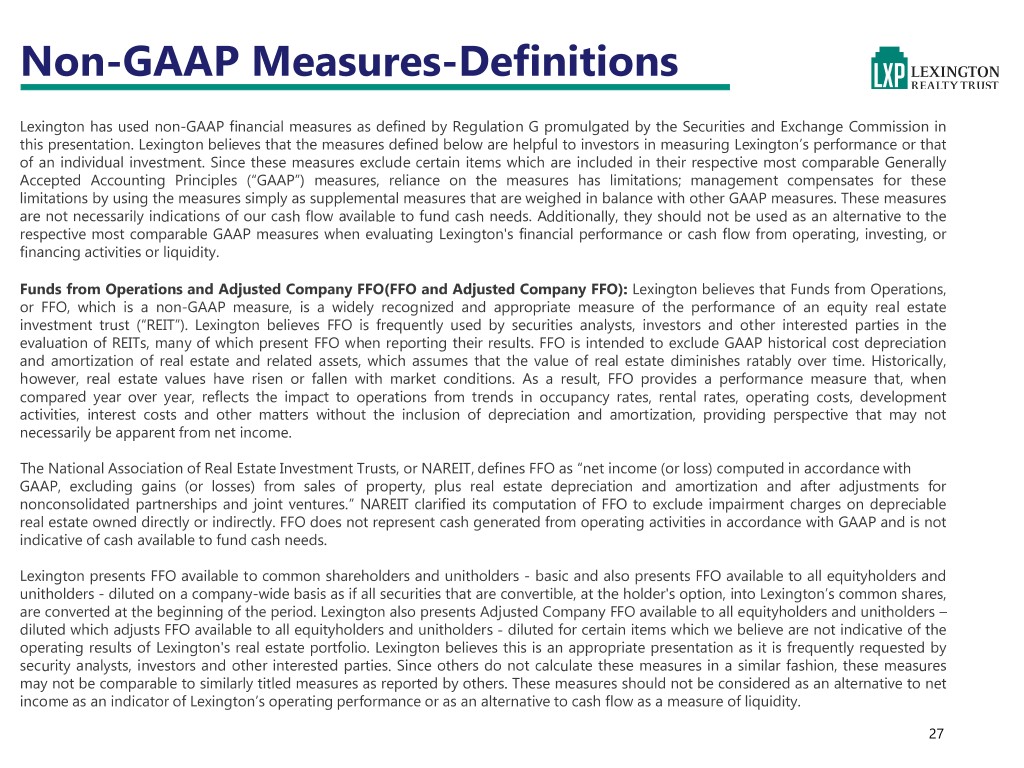
Non-GAAP Measures-Definitions Lexington has used non-GAAP financial measures as defined by Regulation G promulgated by the Securities and Exchange Commission in this presentation. Lexington believes that the measures defined below are helpful to investors in measuring Lexington’s performance or that of an individual investment. Since these measures exclude certain items which are included in their respective most comparable Generally Accepted Accounting Principles (“GAAP”) measures, reliance on the measures has limitations; management compensates for these limitations by using the measures simply as supplemental measures that are weighed in balance with other GAAP measures. These measures are not necessarily indications of our cash flow available to fund cash needs. Additionally, they should not be used as an alternative to the respective most comparable GAAP measures when evaluating Lexington's financial performance or cash flow from operating, investing, or financing activities or liquidity. Funds from Operations and Adjusted Company FFO(FFO and Adjusted Company FFO): Lexington believes that Funds from Operations, or FFO, which is a non-GAAP measure, is a widely recognized and appropriate measure of the performance of an equity real estate investment trust (“REIT”). Lexington believes FFO is frequently used by securities analysts, investors and other interested parties in the evaluation of REITs, many of which present FFO when reporting their results. FFO is intended to exclude GAAP historical cost depreciation and amortization of real estate and related assets, which assumes that the value of real estate diminishes ratably over time. Historically, however, real estate values have risen or fallen with market conditions. As a result, FFO provides a performance measure that, when compared year over year, reflects the impact to operations from trends in occupancy rates, rental rates, operating costs, development activities, interest costs and other matters without the inclusion of depreciation and amortization, providing perspective that may not necessarily be apparent from net income. The National Association of Real Estate Investment Trusts, or NAREIT, defines FFO as “net income (or loss) computed in accordance with GAAP, excluding gains (or losses) from sales of property, plus real estate depreciation and amortization and after adjustments for nonconsolidated partnerships and joint ventures.” NAREIT clarified its computation of FFO to exclude impairment charges on depreciable real estate owned directly or indirectly. FFO does not represent cash generated from operating activities in accordance with GAAP and is not indicative of cash available to fund cash needs. Lexington presents FFO available to common shareholders and unitholders - basic and also presents FFO available to all equityholders and unitholders - diluted on a company-wide basis as if all securities that are convertible, at the holder's option, into Lexington’s common shares, are converted at the beginning of the period. Lexington also presents Adjusted Company FFO available to all equityholders and unitholders – diluted which adjusts FFO available to all equityholders and unitholders - diluted for certain items which we believe are not indicative of the operating results of Lexington's real estate portfolio. Lexington believes this is an appropriate presentation as it is frequently requested by security analysts, investors and other interested parties. Since others do not calculate these measures in a similar fashion, these measures may not be comparable to similarly titled measures as reported by others. These measures should not be considered as an alternative to net income as an indicator of Lexington’s operating performance or as an alternative to cash flow as a measure of liquidity. 27

Non-GAAP Measures-Definitions, cont. Net operating income (NOI): a measure of operating performance used to evaluate the individual performance of an investment. This measure is not presented or intended to be viewed as a liquidity or performance measure that presents a numerical measure of Lexington’s historical or future financial performance, financial position or cash flows. Initial cash capitalization rate, internal rate of return (IRR), and cash-on-cash return: measures of operating performance used to evaluate the individual performance of an investment. These measures are estimates and are not presented or intended to be viewed as liquidity or performance measures that present a numerical measure of Lexington’s historical or future financial performance, financial position or cash flows. Expectations may not be realized. Adjusted EBITDA: Adjusted EBITDA represents EBITDA (earnings before interest, taxes, depreciation and amortization) modified to include other adjustments to GAAP net income for gains on sales of properties, impairment charges, debt satisfaction gains (charges), net, non-cash charges, net, straight-line adjustments, non-recurring charges and adjustments for pro-rata share of non-wholly owned entities. Lexington’s calculation of Adjusted EBITDA may not be comparable to similarly titled measures used by other companies. Lexington believes that net income is the most directly comparable GAAP measure to Adjusted EBITDA. 28

Appendix 29
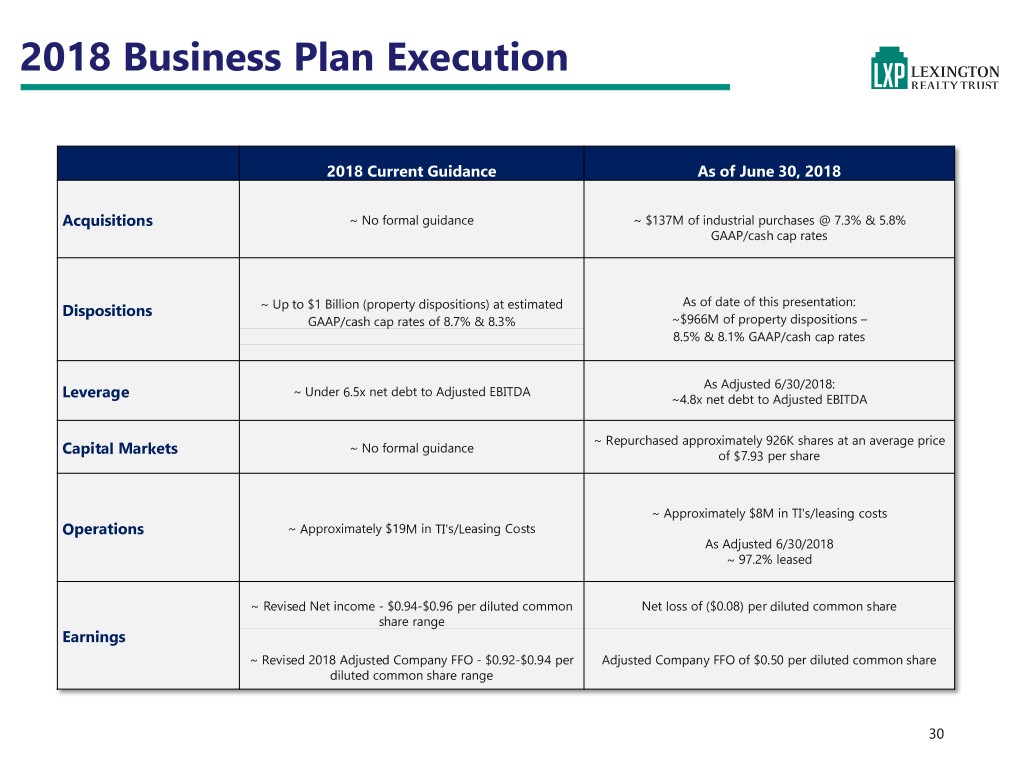
2018 Business Plan Execution 2018 Current Guidance As of June 30, 2018 Acquisitions ~ No formal guidance ~ $137M of industrial purchases @ 7.3% & 5.8% GAAP/cash cap rates As of date of this presentation: Dispositions ~ Up to $1 Billion (property dispositions) at estimated GAAP/cash cap rates of 8.7% & 8.3% ~$966M of property dispositions – 8.5% & 8.1% GAAP/cash cap rates As Adjusted 6/30/2018: ~ Under 6.5x net debt to Adjusted EBITDA Leverage ~4.8x net debt to Adjusted EBITDA ~ Repurchased approximately 926K shares at an average price ~ No formal guidance Capital Markets of $7.93 per share ~ Approximately $8M in TI's/leasing costs Operations ~ Approximately $19M in TI's/Leasing Costs As Adjusted 6/30/2018 ~ 97.2% leased ~ Revised Net income - $0.94-$0.96 per diluted common Net loss of ($0.08) per diluted common share share range Earnings ~ Revised 2018 Adjusted Company FFO - $0.92-$0.94 per Adjusted Company FFO of $0.50 per diluted common share diluted common share range 30

Net-Lease Expertise. Diversified Portfolio. Quarterly Dividends. One Penn Plaza, Suite 4015 | New York, NY 10119-4015 | (212) 692-7200 | www.lxp.com
