Attached files
| file | filename |
|---|---|
| 8-K - FORM 8-K - DELTA AIR LINES, INC. | delta_8k.htm |
Exhibit 99.1

Delta: Built to Last Cowen and Company 11 th Annual Global Transportation Conference September 5, 2018

Safe Harbor Statements in this presentation that are not historical facts, including statements regarding our estimates, expectations, beliefs, intentions, projections o r strategies for the future, may be "forward - looking statements" as defined in the Private Securities Litigation Reform Act of 199 5. All forward - looking statements involve a number of risks and uncertainties that could cause actual results to differ materially from the estimates, expectat ion s, beliefs, intentions, projections and strategies reflected in or suggested by the forward - looking statements. These risks and uncertainties include, but are not limi ted to, the cost of aircraft fuel; the impact of fuel hedging activity including rebalancing our hedge portfolio, recording mark - to - market adjustments or posting colla teral in connection with our fuel hedge contracts; the availability of aircraft fuel; the performance of our significant investments in airlines in other parts of the world; the possible effects of accidents involving our aircraft; breaches or security lapses in our information technology systems; disruptions in our infor mat ion technology infrastructure; our dependence on technology in our operations; the restrictions that financial covenants in our financing agreements could have on our financial and business operations; labor issues; the effects of weather, natural disasters and seasonality on our business; the effects of an extend ed disruption in services provided by third party regional carriers; failure or inability of insurance to cover a significant liability at Monroe’s Trainer refiner y; the impact of environmental regulation on the Trainer refinery, including costs related to renewable fuel standard regulations; our ability to retain senior management and ke y employees; damage to our reputation and brand if we are exposed to significant adverse publicity through social media; the effects of terrorist attack s o r geopolitical conflict; competitive conditions in the airline industry; interruptions or disruptions in service at major airports at which we operate; the effect s o f extensive government regulation on our business; the sensitivity of the airline industry to prolonged periods of stagnant or weak economic conditions; uncertainty i n e conomic conditions and regulatory environment in the United Kingdom related to the likely exit of the United Kingdom from the European Union; and the effects o f t he rapid spread of contagious illnesses. Additional information concerning risks and uncertainties that could cause differences between actual results and forward - lookin g statements is contained in our Securities and Exchange Commission filings, including our Annual Report on Form 10 - K for the fiscal year ended December 31, 2017 and our Quarterly Report on Form 10 - Q for the period ended March 31, 2018. Caution should be taken not to place undue reliance on our forward - looking statements, which represent our views only as of September 5, 2018, and which we have no current intention to update. 1

Delta has the Right Combination of Strategic Advantages 2 Domestic Network Customer Loyalty Investment Grade Balance Sheet Best connecting hub complex – including the world’s most efficient hub in Atlanta – enhanced by investments in New York, LA and Seattle Solid foundation with lower interest expense, more cash flow flexibility and access to higher quality credit markets for future needs Delta’s ascending brand and strong partnership with American Express combine to produce high - value loyalty program and growing revenue stream Culture At the core of Delta – passionate and determined professionals with an innate sense of caring for our customers Operational Reliability America’s best - run airline, consistently delivering industry - leading operational results and driving further improvement and efficiencies through innovation Foundation in place for long - term success

Delta Delivers Again in 2017 3 Running a reliable, customer - focused airline is producing strong profits and cash flows that are sustainable through the business cycle Balanced capital allocation allows for investment in the future, a stronger financial foundation, and consistent shareholder returns Positioned to return to margin expansion by year end, offsetting the majority of fuel price increases for 2018 Our Advantages Create Consistency and Durability A durable business model focused on customer service and reliability with sustainable financial results Driving Long - Term Value For Owners Returning to Margin Expansion Producing Consistent Results

Delta Delivers Again in 2017 4 Consistently Producing Solid Results Running a reliable, customer - focused airline is producing strong profits and cash flows, allowing for improved balance sheet strength and increased return of capital to shareholders Expect 2018 will be 4 th year with over $5B in p retax profits $4.5B $5.9B $5.9B $5.3B 2014 2015 2016 2017 Targeting return of ~70% of FCF to owners with steady dividend growth $1.4B $2.6B $3.1B $2.4B 2014 2015 2016 2017 Pre - Tax Profit Returns to Shareholders Note: Pre - tax profit and operating cash flow adjusted for special items, 2016 and 2017 recast for new accounting standards; non - GAAP financial measures reconciled in Appendix $5.8B $7.4B $7.0B $6.8B 2014 2015 2016 2017 Operating Cash Flow Consistent cash flow generation allows for investment in the business

Margins Stabilizing in Second Half of 2018 (1.8%) (2.3%) 2017 1H18 3Q18E 4Q18E 5 • Reaffirming earnings per share guidance of $1.65 to $1.85 for the September quarter • Top - line growth up 8% year - to - date as fuel recapture and commercial initiatives gain momentum • Cost trajectory improving in second half, keeping Delta on track to deliver non - fuel unit cost growth below 2% for the year • Year - over - year fuel price pressure expected to peak in September quarter with increases projected to moderate in December quarter Strong revenue momentum, improving non - fuel costs, and moderating fuel price increases position Delta to return to margin expansion by year - end Year - over - Year Change in Pre - Tax Margin Note: Adjusted for special items, 2017 recast for new accounting standards; non - GAAP financial measures reconciled in Appendix ~Flat (3.5%) – (1.5%)

Investments in Customer Experience and Operational Reliability Driving Diversified Revenue Premium • Delta’s strong customer focus combined with investments in our fleet, network, product, and airline partners have driven revenue diversity and a significant, sustainable revenue premium to the industry – Top global operation – named World’s Most On - Time Airline in 2017 by FlightGlobal – Strong customer satisfaction with record NPS scores YTD in 2018 – Growing customer loyalty drives durable and increasing revenue from American Express 6 Delta Domestic Net Promoter Score Delta Domestic Passenger Unit Revenue vs. Industry 15.3% 27.2% 33.5% 40.1% 43.9% 2010 2012 2014 2016 1H18 106% 112% 115% 116% 119% 2010 2012 2014 2016 1H18

Driving Efficiency to Address Non - Fuel Cost Growth • With fuel pressuring margins, managing controllable costs is more important than ever • Second half 2018 non - fuel unit cost growth expected to be 3 to 4 points better than first - half performance − Lapping overhead pressures including depreciation from fleet retirements and product investments − Upgauging benefits weighted to second half, based on delivery mix and timing − One Delta benefits ramp in second half as network optimization effort kicks into high gear • Refleeting and One Delta initiative will drive additional efficiency in 2019 Continue to expect full year growth of 1 to 2% Note: Adjusted for special items; non - GAAP financial measures reconciled in Appendix 2017 unit cost change reflects 1.2 point impact from new accounting standards 7 Year - over - Year Non - Fuel Unit Cost Growth 5.9% 3.9% 2.9% ~ Flat 1 - 2% 2017 1Q18 2Q18 3Q18E 2018E

Continuing Balanced Capital Allocation in 2018 8 Balancing cash flows between investment in business, balance sheet and shareholders Reinvest In The Business • Capital spending targets ~50% of operating cash flow • Replacing ~30 % of mainline fleet from 2017 - 2020, driving enhanced efficiency • Provides for continued investment in technology Strengthen The Balance Sheet • Balance sheet progress will allow Delta to shift cash from debt and pension funding to pay cash taxes • Investment grade rating from all three ratings agencies Return Cash To Shareholders • Expect to return 70% of free cash flow to shareholders • Long - term target to return 20 - 25% of free cash flow through dividends
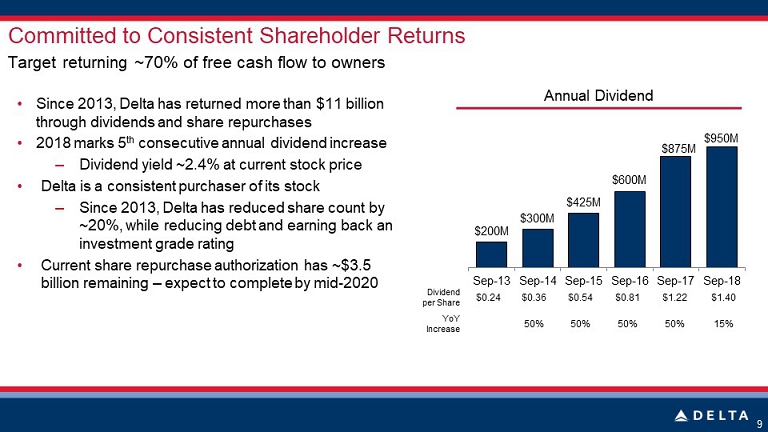
Committed to Consistent Shareholder Returns • Since 2013, Delta has returned more than $11 billion through dividends and share repurchases • 2018 marks 5 th consecutive annual dividend increase – Dividend yield ~2.4% at current stock price • Delta is a consistent purchaser of its stock – Since 2013, Delta has reduced share count by ~20%, while reducing debt and earning back an investment grade rating • Current share repurchase authorization has ~$3.5 billion remaining – expect to complete by mid - 2020 Target returning ~70 % of free cash flow to owners 9 Annual Dividend $200M $300M $ 425M $ 600M $875M $950M Sep-13 Sep-14 Sep-15 Sep-16 Sep-17 Sep-18 Dividend per Share $0.24 $0.36 $0.54 $0.81 $1.22 $1.40 YoY Increase 50% 50% 50% 50% 15%
 Non-GAAP
Reconciliations
Non-GAAP
Reconciliations
Non-GAAP Financial Measures
The following tables show reconciliations of non-GAAP financial measures. The reasons Delta uses these measures are described below. Reconciliations may not calculate due to rounding.
Delta sometimes uses information ("non-GAAP financial measures") that is derived from the Consolidated Financial Statements, but that is not presented in accordance with accounting principles generally accepted in the U.S. (“GAAP”). Under the U.S. Securities and Exchange Commission rules, non-GAAP financial measures may be considered in addition to results prepared in accordance with GAAP, but should not be considered a substitute for or superior to GAAP results. The tables below show reconciliations of non-GAAP financial measures used in this presentation to the most directly comparable GAAP financial measures. Forward Looking Projections. We do not reconcile forward looking non-GAAP financial measures because mark-to-market ("MTM") adjustments and settlements will not be known until the end of the period and could be significant.
Forward Looking Projections. The company is not able to reconcile certain forward looking non-GAAP financial measures because the adjusting items such as those used in the reconciliations below will not be known until the end of the period and could be significant.
Pre-Tax Profit, Adjusted
We adjust pre-tax profit for mark-to-market ("MTM") adjustments and settlements on fuel hedge contracts, the MTM adjustments recorded by our equity method investees, Virgin Atlantic and Aeroméxico, restructuring and other and loss on extinguishment of debt, to determine pre-tax profit, adjusted.
Mark-to-Market ("MTM") adjustments and settlements. MTM adjustments are defined as fair value changes recorded in periods other than the settlement period. Such fair value changes are not necessarily indicative of the actual settlement value of the underlying hedge in the contract settlement period. Settlements represent cash received or paid on hedge contracts settled during the period.
Equity investment MTM adjustments. We record our proportionate share of earnings from our equity investment in Virgin Atlantic and Aeroméxico in non-operating expense. We adjust for these MTM adjustments to allow investors to understand and analyze our core financial performance in the periods shown.
Restructuring and other and Loss on extinguishment of debt. Because of the variability from period to period, the adjustments for these items are helpful to investors to analyze the company’s recurring core performance in the periods shown.
| Year Ended | Year Ended | Year Ended | Year Ended | |||||||||||||
| (in billions) | December 31, 2017 | December 31, 2016 | December 31, 2015 | December 31, 2014 | ||||||||||||
| GAAP | $ | 5.5 | $ | 6.4 | $ | 7.2 | $ | 1.1 | ||||||||
| Adjusted for: | ||||||||||||||||
| MTM adjustments and settlements | (0.3 | ) | (0.4 | ) | (1.3 | ) | 2.3 | |||||||||
| Equity investment MTM adjustments | 0.1 | (0.1 | ) | – | 0.1 | |||||||||||
| Restructuring and other | – | – | – | 0.7 | ||||||||||||
| Loss on extinguishment of debt | – | – | – | 0.3 | ||||||||||||
| Total adjustments | (0.2 | ) | (0.5 | ) | (1.3 | ) | 3.4 | |||||||||
| Non-GAAP | $ | 5.3 | $ | 5.9 | $ | 5.9 | $ | 4.5 | ||||||||
| 10 |
Non-GAAP Reconciliations
Operating Cash Flow, adjusted
We adjusted operating cash flow because management believes this metric is helpful to investors to evaluate the company's ability to generate cash that is available for use for capital expenditures, debt service or general corporate initiatives. Adjustments include:
Hedge deferrals, including early settlements. During the March 2015 quarter, we effectively deferred settlement of a portion of our fuel hedge portfolio by entering into transactions that, excluding market movements from the date of inception, would provide approximately $300 million in cash receipts during the second half of 2015 and require approximately $300 million in cash payments in 2016. During the March 2016 quarter, we further deferred settlement of a portion of our hedge portfolio until 2017 by entering into transactions that, excluding market movements from the date of inception, would provide approximately $300 million in cash receipts during the second half of 2016 and require approximately $300 million in cash payments in 2017. Additionally, during the June 2016 quarter, we early terminated certain of our outstanding deferral transactions and made cash payments of $170 million, including normal settlements. Operating cash flow is adjusted to include the impact of these deferral transactions in order to allow investors to understand the net impact of hedging activities in the periods shown.
Hedge margin and other. Operating cash flow is adjusted for hedge margin and other as we believe this adjustment removes the impact of current market volatility on our unsettled hedges and allows investors to understand and analyze the company’s core operational performance in the periods shown.
Reimbursements related to build-to-suit facilities and other. Management believes investors should be informed that these reimbursements for build-to-suit leased facilities effectively reduce net cash provided by operating activities and related capital expenditures.
Pension plan contribution. In 2017, we contributed $2 billion to our pension plans using net proceeds from our debt issuance. We adjusted operating cash flow to exclude this contribution to allow investors to understand the cash flows related to our core operations in the periods shown.
| Year Ended | Year Ended | Year Ended | Year Ended | |||||||||||||
| (in billions) | December 31, 2017 | December 31, 2016 | December 31, 2015 | December 31, 2014 | ||||||||||||
| Net cash provided by operating activities (GAAP) | $ | 5.1 | $ | 7.2 | $ | 7.9 | $ | 4.9 | ||||||||
| Adjustments: | ||||||||||||||||
| Hedge deferrals, including early settlements | (0.2 | ) | (0.1 | ) | 0.4 | – | ||||||||||
| Hedge margin and other | – | (0.1 | ) | (0.8 | ) | 0.9 | ||||||||||
| Reimbursements related to build-to-suit facilities and other | (0.1 | ) | – | (0.1 | ) | – | ||||||||||
| Pension plan contribution | 2.0 | – | – | – | ||||||||||||
| Net cash provided by operating activities, adjusted | $ | 6.8 | $ | 7.0 | $ | 7.4 | $ | 5.8 | ||||||||
| 11 |
Non-GAAP Reconciliations
Pre-tax Margin, Adjusted
We adjust pre-tax margin for MTM adjustments and settlements and equity investment MTM adjustments for the same reasons described under the heading pre-tax profit, adjusted. We then adjust for third-party refinery sales and unrealized gain/loss on investments to determine pre-tax margin, adjusted.
Third-party refinery sales. Refinery sales to third parties are not related to our airline segment. Adjusting for this item allows investors to better understand and analyze our core operational performance in the periods shown.
Unrealized gain/loss on investments. We record the unrealized gains/losses on our investments in GOL, China Eastern and Air France-KLM in non-operating expense. Adjusting for these gains/losses allows investors to better understand and analyze our core operational performance in the periods shown.
| Six Months Ended | ||||||||||||
| June 30, 2018 | June 30, 2017 | Change | ||||||||||
| Pre-tax margin | 9.6 | % | 13.5 | % | ||||||||
| Adjusted for: | ||||||||||||
| MTM adjustments and settlements | – | % | (0.7 | )% | ||||||||
| Equity investment MTM adjustments | (0.1 | )% | 0.2 | % | ||||||||
| Third-party refinery sales | 0.2 | % | 0.1 | % | ||||||||
| Unrealized gain/loss on investments | 1.0 | % | – | % | ||||||||
| Pre-tax margin, adjusted | 10.7 | % | 13.1 | % | (2.3 | )% | ||||||
| Year Ended | ||||||||||||
| December 31, 2017 | December 31, 2016 | Change | ||||||||||
| Pre-tax margin | 13.4 | % | 16.1 | % | ||||||||
| Adjusted for: | ||||||||||||
| MTM adjustments and settlements | (0.6 | )% | (1.1 | )% | ||||||||
| Equity investment MTM adjustments | – | % | (0.3 | )% | ||||||||
| Third-party refinery sales | 0.1 | % | 0.1 | % | ||||||||
| Pre-tax margin, adjusted | 12.9 | % | 14.8 | % | (1.8 | )% | ||||||
| 12 |
Non-GAAP Reconciliations
Non-Fuel Unit Cost or Cost per Available Seat Mile (“CASM-Ex”)
We adjust CASM for the following items to determine CASM-Ex for the reasons described below:
Aircraft fuel and related taxes. The volatility in fuel prices impacts the comparability of year-over-year financial performance. The adjustment for aircraft fuel and related taxes allows investors to understand and analyze our non-fuel costs and year-over-year financial performance.
Ancillary businesses and refinery. These expenses include aircraft maintenance and staffing services we provide to third parties, our vacation wholesale operations and refinery cost of sales to third parties. Because these businesses are not related to the generation of a seat mile, we adjust for the costs related to these areas to provide a more meaningful comparison of the costs of our airline operations to the rest of the airline industry.
Profit sharing. We adjust for profit sharing because this adjustment allows investors to better understand and analyze our recurring cost performance and provides a more meaningful comparison of our core operating costs to the airline industry.
| Three Months Ended | ||||||||||||
| June 30, 2018 | June 30, 2017 | Change | ||||||||||
| CASM (cents) | 14.73 | 13.23 | ||||||||||
| Adjusted for: | ||||||||||||
| Aircraft fuel and related taxes | (3.41 | ) | (2.55 | ) | ||||||||
| Ancillary businesses and refinery | (0.72 | ) | (0.44 | ) | ||||||||
| Profit sharing | (0.58 | ) | (0.51 | ) | ||||||||
| CASM-Ex | 10.02 | 9.73 | 2.9 | % | ||||||||
| Three Months Ended | ||||||||||||
| March 31, 2018 | March 31, 2017 | Change | ||||||||||
| CASM (cents) | 15.35 | 14.00 | ||||||||||
| Adjusted for: | ||||||||||||
| Aircraft fuel and related taxes | (3.12 | ) | (2.56 | ) | ||||||||
| Ancillary businesses and refinery | (0.83 | ) | (0.51 | ) | ||||||||
| Profit sharing | (0.30 | ) | (0.26 | ) | ||||||||
| CASM-Ex | 11.10 | 10.67 | 3.9 | % | ||||||||
| Year Ended | ||||||||||||
| December 31, 2017 | December 31, 2016 | Change | ||||||||||
| CASM (cents) | 13.83 | 12.89 | ||||||||||
| Adjusted for: | ||||||||||||
| Aircraft fuel and related taxes | (2.66 | ) | (2.38 | ) | ||||||||
| Ancillary businesses and refinery | (0.58 | ) | (0.47 | ) | ||||||||
| Profit sharing | (0.42 | ) | (0.44 | ) | ||||||||
| CASM-Ex | 10.17 | 9.60 | 5.9 | % | ||||||||
| 13 |