Attached files
| file | filename |
|---|---|
| EX-99.1 - EXHIBIT 99.1 - CASEYS GENERAL STORES INC | annualmeetingpreparedremar.htm |
| 8-K - 8-K - CASEYS GENERAL STORES INC | a8-k2018annualmeeting.htm |

Annual Shareholders’ Meeting Fiscal Year Ended April 30, 2018
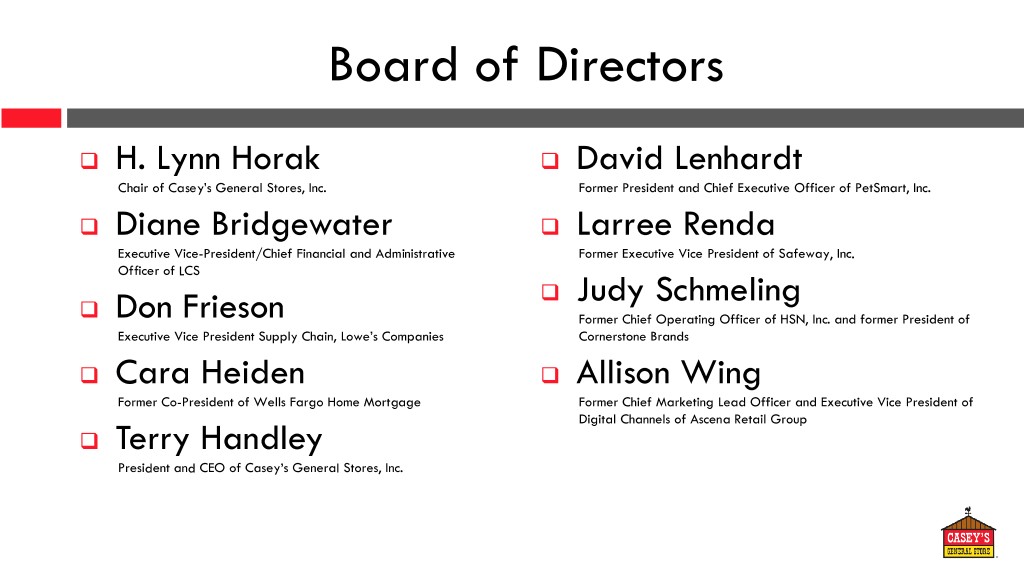
Board of Directors H. Lynn Horak David Lenhardt Chair of Casey’s General Stores, Inc. Former President and Chief Executive Officer of PetSmart, Inc. Diane Bridgewater Larree Renda Executive Vice-President/Chief Financial and Administrative Former Executive Vice President of Safeway, Inc. Officer of LCS Judy Schmeling Don Frieson Former Chief Operating Officer of HSN, Inc. and former President of Executive Vice President Supply Chain, Lowe’s Companies Cornerstone Brands Cara Heiden Allison Wing Former Co-President of Wells Fargo Home Mortgage Former Chief Marketing Lead Officer and Executive Vice President of Digital Channels of Ascena Retail Group Terry Handley President and CEO of Casey’s General Stores, Inc.

Special Guests Sean Vicente Partner, KPMG LLP Bill Noth Securities Counsel, Ahlers & Cooney Firm Ginger Lawrence Transfer Agent and Registrar, Computershare Trust Company
Annual Shareholders’ Meeting
Forward-Looking Statements This presentation contains statements that may constitute forward-looking statements within the meaning of the Private Securities Litigation Reform Act of 1995. These forward-looking statements include any statements relating to our possible or assumed future results of operations, business strategies, growth opportunities and performance improvements at our stores. There are a number of known and unknown risks, uncertainties and other factors that may cause our actual results to differ materially from any future results expressed or implied by those forward-looking statements, which are described in our most recent Annual Report on Form 10-K and Quarterly Reports on Form 10-Q as filed with the SEC and available on our website. Any forward-looking statements made in this presentation reflect our current views as of the date of this presentation with respect to future events, and Casey's disclaims any intention or obligation to update or revise forward-looking statements, whether as a result of new information, future events or otherwise. This presentation is dated as of September 5, 2018 and speaks as of that date.

Casey’s Mission To provide quality products at competitive prices with courteous service in clean stores at convenient locations. To provide a work environment where employees are treated with respect, dignity and honesty and where high performance is expected and rewarded. To provide shareowners with a fair return on investment. Our Purpose Our Values To make the daily lives of our Positive, Polite, customers & communities better. Professional and Proud

Fuel Gallons Sold Same-store Gallons Sold Fuel Gallons Sold (in Millions) Fiscal 2018 Actual 2,199 2,062 2.3% 1,952 1,817 Fiscal 2019 Guidance 1,666 1.5% - 3.0% 2014 2015 2016 2017 2018 Fiscal Year

Fuel Gross Profit Average Margin Fuel Gross Profit (in Millions) Fiscal 2018 Actual $407 $382 $378 18.5 cpg $351 Fiscal 2019 Guidance $268 18.5 – 20.5 cpg 2014 2015 2016 2017 2018 Fiscal Year
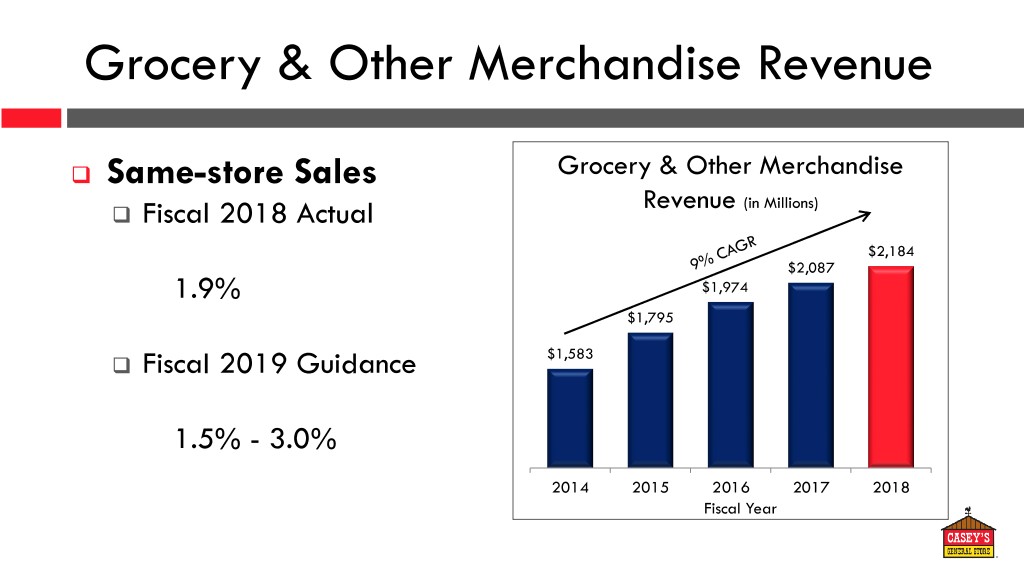
Grocery & Other Merchandise Revenue Same-store Sales Grocery & Other Merchandise Fiscal 2018 Actual Revenue (in Millions) $2,184 $2,087 1.9% $1,974 $1,795 Fiscal 2019 Guidance $1,583 1.5% - 3.0% 2014 2015 2016 2017 2018 Fiscal Year
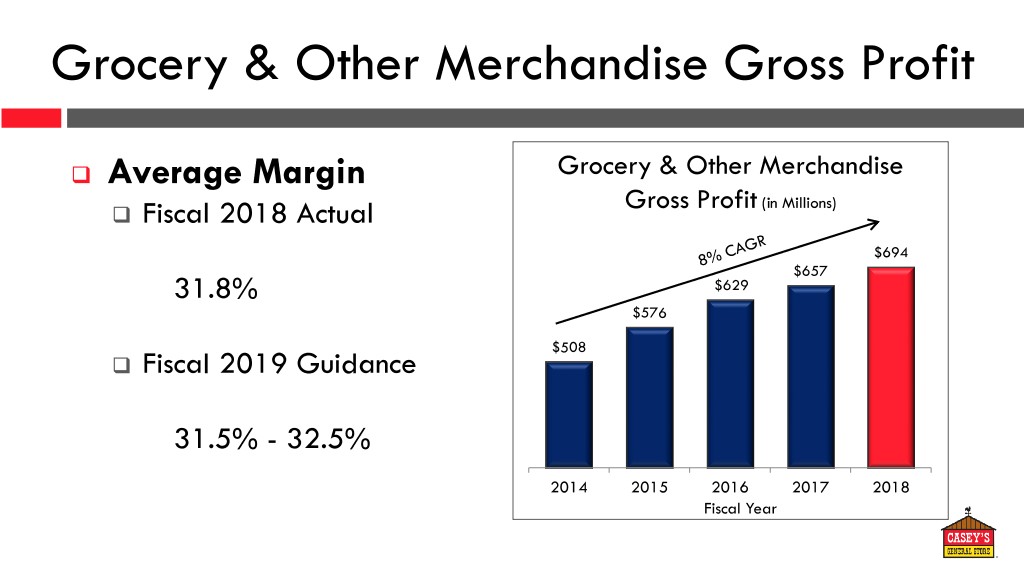
Grocery & Other Merchandise Gross Profit Average Margin Grocery & Other Merchandise Fiscal 2018 Actual Gross Profit (in Millions) $694 $657 31.8% $629 $576 $508 Fiscal 2019 Guidance 31.5% - 32.5% 2014 2015 2016 2017 2018 Fiscal Year

Prepared Food & Fountain Revenue Same-store Sales Prepared Food & Fountain Fiscal 2018 Actual Revenue (in Millions) $1,006 $953 1.7% $881 $781 Fiscal 2019 Guidance $659 1.5% - 3.5% 2014 2015 2016 2017 2018 Fiscal Year
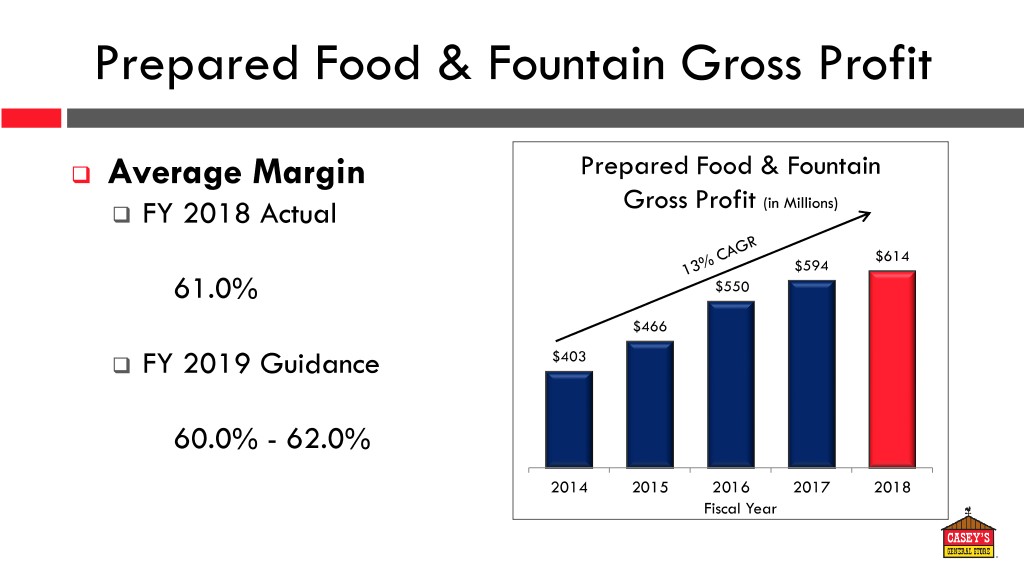
Prepared Food & Fountain Gross Profit Average Margin Prepared Food & Fountain FY 2018 Actual Gross Profit (in Millions) $614 $594 61.0% $550 $466 FY 2019 Guidance $403 60.0% - 62.0% 2014 2015 2016 2017 2018 Fiscal Year

Fiscal 2019 Guidance Same-store Sales Average Margin Fuel (gallons and cpg) 1.5% - 3.0% 18.5 - 20.5 Grocery and other merchandise 1.5% - 3.0% 31.5% - 32.5% Prepared food & fountain 1.5% - 3.5% 60.0% - 62.0% Other Guidance Operating expenses (including the Value Creation Plan) 8.5% - 10.5% Depreciation and amortization 14.0% - 16.0% New Store Construction 60 Stores Acquisitions 20+ Stores
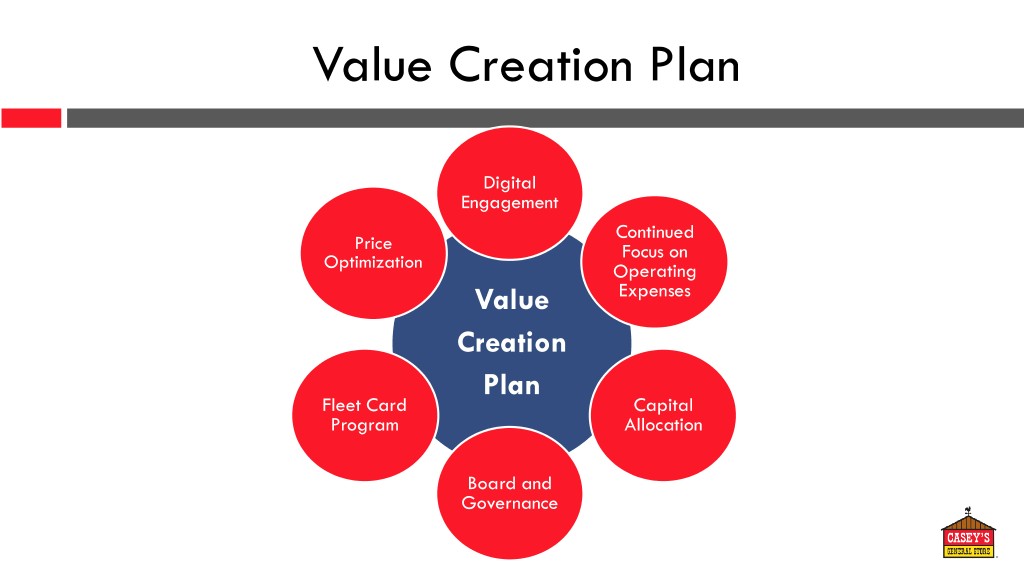
Value Creation Plan Digital Engagement Continued Price Focus on Optimization Operating Value Expenses Creation Plan Fleet Card Capital Program Allocation Board and Governance

Board and Governance – Elected Independent Chair – Added 5 Highly Qualified Independent Directors • 8 of 9 Directors are Independent • 5 Female and 4 Male Directors • Geographic Diversity Among Directors • Average Director Tenure is Four Years – Adopted Proxy Access – Implemented Director Age Limit – Implemented Director Tenure Limit – Adopting Majority Voting in Director Elections (Subject to Shareholder Approval) – Based on Recent Iowa Law Change Will Begin a Phased Declassification of the Board Starting in 2019

Fleet Card Program Opportunity to dramatically Customer improve Casey’s fleet sales Data based on comparison of current program with industry Repeat benchmarks Purchases and Increased Partnered with FLEETCOR, a Customer Fleet Card Fuel Sales leading global provider of Loyalty commercial payment solutions Higher Casey’s locations and in-store In-store offerings are ideally aligned Sales with third-party study of fleet driver preferences Fuel and In-Store Sales Benefits Expected by Q3 Fiscal 2019
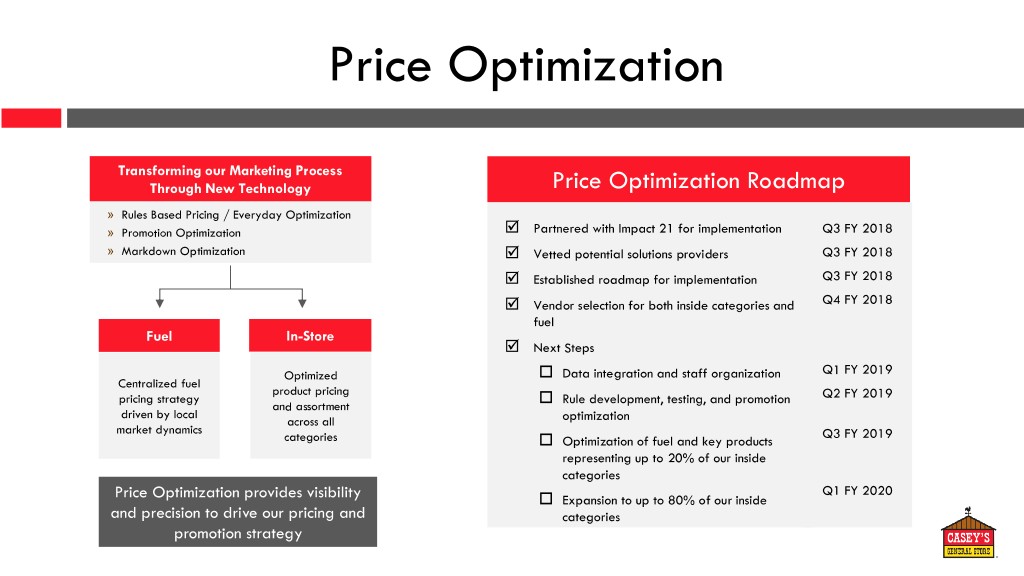
Price Optimization Transforming our Marketing Process Through New Technology Price Optimization Roadmap » Rules Based Pricing / Everyday Optimization » Promotion Optimization Partnered with Impact 21 for implementation Q3 FY 2018 » Markdown Optimization Vetted potential solutions providers Q3 FY 2018 Established roadmap for implementation Q3 FY 2018 Vendor selection for both inside categories and Q4 FY 2018 fuel Fuel In-Store Next Steps Optimized Data integration and staff organization Q1 FY 2019 Centralized fuel product pricing pricing strategy Rule development, testing, and promotion Q2 FY 2019 and assortment driven by local across all optimization market dynamics Q3 FY 2019 categories Optimization of fuel and key products representing up to 20% of our inside categories Q1 FY 2020 Price Optimization provides visibility Expansion to up to 80% of our inside and precision to drive our pricing and categories promotion strategy

Digital Engagement Identify and Provide Seamless Understand Convenience for Digital Journey Customers Customers Partnered with Deloitte Digital team to develop FY 2018 Digital detailed business case and roadmap Strategy Objectives New CMO who will lead digital implementation Website enhancement design phase FY 2019 Enterprise and services integration Implement Personalized In-store technology design, build and pilot Marketing and Rewards Integrated commerce platform Enhanced customer analytics and digital – Seamless: A frictionless e-commerce engagement experience across all customer facing Mobile app redesign and pilot FY 2020- touchpoints 2021 Mobile app launch – Agile: Exceed customer expectations Loyalty program through technology and organizational capabilities In-store technology integration Expansion of online products and services – Intelligent: Know every one of our customers (through CRM analytics) – Proactive: Acquire and continually delight our customer (through CRM analytics, Expect to begin realizing significant loyalty, digital marketing) benefits in FY 2020

Continued Focus on Operating Expenses Cost Reduction Measures Operating Expenses at Unchanged Stores* – Discontinued Automatic Pay Raises for Q4 FY 2017 6.6% Store Employees at 90 Days 5.7% – Refined Store Scheduling Q4 FY 2017 – Adjusted Merit Pay Budget Q1 FY 2018 4.5% 4.2% – Adjusted Shift Differential Hours Q3 FY 2018 3.7% – Limited Shift Overlap Q3 FY 2018 – Completed Pizza Delivery Actions and Q3 FY 2018 Enhanced System for Ongoing Review – 24 Hour Store Hours Adjustment and Q4 FY 2018 Enhanced System for Ongoing Review – New Fleet Management System Q3/Q4 FY 2018 – Adjusted Merit Pay Budget Q1 FY 2019 2014 2015 2016 2017 2018 – Continued evaluation of alternatives to Ongoing optimize distribution related to Fiscal Year anticipated additional sales volume * Stores not impacted by recent growth programs.

Capital Allocation $150 million+ Anticipated Incremental Capital Available in FY 2019 vs. FY 2018 Capital Allocation Priorities – Anticipated tax reform benefits – Invest in high return growth and profitability – Reduced capital requirements for store upgrades initiatives • Since FY 2009, store base has been significantly upgraded, addressing targeted locations • Digital Engagement • Based on a holistic analysis of market and store • Price Optimization characteristics, future capital requirements for replacements and remodels will be limited – Disciplined store growth – Strategic acquisition opportunities 1,500 ~65% of total stores have been 65% replaced, remodeled, acquired or 61% – Return capital to shareholders newly constructed since FY 2009 53% 45% 1,000 39% 34% 26% 21% 500 7% 2% Number of of Stores Number 0 2009 2010 2011 2012 2013 2014Fiscal2015 Year 2016 2017 YTD 2018 Major Remodels Replacements Acquisitions New Store Constructions % of Total Store Count
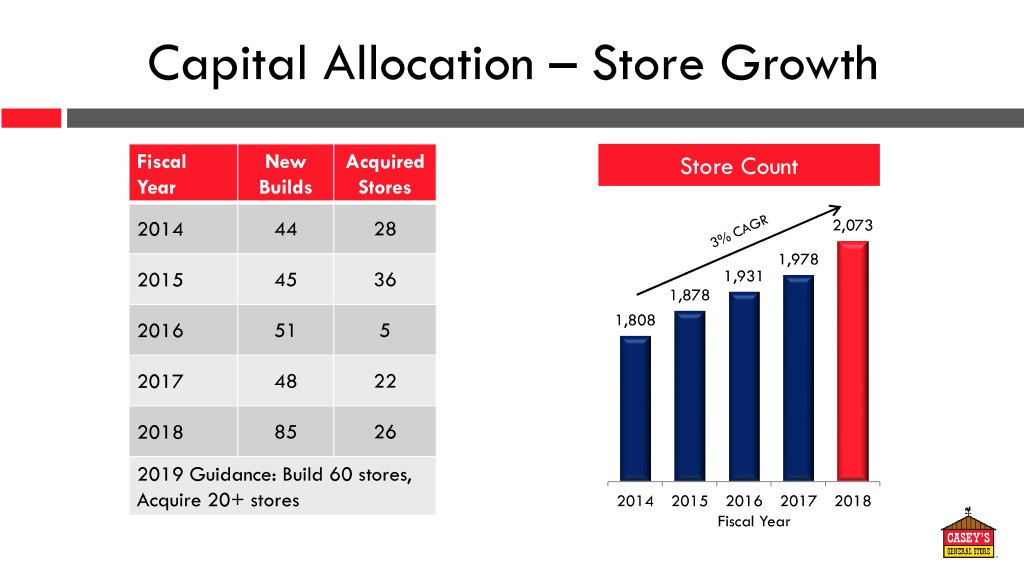
Capital Allocation – Store Growth Fiscal New Acquired Store Count Year Builds Stores 2014 44 28 2,073 1,978 2015 45 36 1,931 1,878 2016 51 5 1,808 2017 48 22 2018 85 26 2019 Guidance: Build 60 stores, Acquire 20+ stores 2014 2015 2016 2017 2018 Fiscal Year

Capital Allocation – Capital Expenditures Budget Fiscal 2019 Budget New Store Construction & Acquisitions $318 million Replacements $33 million Maintenance $54 million Transportation & Information Systems $61 million Total Capital Expenditures $466 million

Capital Allocation – Dividends & Share Repurchases Dividends Share Repurchases – 18 Consecutive – Completed Initial $1.04 Years of $300 Million $0.96 Dividend Authorization in $0.88 Increases May 2018 $0.80 – Board Approved $0.72 – New $300 Million A Quarterly Authorization Dividend Through Fiscal 2020 Increase to $0.29 Per Share at June 2018 Meeting 2014 2015 2016 2017 2018 Fiscal Year
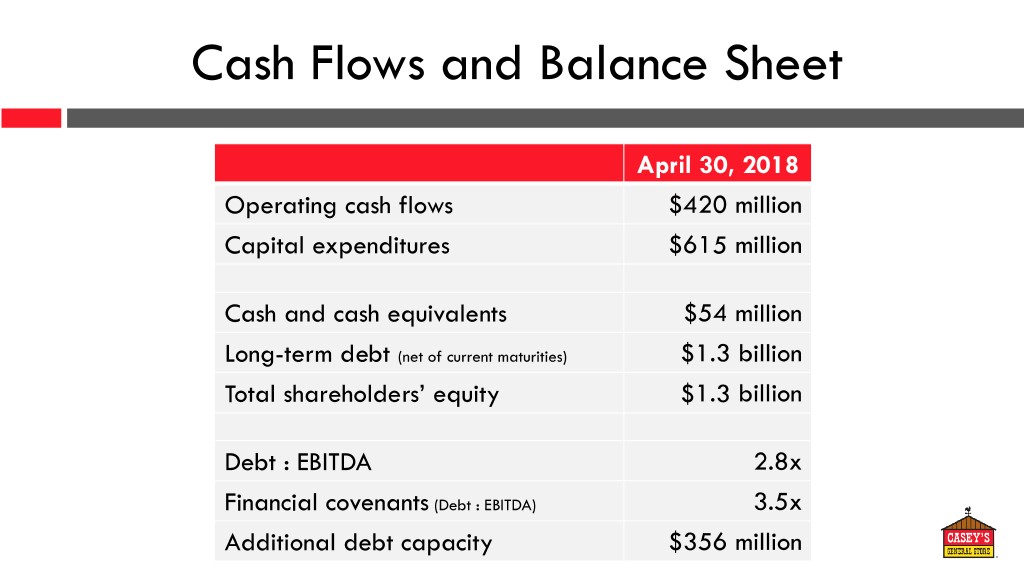
Cash Flows and Balance Sheet April 30, 2018 Operating cash flows $420 million Capital expenditures $615 million Cash and cash equivalents $54 million Long-term debt (net of current maturities) $1.3 billion Total shareholders’ equity $1.3 billion Debt : EBITDA 2.8x Financial covenants (Debt : EBITDA) 3.5x Additional debt capacity $356 million

Diluted Earnings Per Share Diluted Earnings Per Share 17% total increase in last 5 years $5.73 $4.62 $4.48 $3.81 $3.26 127% total increase in last 10 years 2014 2015 2016 2017 2018* Fiscal Year * Excludes one-time tax benefit from the Tax Cuts and Jobs Act of 2017.
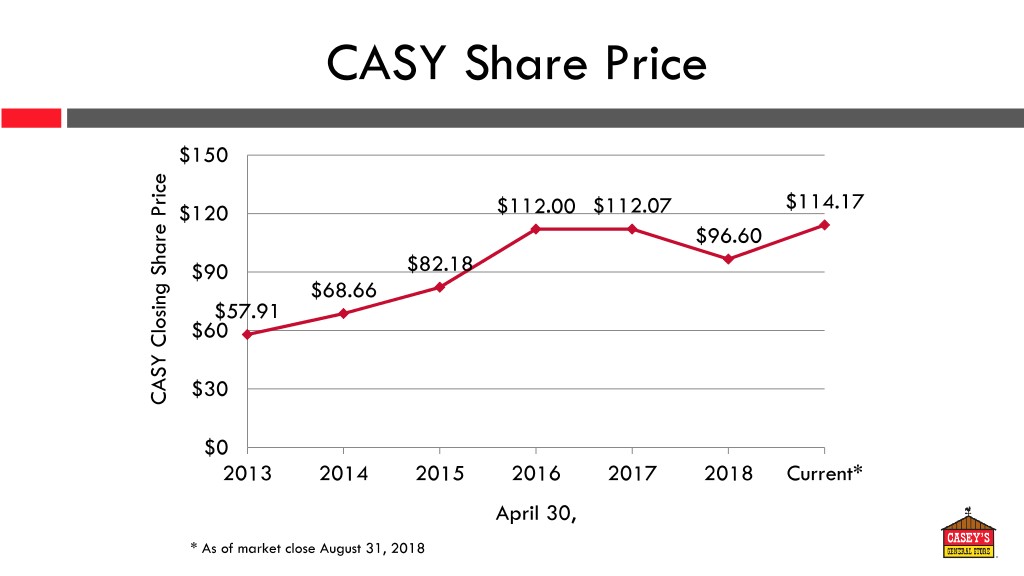
CASY Share Price $150 $114.17 $120 $112.00 $112.07 $96.60 $90 $82.18 $68.66 $57.91 $60 $30 CASY CASY Closing Share Price $0 2013 2014 2015 2016 2017 2018 Current* April 30, * As of market close August 31, 2018

Total Shareholder Return $250 $199 $201 $207 $200 $175 $145 $150 $120 $100 $100 Investment $50 $0 2013 2014 2015 2016 2017 2018 Current* April 30, The graph assumes a $100 investment in the Company’s Common Stock on April 30, 2013 and reinvestment of all * As of market close August 31, 2018 dividends. The total shareholder return shown is not intended to be indicative of future returns.

Annual Shareholders’ Meeting

Management Team Terry Handley Cindi Summers Kirk Haworth President and Chief Executive Officer Senior VP – Human Resources VP – Real Estate Bill Walljasper Darryl Bacon Sam James Senior VP, Chief Financial Officer VP – Food Service VP – Finance Julie Jackowski Jay Blair James Pistillo Senior VP, Corporate General Counsel & Secretary VP – Transportation & Distribution VP – Accounting & Treasurer Brian Johnson Hal Brown Mike Richardson Senior VP – Store Development VP – Support Services VP – Marketing Chris Jones Bob Ford Rich Schappert Senior VP – Chief Marketing Officer VP – Store Operations VP – Information Technology Jay Soupene Deb Grimes Senior VP – Operations VP – Fuel Procurement
Annual Shareholders’ Meeting
Thank you for your investment
