Attached files
| file | filename |
|---|---|
| 8-K - FORM 8-K - ConnectOne Bancorp, Inc. | f8k_090418.htm |
Exhibit 99.1
CNOB September 2018 Investor Presentation

This presentation contains forward - looking statements . Any statements about our expectations, beliefs, plans, predictions, forecasts, objectives, assumptions or future events or performance are not historical facts and may be forward - looking . These statements are often, but not always, made through the use of words or phrases such as “anticipate,” “believes,” “can,” “could,” “may,” “predicts,” “potential,” “should,” “will,” “estimate,” “plans,” “projects,” “continuing,” “ongoing,” “expects,” “intends” and similar words or phrases . Accordingly, these statements are only predictions and involve estimates, known and unknown risks, assumptions and uncertainties that could cause actual results to differ materially from those expressed in them . Our actual results could differ materially from those anticipated in such forward - looking statements as a result of several factors more fully described under “Risk Factors” in our Annual Report on Form 10 - K, Item 1 A, filed with the Securities and Exchange Commission . Any or all of our forward - looking statements in this presentation may turn out to be inaccurate . The inclusion of this forward - looking information should not be regarded as a representation by us that the future plans, estimates or expectations contemplated by us will be achieved . We have based these forward - looking statements largely on our current expectations and projections about future events and financial trends that we believe may affect our financial condition, results of operations, business strategy and financial needs . There are important factors that could cause our actual results, level of activity, performance or achievements to differ materially from the results, level of activity, performance or achievements expressed or implied by the forward looking statements including, but not limited to the risk factors described above and : ( 1 ) changes in general economic and financial market conditions ; ( 2 ) changes in the regulatory environment ; ( 3 ) economic conditions generally and in the financial services industry ; ( 4 ) changes in the economy affecting real estate values ; ( 5 ) our ability to achieve loan and deposit growth ; ( 6 ) the completion of our future acquisitions or business combinations and our ability to integrate the acquired business into our business model ; ( 7 ) projected population and income growth in our targeted market areas ; and ( 8 ) volatility and direction of market interest rates and a weakening of the economy which could materially impact credit quality trends and the ability to generate loans . All forward - looking statements are necessarily only estimates of future results and actual results may differ materially from expectations . You are, therefore, cautioned not to place undue reliance on such statements which should be read in conjunction with the other cautionary statements that are included elsewhere in this presentation . Further, any forward - looking statement speaks only as of the date on which it is made and we undertake no obligation to update or revise any forward - looking statement to reflect events or circumstances after the date on which the statement is made or to reflect the occurrence of unanticipated events . Forward Looking Statements

About ConnectOne Bancorp, Inc. o Client first and sense of urgency in every business decision from the top of organization to the bottom Strong Culture o Formed as a de novo in 2005 to take advantage of poor customer service offered to middle market customers by other institutio ns $5.3 Billion in Total Assets ConnectOne is a high growth, high performing commercial bank serving the New York & New Jersey metro market. 3 o One of the most efficient banks in the US due to structure, leveraging technology & operating philosophy Best In - Class Efficiency o 90% of loan portfolio o 65% of deposit base Commercial Lending Focus

Strong Franchise, Attractive Markets Strategically placed offices throughout NY/NJ metro area 4 The market we operate in accounts for approximately $2 trillion of the $18 trillion United States GDP Market is largely dominated by the largest institutions in the country, leaving tremendous opportunity for banks catering to middle market businesses Expansion in the New York Market Densely populated, lucrative markets Demand for personalized service amongst small to midsize business owners o Currently represents over 20% of our balance sheet o More than 2 million small businesses in New York o Recent office additions in New York located in Manhattan, Long Island and to Astoria, Queens

A History of Growth & Performance 5 *Analyst consensus per SNL Dollars in billions, except for per share data $4.0 $4.4 $5.1 $5.3 $3.1 $3.6 $4.2 $4.4 $2.8 $3.3 $3.8 $3.9 12/31/15 12/31/16 12/31/17 6/30/18 Assets Loans Deposits $10.51 $11.96 $13.01 $14.36 12/31/15 12/31/16 12/31/17 Projected 12/31/2018* Tangible Book Value Per Share 132% 99% CNOB KBW Index Stock Price Performance Since Legacy CNOB IPO

High Operating* Performance 6 Technology & Infrastructure ROAA ROATCE EPS Operating Efficiency Ratio * Excludes the impact of charges related to the Bank's taxi medallion portfolio and non - operating items including net gains on sal es of securities, deferred tax valuation charge, and tax benefits on employee share - based awards. See appendix for a reconciliation of GAAP and non - GAAP measures. 1.18% 1.25% 1.32% 1.37% 1.37% 2Q 2017 3Q 2017 4Q 2017 1Q 2018 2Q 2018 13.4% 14.5% 15.6% 16.4% 16.5% 2Q 2017 3Q 2017 4Q 2017 1Q 2018 2Q 2018 $0.41 $0.46 $0.51 $0.53 $0.54 2Q 2017 3Q 2017 4Q 2017 1Q 2018 2Q 2018 41.6% 39.3% 38.0% 42.5% 41.9% 30.0% 35.0% 40.0% 45.0% 50.0% 2Q 2017 3Q 2017 4Q 2017 1Q 2018 2Q 2018

The financial services arena is changing quickly and ConnectOne is an early adopter. Empowering our staff with the best possible tools and resources that enhance our excellent reputation for “sense of urgency” wit h our clients nCino Leading Edge Technology Initiatives Building for the Future 7 o Provides ConnectOne with one of the most efficient and streamlined deposit & loan operating systems in the industry o Supports our best - in - class efficiency metrics and enhances our excellent reputation for “sense of urgency” with our clients Zelle o A consortium of the top 30+ banks in the country to provide real - time payments right from your mobile banking app Other Initiatives o One of the first banks to go live on Oracle’s Fusion Cloud based general ledger system o Online account opening o Advanced branch office model

Investments in technology enhance our deposit & loan gathering abilities Reflects structural uniqueness of ConnectOne Peer Median*: $6.6MM We are ~3x peer median for: o Deposits per branch office o Loans per branch office o A ssets per branch office Efficient Banking Model One of the Best Efficiency Ratios in the Industry 42% Operating Efficiency Ratio 1) $ 17.4MM Assets Per Employee 3X Locations serve as “business hubs” supporting clients beyond geographic footprint * Peer group includes banks and thrifts between $1.0B and $7.5B in assets located in Northeast and Mid - Atlantic regions. Median r eflects the most recent 5 quarters of reported results. Data sourced from SNL Financial. 1) Non - GAAP measure, see appendix for a reconciliation of GAAP and non - GAAP measures. Technology offers ability to leverage offices to drive more business within our footprint 8

9 Diversified Loan Portfolio As of 6/30/18 - $4.4 Billion Other CRE 34% Multifamily 34% Business Loans 25% Residential/ Consumer 7% Type Balance (MM) Percentage Type Balance (MM) Percentage CRE - Retail $342 ϴй Warehouse / Industrial $83 Ϯй CRE - Other / Misc 188 ϰй OOC - Retail 76 Ϯй CRE - Office 154 ϰй OOC - Office 60 ϭй CRE - Warehouse / Industrial 153 ϰй OOC - Office / Warehouse or Mixed Use 59 ϭй CRE - Land Loan for Future Development 120 ϯй OOC - Other 34 ϭй CRE - Mixed Use 76 Ϯй Total CRE - Owner Occupied 312 ϳй CRE - Land Loan (Land Only ) 25 ϭй Total CRE - Non - Owner Occupied 1,058 Ϯϲй C&I - Service 230 ϱй Commercial - Schools 167 ϰй Construction - Multifamily 196 ϰй C&I - Contactors 109 Ϯй Construction - 1 to 4 Family 189 ϰй C&I - Residential 1 to 4 Family 73 Ϯй Construction - Other 114 ϯй C&I - Other 69 Ϯй Total Construction 499 ϭϭй C&I - Transportation 37 ϭй Total CRE - Other $1,557 ϯϱй C&I - Distribution 34 ϭй C&I - Manufacturing 8 ф ϭй Multifamily - 25 to 64 units $543 ϭϮй Total C&I 727 ϭϳй Multifamily - 10 to 24 unit 415 ϭϬй Total Business Loans $1,039 Ϯϰй Multifamily - 100 units or more 260 ϲй Multifamily - 64 units to 99 units 140 ϯй Residential - 1st Lien $246 ϲй Multifamily - 5 to 9 units 122 ϯй Home Equity - 2nd Lien (LOC) 42 ϭй Total Multifamily $1,480 ϯϰй Total Residential $288 ϳй
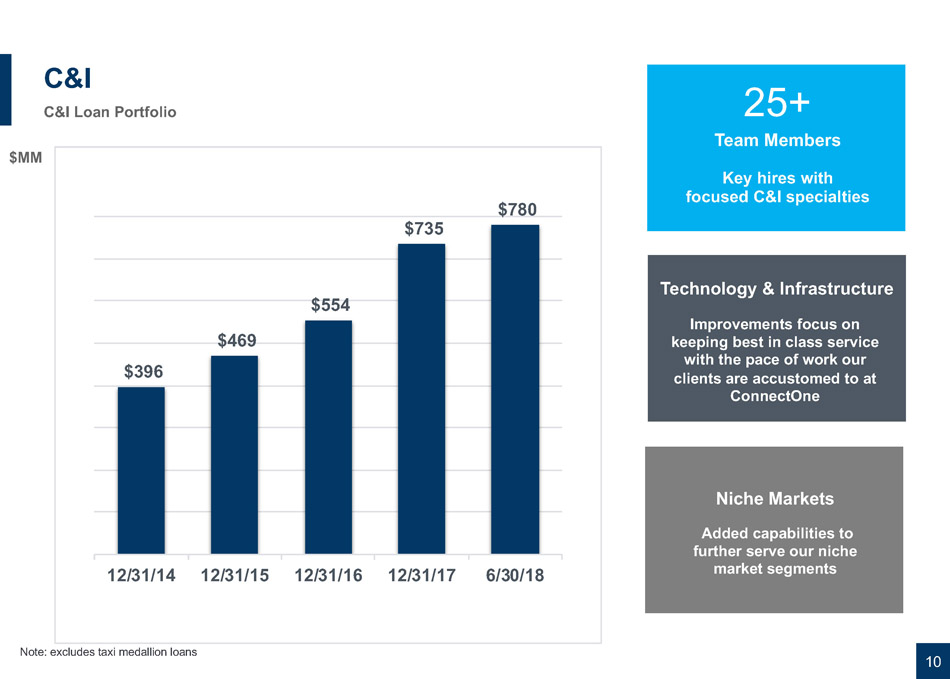
C&I C&I Loan Portfolio 10 Technology & Infrastructure Improvements focus on keeping best in class service with the pace of work our clients are accustomed to at ConnectOne 25 + Team Members Key hires with focused C&I specialties Note: excludes taxi medallion loans Niche Markets Added capabilities to further serve our niche market segments $396 $469 $554 $735 $780 12/31/14 12/31/15 12/31/16 12/31/17 6/30/18 $MM
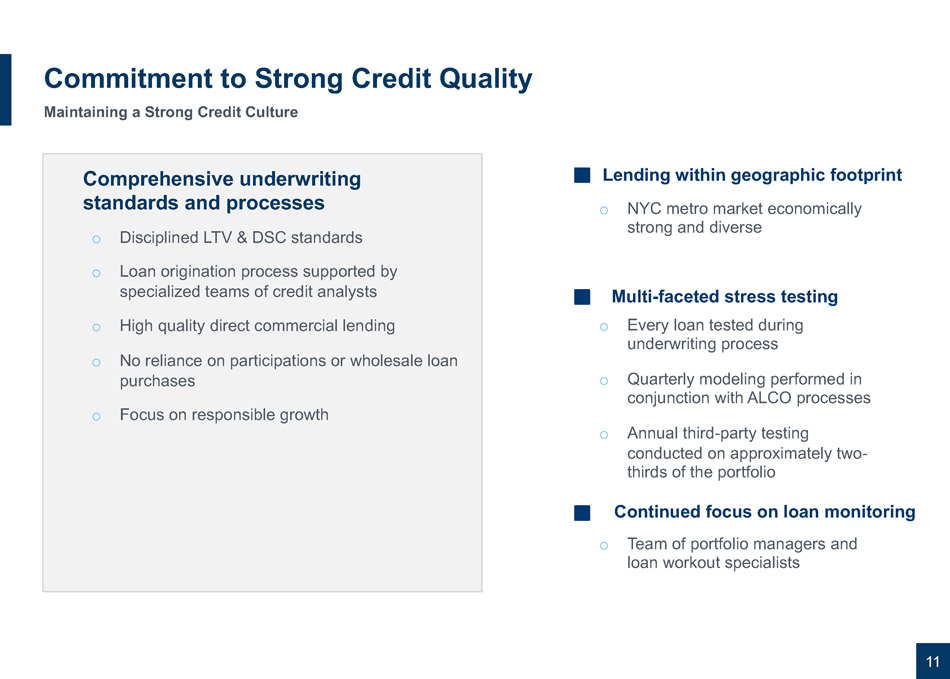
11 Commitment to Strong Credit Quality Maintaining a Strong Credit Culture o Disciplined LTV & DSC standards o Loan origination process supported by specialized teams of credit analysts o High quality direct commercial lending o No reliance on participations or wholesale loan purchases o Focus on responsible growth Comprehensive underwriting standards and processes Lending within geographic footprint Multi - faceted stress testing Continued focus on loan monitoring o NYC metro market economically strong and diverse o Every loan tested during underwriting process o Quarterly modeling performed in conjunction with ALCO processes o Annual third - party testing conducted on approximately two - thirds of the portfolio o Team of portfolio managers and loan workout specialists

Deposit Franchise 12 Deposit Composition 6/30/2018 Total Deposits $3.9 billion First Half 2018 Cost of Total Deposits 0.91% Demand Noninterest - bearing 20% Demand interest - bearing 19% Money Market 23% Savings 4% Time 34% $2,569 $3,093 $3,470 $3,756 Year Ended 2015 Year Ended 2016 Year Ended 2017 Six Months Ended June 30, 2018 Average Total Deposits ($MM) CAGR 16% $537 $625 $681 $722 Year Ended 2015 Year Ended 2016 Year Ended 2017 Six Months Ended June 30, 2018 Average Demand Noninterest - bearing ($MM) CAGR 13%
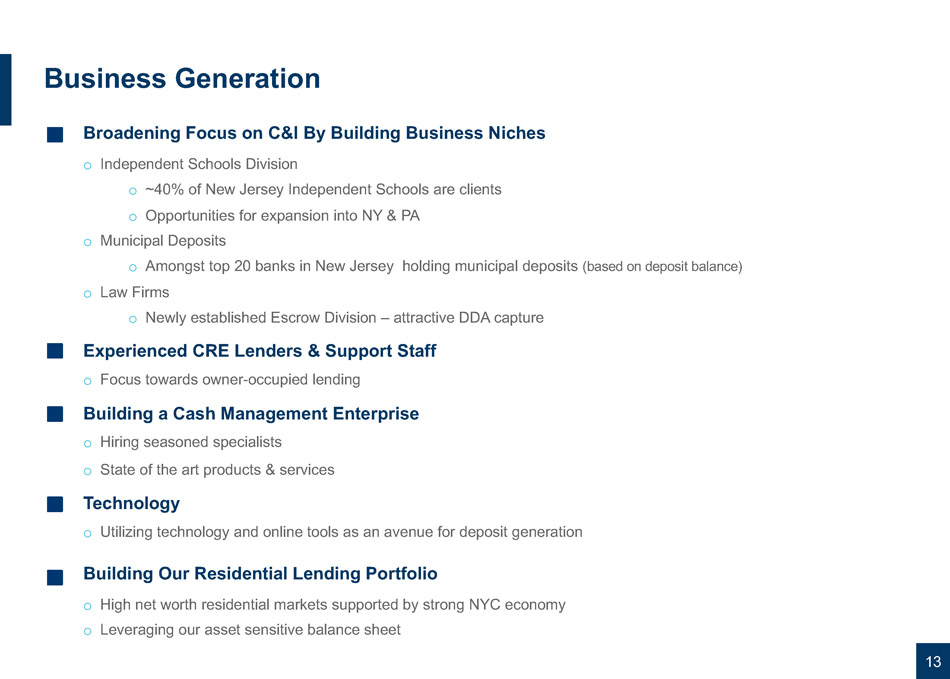
13 Business Generation Experienced CRE Lenders & Support Staff o Focus towards owner - occupied lending Broadening Focus on C&I By Building Business Niches o Independent Schools Division o ~40% of New Jersey Independent Schools are clients o Opportunities for expansion into NY & PA o Municipal Deposits o Amongst top 20 banks in New Jersey holding municipal deposits (based on deposit balance) o Law Firms o Newly established Escrow Division – attractive DDA capture Building Our Residential Lending Portfolio o High net worth residential markets supported by strong NYC economy o Leveraging our asset sensitive balance sheet Building a Cash Management Enterprise o Hiring seasoned specialists o State of the art products & services Technology o Utilizing technology and online tools as an avenue for deposit generation

The right amount of capital (6/30/18) o 8.40% TCE holding company o 10.43% leverage at bank o 12.42% total risk based at bank Operating ROATCE in excess of 16% Retained earnings supports growth, no equity offerings planned in foreseeable future Dividend of $0.075 per quarter; estimated payout ratio of 14%. No current plans for increase, or stock buybacks, but Board wi ll consider should performance returns exceed growth targets. Capital Allocation & Philosophy 14

Source: SNL Financial (1) As of and for the quarter ended March 31, 2018. (2) Core profitability excludes one - time personnel costs, legal expenses and a write - down to OREO all incurred during the quarter en ded March 31, 2018. (3) NPAs defined as nonaccrual loans and leases and real estate owned, excluding renegotiated loans and leases. Merger With Greater Hudson Bank Solidifying New York Operations and Accelerating Hudson Valley Market Growth 15 Greater Hudson Financial Highlights (1) Operates in the Rockland, Orange and Westchester markets Favorable competitive dynamics as market is largely dominated by the larger institutions, leaving tremendous opportunity for community banks catering to middle market businesses Total Assets ($MM) $501.3 Core ROAA (2) 0.77% Gross Loans ($MM) $340.7 Core ROAE (2) 6.59% Total Deposits ($MM) $401.7 NIM 3.59% TCE / TA 11.3% Yield on Loans 5.38% NPAs / Total Assets (3) 1.55% Cost of Deposits 0.80% CRE Concentration 336% Loans / Deposits 84.8% Strong core funding along with a low loan / deposit ratio of 85% (1) Niche market focus consisting of Hudson Valley private businesses, municipalities and non - profits combined with a heavy emphasis on personal service to drive business Asset sensitive balance sheet with a growing NIM of 3.59% (1) 15+ years of operating history in the Hudson Valley region, with a senior management team that boasts a combined 180+ years of banking experience - CNOB Branches - GHDS Branches Bronx Richmond Hudson Bergen ConnectOne Focus Market Last remaining community bank headquartered in Rockland County

16 Greater Hudson Transaction Delivers on Key 2018/2019 Priorities for ConnectOne… ConnectOne Greater Hudson Qualifications • ConnectOne is a high growth, high performing commercial bank serving the New York and New Jersey metro market • Focus market within 75 mile radius of New York City – strategically placed offices throughout NY/NJ x Strong commercial lending and deposit rich franchise operating in ConnectOne’s target focus area x Accelerates ConnectOne’s New York expansion and solidifies greater Hudson Valley market presence x Greater Hudson adds $341M in loans and $402M in deposits across demographically attractive Rockland, Orange and Westchester Counties x Brings team of seasoned lenders and core deposit gathering specialists • Core deposits: 80.5% (1) • Loans / deposits: 112.1% • Cost of deposits: 0.82% x Core deposits: 85.4% (1) x Loans / deposits: 84.8% x Cost of deposits: 0.80% • CRE concentration: 509% (2) x CRE concentration: 336% • Net interest margin: 3.26% • Yield on loans: 4.51% (3) • Total cost of funds: 1.10% x Net interest margin: 3.59% x Yield on loans: 5.38% (3) x Total cost of funds: 0.92% • Strong C&I, owner - occupied and residential lending capabilities x C&I team experienced in focused markets and SBA x Greater Hudson customers to be paired with powerful ConnectOne platform; provides significant potential to expand current and new business • Leading edge technology initiatives • Technological model incorporates nCino , Zelle and other digital platforms x Greater Hudson’s smaller scale limited investments in technological platform; results in substantial opportunities to leverage ConnectOne’s “future of banking” technologies CRE Concentration Margin Organic Growth Plan Technological Platform / Efficiency Lending Team Source: SNL Financial Note: Financial data as of and for the quarter ended March 31, 2018. (1) Core deposits defined as total deposits less jumbo time deposits (time deposits > 100K). (2) CRE concentration ratio based on bank level regulatory filings. (3) Yield on loans includes loans receivable and loans held - for - sale. Core Funding
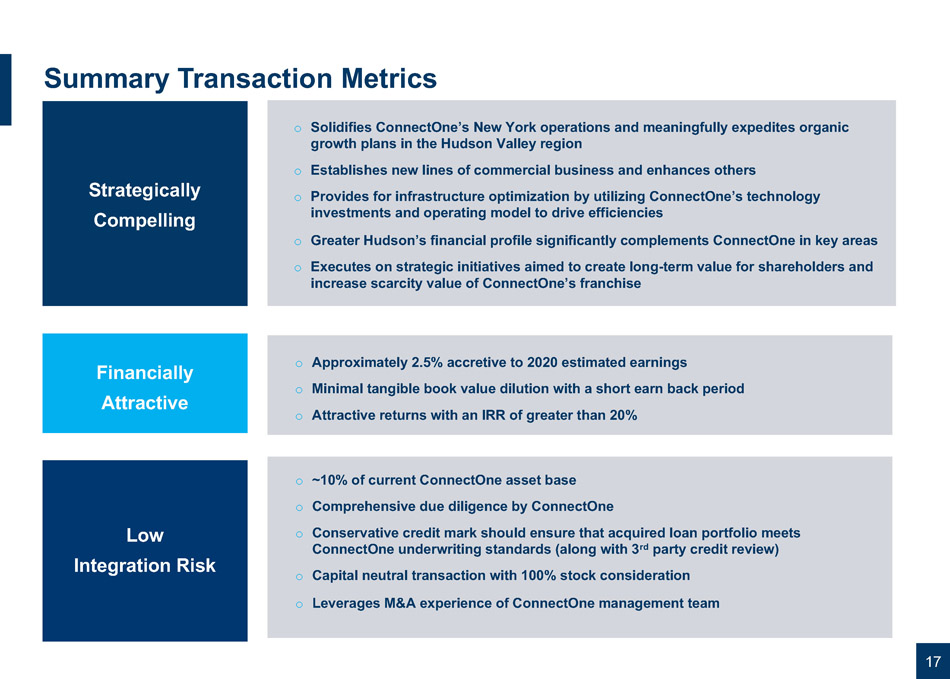
Strategically Compelling Financially Attractive Low Integration Risk 17 Summary Transaction Metrics o Solidifies ConnectOne’s New York operations and meaningfully expedites organic growth plans in the Hudson Valley region o Establishes new lines of commercial business and enhances others o Provides for infrastructure optimization by utilizing ConnectOne’s technology investments and operating model to drive efficiencies o Greater Hudson’s financial profile significantly complements ConnectOne in key areas o Executes on strategic initiatives aimed to create long - term value for shareholders and increase scarcity value of ConnectOne’s franchise o Approximately 2.5% accretive to 2020 estimated earnings o Minimal tangible book value dilution with a short earn back period o Attractive returns with an IRR of greater than 20% o ~10% of current ConnectOne asset base o Comprehensive due diligence by ConnectOne o Conservative credit mark should ensure that acquired loan portfolio meets ConnectOne underwriting standards (along with 3 rd party credit review) o Capital neutral transaction with 100% stock consideration o Leverages M&A experience of ConnectOne management team

18 A Compelling Investment Opportunity CNOB trades at an approximately 30% discount ($7.50 per share) to median peer P/E ratio. Further, given our growth profile, w e a rguably should be trading above median. o Proven track record in CRE; charge - offs near zero o Expansion of C&I, owner - occupied and residential lending o Annual regulatory exams o Skilled acquiror; completed complex MOE in 2014 o Recent Greater Hudson acquisition o Organic growth projection in low teens o Since 2013, stock price appreciation ~132% vs. BKX up ~99% o Recent ROA (ex. taxis) 1.38%, ROATCE (ex. taxis) 16.6% o Well above average growth in operating EPS and Tangible Book Value per share o Client first o Sense of Urgency o Driving shareholder returns o Continued strength in deposit growth, specifically DDA o High loan - to - deposit ratio is typical in our operating region o Strong breadth and depth of on/off balance sheet liquidity Funding challenges CRE concentrations viewed negatively by regulators Operating plan is challenged Price performance/shareholder return is just average Growth outlook Perceived Challenges Reality Market continues to present opportunities for an institution delivering on these values

Strategy & Vision Continued Growth The Company remains well - positioned to execute Achieving Continued Deposit Growth 19 Increasing & Expanding Commercial Client Relationships Expanding Our Presence in the New York Metro Market Expanding Cash Management Capabilities Utilizing a Modern Branch Office Model Continuing to Enhance Digital Channels
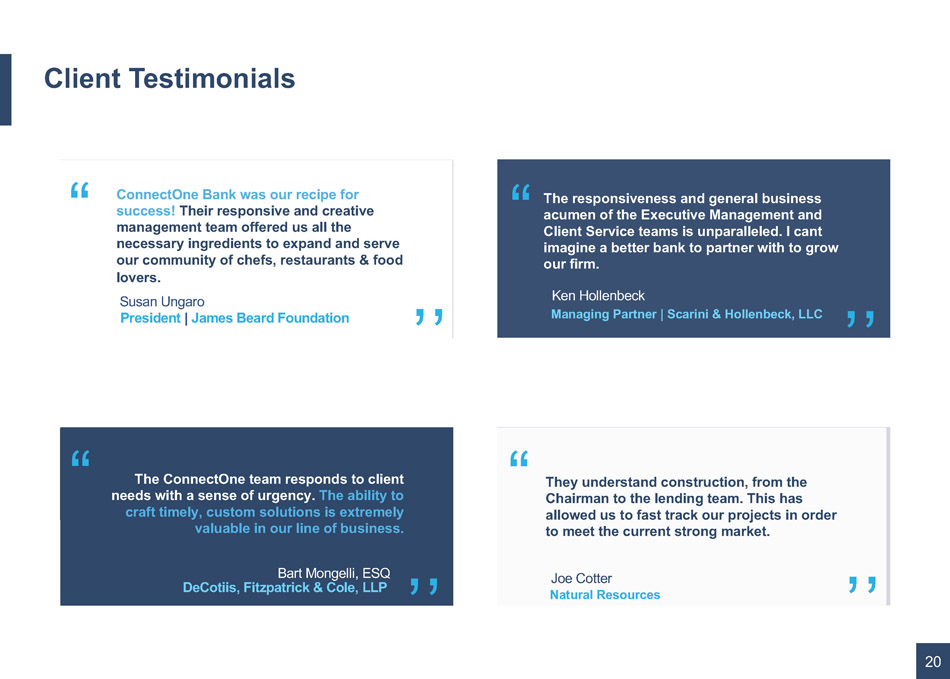
“ ,, ConnectOne Bank was our recipe for success! Their responsive and creative management team offered us all the necessary ingredients to expand and serve our community of chefs, restaurants & food lovers. “ ,, Client Testimonials 20 President | James Beard Foundation Susan Ungaro “ ,, The responsiveness and general business acumen of the Executive Management and Client Service teams is unparalleled. I cant imagine a better bank to partner with to grow our firm. The ConnectOne team responds to client needs with a sense of urgency. The ability to craft timely, custom solutions is extremely valuable in our line of business. Bart Mongelli, ESQ DeCotiis, Fitzpatrick & Cole, LLP They understand construction, from the Chairman to the lending team. This has allowed us to fast track our projects in order to meet the current strong market. “ ,, Ken Hollenbeck Managing Partner | Scarini & Hollenbeck, LLC Joe Cotter Natural Resources
21

22 Appendix

Commercial Real Estate Lending Focus 23 o ConnectOne has maintained high levels of CRE concentration for an extended period of time o Our combination of strong organic growth and sound asset quality is our hallmark o We continue to focus on loan diversification – Concentration mitigated by acceleration of our C&I capabilities o Risk management is a center piece of our strategy – Our policies and procedures have stood up to regulatory scrutiny o ConnectOne and Legacy ConnectOne regulated by the FDIC and NJ DOBI over the last 13+ years 436% 405% 398% 443% 395% 81% 110% 133% 125% 111% 0% 100% 200% 300% 400% 500% 600% 2014 2015 2016 2017 2Q 2018 CRE as a Percentage of Total Risk Based Capital CRE Construction
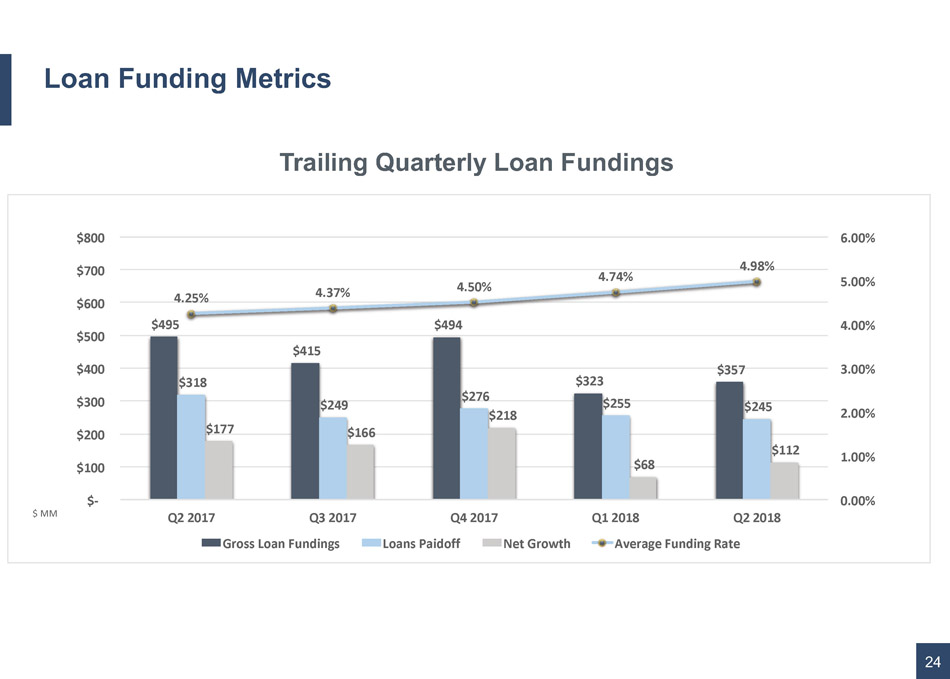
Loan Funding Metrics 24 $495 $415 $494 $323 $357 $318 $249 $276 $255 $245 $177 $166 $218 $68 $112 4.25% 4.37% 4.50% 4.74% 4.98% 0.00% 1.00% 2.00% 3.00% 4.00% 5.00% 6.00% $- $100 $200 $300 $400 $500 $600 $700 $800 Q2 2017 Q3 2017 Q4 2017 Q1 2018 Q2 2018 Gross Loan Fundings Loans Paidoff Net Growth Average Funding Rate $ MM Trailing Quarterly Loan Fundings

Credit Quality 25 0.31% 0.28% 0.38% 0.42% 0.41% 0.00% 0.50% 1.00% 1.50% 2.00% 2.50% 3.00% 6/30/17 9/30/17 12/31/17 3/31/18 6/30/18 NPAs/Total Assets (excluding taxi) NPAs/Total Assets 1.26% 1.29% .99% . 96% 1.36%

Appendix Reconciliation of GAAP and non - GAAP measures 26 June 30, Mar. 31, Dec. 31, Sept. 30, June 30, 2018 2018 2017 2017 2017 Reconciliation of GAAP Earnings to Earnings Excluding the Following Items: Net income 17,527$ 4,251$ 10,580$ 13,077$ 7,683$ Net gains on sales of securities (after taxes) - - - - - Deferred tax valuation charge - - 5,574 - - Tax benefit on employee share-based awards (ASU 2016-09) (49) (541) - - (133) Provision related to taxi medallion loans (after taxes) - 13,430 - - - Increase in valuation allowance, loans held-for-sale (after taxes) - - 182 1,776 5,719 Net income-adjusted 17,478$ 17,140$ 16,336$ 14,853$ 13,269$ Weighted average diluted shares outstanding 32,321,150 32,238,048 32,252,759 32,182,016 32,255,770 Diluted EPS (GAAP) 0.54$ 0.13$ 0.33$ 0.41$ 0.24$ Diluted EPS-adjusted (Non-GAAP) (1) 0.54 0.53 0.51 0.46 0.41 Return on Assets Measures Net income-adjusted 17,478$ 17,140$ 16,336$ 14,853$ 13,269$ Average assets 5,104,661$ 5,088,823$ 4,916,549$ 4,713,487$ 4,495,008$ Less: average intangible assets (148,046) (148,215) (148,383) (148,553) (148,737) Average tangible assets 4,956,615$ 4,940,608$ 4,768,166$ 4,564,934$ 4,346,271$ Return on avg. assets (GAAP) 1.38 % 0.34 % 0.85 % 1.10 % 0.69 % Return on avg. assets-adjusted (non-GAAP) (2) 1.37 1.37 1.32 1.25 1.18 Three Months Ended (dollars in thousands, except for per share data)

27 Appendix Reconciliation of GAAP and non - GAAP measures (cont.) June 30, Mar. 31, Dec. 31, Sept. 30, June 30, 2018 2018 2017 2017 2017 Return on Equity Measures Net income-adjusted 17,478$ 17,140$ 16,336$ 14,853$ 13,269$ Average common equity 574,992$ 575,029$ 567,308$ 556,620$ 549,748$ Less: average intangible assets (148,046) (148,215) (148,383) (148,553) (148,737) Average tangible common equity 426,946$ 426,814$ 418,925$ 408,067$ 401,011$ Return on avg. common equity (GAAP) 12.23 % 3.00 % 7.40 % 9.32 % 5.61 % Return on avg. common equity-adjusted (non-GAAP) (3) 12.19 12.09 11.42 10.59 9.68 Return on avg. tangible common equity (non-GAAP) (4) 16.58 4.15 10.11 12.81 7.80 Return on avg. tangible common equity-adjusted (non-GAAP) (5) 16.53 16.40 15.57 14.54 13.39 Efficiency Measures Total noninterest expenses 17,108$ 17,059$ 16,566$ 18,641$ 25,303$ Increase in valuation allowance, loans held-for-sale - - (267) (3,000) (9,725) Foreclosed property expense (11) (51) (32) (46) (71) Operating noninterest expense 17,097$ 17,008$ 16,267$ 15,595$ 15,507$ Net interest income (tax equivalent basis) 39,409$ 38,610$ 40,744$ 37,929$ 35,839$ Noninterest income 1,388 1,407 2,024 1,756 1,422 Net gains on sales of investment securities - - - - - Operating revenue 40,797$ 40,017$ 42,768$ 39,685$ 37,261$ Operating efficiency ratio (non-GAAP) (6) 41.9 % 42.5 % 38.0 % 39.3 % 41.6 % Three Months Ended (dollars in thousands)

28 Appendix Reconciliation of GAAP and non - GAAP measures (cont.) June 30, Mar. 31, Dec. 31, Sept. 30, June 30, 2018 2018 2017 2017 2017 Capital Ratios and Book Value per Share Common equity 578,557$ 564,266$ 565,437$ 557,691$ 546,173$ Less: intangible assets (147,936) (148,104) (148,273) (148,442) (148,611) Tangible common equity 430,621$ 416,162$ 417,164$ 409,249$ 397,562$ Total assets 5,275,368$ 5,158,368$ 5,108,442$ 4,844,755$ 4,681,280$ Less: intangible assets (147,936) (148,104) (148,273) (148,442) (148,611) Tangible assets 5,127,432$ 5,010,264$ 4,960,169$ 4,696,313$ 4,532,669$ Common shares outstanding 32,182,367 32,175,233 32,071,860 32,015,317 32,015,317 Common equity ratio (GAAP) 10.97 % 10.94 % 11.07 % 11.51 % 11.67 % Tangible common equity ratio (non-GAAP) (7) 8.40 8.31 8.41 8.71 8.77 Regulatory capital ratios (Bancorp): Leverage ratio 8.94 % 8.65 % 8.92 % 9.13 % 9.33 % Common equity Tier 1 risk-based ratio 9.33 9.14 9.15 9.40 9.48 Risk-based Tier 1 capital ratio 9.44 9.25 9.26 9.52 9.60 Risk-based total capital ratio 12.81 12.66 11.04 11.34 11.46 Regulatory capital ratios (Bank): Leverage ratio 10.44 % 10.20 % 9.84 % 10.11 % 10.34 % Common equity Tier 1 risk-based ratio 11.02 10.91 10.21 10.54 10.64 Risk-based Tier 1 capital ratio 11.02 10.91 10.21 10.54 10.64 Risk-based total capital ratio 12.42 12.31 10.90 11.22 11.32 Book value per share (GAAP) 17.98$ 17.54$ 17.63$ 17.42$ 17.06$ Tangible book value per share (non-GAAP) (8) 13.38 12.93 13.01 12.78 12.42 As of (dollars in thousands, except for per share data)

29 Appendix Reconciliation of GAAP and non - GAAP measures (cont.) June 30, Mar. 31, Dec. 31, Sept. 30, June 30, 2018 2018 2017 2017 2017 Asset Quality Nonaccrual taxi medallion loans 28,944$ 29,405$ 46,765$ 47,430$ 48,884$ Nonaccrual loans (excluding taxi medallion loans) 20,771 20,631 18,848 13,755 14,055 Other real estate owned 1,076 1,076 538 - 580 Total nonperforming assets 50,791$ 51,112$ 66,151$ 61,185$ 63,519$ Performing troubled debt restructurings 12,827$ 14,349$ 14,920$ 12,749$ 10,221$ Allowance for loan losses ("ALLL") 33,594$ 32,529$ 31,748$ 29,870$ 28,401$ Loans receivable 4,360,854$ 4,202,679$ 4,171,456$ 3,889,289$ 3,761,572$ Less: taxi medallion loans 28,944 29,405 46,765 - - Loans receivable (excluding taxi medallion loans) 4,331,910$ 4,173,274$ 4,124,691$ 3,889,289$ 3,761,572$ Loans held-for-sale (taxi medallion loans) -$ -$ -$ 47,430$ 50,891$ Nonaccrual loans (excluding taxi medallion loans) as a % of loans receivable (excluding taxi medallion loans) 0.48 % 0.49 % 0.46 % 0.35 % 0.37 % Nonaccrual loans as a % of loans receivable 1.14 1.19 1.57 1.57 1.67 Nonperforming assets as a % of total assets 0.96 0.99 1.29 1.26 1.36 Nonperforming assets (excluding taxi medallion loans) as a % of total assets 0.41 0.42 0.38 0.28 0.31 ALLL as a % of loans receivable 0.77 0.77 0.76 0.77 0.76 ALLL as a % of nonaccrual loans (excluding taxi medallion loans) 161.7 157.7 168.4 217.2 202.1 ALLL as a % of nonaccrual loans 67.6 65.0 48.4 48.8 45.1 (dollars in thousands) As of

30 Appendix Reconciliation of GAAP and non - GAAP measures (cont.) (1) Represents adjusted earnings available to common stockholders divided by weighted average diluted shares outstanding. (2) Adjusted net income divided by average assets. (3) Adjusted earnings available to common stockholders divided by average common equity. (4) Earnings available to common stockholders excluding amortization of intangibles assets divided by average tangible common equity. (5) Adjusted earnings available to common stockholders divided by average tangible common equity. (6) Operating noninterest expense divided by operating revenue. (7) Tangible common equity divided by tangible assets. (8) Tangible common equity divided by common shares outstanding at period-end.