Attached files
| file | filename |
|---|---|
| 8-K - FORM 8-K - Lipocine Inc. | tv501921_8k.htm |

LPCN 1144 Oral Testosterone (T) Non Alcoholic Steatohepatitis (NASH) and NASH Cirrhosis Exhibit 99.1

Non - Alcoholic Fatty Liver Disease (NAFLD) and Its Clinical Progression Fatty liver is a reversible condition wherein large vacuoles of triglyceride fat accumulate in liver cells via the process of steatosis LFTs: Liver function test, especially Alaninine amino transferase (ALT) and Aspartame amino transferase (AST) NASH: Non - alcoholic Steatohepatitis, TG: Triglyceride Healthy Liver Fatty Liver — ↑ TGs — ↑ LFTs — ↑ Liver fat NASH Liver — Steatosis — Ballooning — Inflammation — Fibrosis Cirrhotic Liver — Late stage of fibrosis Hepatocellular Carcinoma Eligible for Liver Transplantation 20 – 30% US Adults 15 – 20% NAFLDs 10 – 20% NASH No Approved Product 2

Fatty Liver Related Diseases Obesity (40% in US) 1 Diabetes (9% in US) 2 Metabolic Syndrome ( MeS ) (>30% in US) 3 NAFLD NASH Cirrhosis 1. CDC, Jun 2018 2. CDC, Jul 2017 3. Moore et al, Prev Chronic Dis, 2017 (CDC) 4. Dandona and Rosenberg, Int J Clin Pract , 2010 (US Census Bureau, Aug 2008) Hypogonadism (13% in US) 4 Testosterone deficiency is one of the under appreciated comorbidities of chronic liver disease* * Kim et al, Male hypogonadism and liver disease in Male hypogonadism and basic clinical and therapeutic, Contemp Endocrin (2017) p219 - 234 3

Prevalence of Fatty Liver Disease in US ▪ NAFLD prevalence in general population is estimated to be 20 - 30% in the Western world 1 Estimated Prevalence of Fatty Liver Disease in US, 2015 ▪ By 2020, prevalence of NAFLD cirrhosis is set to overtake hepatitis B - and C - related cirrhosis 2 ▪ The NASH market could peak at $30 - 40 billion by 2025 3 1. Masarone et al, Rev Recent Clin Trials, 2014 3. Deutsche Bank industry report, “NASH – the next big global epidemic in 10 years?”, 2014 2. Starley et al, Hepatol , 2010 * Estes et.al. Hepatology, 2018 US Patients NAFLD NASH Fibrosis (F2/F3) Cirrhosis - Fibrosis (F4) Compensated Decompensated Prevalence* 83.1 M 5.4 M 1.2 M 134 K 4

Proposed Mechanism of Androgen Action via Androgen Receptor (AR) in Males* Normal level and signaling of androgens prevent hepatic fat accumulation in males** * Navarro et al, Obesity 2015 ** Shen and Shi, Int J Endocrinol 2015 5

LPCN 1144: Oral T – Proposed Mechanism of Action in Liver Disease is Multidimensional Targeting NASH Pathogenesis ▪ Homeostasis Modifier 1, 2 ‒ Alter lipid profile ‒ Promote cholesterol storage ‒ Glucose Homeostasis ▪ Anti - inflammatory 2 / Immuno - modulator 3 ‒ Low T results in compromised immune system ▪ Regenerative ‒ Stimulate satellite cells and myocyte precursor resulting in cell differentiation and myocyte proliferation ‒ Reportedly liver remnant was found to regenerate via T therapy 4 ▪ Anabolic effects on muscle, bone and hematopoiesis ‒ Low T as a better predictor of mortality in men with advanced liver disease 5 1. Shen and Shi, Int J Endocrinol 2015 4. Vic et al, Hepatol 1982 2. Kelly and Jones, J Endocrinol 2013 5. Sinclair et al, J Gastroenterol Hepatol 2016 3. Sinclair et al, J Gastroenterol Hepatol 2015 6
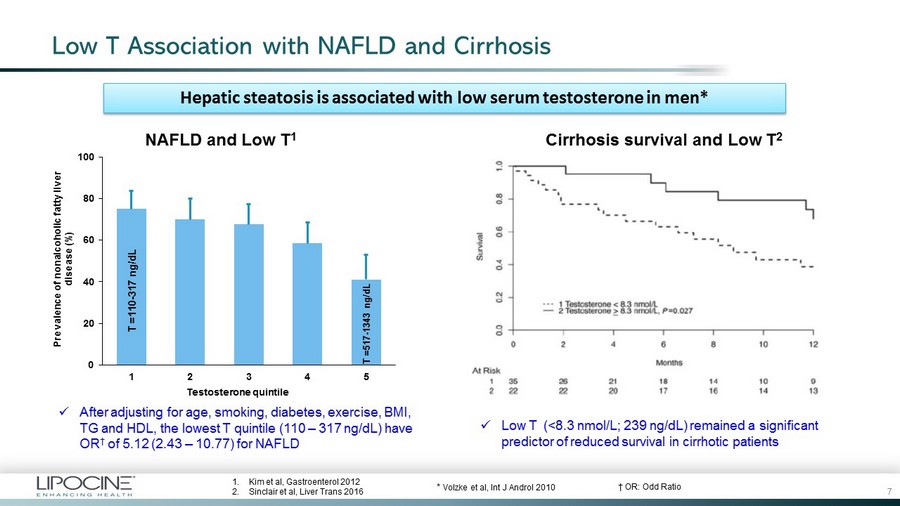
Low T Association with NAFLD and Cirrhosis x After adjusting for age, smoking, diabetes, exercise, BMI, TG and HDL, the lowest T quintile (110 – 317 ng/dL) have OR † of 5.12 (2.43 – 10.77) for NAFLD x Low T (<8.3 nmol/L; 239 ng/dL) remained a significant predictor of reduced survival in cirrhotic patients NAFLD and Low T 1 Cirrhosis survival and Low T 2 0 20 40 60 80 100 1 2 3 4 5 Prevalence of nonalcoholic fatty liver disease (%) Testosterone quintile 1. Kim et al, Gastroenterol 2012 2. Sinclair et al, Liver Trans 2016 * Volzke et al, Int J Androl 2010 Hepatic steatosis is associated with low serum testosterone in men* T =110 - 317 ng/dL T =517 - 1343 ng/dL 7 † OR: Odd Ratio

Testosterone May Play a Protective Role in Hepatic Steatosis and NAFLD Development* * Nikolaenko et al, Endocrinol 2014 I + RCD [n=6] I + HFD [n=8] C + HFD [n=8] C + HFD + T [n=7] 8 – 10 weeks aged rats fed with high fat – low carbohydrate liquid diet for 15 weeks Control group (Con) I: Intact, C: Castrated, RCD: Regular Chow Diet, HFD: High Fat Diet, T: Testosterone 8 Parameters I + HFD C + HFD C + HFD + T ALT - ↑ level - Histopathology Similar to Control ↑ score Similar to Control Macrovascular inflammation No Yes No Hepatocyte apoptosis Similar to Control ↑ Similar to Control % body fat Higher ↑ Similar to Control
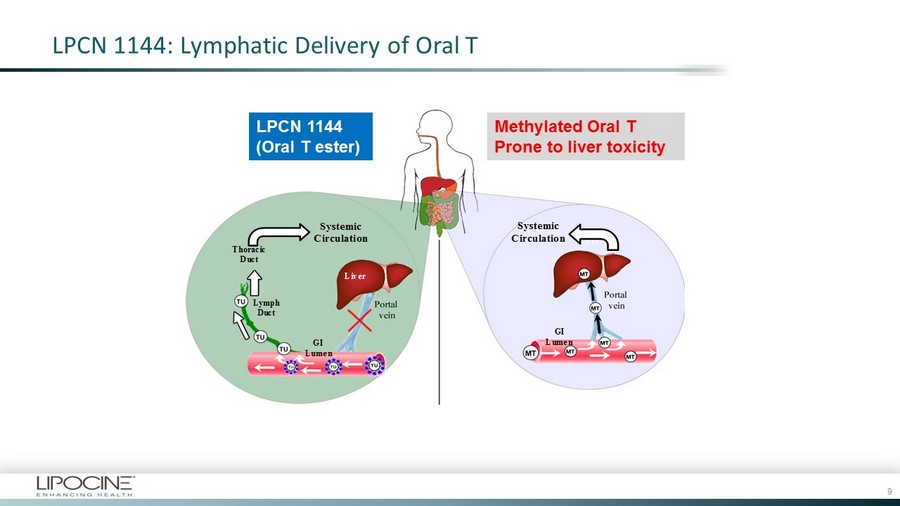
LPCN 1144: Lymphatic Delivery of Oral T TLANDO ® (LPCN 1021) Transported via Lymph Not prone to liver issues METHYL TESTOSTERONE (MT) Transported via Liver Prone to liver toxicity Systemic Circulation Thoracic Duct Lymph Duct Liver Liver GI Lumen GI Lumen Systemic Circulation LPCN 1144 (Oral T ester) Methylated Oral T Prone to liver toxicity 9

LPCN 1144: Study Details for Serum Biomarkers Data Analysis ▪ Oral Testosterone, twice daily dosing regimen ▪ “Study of Oral Androgen Replacement (SOAR) Trial” or 13 - 001 Study – 52 week therapy with oral T and topical active control in 314 hypogonadal subjects ▪ “Dosing Validation (DV) study” or 16 - 002 Study – 3 week therapy with oral T in 94 hypogonadal subjects • Included subjects with typical comorbid conditions associated with NASH • Liver enzymes, lipids and cholesterol (NASH biomarkers) levels were monitored Key serum NASH biomarkers were evaluated as change from baseline • Subjects were not confirmed with biopsy for NASH ▪ Sub group of subjects are categorized as “potential NASH patients” based on elevation of key NASH biomarkers at baseline • Key NASH biomarkers: Alanine aminotransferase (ALT), Aspartate aminotransferase (AST), Alkaline phosphatase (ALP), Gamma - glutamyl transpeptidase (GGT), Triglyceride (TG) 10

LPCN 1144 – General Safety ▪ LPCN 1144 is a prodrug of bioidentical sex hormone – History of safe Ex - US Oral TU use for decades – 8,400 patients / 15,600 patient years of use of over 19 years • Data assures well - characterized safety with respect to prostate, hypertension, polycythemia and liver disease ▪ Extensive clinical safety database with LPCN 1144 – 591 subjects in 12 studies with up to 52 week exposure – Safety profile well - characterized and demonstrated no unexpected risks – Well tolerated with no adverse liver enzyme signals, no deaths or MACE events – No drug related SAEs 11
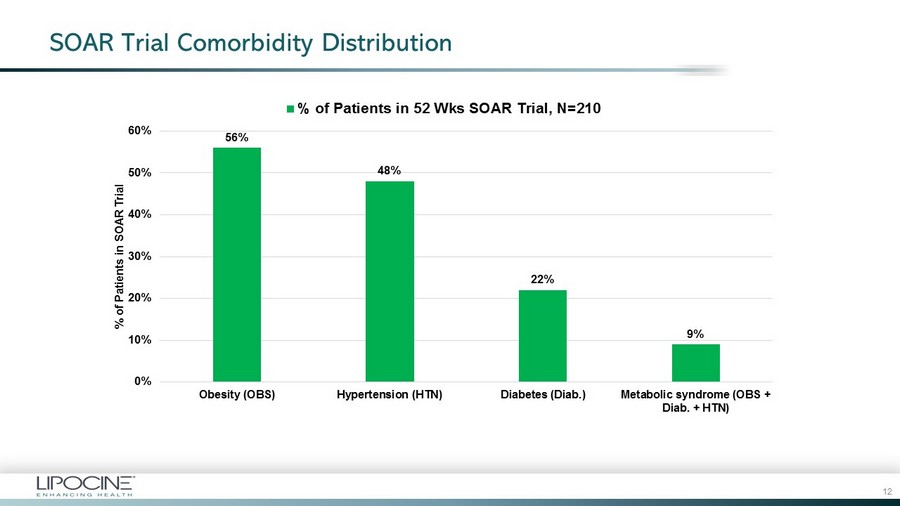
SOAR Trial Comorbidity Distribution 56% 48% 22% 9% 0% 10% 20% 30% 40% 50% 60% Obesity (OBS) Hypertension (HTN) Diabetes (Diab.) Metabolic syndrome (OBS + Diab. + HTN) % of Patients in SOAR Trial % of Patients in 52 Wks SOAR Trial, N=210 12

Mean Baseline Liver Enzymes and TG Levels in Patients with Comorbidity Typical of NASH 13 SOAR Trial (13 - 001) Overall (N=210) Obesity (N=118) Diabetes (N=46) Hypertension (N=100) OBS + Diab . (N=25) OBS + Diab + HTN (N=19) ALT (U/L) 30.5 33.3 29.4 29.0 33.4 30.2 AST (U/L) 24.2 24.7 21.1 23.5 22.3 22.4 ALP (U/L) 71.8 71.7 73.3 69.4 69.2 66.0 GGT (U/L) 36.0 36.8 41.7 34.0 35.2 29.4 TG (mg/ dL ) 192 205 209 187 237 253

Substantial Reduction of Clinical Biomarker Levels with LPCN 1144 in Cohorts with NASH Risk Factors x2 x5 x2 x5 * N = Total N for subgroup - 15 - 43 - 26 - 52 - 67 - 4.0 - 2.0 - 2.9 - 5.9 - 4.5 -7 -6 -5 -4 -3 -2 -1 0 -80 -70 -60 -50 -40 -30 -20 -10 0 N* = 118 46 100 25 19 Obesity (OBS) Diabetes (Diab) Hypertension (HTN) OBS & Diab. OBS & Diab. & HTN (MeS) ALT Mean Change (U/L) TG Mean Change (mg/dL) TG ALT TG and ALT mean change post 52 week therapy in patients 14 MeS : Metabolic Syndrome

Significant Reduction of Clinical Biomarker Levels with LPCN 1144 in Cohort with Elevated ALT and TG at Baseline * Barritt 4 th et al, Contemp Clin Trials, 2017 ** Sanyal et al, Hepatol , 2015 *** TG normal range 45 – 200 mg/dL x2 x2 x5 TG and ALT mean change post 52 week therapy in patients † N = Total N for subgroup Mean BL: TG ALT 214 44.5 TG ALT 227 53.6 TG ALT 320 34.4 - 20 - 22 - 64 - 7.9 - 11.1 - 4.0 -12 -10 -8 -6 -4 -2 0 -70 -60 -50 -40 -30 -20 -10 0 ALT > 30 U/L* (N=81†) ALT > 40 U/L** (N=42†) TG > 200 mg/dL*** (N=73†) ALT Mean Change (U/L) TG Mean Change (mg/ dL ) TG ALT 15

52% 34% 0% 10% 20% 30% 40% 50% 60% ALT (U/L) TG (mg/dL) % of Patients in SOAR Trial N= 42* Significant Number of Patients on LPCN 1144 Shift from Above - normal Levels at BL to Normal † Levels at EOS * N = Total N for subgroup with above normal biomarker levels at baseline † Normal range: ALT (10 - 40 U/L), TG (45 - 200 mg/ dL ) BL: Baseline, EOS: End Of Study N= 73* 16

Consistent LPCN 1144 Effect on Key Clinical Biomarkers Across Studies *Patients are for 4 th Quartile (above or upper normal level) of each lab at baseline Alanine amino transferase (ALT), Aspartate amino transferase (AST), Alkaline phosphatase (ALP), Gamma - glutamyl transpeptidase (GGT), Triglyceride (TG) Liver enzymes and TG mean change post therapy in patients in two separate studies* - 6.5 - 2.9 - 16.5 - 11.7 - 10 - 6.3 - 10.2 - 7 -20 -15 -10 -5 0 5 ALT (U/L) AST (U/L) ALP (U/L) GGT (U/L) Mean Change from Baseline (U/L) 16-002 3 Wks (N=25) 13-001 52 Wks (N=52) - 66 - 85 -90 -80 -70 -60 -50 -40 -30 -20 -10 0 TG (mg/dL) Mean Change from Baseline (mg/ dL ) 16-002 3 Wks (N=25) 13-001 52 Wks (N=52) 17

Unique Triglyceride Reduction with LPCN 1144 ▪ TG mean change post therapy in patients on oral T vs non - oral T Therapy * TG normal range: 45 – 200 mg/dL - 63.7 ( - 15%) 13.7 (+3%) -80 -60 -40 -20 0 20 40 60 Mean BL = 320 mg/dL 323 mg/dL N = 73/210 34/104 LPCN 1144 Topical T Mean Change from Baseline (mg/dL) TG Mean Change after 52 Week for Patients with Above - normal TG* at BL 200 250 300 350 400 0 13 26 39 52 Mean Value for Patients with Above - normal at BL (mg/dL) Therapy Duration (Week) TG Mean Value for Patients with Above - normal TG* at BL during 52 Week Therapy LPCN 1144 Topical T 18
LPCN 1144 Competitive Biomarker Data Comparison

- 31 - 15 - 38 7 - 8 - 6 -50 -40 -30 -20 -10 0 10 20 Mean BL=82.7 U/L 57.2 U/L 83 U/L 60.4 U/L 69 U/L 56 U/L N=3* 32** 141 123 32 30 LPCN 1144 (Wk 52) Ocaliva (Wk 72) - 25mg Cenicriviroc (Wk 52) - 150mg Selon/Simtu (Wk 24) - 18mg/125mg† Selon/Simtu (Wk 24) - 6mg/125mg† ALT Mean Change from BL (U/L) ALT Mean Change from Baseline LPCN 1144: Comparison of ALT Mean Change from Baseline with Phase 3 Drug Candidates * SOAR Trial Patients with ALT > 75 U/L at baseline ** SOAR Trial Patients with ALT ≥ 45 U/L at baseline † Mean change values for Selonsertib / Simtuzumab are median in interquartile range Obeticholic acid: Neuschwander - Tetri et al, Lancet 2015 Cenicriviroc : Friedman et al, Hepatology 2018, Suppl. Table 5 Selonsertib / Simtuzumab : Loomba et al, Hepatology 2018 20

LPCN 1144: Comparison of Triglyceride Mean Change from Baseline with Phase 3 Drug Candidates * Upper limit of normal range (ULN) is 200 mg/dL **, *** SOAR Trial patients with TG > 200 mg/dL and >120 mg/dL at baseline, respectively **** ULN is not reported; typical ULN is 150 mg/dL † Mean change values for Selonsertib / Simtuzumab are median in interquartile range - 64 - 35 - 19 - 9 - 21 12 -90 -80 -70 -60 -50 -40 -30 -20 -10 0 10 20 Mean BL=1.6xULN* 1.2xULN* 1.3xULN**** 1.2xULN**** 1.2xULN**** 1.2xULN**** N = 73** 141*** 141 123 32 30 LPCN 1144 (Wk 52) Obeticholic acid (Wk 72) - 25mg Cenicriviroc (Wk 52) - 150mg Selon/Simtu (Wk 24) - 18mg/125mg† Selon/Simtu (Wk 24) - 6mg/125mg† TG Mean Change from BL (mg/dL) TG Mean Change from Baseline Obeticholic acid: Neuschwander - Tetri et al, Lancet 2015 Cenicriviroc : Friedman et al, Hepatology 2018, Suppl. Table 5 Selonsertib / Simtuzumab : Loomba et al, Hepatology 2018 21

LPCN 1144: Comparison of Triglyceride Mean Change from Baseline with Phase 2 Drug Candidates * Upper limit of normal range (ULN) is 200 mg/ dL . **, *** SOAR Trial patients with TG > 200 mg/dL and 120 mg/dL at baseline, respectively. **** ULN is not reported; typical ULN is 150 mg/ dL . ‡ Mean change for GS 0976 is recalculated from mean values at BL and EOS. - 64 - 35 - 33 - 35 - 44 - 11 - 9 51 -80 -60 -40 -20 0 20 40 60 Mean BL=1.6xULN* 1.2xULN* 1.2xULN**** 1.3xULN**** 1.1xULN**** 1.4xULN**** 1.2xULN**** 1.1xULN**** N = 73** 141*** 79 27 28 20 17 10 LPCN 1144 (Wk 52) MGL 3196 (Wk 12) - 80±20mg NGM282 (Wk 12) - 3mg NGM282 (Wk 12) - 6 mg BMS986036 (Wk 16) - 10mg BMS986036 (Wk 16) - 20mg GS - 0976 (Wk 12) - 20mg‡ TG Mean Change from BL (mg/dL) TG Mean Change from Baseline MGL 3196: EASL International Liver Congress 2018, April 2018 NGM282: Harrison et al, The Lancet 2018 BMS986036: Sanyal et al, AASLD, Oct 2017 GS0976: Lawitz et al, Clin Gasteroenterol Hepatol 2018 22

- 31 - 38 -45 -40 -35 -30 -25 -20 -15 -10 -5 0 ALT Mean Change from BL (U/L) Comparison of ALT Mean Change LPCN 1144 (Wk 52) Obeticholic acid (Wk 72)† LPCN 1144: Comparison of Key NASH Biomarker Mean Change from Baseline with Obeticholic Acid ▪ Obeticholic Acid (FXR agonist) – FLINT Study, P2, 72 weeks, 25mg dose ‡ Mean BL 82.7 U/L 83 U/L** N 3* 126 Mean BL 1.3xULN* 1.3xULN*** N 109** 126 * Upper limit of normal range (ULN) is 200 mg/dL ** SOAR Trial patients with TG > 150 mg/dL at baseline *** ULN is not reported; typical ULN is 150 mg/dL † Reported placebo mean change for Obeticholic Acid is - 7 mg/dL * SOAR Trial patients with ALT > 75 U/L at baseline ** Reported mean baseline level for Obeticholic Acid (N=141) † Reported placebo mean change for Obeticholic Acid is - 18 U/L ‡ Neuschwander - Tetri et al, Lancet 2015 - 49 - 19 -70 -60 -50 -40 -30 -20 -10 0 TG Mean Change from BL (mg/dL) Comparison of TG Mean Change LPCN 1144 (Wk 52) Obeticholic acid (Wk 72)† 23

▪ Elafibranor (PPAR - a, d agonist) – P2, 52 weeks, 120mg dose ‡ LPCN 1144: Comparison of Key NASH Biomarker Mean Change from Baseline with Elafibranor LPCN 1144 ALT Mean BL 62.2 U/L N 22* Mean Change from BL, (SE) - 20 ( ± 3.1) U/L * SOAR Trial patients with ALT > 50 U/L ‡ Ratziu et al, Gastroenterol, 2016 Possible Unit typo ; mmol/L Mean BL 1.2xULN † N 78 Mean BL 63.8 U/L N 78 LPCN 1144 TG Mean BL 1.2xULN** N 141*** Mean Change from BL, (SE) - 0.4 ( ± 0.1) mmol /L ** Upper limit of normal range (ULN) is 200 mg/ dL *** SOAR Trial patients with TG > 120 mg/ dL at baseline † ULN is not reported; typical ULN for TG is 150 mg/ dL . Elafibranor Elafibranor 24

LPCN 1144: Comparison of Key NASH Biomarker Mean Change from Baseline with Cenicriviroc ▪ Cenicriviroc (CCR2/CCR5 inhibitor) – P2, 52 weeks, 150mg dose ‡ Mean BL 57.2 U/L 60.4 U/L N 32* 123 Mean BL 1.2xULN* 1.2xULN*** N 141** 123 * Upper limit of normal range (ULN) is 200 mg/ dL . ** SOAR Trial patients with TG > 120 mg/dL at baseline. *** ULN is not reported; typical ULN is 150 mg/ dL . * SOAR Trial patients with ALT ≥ 45 U/L. - 15 7 -20 -15 -10 -5 0 5 10 15 ALT Mean Change from BL (U/L) Comparison of ALT Mean Change LPCN 1144 (Wk 52) Cenicriviroc (Wk 52) - 35 - 9 -50 -40 -30 -20 -10 0 TG Mean Change from BL (mg/dL) Comparison of TG Mean Change LPCN 1144 (Wk 52) Cenicriviroc (Wk 52) ‡ Friedman et al, Hepatology 2018, Suppl. Table 5 25

- 35 - 21 12 -40 -30 -20 -10 0 10 20 TG Mean Change from BL (mg/dL) Comparison of TG Mean Change LPCN 1144 (Wk 52) Selon/Simtu (Wk 24) - 18mg Selon/Simtu (Wk 24) - 6mg LPCN 1144: Comparison of Key NASH Biomarker Mean Change from Baseline with Selonsertib / Simtuzumab ▪ Selonsertib / Simtuzumab (ASK1 inhibitor) – P2, 24 weeks, 18mg or 6mg Selon dose ‡ Mean BL 57.2 U/L 69 U/L 56 U/L N 32 † 32 30 † SOAR Trial patients with ALT ≥ 45 U/L * Mean change values for Selonsertib / Simtuzumab are median in interquartile range - 15 - 8 - 6 -15 -10 -5 0 ALT Mean Change from BL (U/L) Comparison of ALT Mean Change LPCN 1144 (Wk 52) Selon/Simtu (Wk 24) - 18mg* Selon/Simtu (Wk 24) - 6mg* Mean BL 1.2xULN* 1.2xULN*** 1.2xULN*** N 141 ** 32 30 * Upper limit of normal range (ULN) is 200 mg/dL ** SOAR Trial patients with TG > 120 mg/dL at baseline *** ULN is not reported; typical ULN is 150 mg/dL † Mean change values for Selonsertib / Simtuzumab are median in interquartile range ‡ Loomba et al, Hepatology 2018 † † 26

LPCN 1144: Comparison of Key NASH Biomarker Mean Change from Baseline with MGL 3196 ▪ MGL 3196 † (THR - b agonist) – P2, 12 weeks, 80mg ± 20mg dose ‡ - 23.1% - 13.5% -30% -20% -10% 0% ALT Mean Change from BL (%) Comparison of ALT Mean Change LPCN 1144 (Wk 52) MGL 3196 N 32* 47** * SOAR Trial Patients with ALT ≥ 45 U/L for males ** Patients of MGL 3196 are with ALT ≥ 45 U/L for males and > 30 for females; mean BL for these patients of MGL 3196 is not reported † Reported placebo ALT mean change is - 7.7%. * Upper limit of normal range (ULN) is 200 mg/dL ** SOAR Trial patients with TG > 120 mg/dL at baseline *** ULN is not reported; typical ULN is 150 mg/dL ‡ EASL International Liver Congress 2018. Paris, France – April 11 - 15, 2018 - 35 - 33 -50 -40 -30 -20 -10 0 ALT Mean Change from BL (mg/ dL ) Comparison of TG Mean Change LPCN 1144 (Wk 52) MGL 3196 Mean BL 1.2xULN* 1.2xULN*** N 141** 79 27

LPCN 1144: Comparison of Key NASH Biomarker Mean Change from Baseline with Injectable NGM282 ▪ NGM282 (FGF19 analog) – P2, 12 weeks, 3mg and 6mg dose ‡ * Upper limit of normal range (ULN) is 200 mg/ dL . ** Patients are with TG > 120 mg/ dL at baseline. *** ULN is not reported; typical ULN is 150 mg/ dL . ‡ Harrison et al, The Lancet 2018 Mean BL 1.2xULN* 1.3xULN*** 1.1xULN*** N 141** 27 28 - 20 - 35 - 32 -50 -40 -30 -20 -10 0 ALT Mean Change from BL (U/L) Comparison of ALT Mean Change LPCN 1144 (Wk 52) NGM282 (Wk 12) - 3mg NGM282 (Wk 12) - 6 mg Mean BL 62.2 U/L 67.4 U/L 61.8 U/L N 22* 27 28 - 35 - 35 - 44 -60 -50 -40 -30 -20 -10 0 TG Mean Change from BL (mg/dL) Comparison of TG Mean Change LPCN 1144 (Wk 52) NGM282 (Wk 12) - 3mg NGM282 (Wk 12) - 6 mg * SOAR Trial Patients with ALT > 50 U/L at baseline. 28
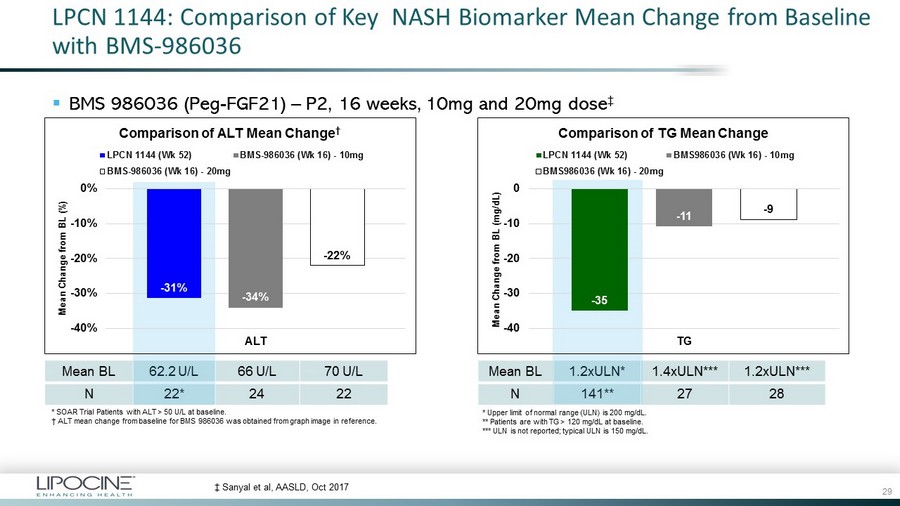
LPCN 1144: Comparison of Key NASH Biomarker Mean Change from Baseline with BMS - 986036 ▪ BMS 986036 (Peg - FGF21) – P2, 16 weeks, 10mg and 20mg dose ‡ * Upper limit of normal range (ULN) is 200 mg/ dL . ** Patients are with TG > 120 mg/ dL at baseline. *** ULN is not reported; typical ULN is 150 mg/ dL . ‡ Sanyal et al, AASLD, Oct 2017 Mean BL 1.2xULN* 1.4xULN*** 1.2xULN*** N 141** 27 28 Mean BL 62.2 U/L 66 U/L 70 U/L N 22* 24 22 - 31% - 34% - 22% -40% -30% -20% -10% 0% ALT Mean Change from BL (%) Comparison of ALT Mean Change † LPCN 1144 (Wk 52) BMS-986036 (Wk 16) - 10mg BMS-986036 (Wk 16) - 20mg - 35 - 11 - 9 -40 -30 -20 -10 0 TG Mean Change from BL (mg/dL) Comparison of TG Mean Change LPCN 1144 (Wk 52) BMS986036 (Wk 16) - 10mg BMS986036 (Wk 16) - 20mg * SOAR Trial Patients with ALT > 50 U/L at baseline. † ALT mean change from baseline for BMS 986036 was obtained from graph image in reference. 29

LPCN 1144: Comparison of Key NASH Biomarker Mean Change from Baseline with GS - 0976 ▪ GS 0976 (ACC inhibitor) – P2, 12 weeks, 20mg dose ‡ * Upper limit of normal range (ULN) is 200 mg/ dL . ** Patients are with TG > 120 mg/ dL at baseline. *** ULN is not reported; typical ULN is 150 mg/ dL . † Mean Change value is obtained from Mean values at BL and EOS. ‡ Lawitz et al, Clin Gasteroenterol Hepatol 2018 Mean BL 1.2xULN* 1.1xULN*** N 141** 10 Mean BL 82.7 U/L 101 U/L N 3* 10 - 31 - 44 -50 -40 -30 -20 -10 0 ALT Mean Change from BL (U/L) Comparison of ALT Mean Change LPCN 1144 (Wk 52) GS - 0976 (Wk 12) - 20mg† - 35 51 -40 -20 0 20 40 60 TG Mean Change from BL (mg/dL) Comparison of TG Mean Change LPCN 1144 (Wk 52) GS - 0976 (Wk 12) - 20mg† * SOAR Trial Patients with ALT > 75 U/L at baseline. † Mean Change value is obtained from Mean values at BL and EOS. 30

LPCN 1144: Comparison of ALT Responders ** from Baseline with Vitamin E ▪ ALT Improvement predicts histological response † (PIVENS Vitamin E study results ‡ ) ▪ Vitamin E (anti - oxidant) – 96 weeks, 800 IU dose ‡ Sanyal et al, New Eng J Med, 2010 * Total N is for patients with ALT > 40 U/L at baseline (ALT normal range is ≤ 40 U/L) 43% 48% 0% 10% 20% 30% 40% 50% 60% N = 42* N = 71* LPCN 1144 (Wk 52) Vitamin E (Wk 120) % of ALT Responders at EOS 31 † Hoffnagle et al. APT 2013 ** ALT Responders: Patients with ALT > 40 U/L at baseline, ending with ≤ 40 U/L and more than 30% reduction at end of study p ost therapy

Summary of LPCN 1144 Clinical Biomarker Results and Next Steps ▪ Summary – Consistent lowering of key biomarkers levels in patients with comorbidities typical of NASH – Significant reduction of key biomarkers levels in patients with elevated ALT and TG, adjunct markers often used in clinical diagnosis of NASH – Significant number of patients shift from above - normal levels at BL to normal levels at EOS – Unique triglycerides (key lipo - toxicity stressor) reduction with oral T therapy – Consistent biomarker reduction independent of therapy duration across multiple studies – Biomarker reduction significant and comparable to most drug candidates in advanced drug development with clinical liver biopsy data – ALT Improvement, a predictor of histological response, consistent with Vitamin E ▪ Next Steps – In - vivo model Proof - Of - Concept (POC) study in biopsy - confirmed NASH – POC clinical study to assess liver fat changes in imaging confirmed NAFLD/NASH patients 32