Attached files
| file | filename |
|---|---|
| 8-K - FORM 8-K - UFP TECHNOLOGIES INC | f8k_082718.htm |
Exhibit 99.1
Welcome Investors August 29, 2018

Nasdaq: (UFPT) This presentation contains forward - looking information that involves risks and uncertainties, including statements about the Company’s prospects, financial performance targets and goals, anticipated advantages the Company expects to realize from its acquisition strategies, the Company’s participation in multiple markets and its engineering and product development resources, the Company’s business opportunities, the Company’s, growth potential and strategies for growth, and statements about customer demand . Investors are cautioned that such forward - looking statements are not guarantees of future performance and involve risks and uncertainties, including without limitation risks associated with the identification of suitable acquisition candidates and the successful, efficient execution of acquisition transactions and integration of any such acquisition candidates, economic conditions that affect sales of the products of the Company’s customers, the ability of the Company to obtain new customers, the ability of the Company to fulfill its obligations on long - term contracts and to retain current customers, the Company’s ability to adapt to changing market needs and other factors as well as other risks and uncertainties that are detailed in the documents filed by the Company with the SEC . Accordingly, actual results may differ materially . The risks and uncertainties included above are not exhaustive . Readers are referred to the documents filed by the Company with the SEC, specifically the last reports on Forms 10 - K and 10 - Q . The forward - looking statements contained herein speak only of the Company’s expectations as of the date of this presentation . The Company expressly disclaims any obligation or undertaking to release publicly any updates or revisions to any such statement to reflect any change in the Company’s expectations or any change in events, conditions or circumstances on which any such statement is based . Safe Harbor Statement

Nasdaq: (UFPT) Who We Are UFP Technologies is an innovative designer and custom converter of foams, plastics, and natural fiber materials . Headquarters : Newburyport, MA Ticker: UFPT Market Cap: $237 Million Share Count: 7.3 Million Annual Revenue: $148 Million Proforma* Annual Revenue: $191 Million Established in 1963 Public since 1993 1,100 employees and temps 9 manufacturing facilities and 2 design centers in the U.S. * Proforma revenue includes 2017 UFP revenue of $148 million and $43 million of revenue from Dielectrics (acquired Feb. 2018)

Nasdaq: (UFPT) What We Do We combine our: • Materials expertise • Design engineering capabilities • Precision manufacturing capabilities to help our customers develop, improve, manufacture, or safely transport their products.

Nasdaq: (UFPT) Materials Expertise

Nasdaq: (UFPT) Our Value Proposition » Design engineering • 90 + members of the Engineering group • Culture of innovation • History of innovation

Nasdaq: (UFPT) Our Value Proposition » Precision manufacturing • 9 factories • 14 clean rooms • 2 design centers • Certified quality systems

Nasdaq: (UFPT) Systems and Certifications ISO 9001 Quality Management ISO 13485 Medical Device FDA Registration ISO 14001 Environmental ISO/TS 16949 Automotive AS9100D Aerospace DDTC & ITAR registered ERP/CRM

Nasdaq: (UFPT) Growth Strategy Two - pronged growth strategy: 1) Internal growth: market to our sweet spot 2) Strategic acquisitions

Nasdaq: (UFPT) Internal Growth Strategy • Infection prevention • Orthopedic implant packaging • Orthopedic soft braces • Advanced wound care • Sterile packaging • Surgical instrument protection • Biopharma Industrial 5%* Automotive 12% • Interior trim & structural • Acoustic/thermal insulation • Weight reduction • Foam and fiber packaging • Personal comfort & protection Consumer 11%* Electronics 6%* Aerospace & Defense 6%* Six Target Markets 2017 Proforma Revenue Mix* * Proforma revenue includes 2017 UFP Revenue and $43 million of revenue from Dielectrics (acquired Feb. 2018) • Packaging • Protection • Uniform and tactical gear • Tools & equipment protection • Thermal insulation Medical 60%* • Filtration • Acoustic insulation 60% 12% 11% 6% 5% 6%
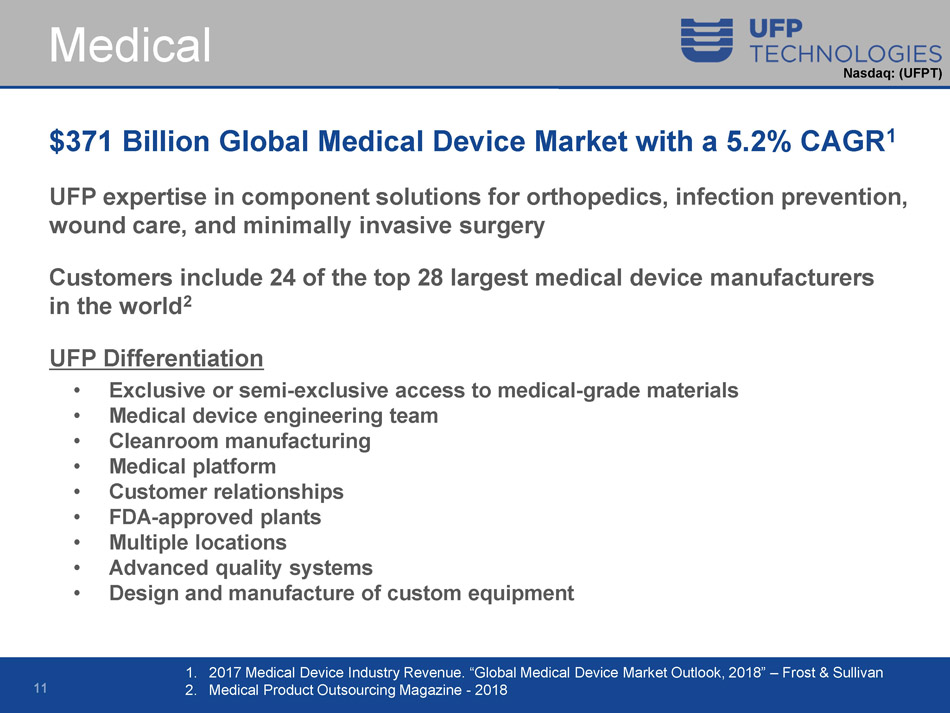
Nasdaq: (UFPT) Medical $371 Billion Global Medical Device Market with a 5.2% CAGR 1 UFP expertise in component solutions for orthopedics, infection prevention, wound care, and minimally invasive surgery Customers include 24 of the top 28 largest medical device manufacturers in the world 2 UFP Differentiation • Exclusive or semi - exclusive access to medical - grade materials • Medical device engineering team • Cleanroom manufacturing • Medical platform • Customer relationships • FDA - approved plants • Multiple locations • Advanced quality systems • Design and manufacture of custom equipment 1. 2017 Medical Device Industry Revenue. “Global Medical Device Market Outlook, 2018” – Frost & Sullivan 2. Medical Product Outsourcing Magazine - 2018

Nasdaq: (UFPT) Medical Medical Product Examples:
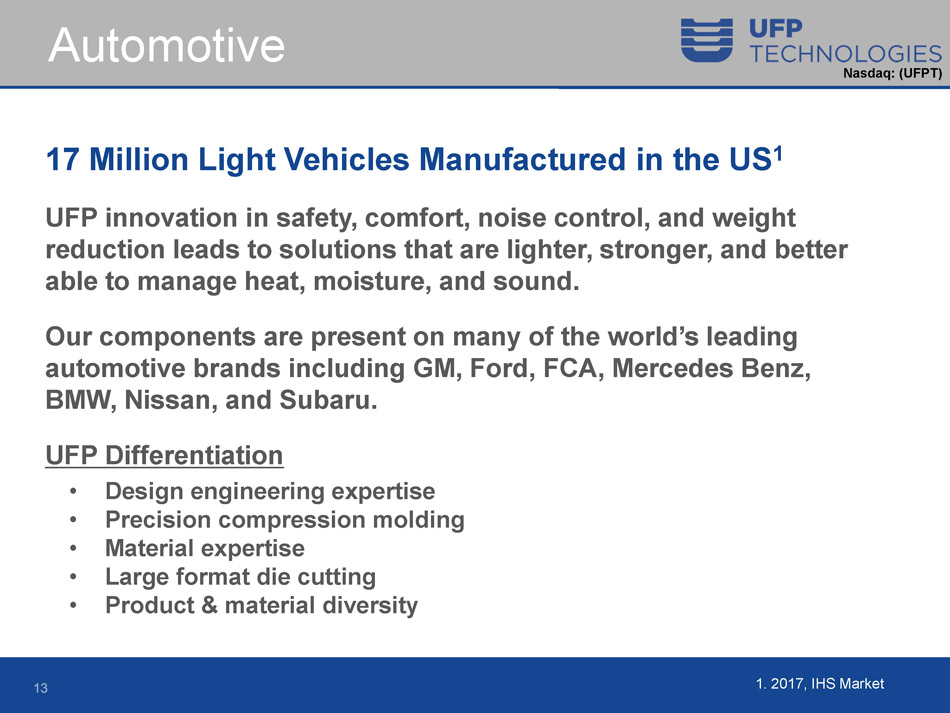
Nasdaq: (UFPT) Automotive 17 Million Light Vehicles Manufactured in the US 1 UFP innovation in safety, comfort, noise control, and weight reduction leads to solutions that are lighter, stronger, and better able to manage heat, moisture, and sound. Our components are present on many of the world’s leading automotive brands including GM, Ford, FCA, Mercedes Benz, BMW , Nissan, and Subaru. UFP Differentiation • Design engineering expertise • Precision compression molding • Material expertise • Large format die cutting • Product & material diversity 1. 2017, IHS Market

Nasdaq: (UFPT) Automotive Automotive Product Examples:

Nasdaq: (UFPT) Aerospace & Defense Aircraft Volumes Expected to Double by 2037 1 While Defense Opportunities Lie in Long - term R&D UFP expertise in comfort & safety components, acoustic insulation, thermal insulation, engine components, uniforms & tactical gear, cases and inserts. UFP Differentiation • Materials and design expertise • Strategic manufacturing locations • Dedicated engineering • Difficult to laminate composites • AS9100 / Boeing qualified supplier 1. Boeing Commercial Market Outlook 2018 - 2037

Nasdaq: (UFPT) Aerospace & Defense Aerospace & Defense Product Examples:

Nasdaq: (UFPT) Aerospace & Defense Aerospace Components

Nasdaq: (UFPT) Molded Fiber Sustainable Packaging Has Grown to $210B Worldwide Market with Annual Growth Rate of 7.7% for the Next Decade 1 Molded fiber widely accepted as the go - to environmentally friendly alternative to polymer - based materials. Customers include a wide range of well - known consumer brands UFP Differentiation • Design of complex parts – steep draft angles • Equipment – proprietary technologies • In - house and offshore tooling • 25 - year reputation • Manufacturing at two locations • Patented designs 1. Researchandmarkets.com/research/xjqlc2/global

Nasdaq: (UFPT) Molded Fiber Molded Fiber Product Examples:

Nasdaq: (UFPT) Why Invest? Significant market growth opportunities Barriers to entry Strong customer relationships Experienced management team Proven growth strategy Attractive f inancial metrics
Nasdaq: (UFPT) Why is UFP an exciting investment? Significant market growth opportunities » Addressable market is growing • Medical – aging population • Aerospace – safer, lighter aircraft » Universe of specialty materials growing

Nasdaq: (UFPT) Barriers to Entry Engineering Resources • Veteran engineering team for product design and development; more than 90 members of the engineering group Greater Access to Materials • Offers broad array of materials to meet customer needs • 50 + years in business and strong supplier relationships • Exclusive access to several specialty medical grade materials Scale • National footprint – competition is generally smaller companies that have limited resources and access to materials Systems • Advanced systems (extensive quality certifications) • In addition to existing equipment, engineers design product - specific innovations to meet customer needs Intellectual Property • 20 patents relating to foam, packaging, tool control, radio frequency welding, automotive superforming processes and other products Custom Equipment • In - house custom equipment manufacturing capabilities

Nasdaq: (UFPT) National Footprint Gain Efficiencies Asset utilization Shared best practices Shared resources 9 Manufacturing Facilities - Over 1 million Square Feet of Space

Nasdaq: (UFPT) Management Team R. Jeffrey Bailly – Chairman, CEO & President 30 - year history at the company. MBA, CPA. Ronald Lataille – CFO, SVP & Treasurer 20 - year history at the company. CPA. Mitchell Rock – SVP Sales & Marketing 20 - year history at the company. Chris Litterio – SVP Human Resources & General Counsel Former managing partner and head of employment law at a major Boston law firm. David Smith – SVP Operations Joined the company in August 2013 after spending 25 years in various capacities at Rogers Corp., most recently as VP and general manager of their $180 million high - performance foam division. Daniel Shaw – VP R&D 30 - year history at the company.

Nasdaq: (UFPT)

Nasdaq: (UFPT) Organic Growth Opportunity Organic Growth (Target of 5% to 7%) » Focus on higher growth markets (medical – approx. 60% of rev enue and growing) » Expand business with existing customers • Offer complementary pr oducts and services • Additional value - add services » Gain market share with competitive advantage • Engineering resources • Access to materials • Scale (footprint, clean room manufacturing) • Systems • Intellectual property

Nasdaq: (UFPT) Acquisition Growth Opportunity Acquisition Growth (Target of 5% to 7%) » Very fragmented market • No single company controls a large percentage of the market (UFP is one of the largest players) • 500 + companies (potential targets) • Many owner operators at or near retirement age • Reputation for seamless integration Experienced and disciplined management team 11 acquisitions completed

Nasdaq: (UFPT) Acquisitive Growth Strategy Continue to Focus on Higher Growth, Higher Margin Medical Opportunities that Create Value » Become more valuable to our customers » Strategic focus – new capability, geography, market penetration , materials, products » Add scale / market share » Look for synergistic opportunities outside of foam fabricators Goal is for acquisitions to be accretive within the first year.

Nasdaq: (UFPT)

Nasdaq: (UFPT) Financial Targets 10% - 14% Revenue Growth 11% - 13% Operating Margin 27% - 28% Gross Margin 3 to 5 Year Financial Targets

Nasdaq: (UFPT) 0 20 40 60 80 100 120 140 160 180 200 2014 2015 2016 2017* YTD '17 YTD '18 Sales In Millions $ 148 Dielectrics 2017 Revenue $43 million 43 GAAP 2017 Revenue $148 million 23% YTD Growth 10% to 14% Targeted Revenue Growth Internal Growth + Acquisitions * Proforma revenue includes $43 million of revenue from Dielectrics (acquired Feb. 2018)

Nasdaq: (UFPT) 0 20,000 40,000 60,000 80,000 100,000 120,000 Medical* Consumer Automotive Electronics Industrial Aerospace & Defense 2014 2015 2016 2017* Revenue Mix Shift Pro - forma Revenue Mix Shift 2014 to 2017 Medical Mix Increased from 36% to 60% * Proforma revenue includes $43 million of revenue from Dielectrics (acquired Feb. 2018) Dielectrics 2017 Revenue $43 million

Nasdaq: (UFPT) Gross Profit/Margin Gross Margin Target: 27% to 28% Operating Leverage from Mix Shift + Acquisition synergies + Efficiencies 27 - 28%Target 10.0% 15.0% 20.0% 25.0% 30.0% 2014 2015 2016 2017 Q217 2Q18

Nasdaq: (UFPT) Adjusted* Operating Income Operating Income Margin Target: 11% to 13 % Operating Leverage from Mix Shift + Acquisition Synergies + Efficiencies 11 - 13% Target * Adjusted Operating Income is a non - GAAP term. A reconciliation to GAAP is provided in the Appendix 0.0% 2.0% 4.0% 6.0% 8.0% 10.0% 12.0% 14.0% 2014 2015 2016 2017 2Q17 2Q18 * Adjusted Operating Income

Nasdaq: (UFPT) Growing Book Value Book Value EPS $1.05 $1.05 $1.10 $1.26 $0.78 $10.00 $11.00 $12.00 $13.00 $14.00 $15.00 $16.00 $17.00 $18.00 2014 2015 2016 2017 YTD 2Q18 BV/ Share EPS

Thank you

Nasdaq: (UFPT) Adjusted Operating Income Non - GAAP to GAAP Operating Income Reconciliation