Attached files
| file | filename |
|---|---|
| 8-K - FORM 8-K - LANTRONIX INC | lantronix_8k.htm |
Exhibit 99.1
Investor Presentation August 2018 Copyright © Lantronix 2018. All rights reserved.
Forward - Looking Statements This presentation contains forward - looking statements, including statements concerning our business plans, our product development strategies, and our target financial model . Any statement relating to our plans, goals, expectations or any future event should be considered a forward - looking statement . While we have based our forward - looking statements on our current expectations, forward - looking statements are subject to substantial risks and uncertainties . As a result, our actual results could differ materially from those indicated in our forward - looking statements, and you should not rely on any of these forward - looking statements . Important factors that could cause our actual results and financial condition to differ materially from those indicated in the forward - looking statements include, among others, changes in customer demand, the extent to which we are able to develop successful new products, changes to the rate of decline of our legacy products, and the risks and uncertainties described in “Risk Factors” in our Annual Report on Form 10 - K filed with the Securities and Exchange Commission, or SEC, as well as in our other filings with the SEC . Our forward - looking statements are based on our view as of the date they are made . We expressly disclaim any intent or obligation to update any forward - looking statements after the date hereof .
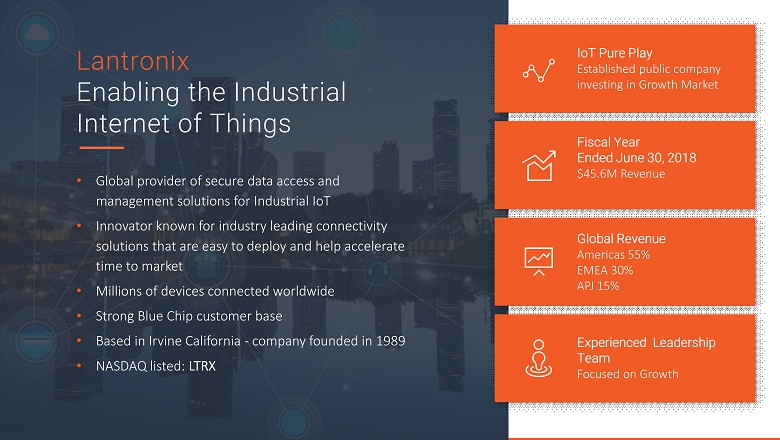
Lantronix Enabling the Industrial Internet of Things • Global provider of secure data access and management solutions for Industrial IoT • Innovator known for industry leading connectivity solutions that are easy to deploy and help accelerate time to market • Millions of devices connected w orldwide • Strong Blue Chip customer base • Based in Irvine California - company founded in 1989 • NASDAQ listed: LTRX IoT Pure Play Established public company investing in Growth Market Fiscal Year Ended June 30, 2018 $45.6M Revenue Global Revenue Americas 55% EMEA 30% APJ 15% Experienced Leadership Team Focused on Growth
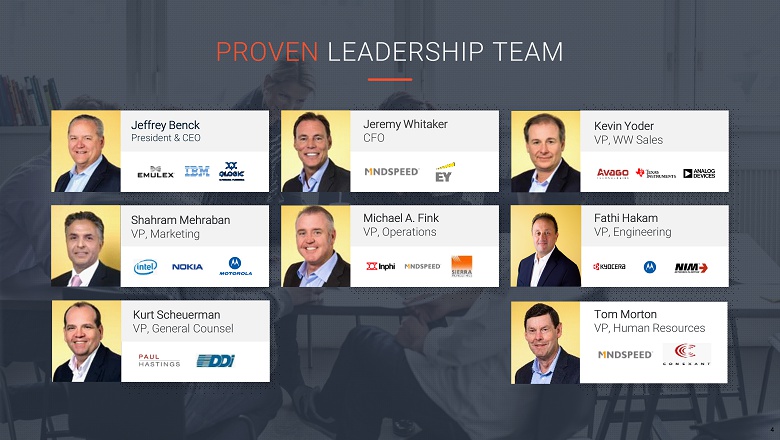
4 PROVEN LEADERSHIP TEAM Jeffrey Benck President & CEO Jeremy Whitaker CFO Michael A. Fink VP, Operations Fathi Hakam VP, Engineering Shahram Mehraban VP, Marketing Kurt Scheuerman VP, General Counsel Tom Morton VP, Human Resources Kevin Yoder VP, WW Sales
5 OUR MISSION CREATING SECURE DATA ACCESS AND MANAGEMENT SOLUTIONS FOR THE INDUSTRIAL IOT Our mission is to be the leading supplier of IoT solutions that enable companies to dramatically simplify the creation, deployment, and management of IoT projects while providing secure access to data for applications and people.
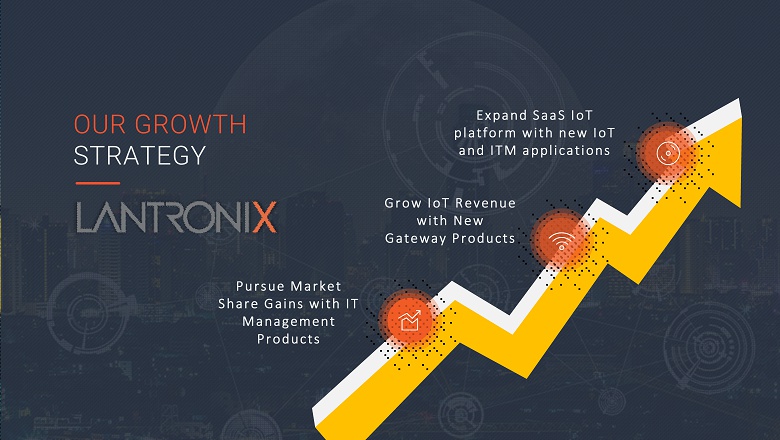
Expand SaaS IoT platform with new IoT and ITM applications Pursue Market Share Gains with IT Management Products Grow IoT Revenue with New Gateway Products OUR GROWTH STRATEGY

Product Portfolio 7 IOT GATEWAYS & BUILDING BLOCKS Connectivity Without Complexity IT MANAGEMENT SOLUTIONS Management of Enterprise IT Infrastructure MANAGEMENT SOFTWARE Scalable Software Made Simple

what WELL POSITIONED IN KEY MARKET SEGMENTS Strong base of global blue - chip customers RETAIL INDUSTRIAL ENERGY / UTILITIES HEALTHCARE SMART BUILDING TRANSPORTATION FINANCIALS EDUCATION MILITARY & GOV’T TELECOM
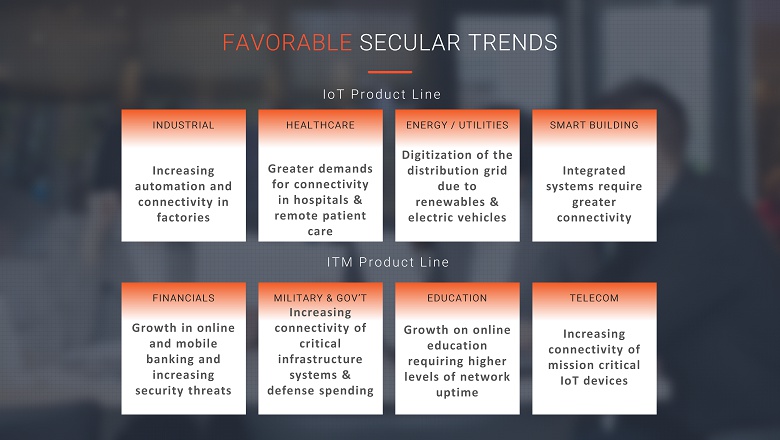
FAVORABLE SECULAR TRENDS IoT Product Line Growth in online and mobile banking and increasing security threats FINANCIALS Growth on online education requiring higher levels of network uptime EDUCATION Increasing connectivity of critical infrastructure systems & defense spending MILITARY & GOV’T Increasing connectivity of mission critical IoT devices TELECOM ITM Product Line Increasing automation and connectivity in factories INDUSTRIAL Digitization of the distribution grid due to renewables & electric vehicles ENERGY / UTILITIES Greater demands for connectivity in hospitals & remote patient care HEALTHCARE Integrated systems require greater connectivity SMART BUILDING

IOT SOLUTIONS FROM THE DEVICE TO THE DATA CENTER New Connected Devices Legacy Devices Network Lantronix Embedded Modules & Gateways Data Center Lantronix External Device Gateways Lantronix IT Management Solutions

LANTRONIX IOT GATEWAYS PRODUCT PORTFOLIO Secure and certified enterprise - ready connectivity, network intelligence and management at scale for industrial and commercial devices and machines Embedded IoT Gateways Ideal to drop into any new or inflight design and their tiny size is perfect for high - volume integration IoT Device Gateways Ideal for connecting existing devices and machines or when it is desirable to keep connectivity external to asset xPico 240 Mid - range Ethernet, Wi - Fi PremierWave 2050 Enhanced Ethernet, Wi - Fi Bluetooth SGX5150 Ethernet, Wi - Fi Bluetooth PremierWave XC HSPA+ Ethernet, Cellular xPico 250 Mid - range Ethernet, Wi - Fi Bluetooth XPort Edge Serial to Ethernet

▪ Seamlessly enable Wi - Fi, Ethernet and Bluetooth connectivity ▪ Build and deploy with production ready embedded software ▪ Integrate advanced enterprise security and intelligent networking ▪ Remotely monitor, manage and maintain your machines with MACH10 Accelerate the development of secure connected machines xPico 200 Series of Embedded IoT Gateways Best - in - Class Embedded Solution for Managed Industrial Wi - Fi Connectivity AGV Robot Connected Weighing Scale Connected Water Purifier Medical Scanner Drone

Copyright © Lantronix 2017. All rights reserved. COMPANY CONFIDENTIAL XPort Edge Next Generation Embedded Ethernet Gateway & Device Server in the same compact form factor as XPort Industrial IOT - Accelerated. Next generation of the world’s best selling embedded Ethernet device server providing full IoT gateway connectivity to any device with serial capability 13 Connected Door Locks Commercial Smart Meter Connected Cash Drawer Connected Parking Meter Gaming Machines

Copyright © Lantronix 2017. All rights reserved. COMPANY CONFIDENTIAL 14 LANTRONIX GATEWAY CENTRAL Device Management SaaS Offering for Lantronix Gateways Cloud - powered Configuration, Management And Monitoring For Lantronix Gateways Centralized Directory for IoT Gateways Automate Updates Monitor Network Statistics and Configure Alerts MINIMIZE TRUCK ROLLS. INCREASE EQUIPMENT UPTIME. Seamless Upgrade to Global Device Manager

Lantronix IT Management Product Portfolio ADVANCED CONSOLE MANAGER BRANCH OFFICE MANAGER REMOTE KVM - OVER - IP Enterprise Data Centers & Development Labs Retail Store & Branch Offices Kiosks, Digital Signs, Test Labs

Lantronix ConsoleFlow Bringing In - band Productivity to Out - of - Band Networks • Cloud - based or on - premise software with mobile app • Centralized management of Lantronix console managers • Secure remote access, automated monitoring, and real - time notifications
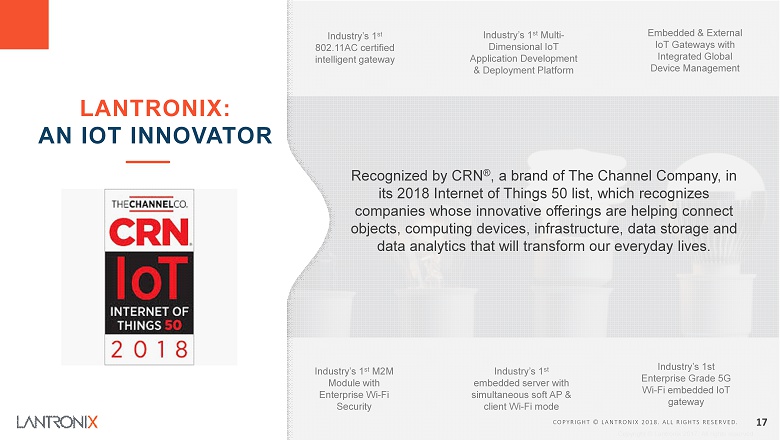
Copyright © Lantronix 2017. All rights reserved. COMPANY CONFIDENTIAL COPYRIGHT © LANTRONIX 2018. ALL RIGHTS RESERVED. 17 LANTRONIX: AN IOT INNOVATOR Industry’s 1 st 802.11AC certified intelligent gateway Industry’s 1 st M2M Module with Enterprise Wi - Fi Security Industry’s 1 st embedded server with simultaneous soft AP & client Wi - Fi mode Industry’s 1st Enterprise Grade 5G Wi - Fi embedded IoT gateway Recognized by CRN ® , a brand of The Channel Company, in its 2018 Internet of Things 50 list, which recognizes companies whose innovative offerings are helping connect objects, computing devices, infrastructure, data storage and data analytics that will transform our everyday lives. Industry’s 1 st Multi - Dimensional IoT Application Development & Deployment Platform Embedded & External IoT Gateways with Integrated Global Device Management

18 Operating Results

SELECTED FISCAL YEAR FINANCIAL PERFORMANCE $- $2,000 $4,000 $6,000 $8,000 $10,000 $12,000 $14,000 $16,000 FY15 FY16 FY17 FY18 Liquidity Working Capital Cash $- $10,000 $20,000 $30,000 $40,000 $50,000 FY15 FY16 FY17 FY18 Net Revenue by Product Line IoT ITM Other - In FY18, IoT and ITM grew by 6% and 4%, respectively - Drag on topline from Other (EOL) nearly gone - Reversed 3 years of revenue decline w/ growth in FY18 & FY17 - 1 st annual GAAP profit in 18 years - Nearly 200% growth in non - GAAP income in FY18 - FY18 GAAP gross profit margin - 300 BP improvement from FY17 & 800 BP improvement from FY16 - Consistent improvement in cash & working capital 47.3% 47.7% 52.7% 55.7% 0.0% 10.0% 20.0% 30.0% 40.0% 50.0% 60.0% $(4,000) $(3,000) $(2,000) $(1,000) $- $1,000 $2,000 $3,000 $4,000 FY15 FY16 FY17 FY18 Gross Margin and Profitability GAAP Income Non-GAAP Income GPM %
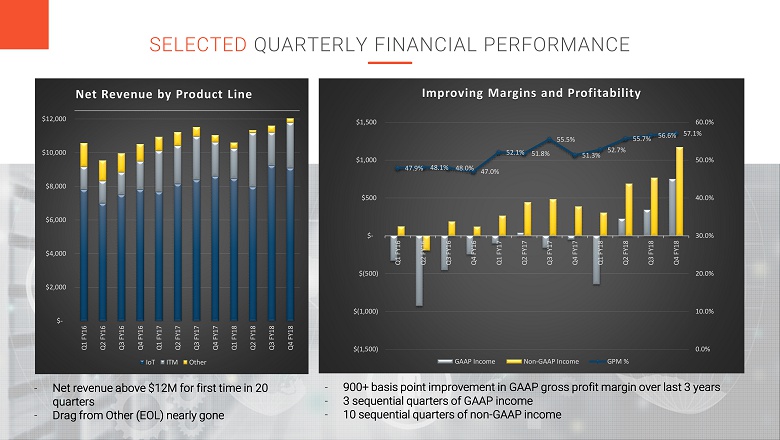
SELECTED QUARTERLY FINANCIAL PERFORMANCE - Net revenue above $12M for first time in 20 quarters - Drag from Other (EOL) nearly gone - 900+ basis point improvement in GAAP gross profit margin over last 3 years - 3 sequential quarters of GAAP income - 10 sequential quarters of non - GAAP income $- $2,000 $4,000 $6,000 $8,000 $10,000 $12,000 Q1 FY16 Q2 FY16 Q3 FY16 Q4 FY16 Q1 FY17 Q2 FY17 Q3 FY17 Q4 FY17 Q1 FY18 Q2 FY18 Q3 FY18 Q4 FY18 Net Revenue by Product Line IoT ITM Other 47.9% 48.1% 48.0% 47.0% 52.1% 51.8% 55.5% 51.3% 52.7% 55.7% 56.6% 57.1% 0.0% 10.0% 20.0% 30.0% 40.0% 50.0% 60.0% $(1,500) $(1,000) $(500) $- $500 $1,000 $1,500 Q1 FY16 Q2 FY16 Q3 FY16 Q4 FY16 Q1 FY17 Q2 FY17 Q3 FY17 Q4 FY17 Q1 FY18 Q2 FY18 Q3 FY18 Q4 FY18 Improving Margins and Profitability GAAP Income Non-GAAP Income GPM %

21 (In thousands) Q4 FY17 Q1 FY18 Q2 FY18 Q3 FY18 Q4 FY18 FY16 FY17 FY18 Net Revenue $ 11,044 $ 10,606 $ 11,336 $ 11,601 $ 12,037 $ 40,592 $ 44,730 $ 45,580 Gross Profit $ 5,670 $ 5,594 $ 6,314 $ 6,584 $ 6,876 $ 19,378 $ 23,580 $ 25,368 % of Net Revenue 51.3% 52.7% 55.7% 56.8% 57.1% 47.7% 52.7% 55.7% GAAP Net Income (Loss) $ (52) $ (641) $ 225 $ 344 $ 752 $ (1,962) $ (277) $ 680 Non - GAAP Net Income (Loss) $ 388 $ 306 $ 689 $ 767 $ 1,173 $ 238 $ 1,581 $2,935 ▪ Highest net revenue in 20 quarters ▪ Record GM% ▪ 3 rd consecutive quarter of GAAP profitability ▪ 10 th consecutive quarter of non - GAAP profitability Q4 FY 2018 HIGHLIGHTS: SELECTED INCOME STATEMENT INFORMATION ▪ 2 nd year of sequential revenue growth ▪ 300 BP improvement in GM% ▪ Nearly doubled non - GAAP pro fit FY 2018 HIGHLIGHTS:

SELECTED BALANCE SHEET INFORMATION (In thousands except price per share data) June 30, June 30, 2017 2018 Cash and Cash Equivalents $ 8,073 $ 9,568 Accounts Receivable, Net 3,432 4,244 Inventories, Net 6,959 8,439 Total Current Assets 19,380 23,270 Current Liabilities 8,989 9,726 Working Capital 10,391 13,544 Common Shares Outstanding 17,809 18,908 RSUs Outstanding 300 140 Stock Options Outstanding 4,184 3,931 Weighted Average Exercise Price Per Option $ 1.78 $ 1.73

Invest in one of the few public company IoT pure plays ▪ Established global IoT solutions provider with blue chip customer base ▪ Seasoned leadership team w/ significant enterprise experience ▪ Pursuing fast growing IoT market with double digit CAGRs ▪ MACH10 platform and related software applications enable incremental growth opportunity Solid operational execution and improving fundamentals ▪ Reversed 3 years of revenue declines with 2% & 10% growth during FY18 & FY17, respectively ▪ In FY18, reported GAAP profit & nearly doubled non - GAAP profit ▪ 3rd quarter of GAAP profitability & 10th quarter of non - GAAP profitability ▪ Business model with significant operating leverage ▪ No long - term debt, nine consecutive quarters of increased cash ▪ Substantial NOL federal carryover SUMMARY
investors@lantronix.com

25 (In thousands) Q4 FY17 Q1 FY18 Q2 FY18 Q3 FY18 Q4 FY18 FY16 FY17 FY18 GAAP Net Income (Loss) $ (52) $ (641) $ 225 $ 344 $ 752 $ (1,962) $ (277) $ 680 Non - GAAP Adjustments: Share - based Compensation 267 272 310 295 292 870 912 1,169 Depreciation and Amortization 139 117 109 110 106 759 594 442 Interest Expense, Net 5 4 5 5 4 32 23 18 Other (Income) Expense, Net 6 (1) (1) 1 9 (61) 3 8 Withholding Taxes on Stock Grants 2 3 3 4 4 4 12 13 Severance and Restructuring Costs - 527 - (21) - 533 246 506 Provision (Benefit) for Income Taxes 21 25 38 29 6 63 68 98 Total Non - GAAP Adjustments 440 947 464 423 421 2,200 1,858 2,255 Non - GAAP Net Income (Loss) $ 388 $ 306 $ 689 $ 767 $ 1,173 $ 238 $ 1,581 $2,935 Lantronix believes that the presentation of non - GAAP financial information, when presented in conjunction with the corresponding GAAP measures, provides important supplemental information to management and investors regarding financial and business trends relating to the Compan y's financial condition and results of operations. The non - GAAP financial measures disclosed by the Company should not be considered a substitute for, or superior t o, financial measures calculated in accordance with GAAP, and the financial results calculated in accordance with GAAP and reconciliations of the non - GAAP financ ial measures to the financial measures calculated in accordance with GAAP should be carefully evaluated. The non - GAAP financial measures used by the Company m ay be calculated differently from, and therefore may not be comparable to, similarly titled measures used by other companies. The Company has provided rec onc iliations of the non - GAAP financial measures to the most directly comparable GAAP financial measures. Management believes that non - GAAP operating expenses , non - GAAP net income (loss) and non - GAAP net income (loss) per share are important measures of the Company's business. Management uses the aforementioned no n - GAAP measures to monitor and evaluate ongoing operating results and trends to gain an understanding of our comparative operating performance. Non - GAAP op erating expenses consist of operating expenses excluding (i) share - based compensation and related payroll taxes (ii) depreciation and amortization; and (iii ) restructuring and severance charges. Non - GAAP net income (loss) consists of net income (loss) excluding (i) non - GAAP adjustments to operating expenses, (ii) interest income (expense), (iii) other income (expense), and (iv) income tax provision (benefit). APPENDIX A: Reconciliation of Non - GAAP Financial Measures