Attached files
| file | filename |
|---|---|
| 8-K - 8-K - GreenSky, Inc. | a18-21048_18k.htm |

Forward-Looking Statements and Non-GAAP Financial Measures This presentation contains forward-looking statements within the meaning of Section 27A of the Securities Act of 1933, as amended, and Section 21E of the Securities Exchange Act of 1934, as amended. The forward-looking statements reflect our current views with respect to, among other things, our operations and financial performance; growth; market opportunity; strategy; growth in our ecosystem of merchants, consumers and bank partners; bank partner commitments; and the impact of credit shocks. You generally can identify these statements by the use of words such as “outlook,” “potential,” “continue,” “may,” “seek,” “approximately,” “predict,” “believe,” “expect,” “plan,” “intend,” “estimate” or “anticipate” and similar expressions or the negative versions of these words or comparable words, as well as future or conditional verbs such as “will,” “should,” “would,” “likely” and “could.” These statements are subject to certain risks and uncertainties that could cause actual results to differ materially from those included in the forward-looking statements. These risks and uncertainties include those risks described in our filings with the Securities and Exchange Commission and include, but are not limited to, risks related to our ability to retain existing, and attract new, merchants and bank partners; our future financial performance, including trends in revenue, cost of revenue, gross profit or gross margin, operating expenses, and free cash flow; changes in market interest rates; increases in loan delinquencies; our ability to operate successfully in a highly regulated industry; the effect of management changes; cyberattacks and security vulnerabilities in our products and services; and our ability to compete successfully in highly competitive markets. The forward-looking statements speak only as of the date on which they are made, and, except to the extent required by federal securities laws, we disclaim any obligation to update any forward-looking statement to reflect events or circumstances after the date on which the statement is made or to reflect the occurrence of unanticipated events. In light of these risks and uncertainties, there is no assurance that the events or results suggested by the forward-looking statements will in fact occur, and you should not place undue reliance on these forward-looking statements. Furthermore, this presentation includes illustrative examples that are based on a number of assumptions. Our actual results could differ materially from the results indicated in the examples. This presentation also contains information about the Company’s Pro Forma Net income, Pro Forma Diluted EPS, and Adjusted EBITDA, all of which are non-GAAP financial measures provided as a supplement to the results provided in accordance with accounting principles generally accepted in the United States of America (“GAAP”). We use Adjusted EBITDA to manage our business, make planning decisions, evaluate our performance and allocate resources. We believe that Adjusted EBITDA and the other non-GAAP financial measures presented herein provide useful information about our financial performance, enhance the overall understanding of our past performance and future prospects, and allow for greater transparency with respect to important metrics used by our management in connection with financial and operational decision-making. We are presenting these non-GAAP measures to assist investors in evaluating our financial performance and because we believe that these measures provide an additional tool for investors to use in comparing our core financial performance over multiple periods with other companies in our industry. A reconciliation of each of these non-GAAP financial measures to the most directly comparable GAAP financial measure is included as an appendix to this presentation. These non-GAAP measures are presented for supplemental informational purposes only and should not be considered a substitute for financial information presented in accordance with GAAP. These non-GAAP measures have limitations as analytical tools and should not be considered in isolation or as a substitute for analysis of other GAAP financial measures. The non-GAAP measures GreenSky uses may differ from the non-GAAP measures used by other companies.. 2
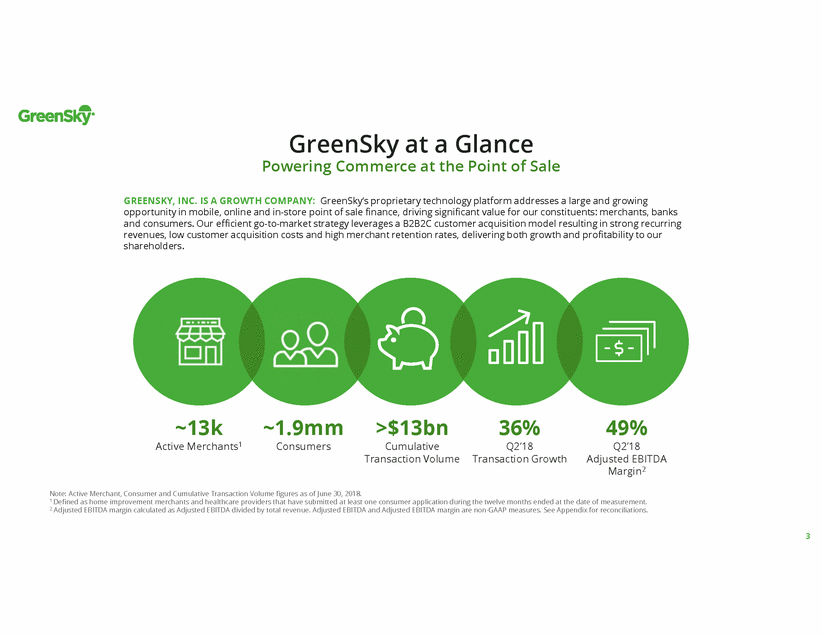
GreenSky at a Glance Powering Commerce at the Point of Sale GREENSKY, INC. IS A GROWTH COMPANY: GreenSky’s proprietary technology platform addresses a large and growing opportunity in mobile, online and in-store point of sale finance, driving significant value for our constituents: merchants, banks and consumers. Our efficient go-to-market strategy leverages a B2B2C customer acquisition model resulting in strong recurring revenues, low customer acquisition costs and high merchant retention rates, delivering both growth and profitability to our shareholders. ~13k Active Merchants1 ~1.9mm Consumers >$13bn Cumulative Transaction Volume 36% Q2’18 Transaction Growth 49% Q2’18 Adjusted EBITDA Margin2 Note: Active Merchant, Consumer and Cumulative Transaction Volume figures as of June 30, 2018. 1 Defined as home improvement merchants and healthcare providers that have submitted at least one consumer application during the twelve months ended at the date of measurement. 2 Adjusted EBITDA margin calculated as Adjusted EBITDA divided by total revenue. Adjusted EBITDA and Adjusted EBITDA margin are non-GAAP measures. See Appendix for reconciliations. 3
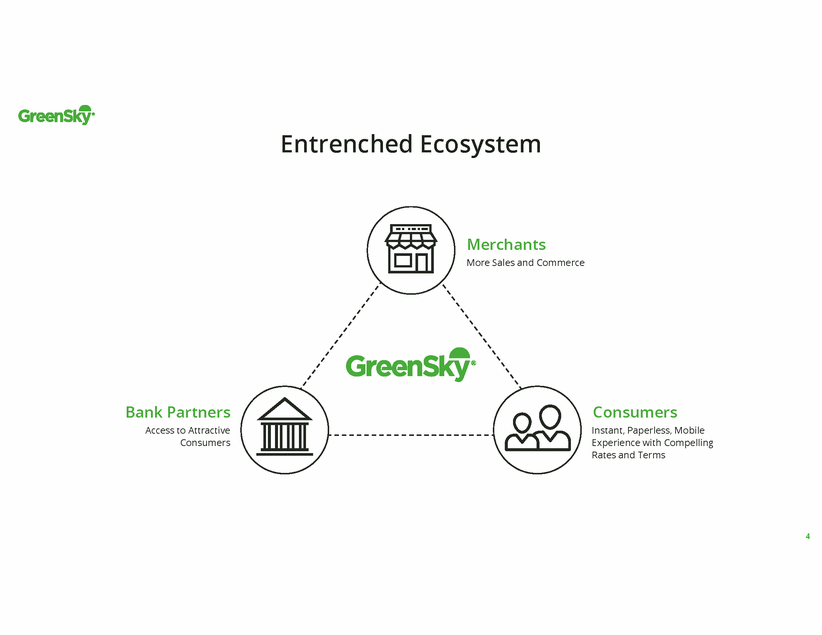
Entrenched Ecosystem Merchants More Sales and Commerce Bank Partners Access to Attractive Consumers Consumers Instant, Paperless, Mobile Experience with Compelling Rates and Terms 4
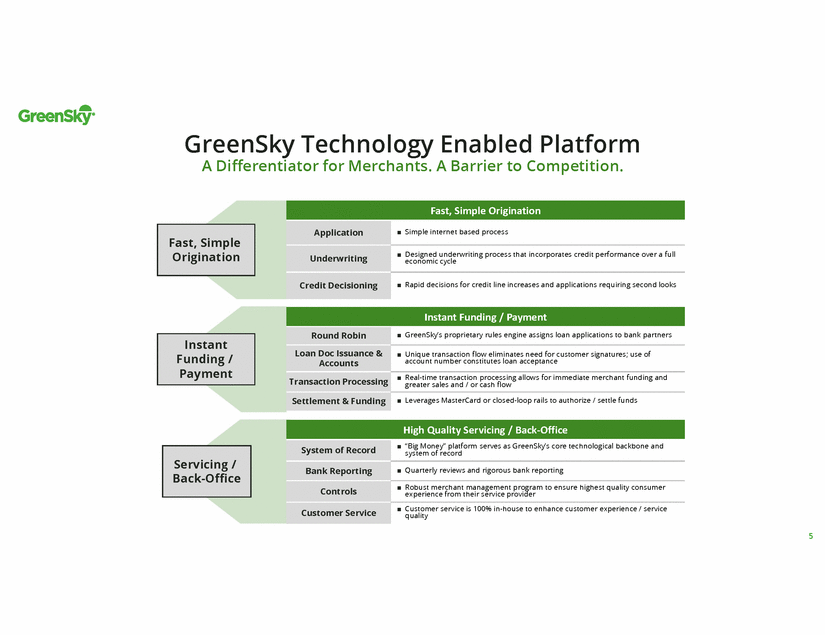
GreenSky Technology Enabled Platform A Differentiator for Merchants. A Barrier to Competition. economic cycle Funding / account number constitutes loan acceptance greater sales and / or cash flow system of record experience from their service provider quality 5 Servicing / Back-Office High Quality Servicing / Back-Office System of Record “Big Money” platform serves as GreenSky’s core technological backbone and Bank Reporting Quarterly reviews and rigorous bank reporting Controls Robust merchant management program to ensure highest quality consumer Customer Service Customer service is 100% in-house to enhance customer experience / service Instant Payment Instant Funding / Payment Round Robin GreenSky’s proprietary rules engine assigns loan applications to bank partners Loan Doc Issuance & Accounts Unique transaction flow eliminates need for customer signatures; use of Transaction Processing Real-time transaction processing allows for immediate merchant funding and Settlement & Funding Leverages MasterCard or closed-loop rails to authorize / settle funds Fast, Simple Origination Fast, Simple Origination Application Simple internet based process Underwriting Designed underwriting process that incorporates credit performance over a full Credit Decisioning Rapid decisions for credit line increases and applications requiring second looks
Salesperson for Energy-Efficient Windows & Doors Offer interest-free financing for 12 months Our Merchants Online Exercise Equipment Retailer Make a $6,000 sale into an $89 monthly payment Dentist Offer a complete $5,000 treatment for $69 per month 6

Our Consumers Consumers with Prime & Super Prime Credit Scores Promotional financing is an attractive payment solution 7

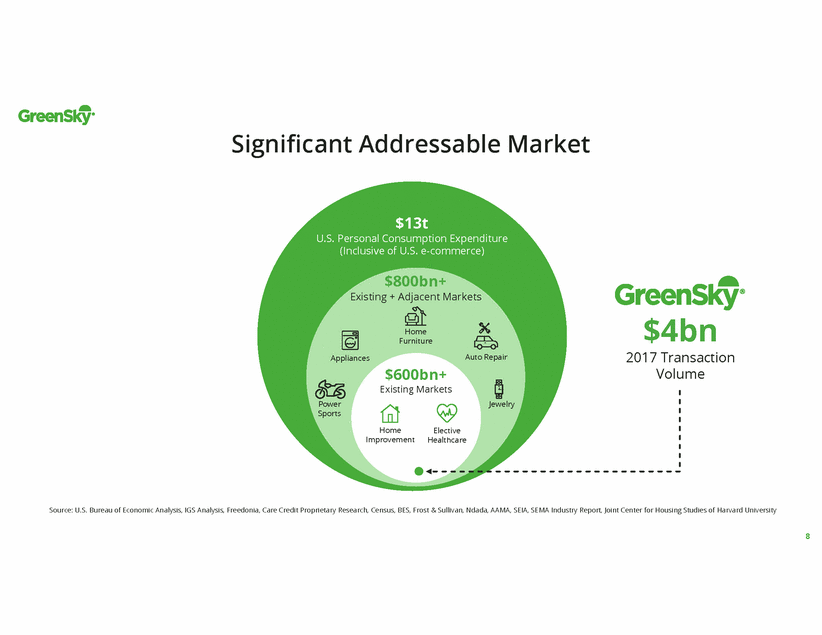
Significant Addressable Market $13t U.S. Personal Consumption Expenditure (Inclusive of U.S. e-commerce) $800bn+ Existing + Adjacent Markets $4bn 2017 Transaction Volume Home Furniture Auto Repair Appliances $600bn+ Existing Markets Power Sports Jewelry Home Improvement Elective Healthcare Source: U.S. Bureau of Economic Analysis, IGS Analysis, Freedonia, Care Credit Proprietary Research, Census, BES, Frost & Sullivan, Ndada, AAMA, SEIA, SEMA Industry Report, Joint Center for Housing Studies of Harvard University 8
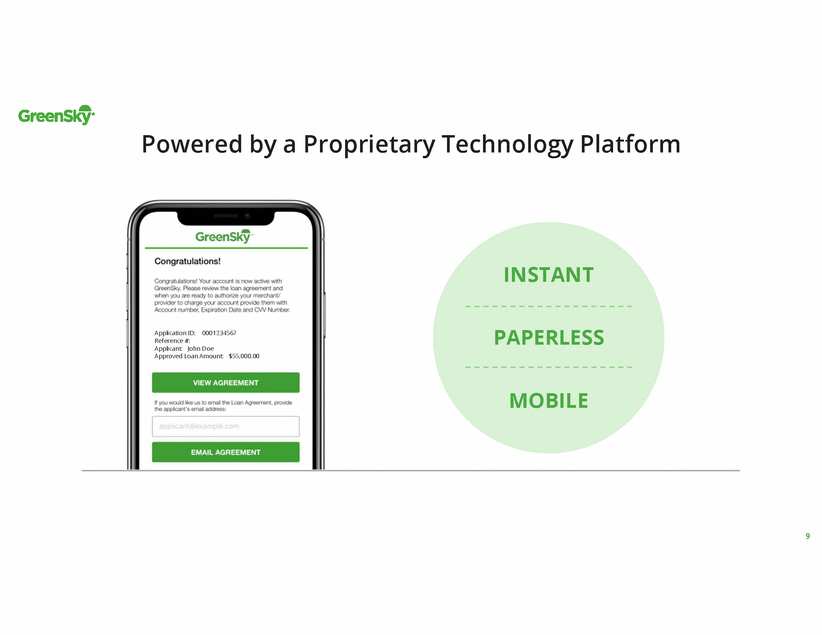
Powered by a Proprietary Technology Platform INSTANT PAPERLESS Application ID: 0001234567 Reference #: Applicant: John Doe Approved Loan Amount: $55,000.00 MOBILE 9
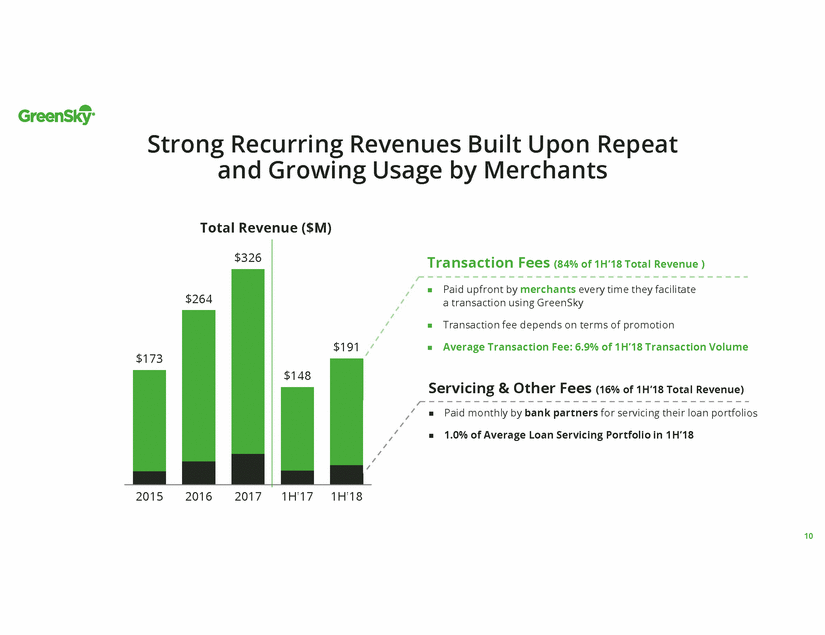
Strong Recurring Revenues Built Upon Repeat and Growing Usage by Merchants Total Revenue ($M) Transaction Fees (84% of 1H’18 Total Revenue ) Paid upfront by merchants every time they facilitate a transaction using GreenSky Transaction fee depends on terms of promotion Average Transaction Fee: 6.9% of 1H’18 Transaction Volume Servicing & Other Fees (16% of 1H’18 Total Revenue) Paid monthly by bank partners for servicing their loan portfolios 1.0% of Average Loan Servicing Portfolio in 1H’18 2015 2016 2017 1H'17 1H'18 10 $326 $191 $264 $173 $148
Key Investment Highlights

Key Investment Highlights Technology Platform Addresses Large Opportunity and Drives Significant Value Deeply Entrenched Ecosystem Efficient Go-To-Market Strategy and Attractive Unit Economics Proven Growth Strategy Attractive Financial Profile Combining Growth, Visibility and Profitability Talented Management Team 12
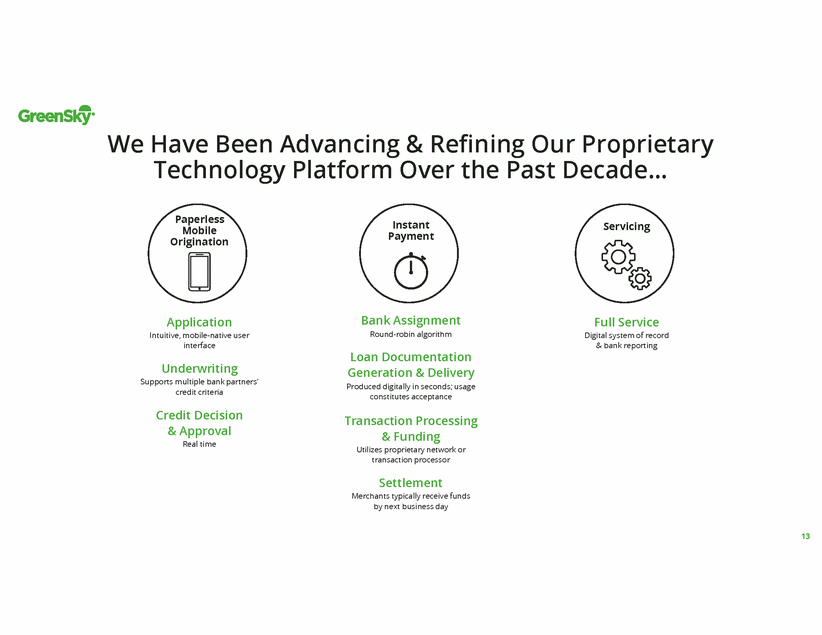
We Have Been Advancing & Refining Our Proprietary Technology Platform Over the Past Decade... Paperless Mobile Origination Instant Payment Servicing Bank Assignment Round-robin algorithm Application Intuitive, mobile-native user interface Full Service Digital system of record & bank reporting Loan Documentation Generation & Delivery Produced digitally in seconds; usage constitutes acceptance Underwriting Supports multiple bank partners’ credit criteria Credit Decision & Approval Real time Transaction Processing & Funding Utilizes proprietary network or transaction processor Settlement Merchants typically receive funds by next business day 13
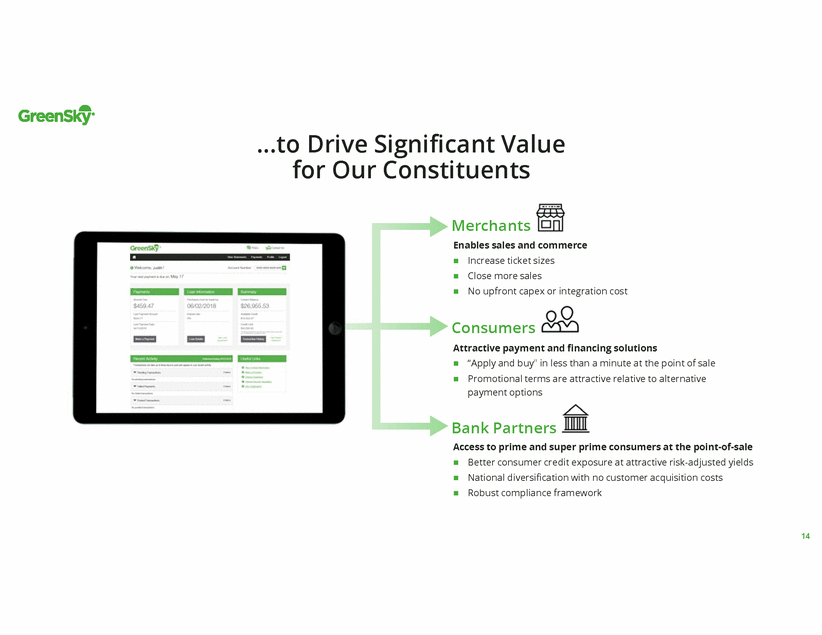
...to Drive Significant Value for Our Constituents Merchants Enables sales and commerce Increase ticket sizes Close more sales No upfront capex or integration cost Consumers Attractive payment and financing solutions “Apply and buy" in less than a minute at the point of sale Promotional terms are attractive relative to alternative payment options Bank Partners Access to prime and super prime consumers at the point-of-sale Better consumer credit exposure at attractive risk-adjusted yields National diversification with no customer acquisition costs Robust compliance framework 14
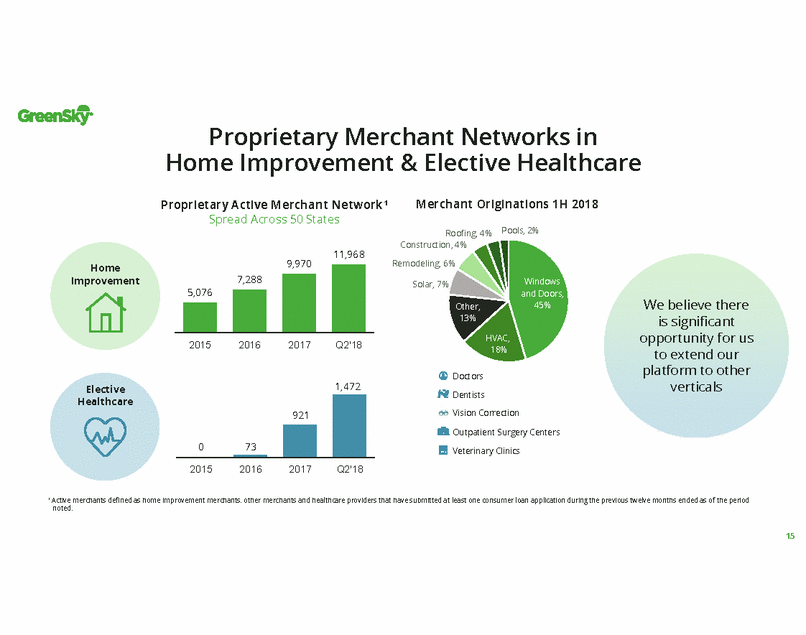
Proprietary Merchant Networks in Home Improvement & Elective Healthcare Merchant Originations 1H 2018 Proprietary Active Merchant Network¹ Spread Across 50 States Pools, 2% Roofing, 4% Construction, 4% 11,968 9,970 Remodeling, 6% Home Improvement Solar, 7% We believe there is significant opportunity for us to extend our platform to other verticals 2015 2016 2017 Q2'18 Doctors 1,472 Elective Healthcare Dentists Vision Correction Outpatient Surgery Centers Veterinary Clinics 2015 2016 2017 Q2'18 1 Active merchants defined as home improvement merchants, other merchants and healthcare providers that have submitted at least one consumer loan application during the previous twelve months ended as of the period noted. 15 921 0 73 7,288 5,076
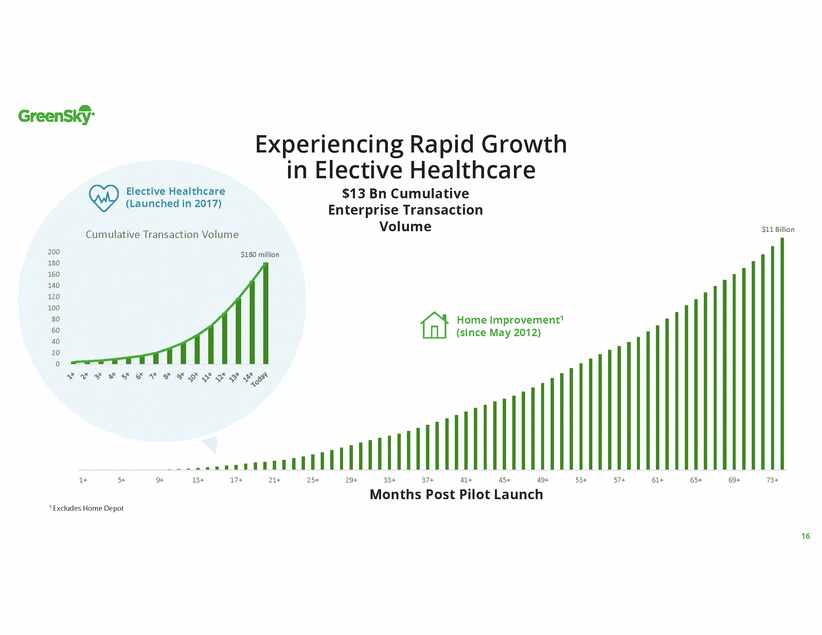
Experiencing Rapid Growth in Elective Healthcare $13 Bn Cumulative Enterprise Transaction Volume Elective Healthcare (Launched in 2017) $11 Billion Cumulative Transaction Volume 200 180 160 140 120 100 80 60 40 20 0 $180 million Home Improvement1 (since May 2012) 1+ 5+ 9+ 13+ 17+ 21+ 25+ 29+ 33+ 37+ 41+ 45+ 49+ 53+ 57+ 61+ 65+ 69+ 73+ Months Post Pilot Launch 1 Excludes Home Depot 16
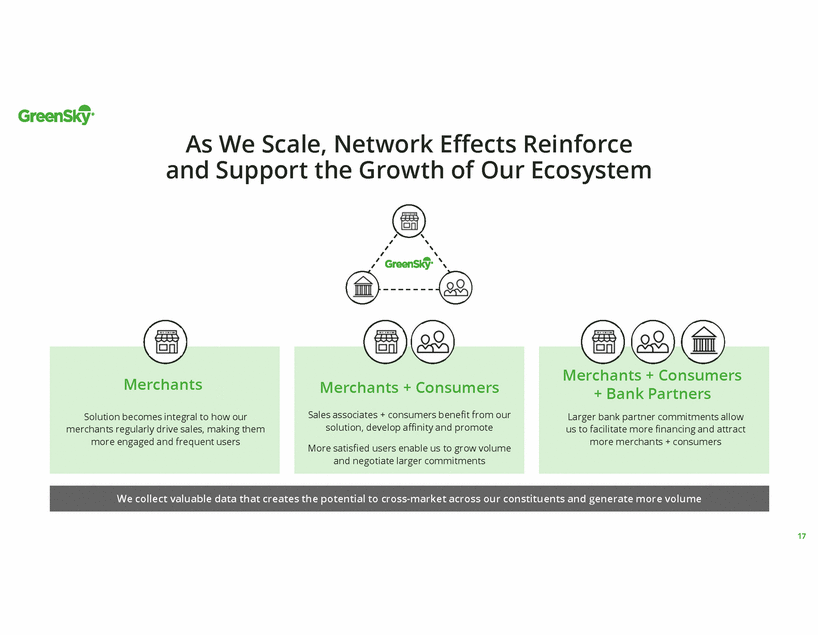
As We Scale, Network Effects Reinforce and Support the Growth of Our Ecosystem + Bank Partners 17 We collect valuable data that creates the potential to cross-market across our constituents and generate more volume Merchants + Consumers Larger bank partner commitments allow us to facilitate more financing and attract more merchants + consumers Merchants Solution becomes integral to how our merchants regularly drive sales, making them more engaged and frequent users Merchants + Consumers Sales associates + consumers benefit from our solution, develop affinity and promote More satisfied users enable us to grow volume and negotiate larger commitments
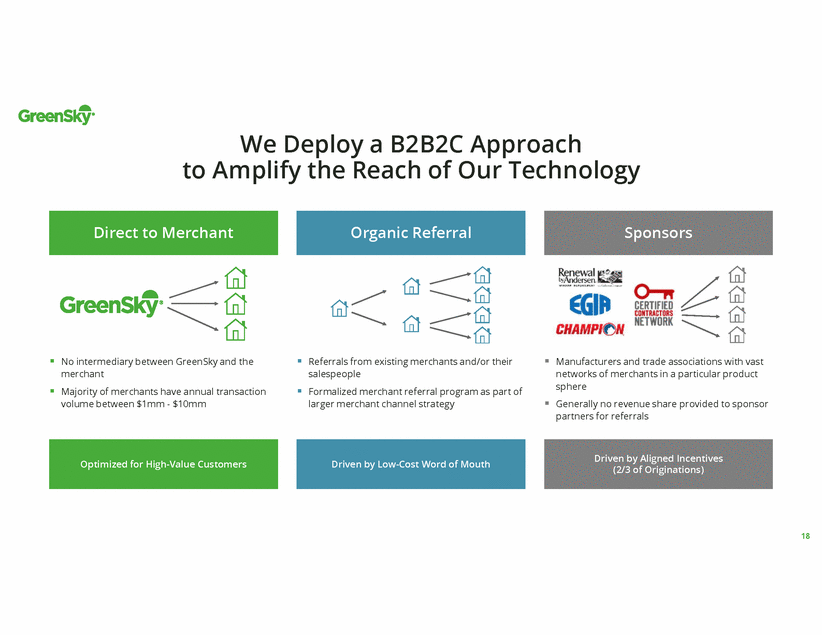
We Deploy a B2B2C Approach to Amplify the Reach of Our Technology No intermediary between GreenSky and the merchant Majority of merchants have annual transaction volume between $1mm - $10mm Referrals from existing merchants and/or their salespeople Formalized merchant referral program as part of larger merchant channel strategy Manufacturers and trade associations with vast networks of merchants in a particular product sphere Generally no revenue share provided to sponsor partners for referrals 18 Optimized for High-Value Customers Driven by Low-Cost Word of Mouth Driven by Aligned Incentives (2/3 of Originations) Direct to Merchant Organic Referral Sponsors
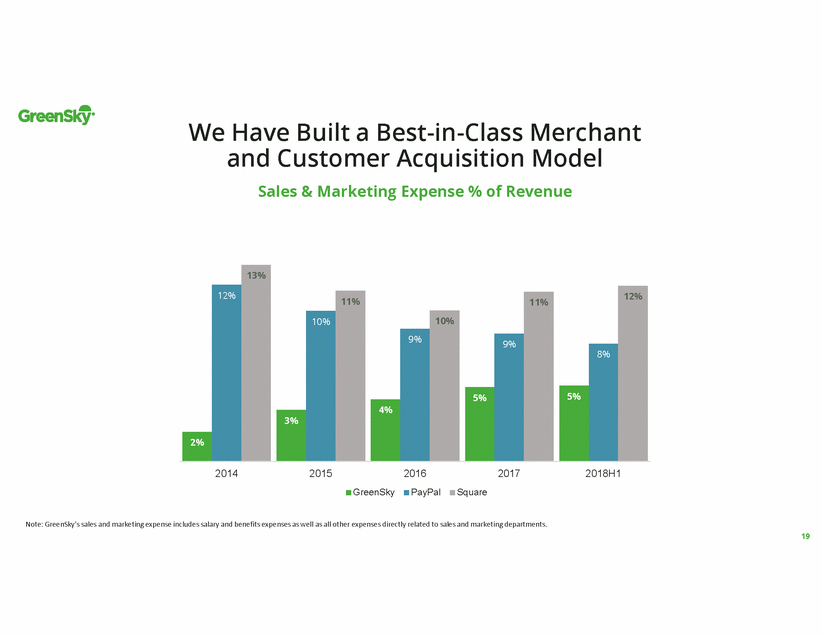
We Have Built a Best-in-Class Merchant and Customer Acquisition Model Sales & Marketing Expense % of Revenue 2014 2015 2016 2017 2018H1 GreenSky PayPal Square Note: GreenSky’s sales and marketing expense includes salary and benefits expenses as well as all other expenses directly related to sales and marketing departments. 19 13% 12% 12% 11% 11% 10% 10% 9% 9% 8% 4% 3% 2% 5% 5%
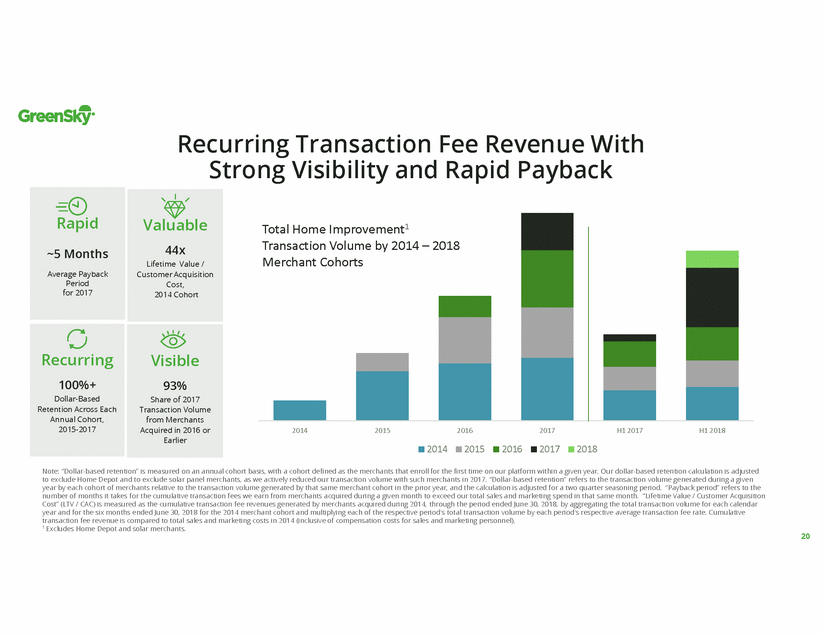
Recurring Transaction Fee Revenue With Strong Visibility and Rapid Payback Merchant Cohorts 2014 2015 2016 2017 H1 2017 H1 2018 2014 2015 2016 2017 2018 Note: “Dollar-based retention” is measured on an annual cohort basis, with a cohort defined as the merchants that enroll for the first time on our platform within a given year. Our dollar-based retention calculation is adjusted to exclude Home Depot and to exclude solar panel merchants, as we actively reduced our transaction volume with such merchants in 2017. “Dollar-based retention” refers to the transaction volume generated during a given year by each cohort of merchants relative to the transaction volume generated by that same merchant cohort in the prior year, and the calculation is adjusted for a two quarter seasoning period. “Payback period” refers to the number of months it takes for the cumulative transaction fees we earn from merchants acquired during a given month to exceed our total sales and marketing spend in that same month. “Lifetime Value / Customer Acquisition Cost” (LTV / CAC) is measured as the cumulative transaction fee revenues generated by merchants acquired during 2014, through the period ended June 30, 2018, by aggregating the total transaction volume for each calendar year and for the six months ended June 30, 2018 for the 2014 merchant cohort and multiplying each of the respective period's total transaction volume by each period's respective average transaction fee rate. Cumulative transaction fee revenue is compared to total sales and marketing costs in 2014 (inclusive of compensation costs for sales and marketing personnel). 1 Excludes Home Depot and solar merchants. 20 Total Home Improvement1 Transaction Volume by 2014 – 2018 Rapid ~5 Months Average Payback Period for 2017 Valuable 44x Lifetime Value / Customer Acquisition Cost, 2014 Cohort Recurring 100%+ Dollar-Based Retention Across Each Annual Cohort, 2015-2017 Visible 93% Share of 2017 Transaction Volume from Merchants Acquired in 2016 or Earlier
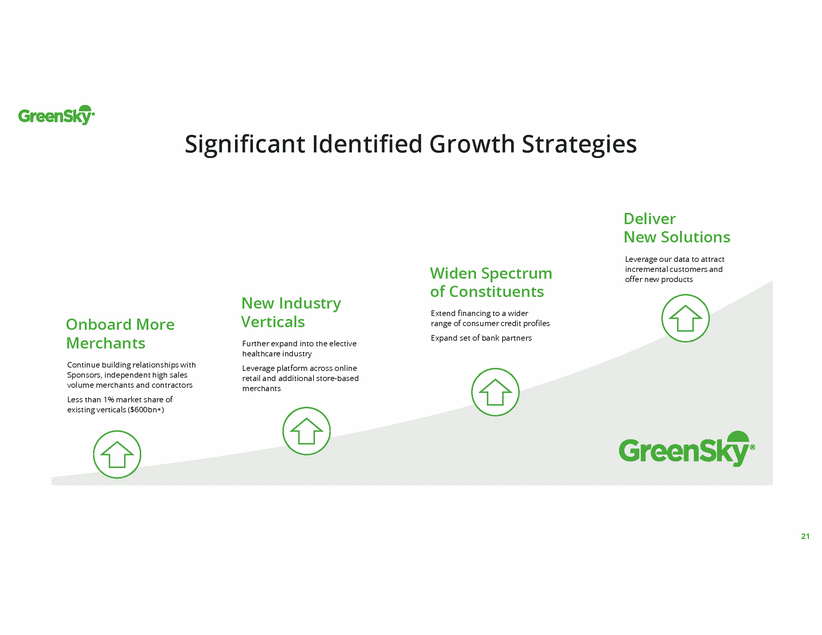
Significant Identified Growth Strategies Deliver New Solutions Leverage our data to attract incremental customers and offer new products Widen Spectrum of Constituents Extend financing to a wider range of consumer credit profiles Expand set of bank partners New Industry Verticals Further expand into the elective healthcare industry Leverage platform across online retail and additional store-based merchants Onboard More Merchants Continue building relationships with Sponsors, independent high sales volume merchants and contractors Less than 1% market share of existing verticals ($600bn+) 21
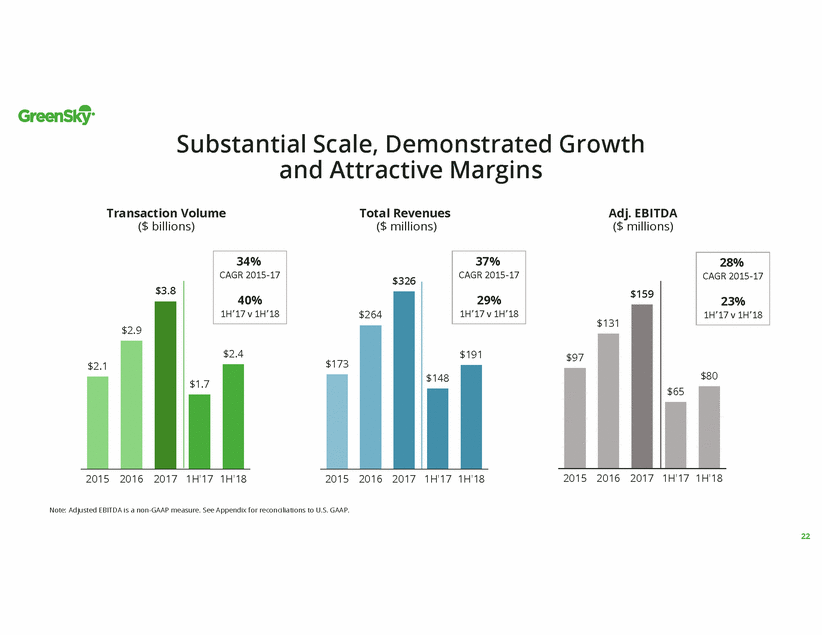
Substantial Scale, Demonstrated Growth and Attractive Margins Transaction Volume ($ billions) Total Revenues ($ millions) Adj. EBITDA ($ millions) $326 2015 2016 2017 1H'17 1H'18 2015 2016 2017 1H'17 1H'18 2015 2016 2017 1H'17 1H'18 Note: Adjusted EBITDA is a non-GAAP measure. See Appendix for reconciliations to U.S. GAAP. 22 $159 $80 $131 $97 $65 $3.8 $2.4 $2.9 $2.1 $1.7 $191 $264 $173 $148 28% CAGR 2015-17 23% 1H’17 v 1H’18 37% CAGR 2015-17 29% 1H’17 v 1H’18 34% CAGR 2015-17 40% 1H’17 v 1H’18
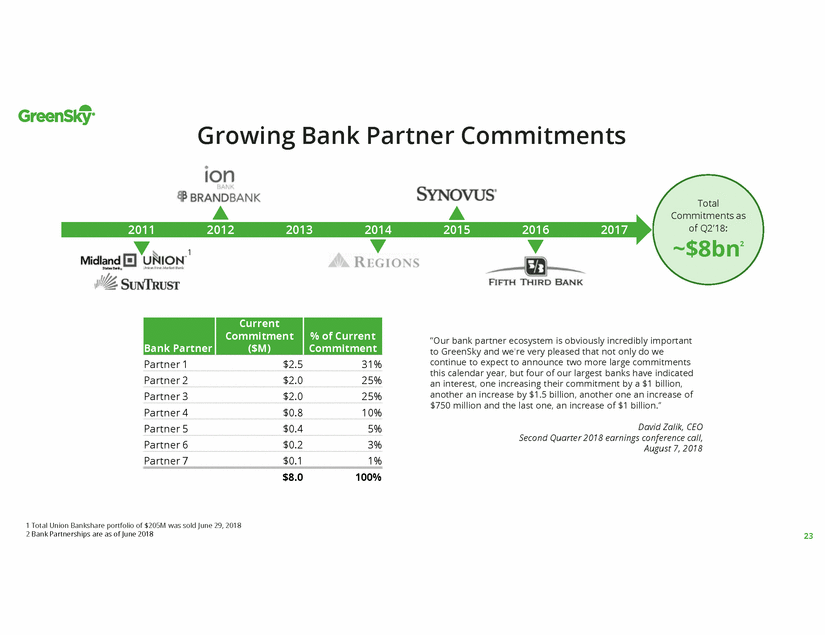
Growing Bank Partner Commitments Total Commitments as of Q2’18: ~$8bn2 2011 2012 2013 2014 2015 2016 2017 1 “Our bank partner ecosystem is obviously incredibly important to GreenSky and we're very pleased that not only do we continue to expect to announce two more large commitments this calendar year, but four of our largest banks have indicated an interest, one increasing their commitment by a $1 billion, another an increase by $1.5 billion, another one an increase of $750 million and the last one, an increase of $1 billion.” Partner 1 $2.5 31% Partner 2 $2.0 25% Partner 3 $2.0 25% Partner 4 $0.8 10% David Zalik, CEO Second Quarter 2018 earnings conference call, August 7, 2018 Partner 5 $0.4 5% Partner 6 $0.2 3% Partner 7 $0.1 1% $8.0 100% 1 Total Union Bankshare portfolio of $205M was sold June 29, 2018 2 Bank Partnerships are as of June 2018 23 Bank Partner Current Commitment% of Current ($M) Commitment
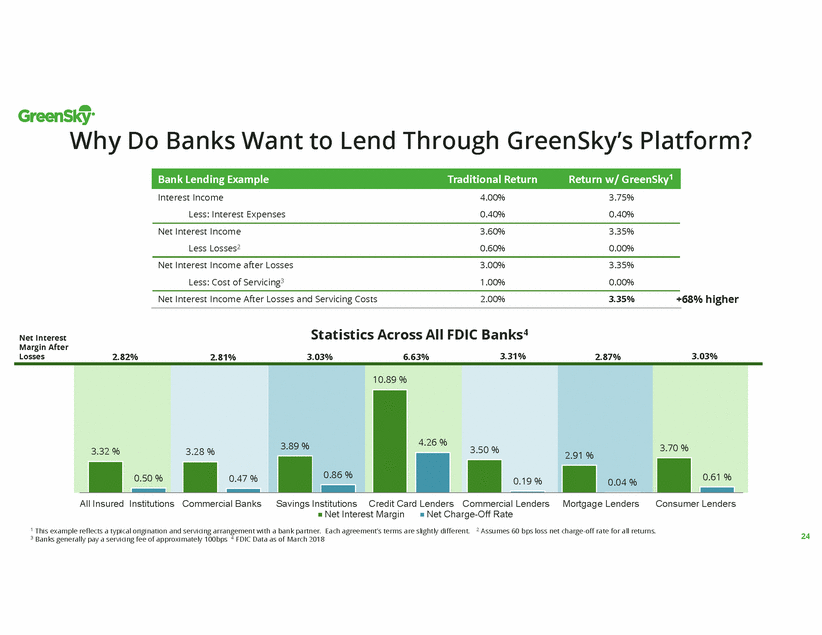
Why Do Banks Want to Lend Through GreenSky’s Platform? Interest Income Less: Interest Expenses 4.00% 0.40% 3.75% 0.40% 68% higher Statistics Across All FDIC Banks4 Net Interest Margin After Losses 3.31% 3.03% 2.82% 3.03% 6.63% 2.87% 2.81% All Insured Institutions Commercial Banks Savings InstitutionsCredit Card Lenders Commercial Lenders Mortgage Lenders Consumer Lenders Net Interest Margin Net Charge-Off Rate 1 This example reflects a typical origination and servicing arrangement with a bank partner. Each agreement’s terms are slightly different. 2 Assumes 60 bps loss net charge-off rate for all returns. 3 Banks generally pay a servicing fee of approximately 100bps 4 FDIC Data as of March 2018 24 3.32 % 3.28 % 3.89 % 10.89 % 3.50 % 2.91 % 3.70 % 4.26 % 0.86 % 0.61 % 0.50 % 0.47 % 0.19 % 0.04 % Net Interest Income3.60% 3.35% Less Losses20.60% 0.00% Net Interest Income after Losses3.00% 3.35% Less: Cost of Servicing3 1.00% 0.00% Net Interest Income After Losses and Servicing Costs 2.00% 3.35%+ Bank Lending ExampleTraditional Return Return w/ GreenSky1
Our Contracts with Our Bank Partners are a Key Innovation for Our Company & Pillar of Our Success Fixed servicing fee Note: Component parts of the incentive payment calculation shown are illustrative and not averages. 25 This structure has resulted in our ability to build a transaction volume centric model with virtually no balance sheet, partner with multiple banks, and monetize via transaction and servicing fees We May Collect Incentive Payments from Bank Partners Billed portfolio yield 10% (1%) Agreed-upon target margin paid to Realized credit lossesbank partner (2.5%) (3.75%) Cash escrow 1% Illustrative incentive payment 2.75%

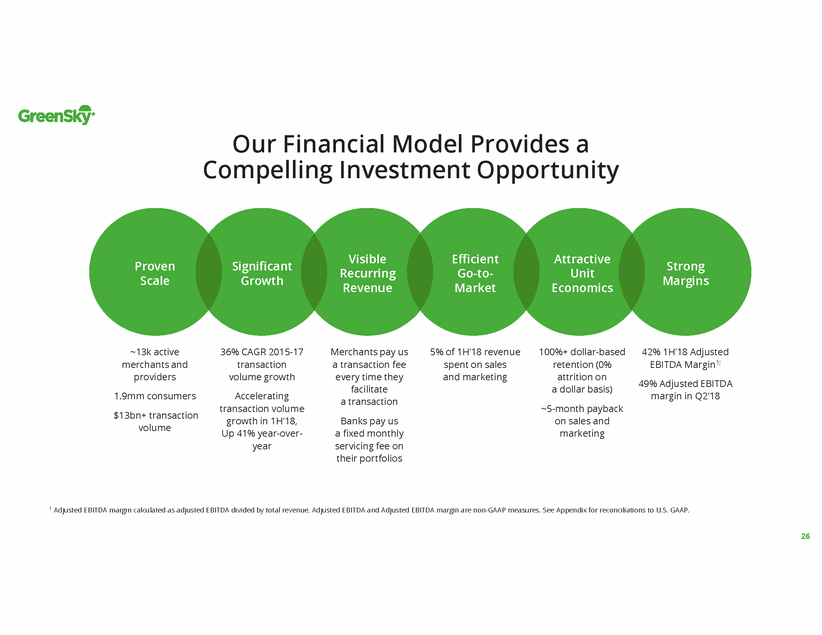
Our Financial Model Provides a Compelling Investment Opportunity Visible Recurring Revenue Efficient Go-to-Market Attractive Unit Economics Proven Scale Significant Growth Strong Margins ~13k active merchants and providers 36% CAGR 2015-17 transaction volume growth Merchants pay us a transaction fee every time they facilitate a transaction 5% of 1H’18 revenue spent on sales and marketing 100%+ dollar-based retention (0% attrition on a dollar basis) 42% 1H’18 Adjusted EBITDA Margin1; 49% Adjusted EBITDA margin in Q2’18 1.9mm consumers $13bn+ transaction volume Accelerating transaction volume growth in 1H’18, Up 41% year-over-year ~5-month payback on sales and marketing Banks pay us a fixed monthly servicing fee on their portfolios 1 Adjusted EBITDA margin calculated as adjusted EBITDA divided by total revenue. Adjusted EBITDA and Adjusted EBITDA margin are non-GAAP measures. See Appendix for reconciliations to U.S. GAAP. 26
Historical Financials

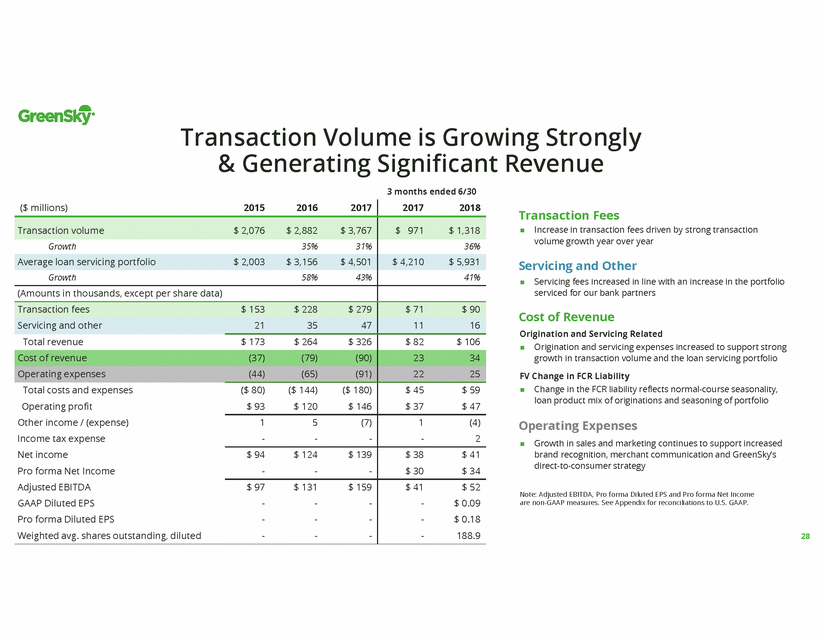
Transaction Volume is Growing Strongly & Generating Significant 3 months ended 6/30 Revenue Transaction Fees Increase in transaction fees driven by strong transaction volume growth year over year Servicing and Other Servicing fees increased in line with an increase in the portfolio serviced for our bank partners Cost of Revenue Origination and Servicing Related Origination and servicing expenses increased to support strong growth in transaction volume and the loan servicing portfolio FV Change in FCR Liability Change in the FCR liability reflects normal-course seasonality, loan product mix of originations and seasoning of portfolio Operating Expenses Growth in sales and marketing continues to support increased brand recognition, merchant communication and GreenSky’s direct-to-consumer strategy Note: Adjusted EBITDA, Pro forma Diluted EPS and Pro forma Net Income are non-GAAP measures. See Appendix for reconciliations to U.S. GAAP. 28 ($ millions)2015 2016 2017 2017 2018 Transaction volume$ 2,076 $ 2,882 $ 3,767 $ 971 $ 1,318 Growth 35% 31% Average loan servicing portfolio$ 2,003 $ 3,156 $ 4,501 Growth 58% 43% 36% $ 4,210 $ 5,931 41% (Amounts in thousands, except per share data) Transaction fees Servicing and other Total revenue Cost of revenue Operating expenses Total costs and expenses Operating profit Other income / (expense) Income tax expense Net income Pro forma Net Income Adjusted EBITDA GAAP Diluted EPS Pro forma Diluted EPS Weighted avg. shares outstanding, diluted $ 153 $ 228 $ 279 21 35 47 $ 71 $ 90 11 16 $ 173 $ 264 $ 326 (37) (79) (90) (44) (65) (91) $ 82 $ 106 23 34 22 25 ($ 80) ($ 144) ($ 180) $ 93 $ 120 $ 146 $ 45 $ 59 $ 37 $ 47 1 5 (7) ---1 (4) -2 $ 94 $ 124 $ 139 ---$ 38 $ 41 $ 30 $ 34 $ 97 $ 131 $ 159 ---------$ 41 $ 52 -$ 0.09 -$ 0.18 -188.9
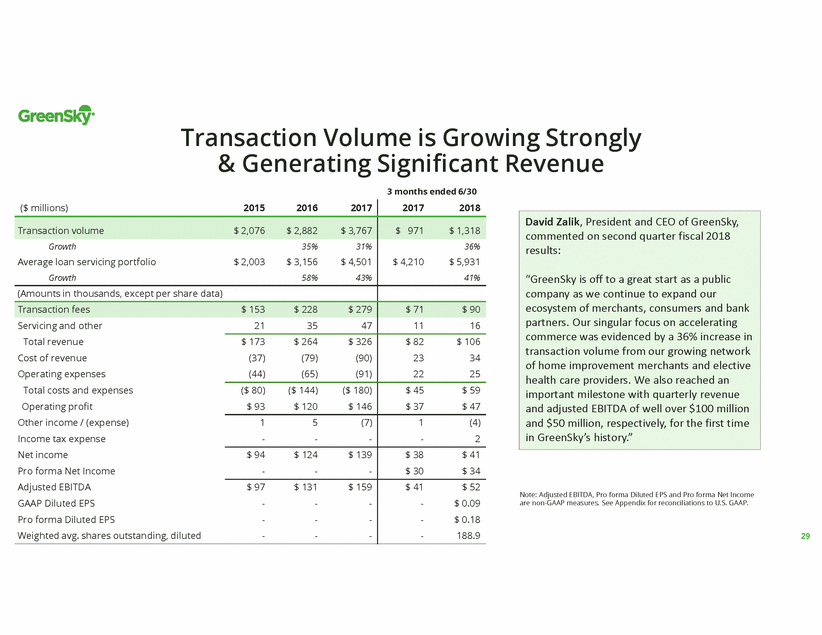
Transaction Volume is Growing Strongly & Generating Significant 3 months ended 6/30 Revenue Note: Adjusted EBITDA, Pro forma Diluted EPS and Pro forma Net Income are non-GAAP measures. See Appendix for reconciliations to U.S. GAAP. 29 ($ millions)2015 2016 2017 2017 2018 Transaction volume$ 2,076 $ 2,882 $ 3,767 $ 971 $ 1,318 Growth 35% 31% Average loan servicing portfolio$ 2,003 $ 3,156 $ 4,501 Growth 58% 43% 36% $ 4,210 $ 5,931 41% (Amounts in thousands, except per share data) Transaction fees Servicing and other Total revenue Cost of revenue Operating expenses Total costs and expenses Operating profit Other income / (expense) Income tax expense Net income Pro forma Net Income Adjusted EBITDA GAAP Diluted EPS Pro forma Diluted EPS Weighted avg. shares outstanding, diluted $ 153 $ 228 $ 279 21 35 47 $ 71 $ 90 11 16 $ 173 $ 264 $ 326 (37) (79) (90) (44) (65) (91) $ 82 $ 106 23 34 22 25 ($ 80) ($ 144) ($ 180) $ 93 $ 120 $ 146 $ 45 $ 59 $ 37 $ 47 1 5 (7) ---1 (4) -2 $ 94 $ 124 $ 139 ---$ 38 $ 41 $ 30 $ 34 $ 97 $ 131 $ 159 ---------$ 41 $ 52 -$ 0.09 -$ 0.18 -188.9 David Zalik, President and CEO of GreenSky, commented on second quarter fiscal 2018 results: “GreenSky is off to a great start as a public company as we continue to expand our ecosystem of merchants, consumers and bank partners. Our singular focus on accelerating commerce was evidenced by a 36% increase in transaction volume from our growing network of home improvement merchants and elective health care providers. We also reached an important milestone with quarterly revenue and adjusted EBITDA of well over $100 million and $50 million, respectively, for the first time in GreenSky’s history.”
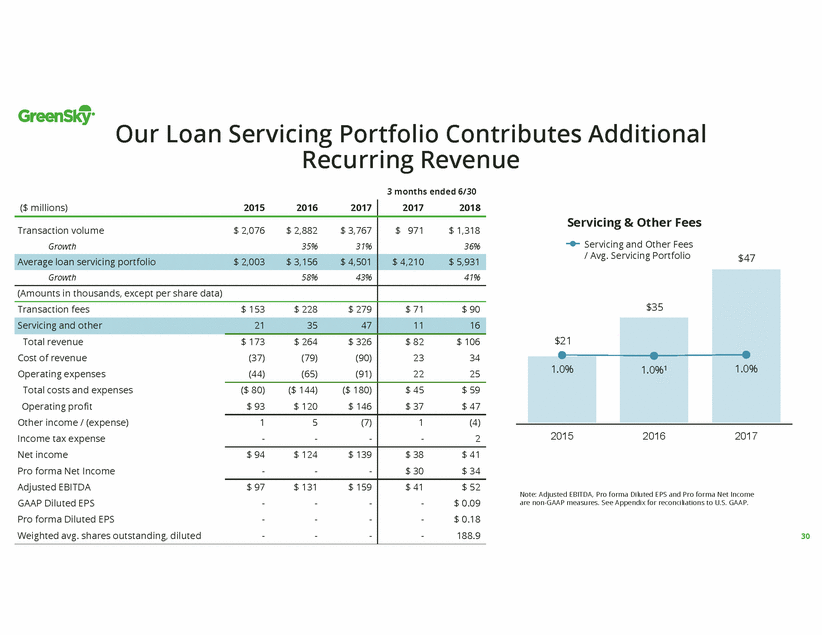
Our Loan Servicing Portfolio Contributes Additional Recurring Revenue 3 months ended 6/30 Servicing & Other Fees Servicing and Other Fees / Avg. Servicing Portfolio $47 2015 2016 2017 Note: Adjusted EBITDA, Pro forma Diluted EPS and Pro forma Net Income are non-GAAP measures. See Appendix for reconciliations to U.S. GAAP. 30 $35 1.0% $21 1.0%1 1.0% ($ millions)2015 2016 2017 2017 2018 Transaction volume$ 2,076 $ 2,882 $ 3,767 Growth 35% 31% Average loan servicing portfolio$ 2,003 $ 3,156 $ 4,501 Growth 58% 43% $ 971 $ 1,318 36% $ 4,210 $ 5,931 41% (Amounts in thousands, except per share data) Transaction fees Servicing and other Total revenue Cost of revenue Operating expenses Total costs and expenses Operating profit Other income / (expense) Income tax expense Net income Pro forma Net Income Adjusted EBITDA GAAP Diluted EPS Pro forma Diluted EPS Weighted avg. shares outstanding, diluted $ 153 $ 228 $ 279 21 35 47 $ 71 $ 90 11 16 $ 173 $ 264 $ 326 (37) (79) (90) (44) (65) (91) $ 82 $ 106 23 34 22 25 ($ 80) ($ 144) ($ 180) $ 93 $ 120 $ 146 $ 45 $ 59 $ 37 $ 47 1 5 (7) ---1 (4) -2 $ 94 $ 124 $ 139 ---$ 38 $ 41 $ 30 $ 34 $ 97 $ 131 $ 159 ---------$ 41 $ 52 -$ 0.09 -$ 0.18 -188.9
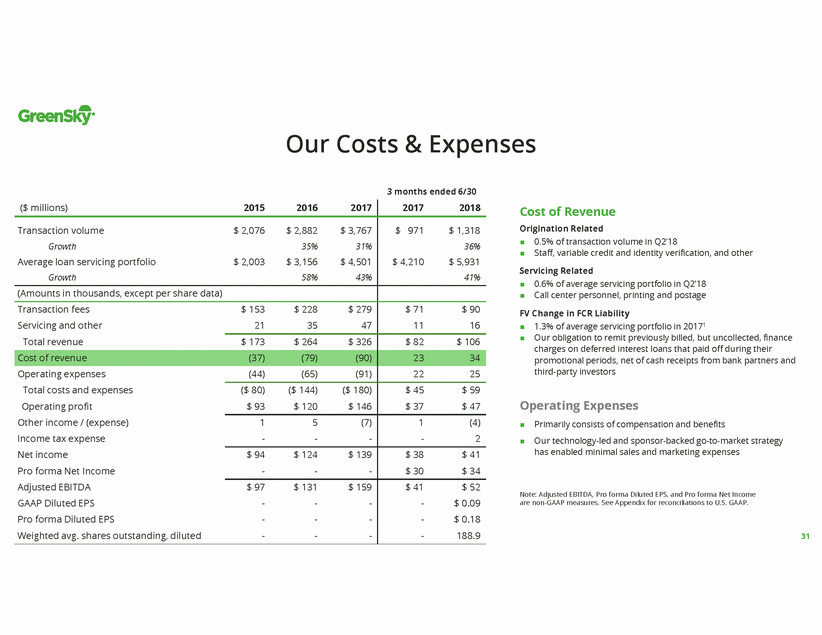
Our Costs & Expenses 3 months ended 6/30 Cost of Revenue Origination Related 0.5% of transaction volume in Q2’18 Staff, variable credit and identity verification, and other Servicing Related 0.6% of average servicing portfolio in Q2’18 Call center personnel, printing and postage FV Change in FCR Liability 1.3% of average servicing portfolio in 20171 Our obligation to remit previously billed, but uncollected, finance charges on deferred interest loans that paid off during their promotional periods, net of cash receipts from bank partners and third-party investors Operating Expenses Primarily consists of compensation and benefits Our technology-led and sponsor-backed go-to-market strategy has enabled minimal sales and marketing expenses Note: Adjusted EBITDA, Pro forma Diluted EPS, and Pro forma Net Income are non-GAAP measures. See Appendix for reconciliations to U.S. GAAP. 31 ($ millions)2015 2016 2017 2017 2018 Transaction volume$ 2,076 $ 2,882 $ 3,767 Growth 35% 31% Average loan servicing portfolio$ 2,003 $ 3,156 $ 4,501 Growth 58% 43% $ 971 $ 1,318 36% $ 4,210 $ 5,931 41% (Amounts in thousands, except per share data) Transaction fees Servicing and other Total revenue Cost of revenue Operating expenses Total costs and expenses Operating profit Other income / (expense) Income tax expense Net income Pro forma Net Income Adjusted EBITDA GAAP Diluted EPS Pro forma Diluted EPS Weighted avg. shares outstanding, diluted $ 153 $ 228 $ 279 21 35 47 $ 71 $ 90 11 16 $ 173 $ 264 $ 326 (37) (79) (90) (44) (65) (91) $ 82 $ 106 23 34 22 25 ($ 80) ($ 144) ($ 180) $ 93 $ 120 $ 146 $ 45 $ 59 $ 37 $ 47 1 5 (7) ---1 (4) -2 $ 94 $ 124 $ 139 ---$ 38 $ 41 $ 30 $ 34 $ 97 $ 131 $ 159 ---------$ 41 $ 52 -$ 0.09 -$ 0.18 -188.9
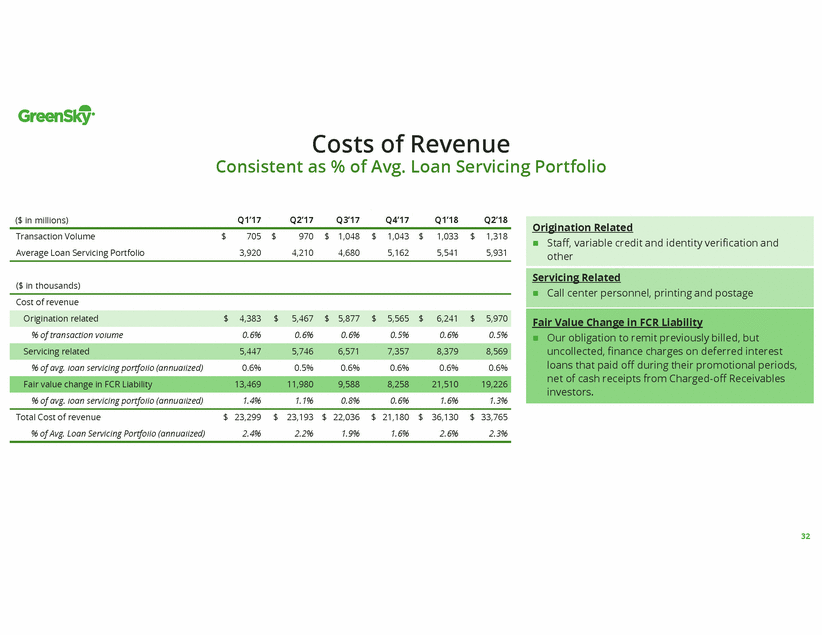
Costs of Revenue Consistent as % of Avg. Loan Servicing Portfolio Q1’17 Q2’17 Q3’17 Q4’17 Q1’18 Q2’18 ($ in millions) Transaction Volume Average Loan Servicing Portfolio $ 705 3,920 $ 970 4,210 $ 1,048 4,680 $ 1,043 5,162 $ 1,033 5,541 $ 1,318 5,931 ($ in thousands) Cost of revenue % of transaction volume 0.6% 0.6% 0.6% 0.5% 0.6% 0.5% % of avg. loan servicing portfolio (annualized) 0.6% 0.5% 0.6% 0.6% 0.6% 0.6% % of avg. loan servicing portfolio (annualized) 1.4% 1.1% 0.8% 0.6% 1.6% 1.3% Total Cost of revenue % of Avg. Loan Servicing Portfolio (annualized) $ 23,299 2.4% $ 23,193 2.2% $ 22,036 1.9% $ 21,180 1.6% $ 36,130 2.6% $ 33,765 2.3% 32 Fair value change in FCR Liability13,469 11,980 9,588 8,258 21,510 19,226 Servicing related5,447 5,746 6,571 7,357 8,379 8,569 Origination related$ 4,383 $ 5,467 $ 5,877 $ 5,565 $ 6,241 $ 5,970 Origination Related Staff, variable credit and identity verification and other Servicing Related Call center personnel, printing and postage Fair Value Change in FCR Liability Our obligation to remit previously billed, but uncollected, finance charges on deferred interest loans that paid off during their promotional periods, net of cash receipts from Charged-off Receivables investors.
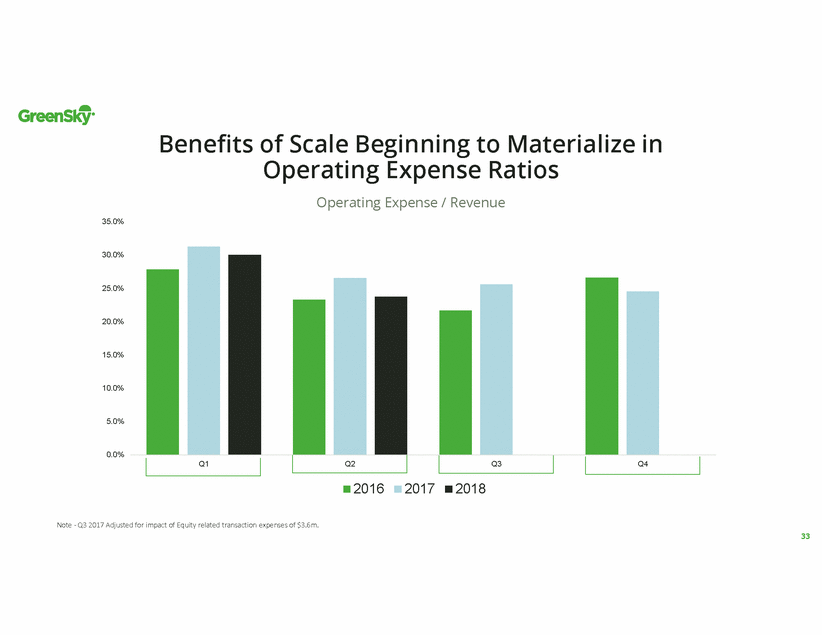
Benefits of Scale Beginning to Materialize Operating Expense Ratios Operating Expense / Revenue in 35.0% 30.0% 25.0% 20.0% 15.0% 10.0% 5.0% 0.0% 2016 2017 2018 Note - Q3 2017 Adjusted for impact of Equity related transaction expenses of $3.6m. 33 Q1 Q2 Q3 Q4
Why We Win

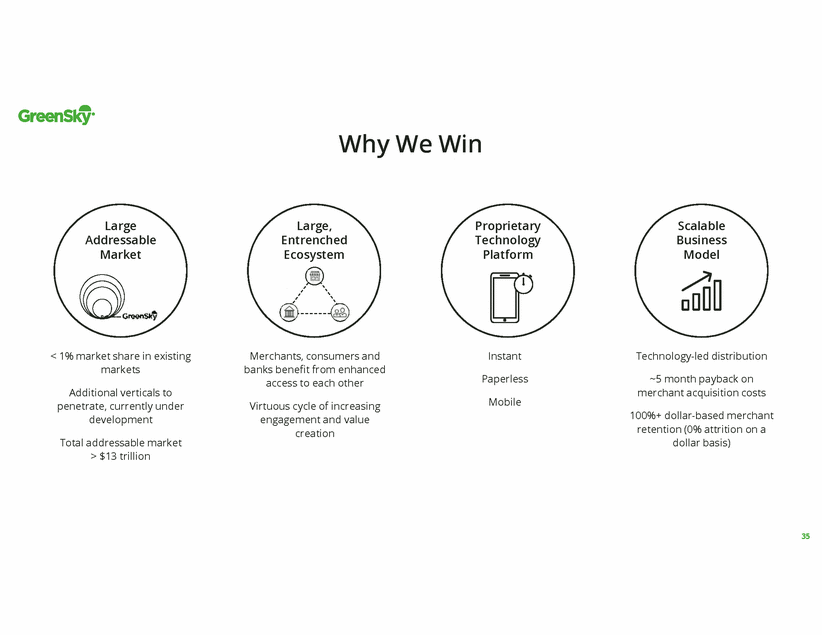
Why We Win Large Addressable Market Large, Entrenched Ecosystem Proprietary Technology Platform Scalable Business Model < 1% market share in existing markets Merchants, consumers and banks benefit from enhanced access to each other Instant Technology-led distribution Paperless ~5 month payback on merchant acquisition costs Additional verticals to penetrate, currently under development Mobile Virtuous cycle of increasing engagement and value creation 100%+ dollar-based merchant retention (0% attrition on a dollar basis) Total addressable market > $13 trillion 35
Appendix Non-GAAP Reconciliations

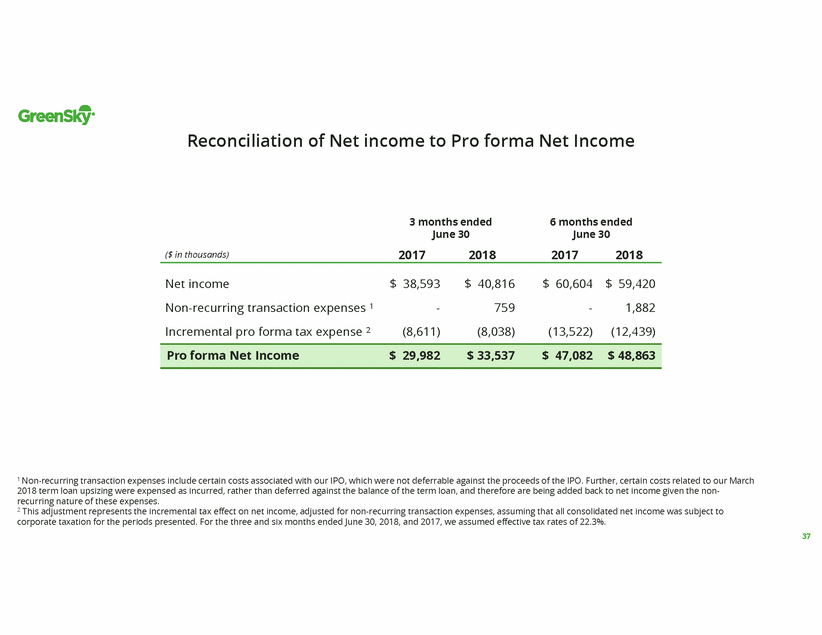
Reconciliation of Net income to Pro forma Net Income 3 months ended June 30 6 months ended June 30 2017 2018 2017 2018 ($ in thousands) Net income Non-recurring transaction expenses 1 Incremental pro forma tax expense 2 $ 38,593 - (8,611) $ 40,816 759 (8,038) $ 60,604 - (13,522) $ 59,420 1,882 (12,439) 1 Non-recurring transaction expenses include certain costs associated with our IPO, which were not deferrable against the proceeds of the IPO. Further, certain costs related to our March 2018 term loan upsizing were expensed as incurred, rather than deferred against the balance of the term loan, and therefore are being added back to net income given the non-recurring nature of these expenses. 2 This adjustment represents the incremental tax effect on net income, adjusted for non-recurring transaction expenses, assuming that all consolidated net income was subject to corporate taxation for the periods presented. For the three and six months ended June 30, 2018, and 2017, we assumed effective tax rates of 22.3%. 37 Pro forma Net Income$ 29,982 $ 33,537 $ 47,082 $ 48,863
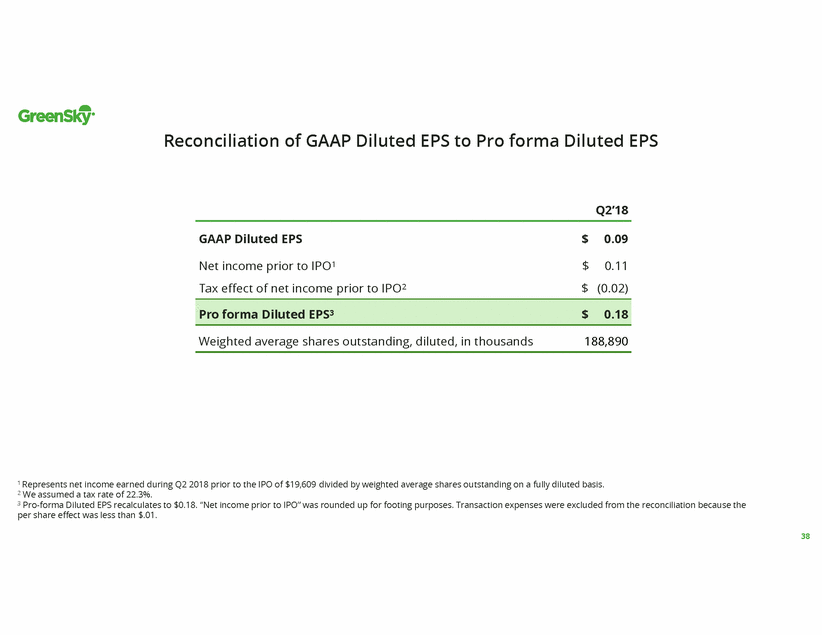
Reconciliation of GAAP Diluted EPS to Pro forma Diluted EPS Q2’18 GAAP Diluted EPS $ 0.09 Net income prior to IPO1 Tax effect of net income prior to IPO2 $ $ 0.11 (0.02) Weighted average shares outstanding, diluted, in thousands 188,890 1 Represents net income earned during Q2 2018 prior to the IPO of $19,609 divided by weighted average shares outstanding on a fully diluted basis. 2 We assumed a tax rate of 22.3%. 3 Pro-forma Diluted EPS recalculates to $0.18. “Net income prior to IPO” was rounded up for footing purposes. Transaction expenses were excluded from the reconciliation because the per share effect was less than $.01. 38 Pro forma Diluted EPS3 $ 0.18
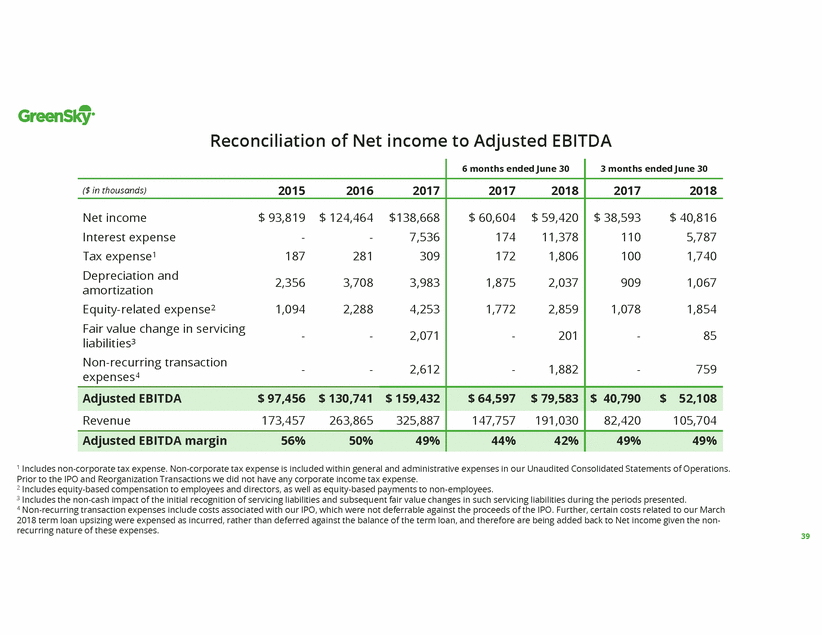
Reconciliation of Net income to Adjusted EBITDA 1 Includes non-corporate tax expense. Non-corporate tax expense is included within general and administrative expenses in our Unaudited Consolidated Statements of Operations. Prior to the IPO and Reorganization Transactions we did not have any corporate income tax expense. 2 Includes equity-based compensation to employees and directors, as well as equity-based payments to non-employees. 3 Includes the non-cash impact of the initial recognition of servicing liabilities and subsequent fair value changes in such servicing liabilities during the periods presented. 4 Non-recurring transaction expenses include costs associated with our IPO, which were not deferrable against the proceeds of the IPO. Further, certain costs related to our March 2018 term loan upsizing were expensed as incurred, rather than deferred against the balance of the term loan, and therefore are being added back to Net income given the non-recurring nature of these expenses. 39 6 months ended June 30 3 months ended June 30 ($ in thousands)2015 2016 2017 2017 2018 2017 2018 Net income$ 93,819 $ 124,464 $138,668 Interest expense --7,536 Tax expense1 187 281 309 Depreciation and amortization2,356 3,708 3,983 Equity-related expense2 1,094 2,288 4,253 Fair value change in servicing liabilities3--2,071 Non-recurring transaction expenses4 --2,612 $ 60,604 $ 59,420 174 11,378 172 1,806 1,875 2,037 1,772 2,859 -201 -1,882 $ 38,593 $ 40,816 110 5,787 100 1,740 909 1,067 1,078 1,854 -85 -759 Adjusted EBITDA$ 97,456 $ 130,741 $ 159,432 $ 64,597 $ 79,583 $ 40,790 $ 52,108 Revenue173,457 263,865 325,887 147,757 191,030 82,420 105,704 Adjusted EBITDA margin 56% 50% 49% 44% 42% 49% 49%
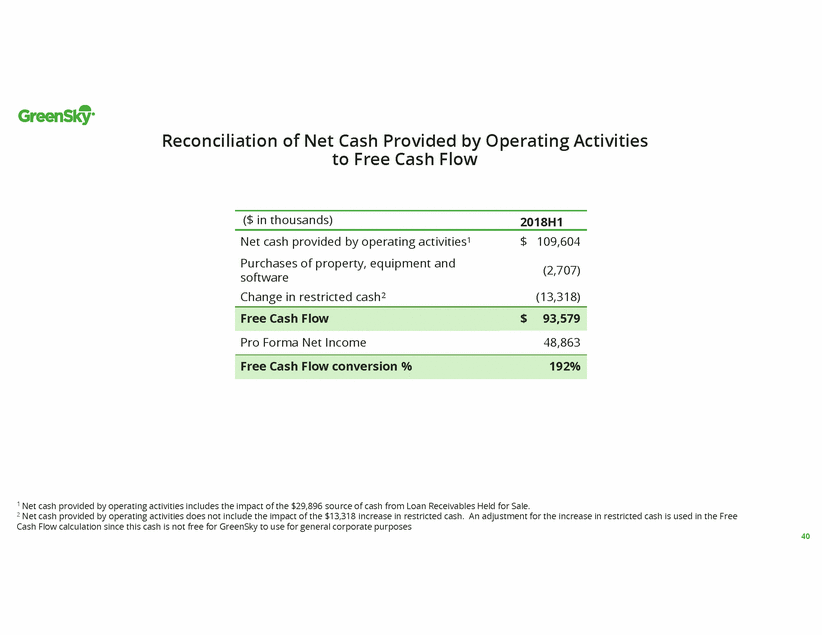
Reconciliation of Net Cash Provided by Operating Activities to Free Cash Flow ($ in thousands) 2018H1 Net cash provided by operating activities1 Purchases of property, equipment and software Change in restricted cash2 $ 109,604 (2,707) (13,318) Pro Forma Net Income 48,863 1 Net cash provided by operating activities includes the impact of the $29,896 source of cash from Loan Receivables Held for Sale. 2 Net cash provided by operating activities does not include the impact of the $13,318 increase in restricted cash. An adjustment for the increase in restricted cash is used in the Free Cash Flow calculation since this cash is not free for GreenSky to use for general corporate purposes 40 Free Cash Flow conversion % 192% Free Cash Flow $ 93,579
Business Model Supplement

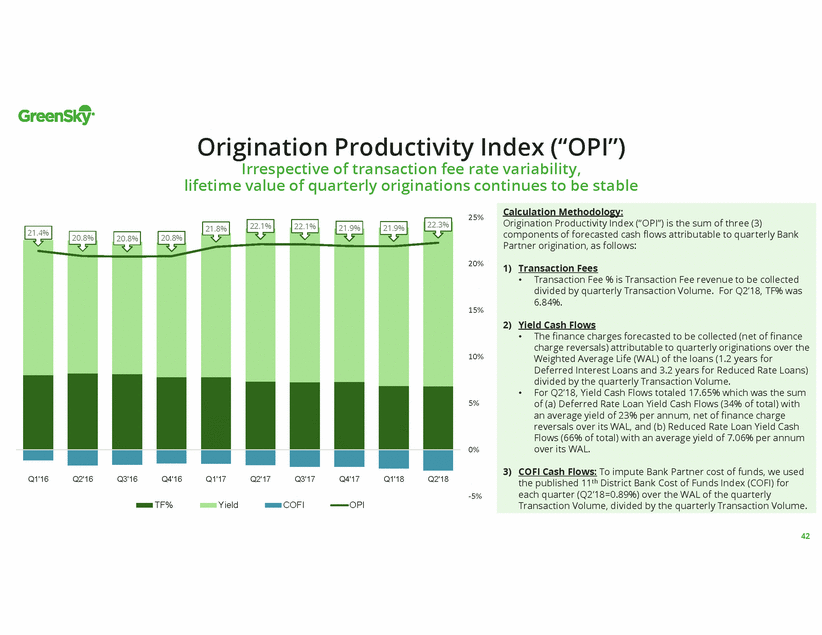
Origination Productivity Index (“OPI”) Irrespective of transaction fee rate variability, lifetime value of quarterly originations continues to be stable Calculation Methodology: 25% Origination Productivity Index (“OPI”) is the sum of three (3) components of forecasted cash flows attributable to quarterly Bank Partner origination, as follows: 20% 1) Transaction Fees • Transaction Fee % is Transaction Fee revenue to be collected divided by quarterly Transaction Volume. For Q2’18, TF% was 6.84%. 15% 2) Yield Cash Flows • The finance charges forecasted to be collected (net of finance charge reversals) attributable to quarterly originations over the Weighted Average Life (WAL) of the loans (1.2 years for Deferred Interest Loans and 3.2 years for Reduced Rate Loans) divided by the quarterly Transaction Volume. For Q2’18, Yield Cash Flows totaled 17.65% which was the sum of (a) Deferred Rate Loan Yield Cash Flows (34% of total) with an average yield of 23% per annum, net of finance charge reversals over its WAL, and (b) Reduced Rate Loan Yield Cash Flows (66% of total) with an average yield of 7.06% per annum over its WAL. 10% • 5% 0% 3) COFI Cash Flows: To impute Bank Partner cost of funds, we used Q1'16 Q2'16 Q3'16 Q4'16 Q1'17 Q2'17 Q3'17 Q4'17 Q1'18 Q2'18 the published 11th District Bank Cost of Funds Index (COFI) for each quarter (Q2’18=0.89%) over the WAL of the quarterly Transaction Volume, divided by the quarterly Transaction Volume. -5% TF% Yield COFI OPI 42 21.8% 22.1% 22.1% 21.9% 21.9% 21.4% 20.8% 20.8% 20.8% 22.3%
Our Contracts with Our Bank Partners are a Key Innovation for Our Company & Pillar of Our Success Fixed servicing fee Note: Component parts of the incentive payment calculation shown are illustrative and not averages. 43 This structure has resulted in our ability to build a transaction volume centric model with virtually no balance sheet, partner with multiple banks, and monetize via transaction and servicing fees We May Collect Incentive Payments from Bank Partners Billed portfolio yield 10% (1%) Agreed-upon target margin paid to Realized credit lossesbank partner (2.5%) (3.75%) Cash escrow 1% Illustrative incentive payment 2.75%

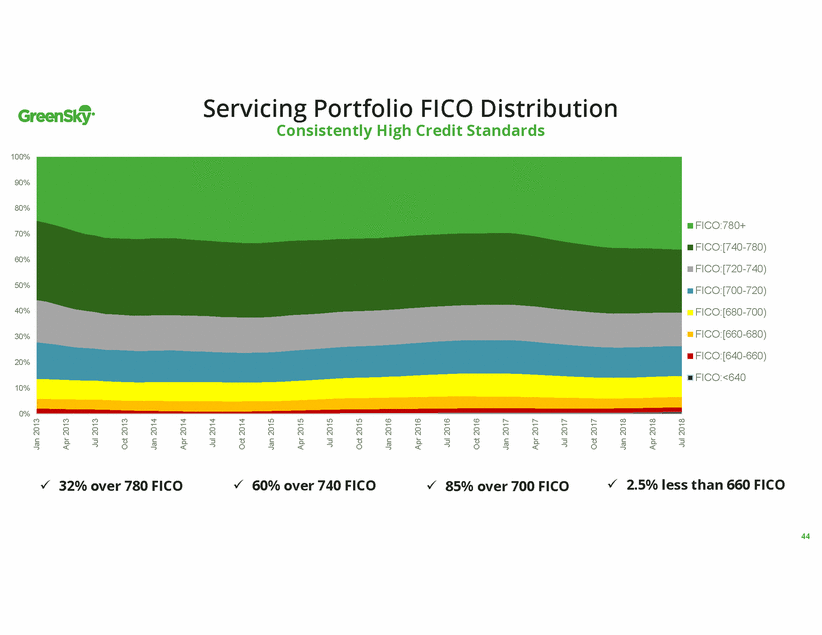
Servicing Portfolio FICO Distribution Consistently High Credit Standards 100% 90% 80% FICO:780+ 70% FICO:[740-780) 60% FICO:[720-740) 50% FICO:[700-720) 40% FICO:[680-700) FICO:[660-680) 30% FICO:[640-660) 20% FICO:<640 10% 0% 2.5% less than 660 FICO 32% over 780 FICO 60% over 740 FICO 85% over 700 FICO 44 Jan 2013 Apr 2013 Jul 2013 Oct 2013 Jan 2014 Apr 2014 Jul 2014 Oct 2014 Jan 2015 Apr 2015 Jul 2015 Oct 2015 Jan 2016 Apr 2016 Jul 2016 Oct 2016 Jan 2017 Apr 2017 Jul 2017 Oct 2017 Jan 2018 Apr 2018 Jul 2018
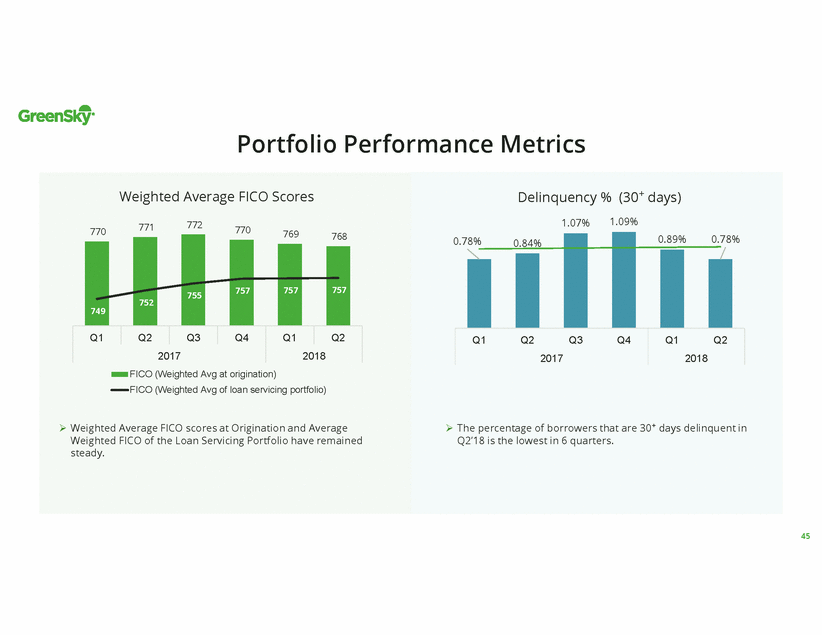
Portfolio Performance Metrics Delinquency % (30+ days) Weighted Average FICO Scores 1.09% 1.07% 772 771 770 770 769 768 0.78% 0.84% FICO (Weighted Avg at origination) FICO (Weighted Avg of loan servicing portfolio) The percentage of borrowers that are 30+ days delinquent in Q2’18 is the lowest in 6 quarters. Weighted Average FICO scores at Origination and Average Weighted FICO of the Loan Servicing Portfolio have remained steady. 45 0.89% 0.78% Q1 Q2 Q3 Q4 2017 Q1 Q2 2018 752 755 749 757 757 7 7 Q1 Q2 Q3 Q4 Q1 Q2 2017 2018
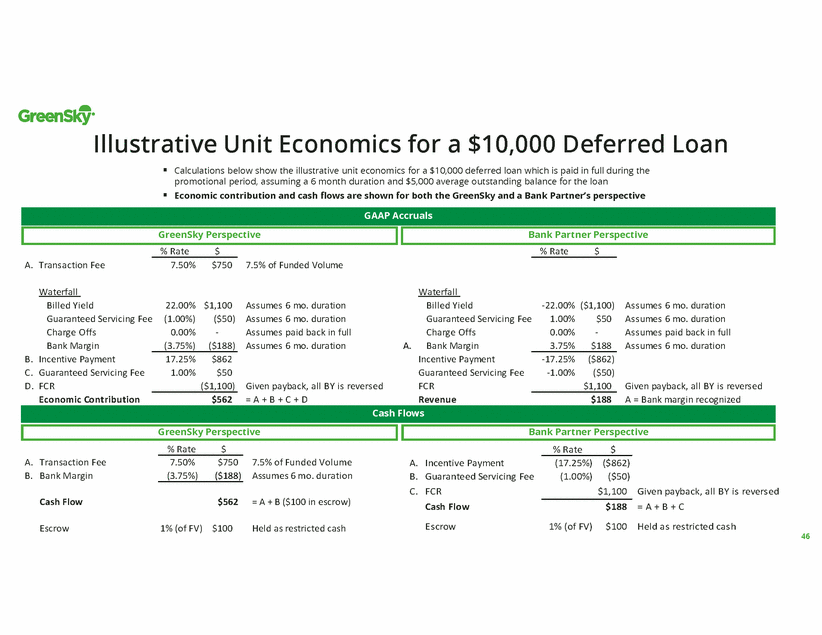
Illustrative Unit Economics for a $10,000 Deferred Loan Calculations below show the illustrative unit economics for a $10,000 deferred loan which is paid in full during the promotional period, assuming a 6 month duration and $5,000 average outstanding balance for the loan Economic contribution and cash flows are shown for both the GreenSky and a Bank Partner’s perspective GreenSky Perspective Bank Partner Perspective % Rate $ % Rate $ A. Transaction Fee 7.50% $750 7.5% of Funded Volume Waterfall Waterfall Billed Yield Guaranteed Servicing Fee Charge Offs 22.00% (1.00%) 0.00% $1,100 ($50) - Assumes 6 mo. duration Assumes 6 mo. duration Assumes paid back in full Assumes 6 mo. duration Billed Yield Guaranteed Servicing Fee Charge Offs -22.00% ($1,100) Assumes 6 mo. duration Assumes 6 mo. duration Assumes paid back in full Assumes 6 mo. duration 1.00% 0.00% $50 - Bank Margin Incentive Payment Guaranteed Servicing Fee (3.75%) ($188) A. Bank Margin Incentive Payment Guaranteed Servicing Fee FCR Revenue 3.75% $188 B. C. 17.25% 1.00% $862 $50 -17.25% -1.00% ($862) ($50) D. FCR Economic Contribution ($1,100) Given payback, all BY is reversed = A + B + C + D $1,100 Given payback, all BY is reversed A = Bank margin recognized $562 $188 GreenSky Perspective Bank Partner Perspective % Rate $ % Rate $ A. Transaction Fee B. Bank Margin 7.50% $750 7.5% of Funded Volume Assumes 6 mo. duration A. B. C. Incentive Payment Guaranteed Servicing Fee FCR Cash Flow Escrow (17.25%) (1.00%) ($862) ($50) $1,100 (3.75%) ($188) Given payback, all BY is revers ed = A + B + C Held as restricted cash Cash Flow $562 = A + B ($100 in escrow) $188 $100 1% (of FV) Escrow 1% (of FV) $100 Held as restricted cash 46 Cash Flows GAAP Accruals
Fair value change in FCR liability Consistent as % of Avg. Loan Servicing Portfolio ($ in millions) Q1’17 Q2’17 Q3’17 Q4’17 Q1’18 Q2’18 Average Loan Servicing Portfolio $ 3,920 $ 4,210 $ 4,680 $ 5,162 $ 5,541 $ 5,931 ($ in thousands) Beginning balance $ 68,064 $ 73,181 $ 76,319 $ 82,752 $ 94,418 $ 100,913 % of avg. loan servicing portfolio (annualized) 2.0% 2.3% 2.6% 2.7% 2.0% 2.3% % of avg. loan servicing portfolio (annualized) (2.9%) (3.1%) (2.9%) (2.5%) (3.1%) (3.2%) % of avg. loan servicing portfolio (annualized) 1.4% 1.1% 0.8% 0.6% 1.6% 1.3% Ending balance % of avg. loan servicing portfolio $ 73,181 1.9% $ 76,319 1.8% $ 82,752 1.8% $ 94,148 1.8% $ 100,913 1.8% $ 107,047 1.8% FCR Liability ending balance Our average weighted future reversal rate of billed finance charges was 89.7% as of June 30, 2018. 47 Fair value change in FCR liability13,469 11,980 9,588 8,258 21,510 19,226 Fair value change in FCR Liability A component of Cost of Revenue and represents the amount necessary to build the FCR liability balance to required level based on forecasted FCR settlements. Settlements(28,771)(32,762)(33,830)(31,666)(42,838)(46,834) Receipts20,419 23,920 30,675 34,804 28,093 33,742 FCR related Settlements Settlement activity increased primarily as a result of continued growth in deferred interest products in our loan servicing portfolio. FCR related receipts Seasonal patterns in credit losses create variability quarter to quarter. Q1 is the low point of the year, consistent with consumer payment patterns.
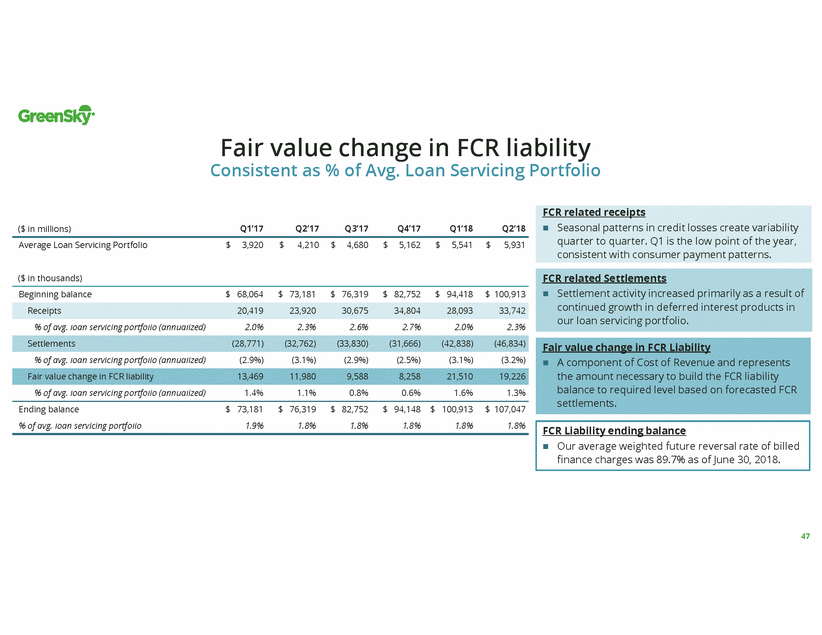
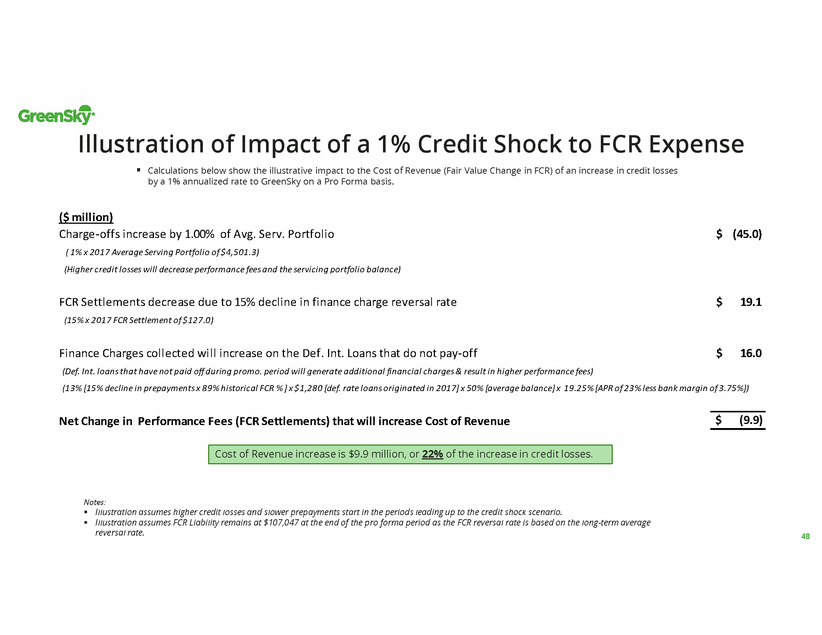
Illustration of Impact of a 1% Credit Shock to FCR Expense Calculations below show the illustrative impact to the Cost of Revenue (Fair Value Change in FCR) of an increase in credit losses by a 1% annualized rate to GreenSky on a Pro Forma basis. ($ million) Charge-offs increase by 1.00% of Avg. Serv. Portfolio ( 1% x 2017 Average Serving Portfolio of $4,501.3) (Higher credit losses will decrease performance fees and the servicing portfolio balance) $ (45.0) FCR Settlements decrease due to 15% decline in finance charge reversal rate (15% x 2017 FCR Settlement of $127.0) $ 19.1 Finance Charges collected will increase on the Def. Int. Loans that do not pay-off (Def. Int. loans that have not paid off during promo. period will generate additional financial charges & result in higher performance fees) $ 16.0 (13% [15% decline in prepayments x 89% historical FCR % ] x $1,280 [def. rate loans originated in 2017] x 50% [average balance] x 19.25% [APR of 23% less bank margin of 3.75%]) $ (9.9) Net Change in Performance Fees (FCR Settlements) that will increase Cost of Revenue Notes: Illustration assumes higher credit losses and slower prepayments start in the periods leading up to the credit shock scenario. Illustration assumes FCR Liability remains at $107,047 at the end of the pro forma period as the FCR reversal rate is based on the long-term average reversal rate. 48 Cost of Revenue increase is $9.9 million, or 22% of the increase in credit losses.
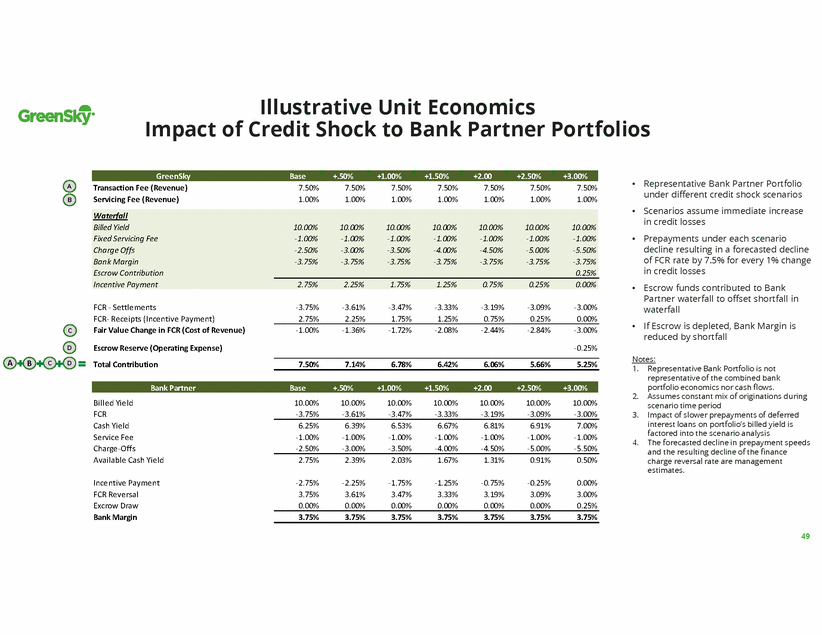
Illustrative Unit Economics Impact of Credit Shock to Bank Partner Portfolios • Representative Bank Partner Portfolio under different credit shock scenarios Scenarios assume immediate increase in credit losses Prepayments under each scenario decline resulting in a forecasted decline of FCR rate by 7.5% for every 1% change in credit losses Escrow funds contributed to Bank Partner waterfall to offset shortfall in waterfall If Escrow is depleted, Bank Margin is reduced by shortfall A B Transaction Fee (Revenue) Servicing Fee (Revenue) 7.50% 1.00% 7.50% 1.00% 7.50% 1.00% 7.50% 1.00% 7.50% 1.00% 7.50% 1.00% 7.50% 1.00% • • • FCR - Settlements FCR-Receipts (Incentive Payment) Fair Value Change in FCR (Cost of Revenue) Escrow Reserve (Operating Expense) Total Contribution -3.75% 2.75% -3.61% 2.25% -3.47% 1.75% -3.33% 1.25% -3.19% 0.75% -3.09% 0.25% -3.00% 0.00% • -1.00% -1.36% -1.72% -2.08% -2.44% -2.84% -3.00% -0.25% C D Notes: A B C D 7.50% 7.14% 6.78% 6.42% 6.06% 5.66% 5.25% 1. Representative Bank Portfolio is not representative of the combined bank portfolio economics nor cash flows. Assumes constant mix of originations during scenario time period Impact of slower prepayments of deferred interest loans on portfolio’s billed yield is factored into the scenario analysis The forecasted decline in prepayment speeds and the resulting decline of the finance charge reversal rate are management estimates. 2. Billed Yield FCR Cash Yield Service Fee Charge-Offs Available Cash Yield 10.00% -3.75% 10.00% -3.61% 10.00% -3.47% 10.00% -3.33% 10.00% -3.19% 10.00% -3.09% 10.00% -3.00% 3. 6.25% -1.00% 6.39% -1.00% 6.53% -1.00% 6.67% -1.00% 6.81% -1.00% 6.91% -1.00% 7.00% -1.00% 4. -2.50% -3.00% -3.50% -4.00% -4.50% -5.00% -5.50% 2.75% 2.39% 2.03% 1.67% 1.31% 0.91% 0.50% Incentive Payment FCR Reversal Excrow Draw Bank Margin -2.75% 3.75% -2.25% 3.61% -1.75% 3.47% -1.25% 3.33% -0.75% 3.19% -0.25% 3.09% 0.00% 3.00% 0.00% 0.00% 0.00% 0.00% 0.00% 0.00% 0.25% 3.75% 3.75% 3.75% 3.75% 3.75% 3.75% 3.75% 49 Bank Partner Base +.50%+1.00%+1.50%+2.00 +2.50%+3.00% Waterfall Billed Yield Fixed Servicing Fee Charge Offs Bank Margin Escrow Contribution Incentive Payment 10.00%10.00%10.00%10.00%10.00%10.00%10.00% -1.00%-1.00%-1.00%-1.00%-1.00%-1.00%-1.00% -2.50%-3.00%-3.50%-4.00%-4.50%-5.00%-5.50% -3.75%-3.75%-3.75%-3.75%-3.75%-3.75%-3.75% 0.25% 2.75%2.25%1.75%1.25%0.75%0.25%0.00% GreenSky Base +.50%+1.00%+1.50%+2.00 +2.50%+3.00%
Why We Win Large Addressable Market Large, Entrenched Ecosystem Proprietary Technology Platform Scalable Business Model < 1% market share in existing markets Merchants, consumers and banks benefit from enhanced access to each other Instant Technology-led distribution Paperless ~5 month payback on merchant acquisition costs Additional verticals to penetrate, currently under development Mobile Virtuous cycle of increasing engagement and value creation 100%+ dollar-based merchant retention (0% attrition on a dollar basis) Total addressable market > $13 trillion 50
