Attached files
| file | filename |
|---|---|
| EX-99.1 - EX-99.1 - MidWestOne Financial Group, Inc. | a18-20025_3ex99d1.htm |
| EX-2.1 - EX-2.1 - MidWestOne Financial Group, Inc. | a18-20025_3ex2d1.htm |
| 8-K - 8-K - MidWestOne Financial Group, Inc. | a18-20025_38k.htm |
Forward Looking Statements Cautionary Note Regarding Forward-Looking Statements Statements made in this preparation, other than those concerning historical financial information, may be considered forward-looking statements, which speak only as of the date of this presentation and are based on current expectations and involve a number of assumptions. These include, among other things, statements regarding future results or expectations. MidWestOne Financial Group, Inc. (“MidWestOne”) intends such forward-looking statements to be covered by the safe harbor provisions for forward-looking statements contained in the Private Securities Litigation Reform Act of 1995 and is including this statement for purposes of these safe harbor provisions. MidWestOne’s ability to predict results, or the actual effect of future plans or strategies, is inherently uncertain. Factors that could cause actual results to differ from those set forth in the forward-looking statements or that could have a material effect on the operations and future prospects of MidWestOne include, but are not limited to: (1) the strength of the local and national economy; (2) the risks of mergers, including the merger with ATBancorp, acquisitions and divestitures, including, without limitation, the related time and costs of implementing such transactions, integration operations as a part of these transactions and possible failures to achieve expected gains, revenue growth and/or expense savings from such transactions (3) changes in interest rates, legislative/regulator changes, monetary and fiscal policies of the U.S. government, including policies of the U.S. Treasury and the Federal Reserve Board, and changes in the scope and cost of Federal Deposit Insurance Corporation insurance and fees; (4) the loss of key executives or employees; (5) changes in the quality and composition of MidWestOne's loan and securities portfolios, demand for loan products and deposit flows; (6) changes in the assumptions and estimates underlying the establishment of reserves for possible loan losses and other estimates; (7) the effects of competition and the overall demand for financial services in MidWestOne’s market areas; (8) MidWestOne's ability to implement new technologies and develop and maintain secure and reliable electronic systems; (9) changes in accounting principles, policies, and guidelines; and (10) other risk factors detailed from time to time in filings made by MidWestOne with the Securities and Exchange Commission (the “SEC”). Additional Information and Where You Can Find It MidWestOne will file a preliminary proxy statement with the SEC in connection with the proposed transaction and will mail a definitive proxy statement and other relevant materials to its shareholders. Shareholders are advised to read, when available, the preliminary proxy statement, and amendments thereto, and the definitive proxy statement because these documents will contain important information about MidWestOne, ATBancorp and the proposed transaction. When filed, these documents and other documents relating to the proposed transaction filed by MidWestOne can be obtained free of charge from the SEC’s website at www.sec.gov. These documents also can be obtained free of charge by accessing MidWestOne's website at www.midwestone.com under the tab “About MidWestOne Financial Group” and then under “SEC Filings.” Alternatively, these documents, when available, can be obtained free of charge from MidWestOne upon written request to MidWestOne Financial Group, Inc., Attention: Barry S. Ray, P.O. Box 1700, Iowa City, IA 52244 or by calling (319) 356-5800 or from ATBancorp, upon written request to ATBancorp, Attention: Secretary, 895 Main Street, Dubuque, Iowa 52001 or by calling (563) 589-7178. Participants in Solicitation MidWestOne, certain of its directors and executive officers and other persons may be deemed to be participants in the solicitation of proxies from shareholders in connection with the proposed transaction under the rules of the SEC. Information about these participants may be found in the definitive proxy statement of MidWestOne relating to its 2018 Annual Meeting of Shareholders filed with the SEC by MidWestOne on March 9, 2018. This definitive proxy statement can be obtained free of charge from the sources indicated above. Other information regarding the participants in the proxy solicitation ad a descriptions of their direct and indirect interests, by securities holdings or otherwise, will be contained in the definitive proxy statement and other relevant materials to be filed by MidWestOne with the SEC in conjunction with the proposed transactions (when they become available).
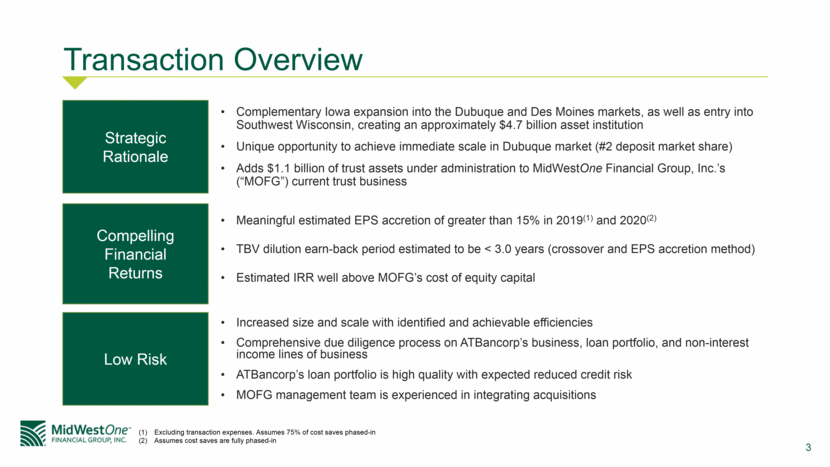
Transaction Overview Complementary Iowa expansion into the Dubuque and Des Moines markets, as well as entry into Southwest Wisconsin, creating an approximately $4.7 billion asset institution Unique opportunity to achieve immediate scale in Dubuque market (#2 deposit market share) Adds $1.1 billion of trust assets under administration to MidWestOne Financial Group, Inc.’s (“MOFG”) current trust business Strategic Rationale Meaningful estimated EPS accretion of greater than 15% in 2019(1) and 2020(2) TBV dilution earn-back period estimated to be < 3.0 years (crossover and EPS accretion method) Estimated IRR well above MOFG’s cost of equity capital Compelling Financial Returns Increased size and scale with identified and achievable efficiencies Comprehensive due diligence process on ATBancorp’s business, loan portfolio, and non-interest income lines of business ATBancorp’s loan portfolio is high quality with expected reduced credit risk MOFG management team is experienced in integrating acquisitions Low Risk Excluding transaction expenses. Assumes 75% of cost saves phased-in Assumes cost saves are fully phased-in
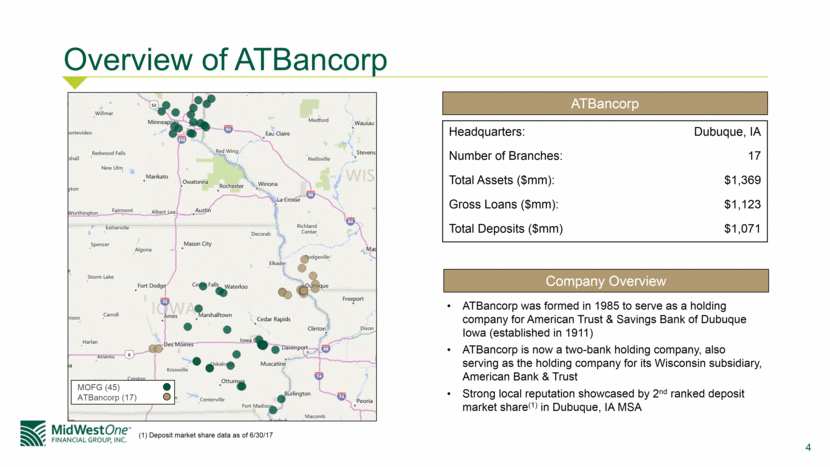
Overview of ATBancorp Headquarters: Dubuque, IA Number of Branches: 17 Total Assets ($mm): $1,369 Gross Loans ($mm): $1,123 Total Deposits ($mm) $1,071 ATBancorp Company Overview ATBancorp was formed in 1985 to serve as a holding company for American Trust & Savings Bank of Dubuque Iowa (established in 1911) ATBancorp is now a two-bank holding company, also serving as the holding company for its Wisconsin subsidiary, American Bank & Trust Strong local reputation showcased by 2nd ranked deposit market share(1) in Dubuque, IA MSA (1) Deposit market share data as of 6/30/17 MOFG (45) ATBancorp (17)
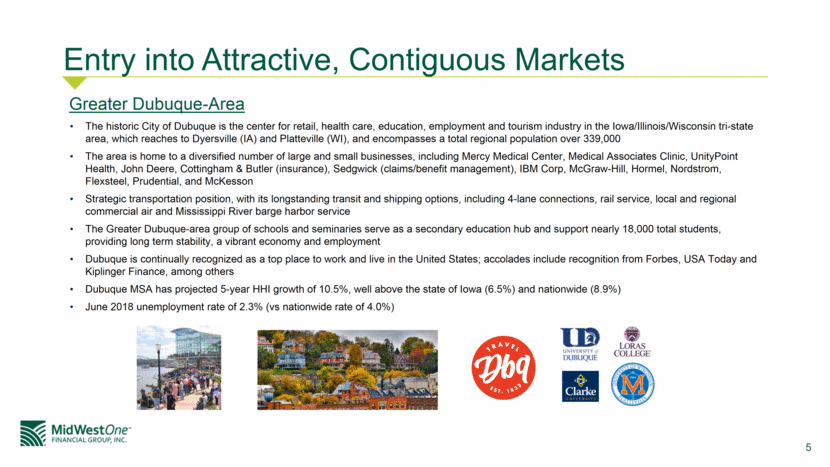
Entry into Attractive, Contiguous Markets Greater Dubuque-Area The historic City of Dubuque is the center for retail, health care, education, employment and tourism industry in the Iowa/Illinois/Wisconsin tri-state area, which reaches to Dyersville (IA) and Platteville (WI), and encompasses a total regional population over 339,000 The area is home to a diversified number of large and small businesses, including Mercy Medical Center, Medical Associates Clinic, UnityPoint Health, John Deere, Cottingham & Butler (insurance), Sedgwick (claims/benefit management), IBM Corp, McGraw-Hill, Hormel, Nordstrom, Flexsteel, Prudential, and McKesson Strategic transportation position, with its longstanding transit and shipping options, including 4-lane connections, rail service, local and regional commercial air and Mississippi River barge harbor service The Greater Dubuque-area group of schools and seminaries serve as a secondary education hub and support nearly 18,000 total students, providing long term stability, a vibrant economy and employment Dubuque is continually recognized as a top place to work and live in the United States; accolades include recognition from Forbes, USA Today and Kiplinger Finance, among others Dubuque MSA has projected 5-year HHI growth of 10.5%, well above the state of Iowa (6.5%) and nationwide (8.9%) June 2018 unemployment rate of 2.3% (vs nationwide rate of 4.0%)
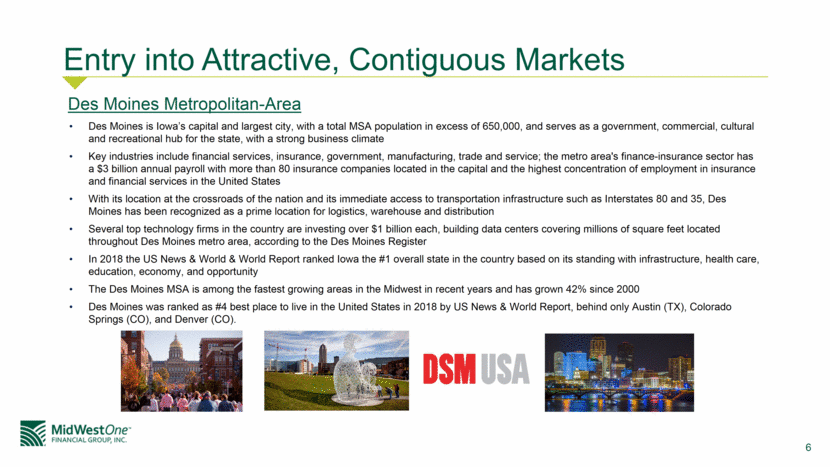
Entry into Attractive, Contiguous Markets Des Moines Metropolitan-Area Des Moines is Iowa’s capital and largest city, with a total MSA population in excess of 650,000, and serves as a government, commercial, cultural and recreational hub for the state, with a strong business climate Key industries include financial services, insurance, government, manufacturing, trade and service; the metro area's finance-insurance sector has a $3 billion annual payroll with more than 80 insurance companies located in the capital and the highest concentration of employment in insurance and financial services in the United States With its location at the crossroads of the nation and its immediate access to transportation infrastructure such as Interstates 80 and 35, Des Moines has been recognized as a prime location for logistics, warehouse and distribution Several top technology firms in the country are investing over $1 billion each, building data centers covering millions of square feet located throughout Des Moines metro area, according to the Des Moines Register In 2018 the US News & World & World Report ranked Iowa the #1 overall state in the country based on its standing with infrastructure, health care, education, economy, and opportunity The Des Moines MSA is among the fastest growing areas in the Midwest in recent years and has grown 42% since 2000 Des Moines was ranked as #4 best place to live in the United States in 2018 by US News & World Report, behind only Austin (TX), Colorado Springs (CO), and Denver (CO).
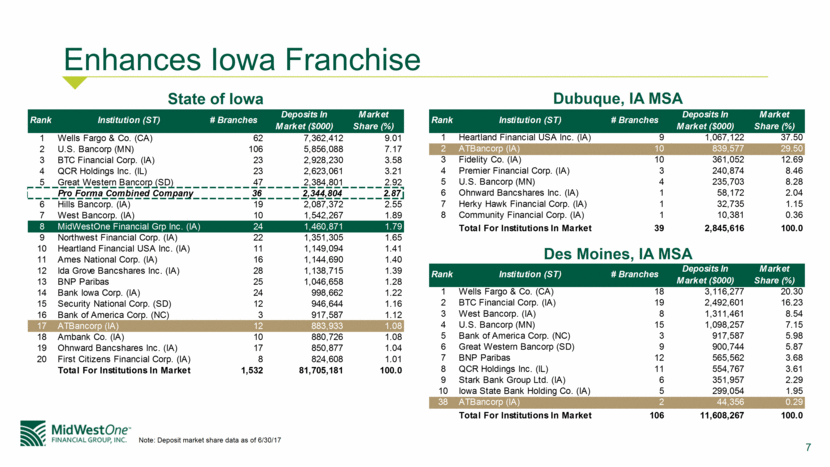
Enhances Iowa Franchise State of Iowa Dubuque, IA MSA Des Moines, IA MSA Note: Deposit market share data as of 6/30/17 Rank Institution (ST) # Branches Deposits In Market ($000) Market Share (%) 1 Wells Fargo & Co. (CA) 62 7,362,412 9.01 2 U.S. Bancorp (MN) 106 5,856,088 7.17 3 BTC Financial Corp. (IA) 23 2,928,230 3.58 4 QCR Holdings Inc. (IL) 23 2,623,061 3.21 5 Great Western Bancorp (SD) 47 2,384,801 2.92 Pro Forma Combined Company 36 2,344,804 2.87 6 Hills Bancorp. (IA) 19 2,087,372 2.55 7 West Bancorp. (IA) 10 1,542,267 1.89 8 MidWestOne Financial Grp Inc. (IA) 24 1,460,871 1.79 9 Northwest Financial Corp. (IA) 22 1,351,305 1.65 10 Heartland Financial USA Inc. (IA) 11 1,149,094 1.41 11 Ames National Corp. (IA) 16 1,144,690 1.40 12 Ida Grove Bancshares Inc. (IA) 28 1,138,715 1.39 13 BNP Paribas 25 1,046,658 1.28 14 Bank Iowa Corp. (IA) 24 998,662 1.22 15 Security National Corp. (SD) 12 946,644 1.16 16 Bank of America Corp. (NC) 3 917,587 1.12 17 ATBancorp (IA) 12 883,933 1.08 18 Ambank Co. (IA) 10 880,726 1.08 19 Ohnward Bancshares Inc. (IA) 17 850,877 1.04 20 First Citizens Financial Corp. (IA) 8 824,608 1.01 Total For Institutions In Market 1,532 81,705,181 100.0 Rank Institution (ST) # Branches Deposits In Market ($000) Market Share (%) 1 Wells Fargo & Co. (CA) 18 3,116,277 20.30 2 BTC Financial Corp. (IA) 19 2,492,601 16.23 3 West Bancorp. (IA) 8 1,311,461 8.54 4 U.S. Bancorp (MN) 15 1,098,257 7.15 5 Bank of America Corp. (NC) 3 917,587 5.98 6 Great Western Bancorp (SD) 9 900,744 5.87 7 BNP Paribas 12 565,562 3.68 8 QCR Holdings Inc. (IL) 11 554,767 3.61 9 Stark Bank Group Ltd. (IA) 6 351,957 2.29 10 Iowa State Bank Holding Co. (IA) 5 299,054 1.95 38 ATBancorp (IA) 2 44,356 0.29 Total For Institutions In Market 106 11,608,267 100.0 Rank Institution (ST) # Branches Deposits In Market ($000) Market Share (%) 1 Heartland Financial USA Inc. (IA) 9 1,067,122 37.50 2 ATBancorp (IA) 10 839,577 29.50 3 Fidelity Co. (IA) 10 361,052 12.69 4 Premier Financial Corp. (IA) 3 240,874 8.46 5 U.S. Bancorp (MN) 4 235,703 8.28 6 Ohnward Bancshares Inc. (IA) 1 58,172 2.04 7 Herky Hawk Financial Corp. (IA) 1 32,735 1.15 8 Community Financial Corp. (IA) 1 10,381 0.36 Total For Institutions In Market 39 2,845,616 100.0
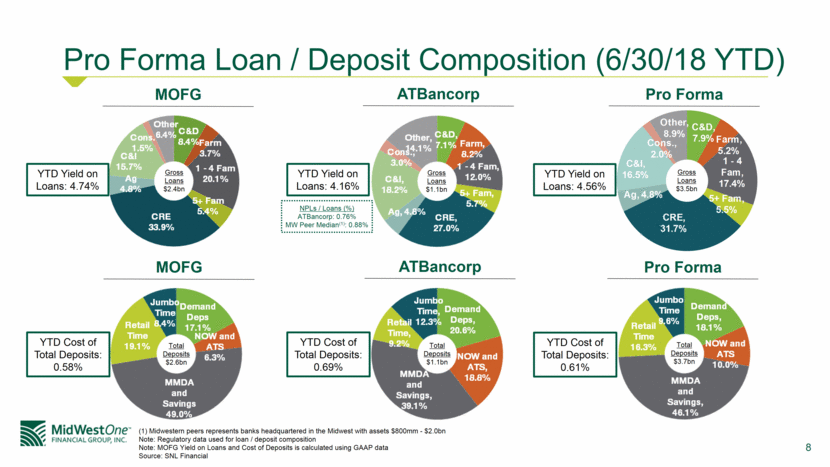
Pro Forma Loan / Deposit Composition (6/30/18 YTD) MOFG ATBancorp Pro Forma MOFG ATBancorp Pro Forma YTD Yield on Loans: 4.74% YTD Cost of Total Deposits: 0.58% YTD Yield on Loans: 4.16% YTD Cost of Total Deposits: 0.69% YTD Yield on Loans: 4.56% YTD Cost of Total Deposits: 0.61% (1) Midwestern peers represents banks headquartered in the Midwest with assets $800mm - $2.0bn Note: Regulatory data used for loan / deposit composition Note: MOFG Yield on Loans and Cost of Deposits is calculated using GAAP data Source: SNL Financial Gross Loans $2.4bn Total Deposits $2.6bn Gross Loans $1.1bn Total Deposits $1.1bn Total Deposits $3.7bn Gross Loans $3.5bn NPLs / Loans (%) ATBancorp: 0.76% MW Peer Median(1): 0.88% C&D , 7.9% Farm , 5.2% 1 - 4 Fam , 17.4% 5+ Fam , 5.5% CRE , 31.7% Ag , 4.8% C&I , 16.5% Cons. , 2.0% Other , 8.9% Interest Expense Interest income Average Deposits Average Loans Annualized Factor Cost of Deposits Yield on Loans AB WI 398 3,224 135,167 133,734 2 0.59% 4.82% ATB 1,341 19,671 962,141 965,752 2 0.28% 4.07% MOFG 7,545 54552 2,598,179 2,325,365 2 0.58% 4.69% TOTAL 9,284 77,447 3,695,486 3,424,851 2 0.50% 4.52% ATB Combined 1,739 22,895 1,097,307 1,099,486 2 0.32% 4.16%
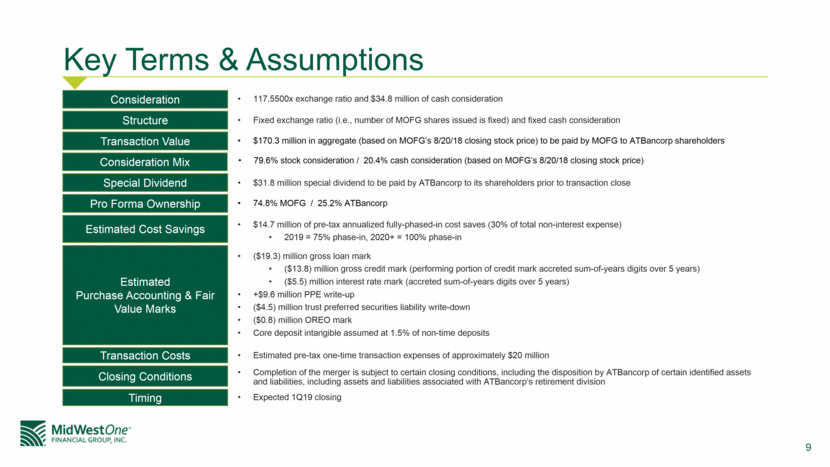
Key Terms & Assumptions 117.5500x exchange ratio and $34.8 million of cash consideration Consideration Structure Transaction Value Pro Forma Ownership Estimated Cost Savings Estimated Purchase Accounting & Fair Value Marks Transaction Costs Closing Conditions Timing Fixed exchange ratio (i.e., number of MOFG shares issued is fixed) and fixed cash consideration Expected 1Q19 closing $14.7 million of pre-tax annualized fully-phased-in cost saves (30% of total non-interest expense) 2019 = 75% phase-in, 2020+ = 100% phase-in ($19.3) million gross loan mark ($13.8) million gross credit mark (performing portion of credit mark accreted sum-of-years digits over 5 years) ($5.5) million interest rate mark (accreted sum-of-years digits over 5 years) +$9.6 million PPE write-up ($4.5) million trust preferred securities liability write-down ($0.8) million OREO mark Core deposit intangible assumed at 1.5% of non-time deposits $170.3 million in aggregate (based on MOFG’s 8/20/18 closing stock price) to be paid by MOFG to ATBancorp shareholders Estimated pre-tax one-time transaction expenses of approximately $20 million 74.8% MOFG / 25.2% ATBancorp Completion of the merger is subject to certain closing conditions, including the disposition by ATBancorp of certain identified assets and liabilities, including assets and liabilities associated with ATBancorp’s retirement division Special Dividend $31.8 million special dividend to be paid by ATBancorp to its shareholders prior to transaction close Consideration Mix 79.6% stock consideration / 20.4% cash consideration (based on MOFG’s 8/20/18 closing stock price)
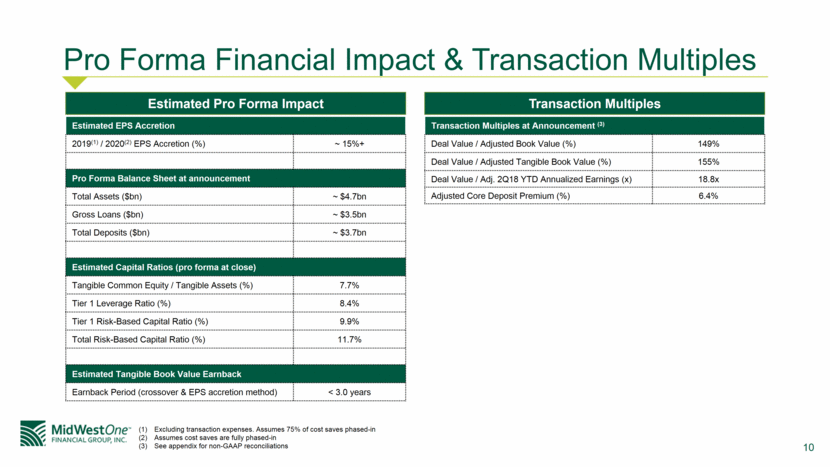
Pro Forma Financial Impact & Transaction Multiples Estimated Pro Forma Impact Transaction Multiples Estimated EPS Accretion 2019(1) / 2020(2) EPS Accretion (%) ~ 15%+ Pro Forma Balance Sheet at announcement Total Assets ($bn) ~ $4.7bn Gross Loans ($bn) ~ $3.5bn Total Deposits ($bn) ~ $3.7bn Estimated Capital Ratios (pro forma at close) Tangible Common Equity / Tangible Assets (%) 7.7% Tier 1 Leverage Ratio (%) 8.4% Tier 1 Risk-Based Capital Ratio (%) 9.9% Total Risk-Based Capital Ratio (%) 11.7% Estimated Tangible Book Value Earnback Earnback Period (crossover & EPS accretion method) < 3.0 years Transaction Multiples at Announcement (3) Deal Value / Adjusted Book Value (%) 149% Deal Value / Adjusted Tangible Book Value (%) 155% Deal Value / Adj. 2Q18 YTD Annualized Earnings (x) 18.8x Adjusted Core Deposit Premium (%) 6.4% Excluding transaction expenses. Assumes 75% of cost saves phased-in Assumes cost saves are fully phased-in See appendix for non-GAAP reconciliations
Conclusion Acquisition allows for an immediate scaled entry into attractive Iowa markets Expands the footprint and enhances the value of the MOFG franchise Strong trust business further develops MOFG’s non-interest income sources Meaningful EPS accretion Manageable TBV dilution with a compelling TBV earnback period Continues MOFG’s growth into one of the premier banking franchises headquartered in Iowa
Appendix: Non-GAAP Reconciliations
Statement Regarding Non-GAAP Reconciliations This presentation includes certain non-GAAP financial measures, including deal value to adjusted book value, deal value to adjusted tangible book value and deal value to adjusted second quarter 2018 year-to-date annualized earnings. These non-GAAP financial measures are not meant to be considered in isolation or as a substitute for measures prepared in accordance with accounting principles generally accepted in the United States (GAAP). The management team believes these non-GAAP financial measures provide useful supplemental information to investors regarding the proposed transaction, as they provide another measure of certain transaction metrics to reflect unique aspects of the proposed transaction. Specifically, the removal of the special dividend from book value, tangible book value, and core deposit premium helps to more accurately reflect the fact that, prior to transaction close, ATBancorp expects to issue a material special dividend to shareholders and thus will reduce the equity delivered to MOFG at closing. The year-to-date earnings have been adjusted to remove all earnings impact of United American Bank and American Trust’s retirement division, since these will not be earnings that the pro forma organization will retain (due to the May 2018 completion of the United American Bank sale by ATBancorp and the planned divestiture of American Trust’s retirement division prior to the closing of this transaction).
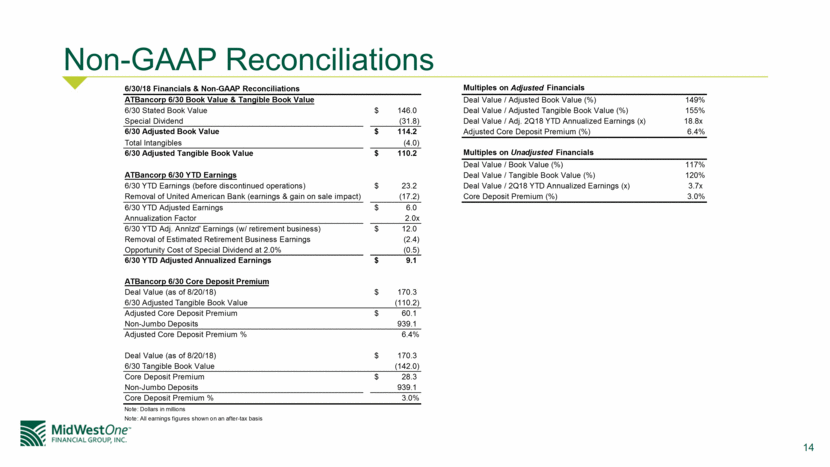
Non-GAAP Reconciliations 6/30/18 Financials & Non-GAAP Reconciliations Multiples on Adjusted Financials ATBancorp 6/30 Book Value & Tangible Book Value Deal Value / Adjusted Book Value (%) 149% 6/30 Stated Book Value 146.0 $ Deal Value / Adjusted Tangible Book Value (%) 155% Special Dividend (31.8) Deal Value / Adj. 2Q18 YTD Annualized Earnings (x) 18.8x 6/30 Adjusted Book Value 114.2 $ Adjusted Core Deposit Premium (%) 6.4% Total Intangibles (4.0) 6/30 Adjusted Tangible Book Value 110.2 $ Multiples on Unadjusted Financials Deal Value / Book Value (%) 117% ATBancorp 6/30 YTD Earnings Deal Value / Tangible Book Value (%) 120% 6/30 YTD Earnings (before discontinued operations) 23.2 $ Deal Value / 2Q18 YTD Annualized Earnings (x) 3.7x Removal of United American Bank (earnings & gain on sale impact) (17.2) Core Deposit Premium (%) 3.0% 6/30 YTD Adjusted Earnings 6.0 $ Annualization Factor 2.0x 6/30 YTD Adj. Annlzd' Earnings (w/ retirement business) 12.0 $ Removal of Estimated Retirement Business Earnings (2.4) Opportunity Cost of Special Dividend at 2.0% (0.5) 6/30 YTD Adjusted Annualized Earnings 9.1 $ ATBancorp 6/30 Core Deposit Premium Deal Value (as of 8/20/18) 170.3 $ 6/30 Adjusted Tangible Book Value (110.2) Adjusted Core Deposit Premium 60.1 $ Non-Jumbo Deposits 939.1 Adjusted Core Deposit Premium % 6.4% Deal Value (as of 8/20/18) 170.3 $ 6/30 Tangible Book Value (142.0) Core Deposit Premium 28.3 $ Non-Jumbo Deposits 939.1 Core Deposit Premium % 3.0% Note: Dollars in millions Note: All earnings figures shown on an after-tax basis