Attached files
| file | filename |
|---|---|
| EX-99.1 - EX-99.1 - FIRST BUSEY CORP /NV/ | a2236527zex-99_1.htm |
| EX-2.1 - EX-2.1 - FIRST BUSEY CORP /NV/ | a2236527zex-2_1.htm |
| 8-K - 8-K - FIRST BUSEY CORP /NV/ | a2236527z8-k.htm |

Special Note Concerning Forward-Looking Statements This document may contain forward-looking statements within the meaning of the Private Securities Litigation Reform Act of 1995 with respect to the financial condition, results of operations, plans, objectives, future performance and business of First Busey Corporation (“First Busey”) and The Banc Ed Corp. (“Banc Ed”). Forward-looking statements, which may be based upon beliefs, expectations and assumptions of First Busey’s and Banc Ed’s management and on information currently available to management, are generally identifiable by the use of words such as “believe,” “expect,” “anticipate,” “plan,” “intend,” “estimate,” “may,” “will,” “would,” “could,” “should” or other similar expressions. Additionally, all statements in this document, including forward-looking statements, speak only as of the date they are made, and neither First Busey nor Banc Ed undertakes any obligation to update any statement in light of new information or future events. A number of factors, many of which are beyond the ability of First Busey and Banc Ed to control or predict, could cause actual results to differ materially from those in its forward-looking statements. These factors include, among others, the following: (i) the possibility that any of the anticipated benefits of the proposed transaction between First Busey and Banc Ed will not be realized or will not be realized within the expected time period; (ii) the risk that integration of operations of Banc Ed with those of First Busey will be materially delayed or will be more costly or difficult than expected; (iii) the inability to complete the proposed transaction due to the failure of the required stockholder approval; (iv) the failure to satisfy other conditions to completion of the proposed transaction, including receipt of required regulatory and other approvals; (v) the failure of the proposed transaction to close for any other reason; (vi) the effect of the announcement of the transaction on customer relationships and operating results; (vii) the possibility that the transaction may be more expensive to complete than anticipated, including as a result of unexpected factors or events; (viii) the strength of the local, state, national and international economy (including the impact of tariffs, a U.S. withdrawal from or significant negotiation of trade agreements, trade wars and other changes in trade regulations); (ix) changes in state and federal laws, regulations and governmental policies concerning First Busey’s and Banc Ed’s general business; (x) changes in interest rates and prepayment rates of First Busey’s and Banc Ed’s assets; (xi) increased competition in the financial services sector and the inability to attract new customers; (xii) changes in technology and the ability to develop and maintain secure and reliable electronic systems; (xiii) the loss of key executives or employees; (xiv) changes in consumer spending; (xv) unexpected results of acquisitions, including the acquisition of Banc Ed; (xvi) unexpected outcomes of existing or new litigation involving First Busey or Banc Ed; (xvii) the economic impact of any future terrorist threats or attacks; (xviii) the economic impact of exceptional weather occurrences such as tornadoes, hurricanes, floods, and blizzards; and (xix) changes in accounting policies and practices. These risks and uncertainties should be considered in evaluating forward-looking statements and undue reliance should not be placed on such statements. Additional information concerning First Busey and its business, including additional factors that could materially affect First Busey’s financial results, are included in First Busey’s filings with the Securities and Exchange Commission (“SEC”). 2
First Busey will file a registration statement on Form S-4 with the SEC in connection with the proposed transaction. The registration statement will include a proxy statement of Banc Ed that also constitutes a prospectus of First Busey, which will be sent to the stockholders of Banc Ed. Banc Ed’s stockholders are advised to read the proxy statement/prospectus when it becomes available because it will contain important information about First Busey, Banc Ed and the proposed transaction. When filed, this document and other documents relating to the merger filed by First Busey and Banc Ed can be obtained free of charge from the SEC’s website at www.sec.gov. These documents also can be obtained free of charge by accessing First Busey’s website at www.busey.com under the tab “Investors Relations” and then under “SEC Filings.” Alternatively, these documents, when available, can be obtained free of charge from First Busey upon written request to First Busey Corporation, Corporate Secretary, 100 W. University Avenue, Champaign, Illinois 61820 or by calling (217) 365-4556, or from Banc Ed, upon written request to The Banc Ed Corp., Attn: R.L. Plummer, Chairman of TheBANK, or by calling (618) 781-1922. Participants in this Transaction First Busey, Banc Ed and certain of their respective directors and executive officers may be deemed to be participants in the solicitation of proxies from stockholders in connection with the proposed transaction under the rules of the SEC. Information about First Busey’s participants may be found in the definitive proxy statement of First Busey relating to its 2018 Annual Meeting of Stockholders filed with the SEC on April 12, 2018. This definitive proxy statement can be obtained free of charge from the sources indicated above. Additional information regarding the interests of these participants will also be included in the proxy statement/prospectus regarding the proposed transaction when it becomes available. Additional Information
First Busey at a Glance 2 2 3 2016 2017 2018YTD 150-year old institution operating 63 branches across four states Balance Sheet ($Mil) • Illinois, Missouri, Indiana & Florida Assets $ 5,425 $ 7,861 $ 7,776 Third largest commercial bank based in Illinois¹ Net Loans $ 4,087 $ 5,561 $ 5,536 Deposits $ 4,374 $ 6,126 $ 6,164 Five strategic acquisitions announced since 2014 Common Equity Capital Ratios $ 594 $ 935 $ 957 Highly regarded for our commitment to the communities we serve and our ability to deliver broad financial capabilities to our customers TCE / TA4 9.05% 8.43% 8.86% Tier 1 Ratio 12.92% 12.14% 12.44% Total Capital Ratio 14.04% 14.15% 14.42% 5 Profitability ROAA 1.00% 1.00% 1.23% ROAA - Adjusted4 1.14% 1.20% 1.33% ROAE 9.59% 8.48% 10.05% ROATCE - Adjusted4 13.29% 14.00% 16.08% ¹ Excludes merger targets and trust banks 2 At or for the year ended December 31 3 At of for the six months ended June 30 4 Non-GAAP financial measure, see reconciliation in Appendix 5 YTD figures annualized 6 Excludes TDRs Source: S&P Global Market Intelligence and company filings. Net Interest Margin Asset Quality 3.42% 3.58% 3.51% NPAs6/ Assets 0.44% 0.36% 0.39% 4 Payment Processing Wealth Management Commercial Banking Principal Lines of Businesses Financial Highlights Company Overview
Successful Acquirer & Integrator First Busey has announced five transactions since 2014, expanding into the St. Louis and Chicago Markets Integration of past transactions has resulted in meeting or exceeding our initial expectations January 2015 5 Transaction Date Assets Loans Deposits Branches MSA Announced August 2018 $1,853 $889 $1,571 19 St. Louis Closed October 2017 $665 $380 $522 13 Peoria Closed July 2017 $1,268 $994 $1,083 9 Chicago Closed April 2016 $1,522 $1,317 $1,138 13 St. Louis Closed $275 $115 $244 3 Peoria
Transaction Overview 6
Overview of Banc Ed Corp. Bank Ed Corp. has provided banking and financial services to the Edwardsville area community since 1868 19 full-service branches all located in St. Louis MSA Core deposits represent approximately 81% of deposits 0.52% total cost of deposits for the quarter ended June 30, 2018 Profitable wealth management division with $1.5 billion assets under management (AUM) Balance Sheet ($Mil) Profitability St. Louis is the largest MSA in Missouri, and the 27th Largest MSA in North America $82.7 million average deposits per location Important industries include transportation equipment, beverages, and aerospace technology • Large employers include: Anheuser-Busch, Arch Coal, HOK, and Nestle 2 Assets $1,853 ROAA 0.85% ROAE2 Net Loans $876 8.07% Net Interest Margin2 Deposits $1,571 2.51% Common Equity $192 Efficiency Ratio 70.7% Capital TCE / TA3 10.06% Asset Quality NPAs / Assets 0.14% Tier 1 Ratio 17.53% LLR / Gross Loans 1.45% 1 At or for the six months ended June 30, 2018 2 YTD Annualized Total Capital Ratio 18.61% NCOs / Avg. Loans -0.03% 3 Non-GAAP financial measure – total common equity less intangible assets over total assets less intangible assets Source: S&P Global Market Intelligence and company filings; Financial data as of 6/30/2018 7 Footprint Highlights Financial Highlights1 Branch Map Overview
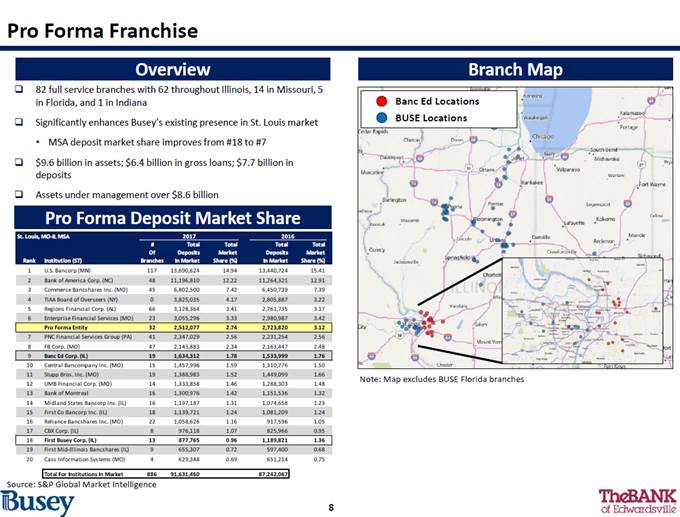
Pro Forma Franchise Pro Forma Deposit Market Share Overview 82 full service branches with 62 throughout Illinois, 14 in Missouri, 5 in Florida, and 1 in Indiana Significantly enhances Busey’s existing presence in St. Louis market MSA deposit market share improves from #18 to #7 $9.6 billion in assets; $6.4 billion in gross loans; $7.7 billion in deposits Assets under management over $8.6 billion Branch Map Banc Ed Locations BUSE Locations Note: Map excludes BUSE Florida branches Source: S&P Global Market Intelligence
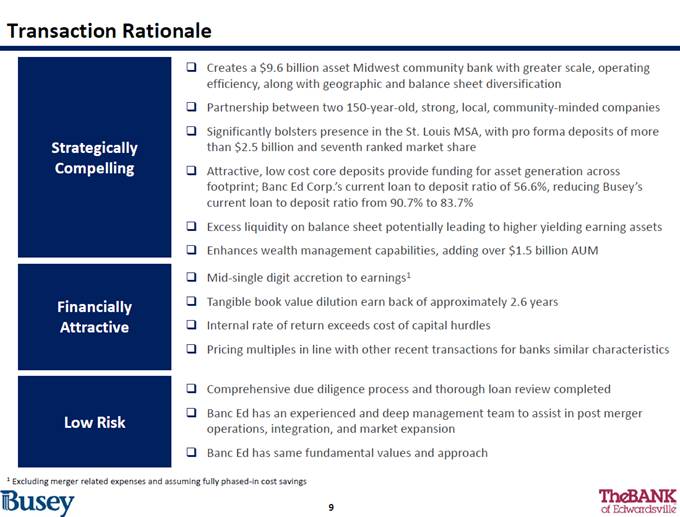
Transaction Rationale Strategically Compelling Financially Attractive Low Risk Comprehensive due diligence process and thorough loan review completed Banc Ed has an experienced and deep management team to assist in post merger operations, integration, and market expansion Banc Ed has same fundamental values and approach Creates a $9.6 billion asset Midwest community bank with greater scale, operating efficiency, along with geographic and balance sheet diversification Partnership between two 150-year-old, strong, local, community-minded companies Significantly bolsters presence in the St. Louis MSA, with pro forma deposits of more than $2.5 billion and seventh ranked market share Attractive, low cost core deposits provide funding for asset generation across footprint; Banc Ed Corp.’s current loan to deposit ratio of 56.6%, reducing Busey’s current loan to deposit ratio from 90.7% to 83.7% Excess liquidity on balance sheet potentially leading to higher yielding earning assets Enhances wealth management capabilities, adding over $1.5 billion AUM Mid-single digit accretion to earnings1 Tangible book value dilution earn back of approximately 2.6 years Internal rate of return exceeds cost of capital hurdles Pricing multiples in line with other recent transactions for banks similar characteristics 1 Excluding merger related expenses and assuming fully phased-in cost savings
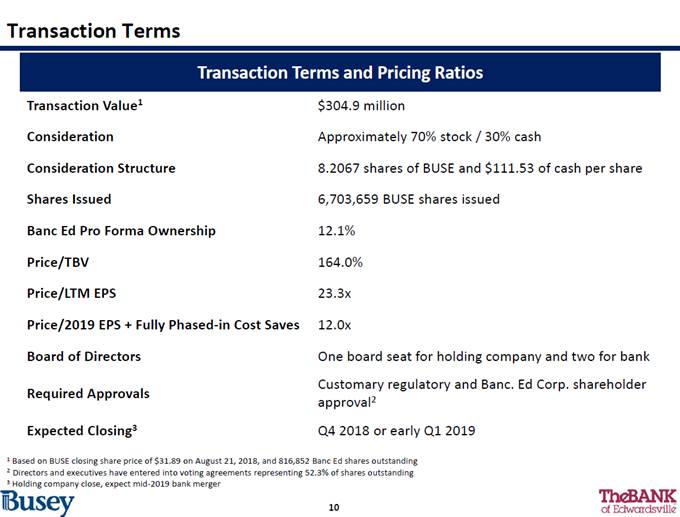
Transaction Terms 1 Based on BUSE closing share price of $31.89 on August 21, 2018, and 816,852 Banc Ed shares outstanding 2 Directors and executives have entered into voting agreements representing 52.3% of shares outstanding 3 Holding company close, expect mid-2019 bank merger Transaction Value1 $304.9 million Consideration Approximately 70% stock / 30% cash Consideration Structure 8.2067 shares of BUSE and $111.53 of cash per share Shares Issued 6,703,659 BUSE shares issued Banc Ed Pro Forma Ownership 12.1% Price/TBV 164.0% Price/LTM EPS 23.3x Price/2019 EPS + Fully Phased-in Cost Saves 12.0x Board of Directors One board seat for holding company and two for bank Required Approvals Customary regulatory and Banc. Ed Corp. shareholder approval2 Expected Closing3 Q4 2018 or early Q1 2019 Transaction Terms and Pricing Ratios
Transaction Pro Forma Financial Implications Earnings Accretion 1st Full Year of 100% Cost Savings 4.5% Tangible Book Value Dilution at Close 2.0% Tangible Book Value Per Share Earn Back at Close 2.6 years Pro Forma TCE Ratio1 Pro Forma Tier 1 Common Ratio1 Pro Forma Total Risk Based Capital Ratio1 8.2% 10.8% 13.4% 1 Projected at December 31, 2018 11 Earnings, Tangible Book Value and Capital Ratios
Transaction Assumptions 31% of Banc Ed Corp. LTM non-interest expense, phased in over two years Estimated Cost Savings: Revenue Synergies: Identified, but not modeled Transaction Expenses: $29.1 million, pretax 1.75% of non-time deposits amortized over ten years using the sum-of-years-digits method Core Deposit Intangible: Credit Marks: 1.55% aggregate mark on loans and 20% on OREO Capital Contingency: None 12 Cost Saves, Purchase Marks and Other Assumptions
Due Diligence Review Thorough due diligence process to evaluate Banc Ed Corp.’s credit portfolios Total $ Amount $13.8 M As a Percent of loans 1.55% Loan review completed by internal BUSE team As a Percent of NPAs 100%+ 48% of outstanding commercial loan balances reviewed Loan Loss Reserve $12.8 M All non-performing and nearly all of classified credits reviewed Net loan Mark $0.9 M All OREO properties reviewed Large sample of performing credits reviewed 13 Estimated Loan Mark Due Diligence Overview
Transaction Meets All M&A Disciplines Significant expansion in the attractive St. Louis market, Midwest’s 4th largest MSA; increases deposit market share from 18th ranking to 7th High-density metro market with growth opportunities in commercial & wealth management deposits – 81% core with 52 bps overall cost Enhances wealth management capabilities with the addition of over $1.5 billion in AUM for a combined $8.6 billion Complimentary strategies Financial: Attractive TBV earn back period Approximately 2.6 years savings 1 As of June 30, 2018 14 Conservative loan marks and reasonable cost saves 1.55% of total loans; approximately 31% cost Immediately accretive to earnings excluding Accretive to EPStransaction costs and with 100% cost savings, first full year accretion approximately 4.5% Complementary culture Similar culture, efficient transition Mature franchise with an attractive deposit base 150 year old institution with more than $1.5 billion Key AttributesBanc EdRationale1 Franchise:
Pro Forma Loan Portfolio Consr & Other 8.5% Consr & Other 6.7% C&D 5.6% C&D .2% 7.9% Consr & Other 19.7% 1-4 Fam 21.7% C&I 19.7% C&I 18.3% 1-4 Fam 20.3% 1-4 Fam 21.9% 9.8% Multifam 7.4% Multifam 7.7% HEL C 6.6% HELOC 4.3% HELOC 4.6% Multifam 5.4% wnOcc CRE 10.3% OwnOcc CRE 14.3% OwnOcc CRE 14.9% Other CRE 19.6% Other CRE 20.0% Other CRE 19.5% Constr & Dev 1-4 Family Residential Home Equity Owner - Occ CRE Other CRE Multifamily Commercial & Industrial Consr & Other Unearned Income Total Loans 292,334 1,225,274 241,558 832,548 1,092,020 431,605 1,098,432 375,490 - 5.2% 21.9% 4.3% 14.9% 19.5% 7.7% 19.7% 6.7% Constr & Dev 1-4 Family Residential Home Equity Owner - Occ CRE Other CRE Multifamily Commercial & Industrial Consr & Other Unearned Income Total Loans 69,960 180,477 58,715 91,102 178,112 47,730 87,344 175,329 (37) 7.9% 20.3% 6.6% 10.3% 20.0% 5.4% 9.8% 19.7% Constr & Dev 1-4 Family Residential Home Equity Owner - Occ CRE Other CRE Multifamily Commercial & Industrial Consr & Other Unearned Income Total Loans 362,294 1,405,751 300,273 923,650 1,270,132 479,335 1,185,776 550,819 (37) 5.6% 21.7% 4.6% 14.3% 19.6% 7.4% 18.3% 8.5% $5,589,261 100.0% $888,732 100.0% $6,477,993 100.0% MRQ – Most recent quarter ended June 30, 2018 Pro forma excludes purchase accounting adjustments Source: S&P Global Market Intelligence and regulatory filings 15 Composition Loan Type ($000) % of Total Composition Loan Type ($000) % of Total Composition Loan Type ($000) % of Total Pro Forma Banc Ed Corp. BUSE
Pro Forma Deposit Composition Time Deposits > $100k 1.7% Time Deposits > $100k 3.2% Time Deposits > $100k 3.5% Non Int. Bearing 18.7% Non Int. Bearing 23.1% Time Deposits < $100k 17.0% Non Int. Bearing 24.3% Time Deposits < $100k 19.7% Time Deposits < $100k 20.4% NOW Acct 9.1% NOW Accts 3.9% NOW Accts 2.5% MMDA & Sav 53.4% MMDA & Sav 50.1% MMDA & Sav 49.3% Non Interest Bearing NOW & Other Trans MMDA & Sav Time Deposits < $250k Time Deposits > $250k Total Deposits 1,496,671 156,328 3,036,406 1,256,856 24.3% 2.5% 49.3% 20.4% Non Interest Bearing NOW & Other Trans MMDA & Sav Time Deposits < $250k Time Deposits > $250k Total Deposits 293,199 143,629 839,557 267,480 18.7% 9.1% 53.4% 17.0% Non Interest Bearing NOW & Other Trans MMDA & Sav Time Deposits < $250k Time Deposits > $250k Total Deposits 1,789,870 299,957 3,875,963 1,524,336 23.1% 3.9% 50.1% 19.7% 217,651 3.5% 27,222 1.7% 244,873 3.2% $6,163,912 100.0% $1,571,087 100.0% $7,734,999 100.0% MRQ Cost of Deposits: Loans / Deposits 0.44% 90.7% MRQ Cost of Deposits: Loans / Deposits 0.52% 56.6% MRQ Cost of Deposits: Loans / Deposits 0.46% 83.7% MRQ – Most recent quarter ended June 30, 2018 Pro forma excludes purchase accounting adjustments Source: S&P Global Market Intelligence and regulatory filings 16 Composition Deposit Type ($000) % of Total Composition Deposit Type ($000) % of Total Composition Deposit Type ($000) % of Total Pro Forma Banc Ed Corp. BUSE
Appendix 17
Non-GAAP Reconciliation – Adjusted Net Income and ROAA Net Income Acquisition Expense Salaries, wages, and employee benefits Data processing Other Other restructuring costs Salaries, wages, and employee benefits Other Related tax benefit Tax Cut and Jobs Act adjustment Adjusted net income $ 49,694 $ 62,726 $ 46,779 2,327 5,296 2,356 840 2,616 3,617 1,233 406 2,057 1,305 24 (4,466) - 711 66 (3,012) 8,098 417 817 (1,197) - $ 56,536 $ 75,662 $ 50,512 Average total assets 4,973,913 6,294,105 7,658,691 Return on average assets Adjusted return on average assets 1.00% 1.14% 1.00% 1.20% 1.23% 1.33% 1 YTD annualized Source: Quarterly report on Form 10-Q filed with the SEC on August 7, 2018; Annual report of Form 10-K filed with the SEC on February 28, 2018; Internal documents 18 Six Months Year Ended December 31, Ended June 30, 2016201720181
Non-GAAP Reconciliation – TCE / TA and Adjusted ROATCE Total Assets Goodwill and intangible assets Tax effect of goodwill and intangible assets Tangible Assets $ 5,425,170 (121,276) $ 7,860,640 (308,073) $ 7,775,544 (303,407) 7,392 11,039 9,288 $ 5,311,286 $ 7,563,606 $ 7,481,425 Total common equity Goodwill and intangible assets Tax effect of goodwill and intangible assets Tangible common equity $ 594,314 (121,276) $ 935,003 (308,073) $ 957,182 (303,407) 7,392 11,039 9,288 $ 480,430 $ 637,969 $ 663,063 Tangible common equity to tangible assets 9.05% 8.43% 8.86% Average common equity Average goodwill and intangible assets, net Average tangible common equity $ 518,252 $ 739,825 $ 938,975 (92,692) (199,419) (305,666) $ 425,560 $ 540,406 $ 633,309 Return on average common equity Return on average tangible common equity Adjusted return on average tangible common equity 9.59% 11.68% 13.29% 8.48% 11.61% 14.00% 10.05% 14.90% 16.08% 1 YTD annualized Source: Quarterly report on Form 10-Q filed with the SEC on August 7, 2018; Annual report of Form 10-K filed with the SEC on February 28, 2018; Internal documents 19 Six Months Year Ended December 31, Ended June 30, 2016 2017 20181