Attached files
| file | filename |
|---|---|
| 8-K - 8-K - INVESTOR PRESENTATION - MVB FINANCIAL CORP | form8k-investorpresentatio.htm |

INVESTOR PRESENTATION Fundamental Banking with Blue Ocean Opportunities August 2018 NASDAQ: MVBF

Forward Looking Statements & Non-GAAP Financial Measures This Presentation contains forward‐looking statements, within the meaning of Section 27A of the Securities Act of 1933, as amended, and Section 21E of the Securities Exchange Act of 1934, as amended. These forward‐looking statements are based on current expectations about the future and subject to risks and uncertainties. Forward‐looking statements include information concerning possible or assumed future results of operations of MVB Financial Corp. (the “Company”) and its subsidiaries. When words such as "believes," "expects," "anticipates," "may," or similar expressions occur in this Presentation, the Company is making forward‐looking statements. Note that many factors could affect the future financial results of the Company and its subsidiaries, both individually and collectively, and could cause those results to differ materially from those expressed in the forward‐looking statements contained in this Presentation. Those factors include, but are not limited to: credit risk, changes in market interest rates, competition, economic downturn or recession, and government regulation and supervision. Additional factors that may cause our actual results to differ materially from those described in our forward‐looking statements can be found in the Company’s Annual Report on Form 10‐K for the year ended December 31, 2017, as well as its other filings with the SEC, which are available on the SEC website at www.sec.gov. Except as requiredbylaw,the Company undertakes no obligation to update or revise any forward‐looking statements. Accounting standards require the consideration of subsequent events occurring after the balance sheet date for matters that require adjustment to, or disclosure in, the consolidated financial statements. The review period for subsequent events extends up to and including the filing date of a public company's financial statements when filed with the Securities and Exchange Commission. Accordingly, the consolidated financial information in this Presentation is subject to change. The Company uses certain non‐GAAP financial measures, such as tangible common equity to tangible assets, to provide information useful to investors in understanding the Company’s operating performance and trends, and facilitate comparisons with the performance of the Company’s peers. The non‐GAAP financial measures used may differ from the non‐GAAP financial measures other financial institutions use to measure their results of operations. Non‐GAAP financial measures should be viewed in addition to, and not as an alternative for, the Company’s reported results prepared in accordance with U.S. GAAP. Reconciliations of these non‐GAAP financial measures to the most directly comparable U.S. GAAP financial measures are provided in the Appendix to this Presentation.
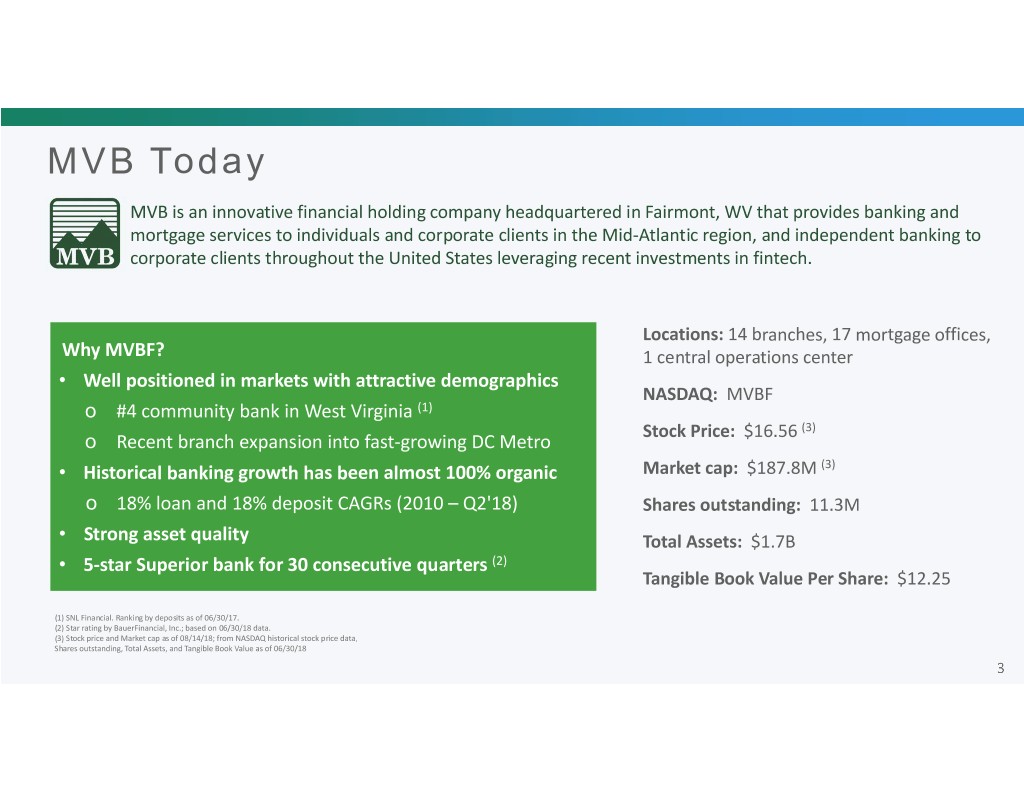
MVB Today MVB is an innovative financial holding company headquartered in Fairmont, WV that provides banking and mortgage services to individuals and corporate clients in the Mid‐Atlantic region, and independent banking to corporate clients throughout the United States leveraging recent investments in fintech. Locations: 14 branches, 17 mortgage offices, Why MVBF? 1 central operations center • Well positioned in markets with attractive demographics NASDAQ: MVBF o #4 community bank in West Virginia (1) Stock Price: $16.56 (3) o Recent branch expansion into fast‐growing DC Metro • Historical banking growth has been almost 100% organic Market cap: $187.8M (3) o 18% loan and 18% deposit CAGRs (2010 – Q2'18) Shares outstanding: 11.3M • Strong asset quality Total Assets: $1.7B • 5‐star Superior bank for 30 consecutive quarters (2) Tangible Book Value Per Share: $12.25 (1) SNL Financial. Ranking by deposits as of 06/30/17. (2) Star rating by BauerFinancial, Inc.; based on 06/30/18 data. (3) Stock price and Market cap as of 08/14/18; from NASDAQ historical stock price data. Shares outstanding, Total Assets, and Tangible Book Value as of 06/30/18
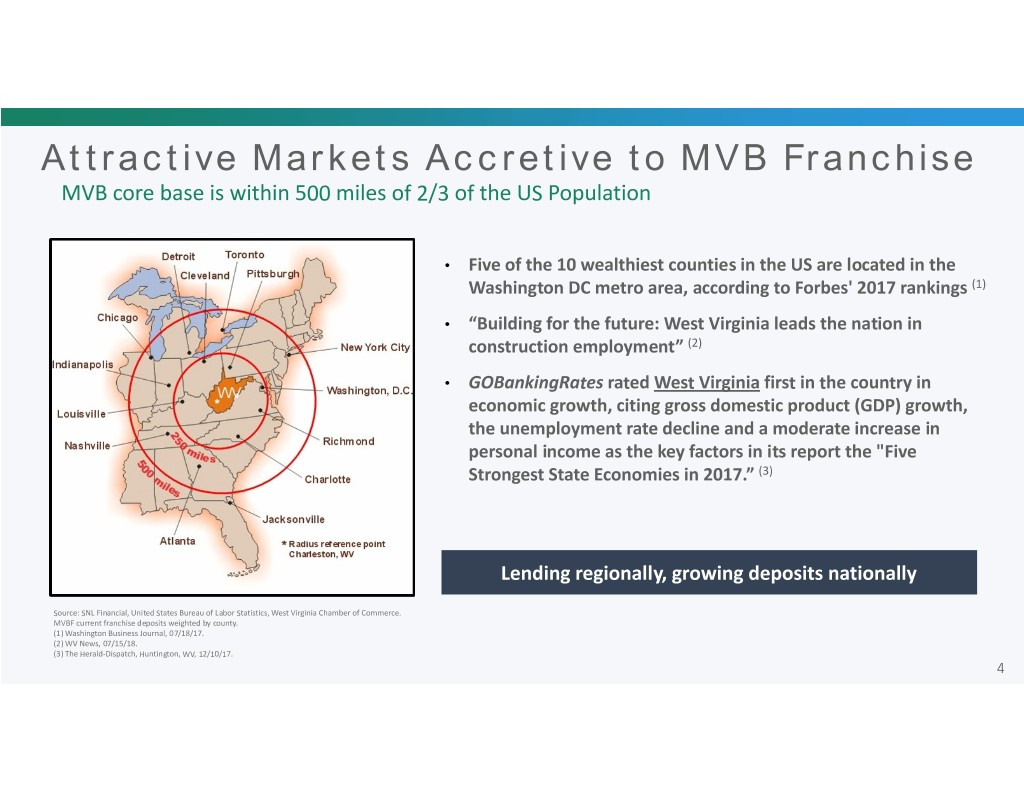
Attractive Markets Accretive to MVB Franchise MVB core base is within 500 miles of 2/3 of the US Population • Five of the 10 wealthiest counties in the US are located in the Washington DC metro area, according to Forbes' 2017 rankings (1) • “Building for the future: West Virginia leads the nation in construction employment” (2) • GOBankingRates rated West Virginia first in the country in economic growth, citing gross domestic product (GDP) growth, the unemployment rate decline and a moderate increase in personal income as the key factors in its report the "Five Strongest State Economies in 2017.” (3) Lending regionally, growing deposits nationally Source: SNL Financial, United States Bureau of Labor Statistics, West Virginia Chamber of Commerce. MVBF current franchise deposits weighted by county. (1) Washington Business Journal, 07/18/17. (2) WV News, 07/15/18. (3) The Herald‐Dispatch, Huntington, WV, 12/10/17.

MVB 3.0 = Think Bigger • Leaders, not followers • Implement strategic shifts which move us to blue oceans • Think beyond present market footprint ‐ Coast to Coast • Superior Growth: Assets, Net Income & Shareholder Value • Culture that attracts & retains quality talented teams • Be bankers, just don’t act like bankers – instill a culture of saying “Yes, if” instead of “No, because” • Have an entrepreneurial mentality and spirit ‐ Operate like a start‐up • Speed, Simplicity, Service “The fintech tsunami is brewing and banks are becoming yellow top taxis in an Uber world ‐ we must modernize or become irrelevant!“ ‐Larry F. Mazza, CEO & President MVB Financial Corp., June 2018
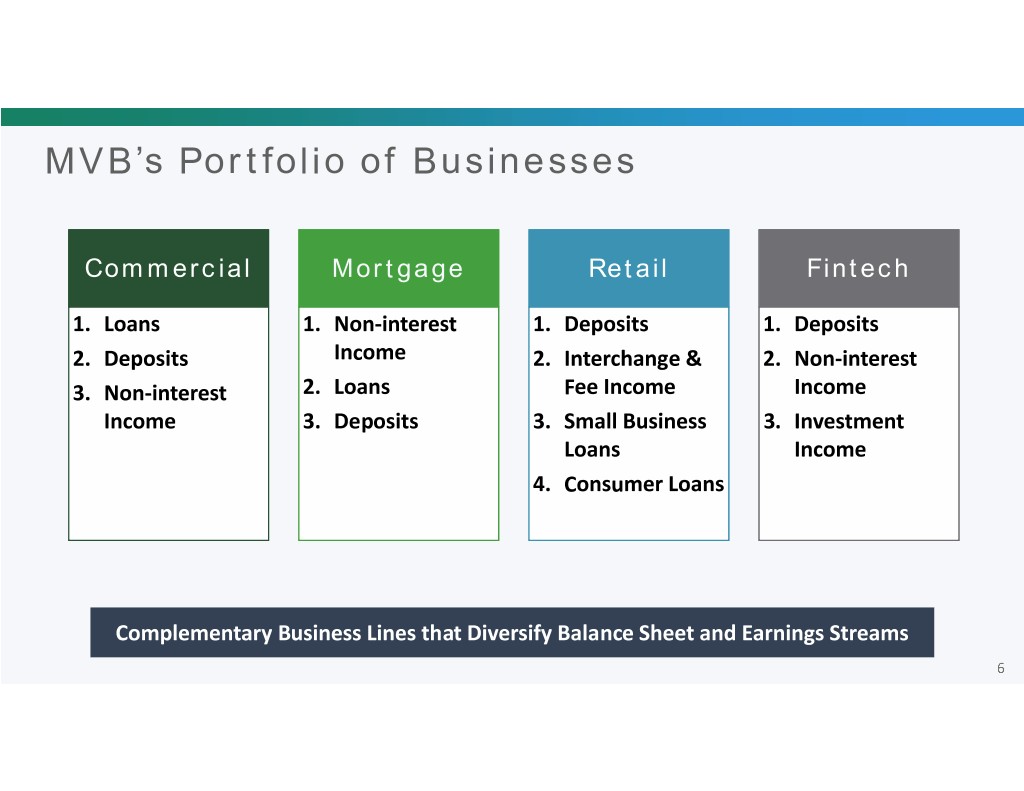
MVB’s Portfolio of Businesses Commercial Mortgage Retail Fintech 1. Loans 1. Non‐interest 1. Deposits 1. Deposits 2. Deposits Income 2. Interchange & 2. Non‐interest 3. Non‐interest 2. Loans Fee Income Income Income 3. Deposits 3. Small Business 3. Investment Loans Income 4. Consumer Loans Complementary Business Lines that Diversify Balance Sheet and Earnings Streams
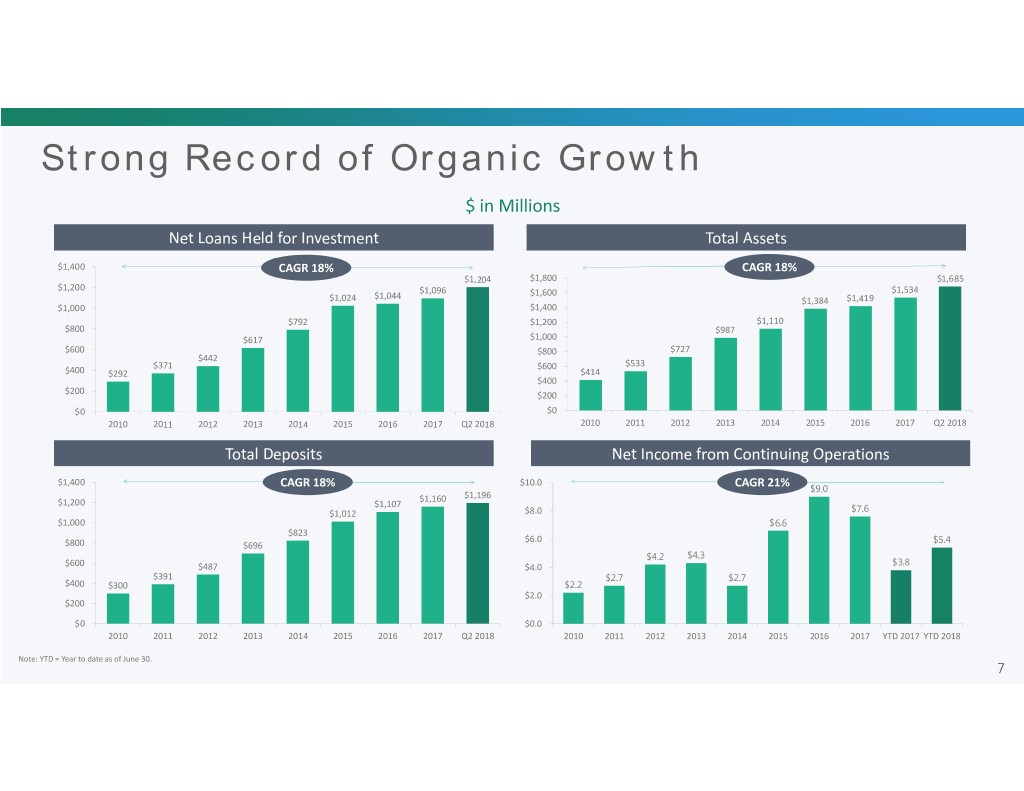
Strong Record of Organic Growth $ in Millions Net Loans Held for Investment Total Assets $1,400 CAGR:CAGR 18% 18% CAGR 18% $1,204 $1,800 $1,685 $1,200 $1,096 $1,534 $1,044 $1,600 $1,024 $1,384 $1,419 $1,000 $1,400 $792 $1,200 $1,110 $800 $987 $617 $1,000 $600 $800 $727 $442 $371 $600 $533 $400 $292 $414 $400 $200 $200 $0 $0 2010 2011 2012 2013 2014 2015 2016 2017 Q2 2018 2010 2011 2012 2013 2014 2015 2016 2017 Q2 2018 Total Deposits Net Income from Continuing Operations $1,400 $10.0 CAGR 18% CAGR 21% $9.0 $1,196 $1,200 $1,160 $1,107 $7.6 $1,012 $8.0 $1,000 $6.6 $823 $6.0 $5.4 $800 $696 $4.2 $4.3 $600 $487 $4.0 $3.8 $391 $2.7 $2.7 $400 $300 $2.2 $2.0 $200 $0 $0.0 2010 2011 2012 2013 2014 2015 2016 2017 Q2 2018 2010 2011 2012 2013 2014 2015 2016 2017 YTD 2017 YTD 2018 Note: YTD = Year to date as of June 30.

Financial Highlights Diversified Blend of Commercial and Residential Lending 2018 Q2 Results $ in thousands, except per share FY 2016 FY 2017 2017 YTD 2018 YTD Balance Sheet . Gross loans HFI increased 5.0% from prior Total Assets $1,418,804 $1,534,302 $1,507,053 $1,685,419 quarter, 9.9% from year end, and 10.2% year‐ Gross Loans HFI $1,052,865 $1,105,941 $1,102,378 $1,215,072 over‐year Total Deposits $1,107,017 $1,159,580 $1,099,608 $1,195,868 . Deposits increased 3.6% from prior quarter, Consolidated Capital (%) 3.1% from year end, and 8.8% year‐over‐year Tier 1 Risk‐Based Ratio 11.92% 11.54% 11.33% 12.20% CET 1 Ratio 10.11% 10.55% 10.32% 11.28% . Noninterest bearing deposits grew 14.8% Risk‐Based Capital Ratio 15.36% 14.87% 14.66% 14.34% from prior quarter, 30.2% from year end, and 35.1% year‐over‐year Asset Quality (%) NPAs / Assets (1) 0.47% 0.72% 0.41% 0.66% . 2018 YTD net charge‐offs of 0.05% of total NCOs / Loans 0.24% 0.13% 0.07% 0.05% loans Reserves / Gross Loans HFI 0.86% 0.89% 0.88% 0.88% . Well‐positioned with respect to the current Profitability interest rate environment Net Income to Common Shareholders $11,784 $7,077 $3,583 $5,182 ROAA (2) 0.91% 0.52% 0.54% 0.69% ROAE (2) 10.50% 5.23% 5.45% 7.17% Noninterest Inc. / Operating Rev. (3) 49.49% 47.44% 48.59% 44.71% Net Interest Margin 3.22% 3.27% 3.25% 3.34% Source: SEC filings and company documents. Diluted EPS $1.31 $0.68 $0.35 $0.47 Note: Reserves / Loans excludes loans held for sale. YTD = Year to date as of June 30. (1) NPAs include non‐accruing loans, 90+ days still accruing, and OREO. (2) FY 2016 includes $3.9 million of net income from discontinued operations. Excluding this income, ROAA and ROAE would have been 0.63% and 7.30% for FY 2016 and 0.62% and 7.41% for YTD 2016. (3) Non‐GAAP financial measure. Please see "Non‐GAAP Reconciliations" in this presentation for details.

YoY Growth Highlights From June 30, 2017 to June 30, 2018 Area Percent Increase Noninterest‐bearing Deposits 35.1% Service Fees 32.4% Net Interest Income 13.8% Equity 12.9% Loans 10.2% Continued Growth with Profitability Emphasis
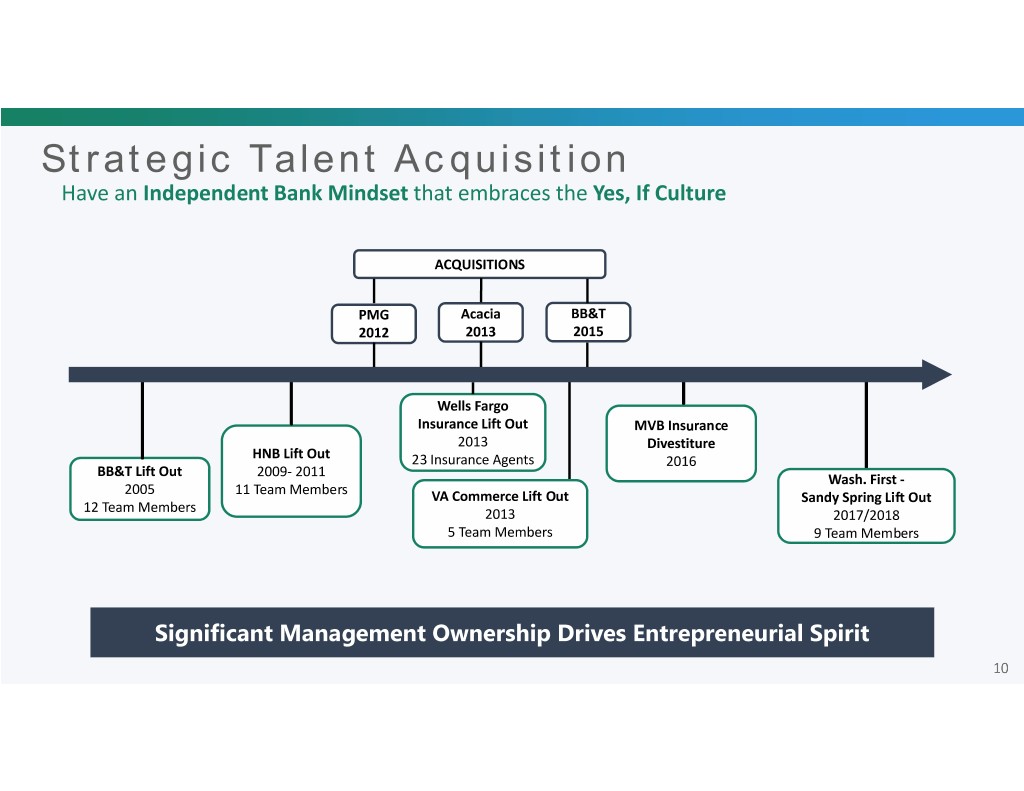
Strategic Talent Acquisition Have an Independent Bank Mindset that embraces the Yes, If Culture ACQUISITIONS PMG Acacia BB&T 2012 2013 2015 Wells Fargo Insurance Lift Out MVB Insurance 2013 Divestiture HNB Lift Out 23 Insurance Agents 2016 BB&T Lift Out 2009‐ 2011 Wash. First ‐ 2005 11 Team Members VA Commerce Lift Out Sandy Spring Lift Out 12 Team Members 2013 2017/2018 5Team Members 9Team Members Significant Management Ownership Drives Entrepreneurial Spirit
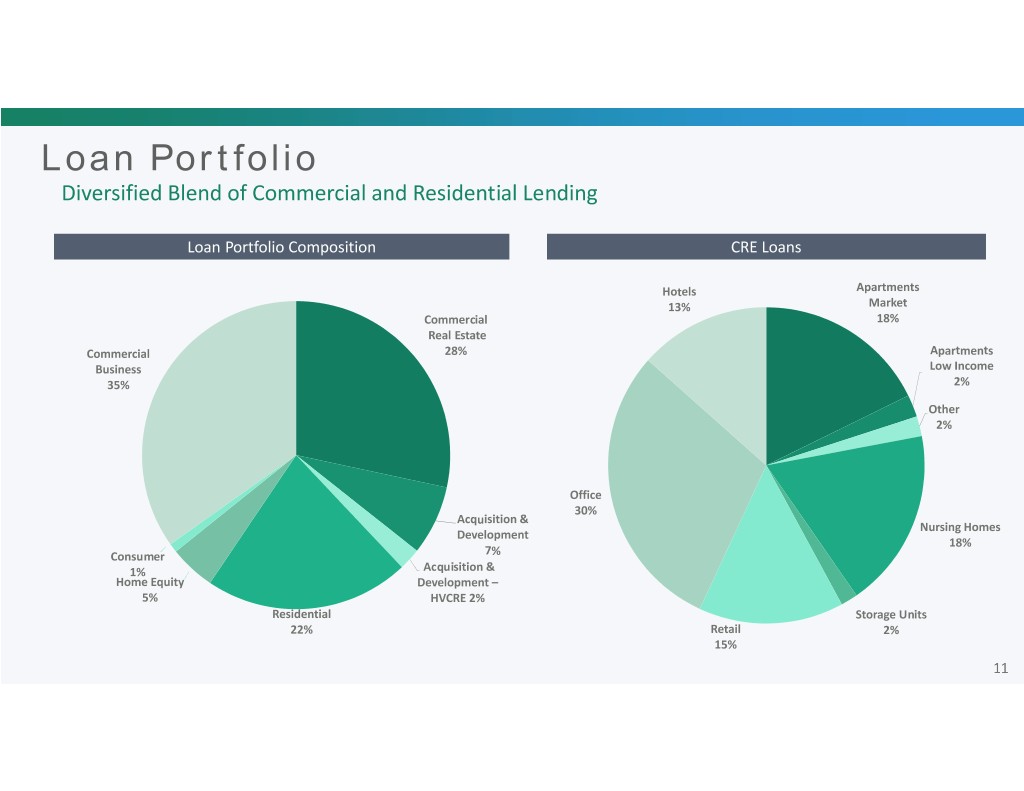
Loan Portfolio Diversified Blend of Commercial and Residential Lending Loan Portfolio Composition CRE Loans Hotels Apartments 13% Market Commercial 18% Real Estate Commercial 28% Apartments Business Low Income 35% 2% Other 2% Office 30% Acquisition & Nursing Homes Development 18% Consumer 7% 1% Acquisition & Home Equity Development – 5% HVCRE 2% Residential Storage Units 22% Retail 2% 15%

NIM – Peer Comparison 4.20% 4.09% 4.00% 3.90% 3.79% 3.82% 3.80% 3.67% 3.60% 3.40% 3.38% 3.27% 3.22% 3.20% 3.07% 3.01% 3.00% 2014 2015 2016 2017 Q2 2018 MVBF Regional Peers Source: SEC filings and SNL Financial. Regional peers defined as public institutions headquartered in West Virginia, Maryland, Virginia, and the Washington D.C. MSA with assets between $750 million and $2.0 billion.

Mortgage Volume Analysis $ in Millions Historical Volume Comparison (1) 2018 Dollar Volume by State (1) $1,800 DC Other WV 5% 2% 6% $1,643 MD 6% $1,600 $1,541 $1,400 $1,339 NC/SC $1,200 32% VA 49% $1,012 $1,000 $838 (2) $770 2018 Dollar Volume by Transaction Type $800 $736 Refinance 10% $600 Construction Refinance $400 16% $200 Purchase 57% Construction $0 Origination 2013 2014 2015 2016 2017 2017 YTD 2018 YTD 17% Source: Company documents. YTD totals as of June 30. (1) Volume displayed by dollars closed. (2) Volume displayed by number of loans closed.

Retail Modernization • New Leadership & Commitment • Strategic locations for new Branch Banking Centers • Enhance Consumer Lending, Deposits & Fee Income • Traditional & Digital Average Total Deposits per Branch ‐ $83.4 Million (1) Source: Company documents. (1) Year‐to‐date average balance as of 06/30/18.

Expanded Fintech Strategy Includes the innovative “One Stop Payment Shop!” Keep Up Get Ahead 1. Offer Solutions to 3. Become Banking Strengthen Client Partner for Fintech Relationships Companies GOAL Increase Positive Exposure to Fintech Trends 2. Utilize Productivity 4. Make Investments in Enhancing Tools Fintech Companies

Fintech Differentiators – Distinct or Extinct NIB Growth Opportunity of $100MM+ through 2018 from our Network of Current Clients and Technology Partners Target Segments Companies that use technology to manage or move money Service Speed 1. Payments Processing ‐ Concierge Team ‐ Dedicated 2. Corporate Payments ‐ Needs Based Onboarding Team Solutions ‐ Tailored, Risk‐Based 3. Hospitality & Gaming ‐ Executive Access & Due Diligence Engagement 4. Prepaid Cards 5. Crowd Funding Simplicity 6. Specialty Escrow ‐ Technology Partner Agnostic ‐ Modular Solutions ‐ Compliance & Operations Expertise

Investment Conclusions Continue Firing on All Cylinders in 2018 Continue Quality Loan Improve Nurture the Talent Growth Deposit Mix Yes, If Culture Acquisition Reward Shareholders by Executing on MVBF’s Differentiated Plan

Thank You for Joining Us Today Q&A Session “Being on Nasdaq and in the Russell 2000 Index are not a destination, they are only one part of the journey. We are thinking bigger.” ‐ Larry F. Mazza CEO and President, MVB Financial Corp.
Contact Us MVB Financial Corp. 301 Virginia Avenue Fairmont, WV 26554 (304) 363‐4800 Investor Relations Lisa McCormick MVB Financial Corp. (304) 367‐8697

Appendix Materials

Asset Quality Trends As of June 30, 2018 Non‐Performing Loans / Total Loans NCOs / Average Loans 3.50% 0.70% 0.60% 2.86% 2.92% 3.00% 0.60% 0.52% 2.50% 2.33% 2.24% 2.35% 0.50% 1.93% 0.40% 0.31% 2.00% 1.72% 0.42% 0.30% 0.22% 1.50% 1.35% 0.35% 0.18% 0.20% 0.25% 0.10% 0.12% 1.00% 1.16% 0.10% 0.17% 0.17% 0.04% 0.99% 0.12% 0.50% 0.88% 0.77% 0.88% 0.78% 0.00% 0.07% 0.59% 0.03% 0.00% -0.10% 0.14% 2011 2012 2013 2014 2015 2016 2017 Q2 2018 2011 2012 2013 2014 2015 2016 2017 Q2 2018 MVBF Regional Peers MVBF Regional Peers Loan Loss Reserves / Gross Loans NPAs / Assets 1.60% 1.53% 1.53% 3.00% 2.65% 2.61% 1.50% 1.43% 2.59% 2.50% 1.40% 2.16% 1.30% 1.25% 1.23% 1.86% 2.00% 1.71% 1.20% 1.07% 1.50% 1.10% 1.50% 1.34% 1.00% 0.92% 0.93% 0.90% 1.00% 0.80% 0.91% 0.89% 0.88% 0.89% 0.86% 0.50% 0.76% 0.72% 0.81% 0.79% 0.65% 0.66% 0.70% 0.78% 0.78% 0.50% 0.12% 0.47% 0.60% 0.00% 2011 2012 2013 2014 2015 2016 2017 Q2 2018 2011 2012 2013 2014 2015 2016 2017 Q2 2018 MVBF Regional Peers MVBF Regional Peers Note: Nonperforming assets include nonaccruals, OREO, and 90+ days past due. Source: SEC filings and SNL Financial. Regional peers defined as public institutions headquartered in West Virginia, Maryland, Virginia, and the Washington D.C. MSA with assets between $750 million and $2.0 billion. Peer data reflects the most recent quarterly data publicly available.
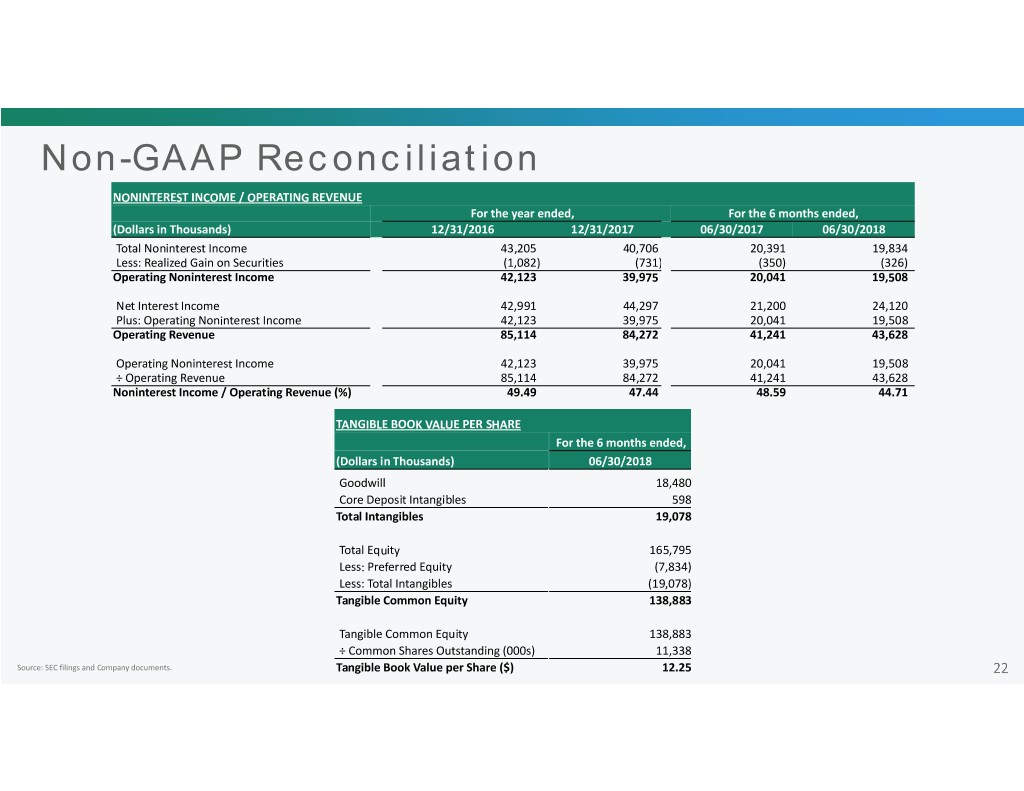
Non-GAAP Reconciliation NONINTEREST INCOME / OPERATING REVENUE For the year ended, For the 6months ended, (Dollars in Thousands) 12/31/2016 12/31/2017 06/30/2017 06/30/2018 Total Noninterest Income 43,205 40,706 20,391 19,834 Less: Realized Gain on Securities (1,082) (731) (350) (326) Operating Noninterest Income 42,123 39,975 20,041 19,508 Net Interest Income 42,991 44,297 21,200 24,120 Plus: Operating Noninterest Income 42,123 39,975 20,041 19,508 Operating Revenue 85,114 84,272 41,241 43,628 Operating Noninterest Income 42,123 39,975 20,041 19,508 ÷ Operating Revenue 85,114 84,272 41,241 43,628 Noninterest Income / Operating Revenue (%) 49.49 47.44 48.59 44.71 TANGIBLE BOOK VALUE PER SHARE For the 6 months ended, (Dollars in Thousands) 06/30/2018 Goodwill 18,480 Core Deposit Intangibles 598 Total Intangibles 19,078 Total Equity 165,795 Less: Preferred Equity (7,834) Less: Total Intangibles (19,078) Tangible Common Equity 138,883 Tangible Common Equity 138,883 ÷ Common Shares Outstanding (000s) 11,338 Source: SEC filings and Company documents. Tangible Book Value per Share ($) 12.25
