Attached files
| file | filename |
|---|---|
| 8-K - FORM 8-K - XCel Brands, Inc. | tv501127_8k.htm |
Exhibit 99.1

INVESTOR PRESENTATION SECOND QUARTER 2018 NASDAQ: XELB
2 SAFE HARBOR STATEMENT FORWARD LOOKING STATEMENTS Certain statements in this presentation, as well as certain oral statements made by management during the presentation, constitute “forward - looking statements” within the meaning of the United States Private Securities Litigation Reform Act of 1995 . These statements include, without limitation, statements expressed or implied regarding our plans and milestones, plans to fund our current activities, statements concerning our strategic relationships and activities, strategy, future operations and expansion, future financial position, future sales and revenues, projected costs, and market penetration . In some cases, forward - looking statements can be identified by terminology such as “may, “will”, “should”, “expects”, “seeks”, “plans”, “anticipates”, “believes”, “estimates”, “predicts”, “potential”, “projects”, “continue”, “intends”, “could”, “opportunity”, or negative of such terms or other comparable terminology . These statements are based on our current expectations and assumptions and are not guarantees of future performance . You should not place undue reliance on our forward - looking statements, which are subject to a multitude of known and unknown risks and uncertainties that could cause actual results, future circumstance or events to differ materially from those stated in or implied by the forward - looking statements . These risks and uncertainties include, but are not limited to, the ability of our licensees to produce, market and sell quality products bearing our brand names, continued market acceptance of our brands and any future brands we acquire, our ability to service our significant debt obligations, our ability to raise capital for any future acquisitions, concentration of a substantial portion of our licensing revenue from a limited number licensees, our dependence on QVC, restrictions in our agreements with QVC and other licensees on our ability to sell products with certain retailers, our dependence on promotional services of our spokesperson, limitations on our ownership of the H Halston brands, impacts on our H Halston brands resulting from the operations of the related Halston brands by their owner, our ability to manage expected future growth, our ability to identify and acquire additional trademarks, competition for licensees, competition in our licensee’s markets, our ability to protect our intellectual property, our dependence on our CEO and other key executive officers, the success of our e - commerce strategy and other risks and uncertainties detailed from time to time in our public disclosure documents or other filings with the Securities and Exchange Commission . Additional risks and uncertainties relating to us and our business can be found in the “Risk Factors” section of our latest annual report on Form 10 - K as well as in our other public filings . The forward - looking statements are made as of the date hereof, and we disclaim any intention and have no obligation or responsibility, except as required by law, to update or revise any forward - looking statements, whether as a result of new information, future events or otherwise . NON - GAAP FINANCIAL MEASURES In addition to financial measures prepared in accordance with U . S . generally accepted accounting principles (GAAP), we use certain non - GAAP financial measures in this presentation . Adjusted EBITDA is a non - GAAP unaudited measure, which we define as net income before stock - based compensation, interest and other financing costs, loss on extinguishment of debt, gain on the reduction of contingent obligations, non - recurring facility exit charges, goodwill impairment, income tax provision (benefit), other state and local franchise taxes, depreciation and amortization and net income or loss from discontinued operations . We use Adjusted EBITDA as a measure of operating performance to assist in comparing performance from period to period on a consistent basis and to identify business trends relating to Xcel’s results of operations . We believe Adjusted EBITDA is also useful because it provides supplemental information to assist investors in evaluating Xcel’s financial results . Adjusted EBITDA should not be considered in isolation or as an alternative to net income or any other measure of financial performance calculated and presented in accordance with GAAP . Given that Adjusted EBITDA is a financial measure not deemed to be in accordance with GAAP and is susceptible to varying calculations, our Adjusted EBITDA may not be comparable to similarly titled measures of other companies, including companies in our industry, because other companies may calculate Adjusted EBITDA in a different manner than we calculate this measure . In evaluating Adjusted EBITDA, you should be aware that in the future we may or may not incur expenses similar to some of the adjustments in this report . Our presentation of Adjusted EBITDA does not imply that our future results will be unaffected by these expenses or any unusual or non - recurring items . When evaluating our performance, you should consider Adjusted EBITDA alongside other financial performance measures, including our net income (loss) and other GAAP results, and not rely on any single financial measure .
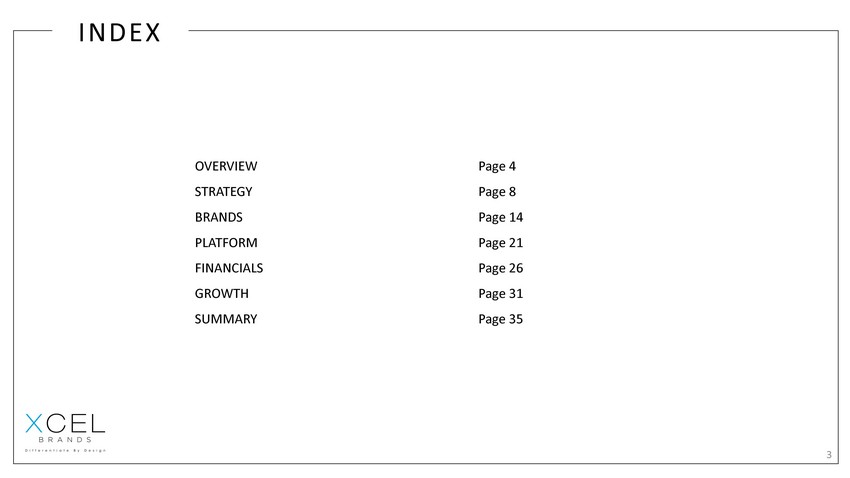
INDEX OVERVIEW STRATEGY BRANDS PLATFORM FINANCIALS GROWTH SUMMARY Page 4 Page 8 Page 14 Page 21 Page 26 Page 31 Page 35 3

OVERVIEW 4
5 XCEL BRANDS, INC. (NASDAQ:XELB) IS A CONSUMER PRODUCTS COMPANY ENGAGED IN THE DESIGN, PRODUCTION, LICENSING, MARKETING AND DIRECT - TO - CONSUMER SALES OF BRANDED APPAREL, FOOTWEAR, ACCESSORIES, JEWELRY, HOME GOODS, AND OTHER CONSUMER PRODUCTS, AND THE ACQUISITION OF DYNAMIC CONSUMER LIFESTYLE BRANDS. 5
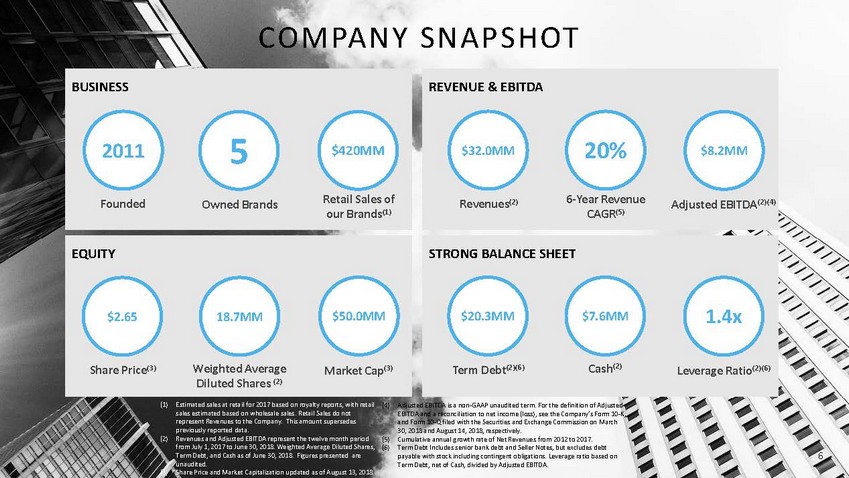
STRONG BALANCE SHEET EQUITY REVENUE & EBITDA 6 COMPANY SNAPSHOT BUSINESS Founded 5 Owned Brands $420MM Retail Sales of our Brands (1) $32.0MM Revenues (2) 6 - Year Revenue CAGR (5) $8.2MM Adjusted EBITDA (2)(4) 20% $20.3MM Term Debt (2)(6) Cash (2) 1.4x Leverage Ratio (2)(6) $7.6MM $2.65 Share Price (3) Weighted Average Diluted Shares (2) Market Cap (3) 18.7MM $50.0MM 2011 (1) Estimated sales at retail for 2017 based on royalty reports, with retail sales estimated based on wholesale sales. Retail Sales do not represent Revenues to the Company. This amount supersedes previously reported data. (2) Revenues and Adjusted EBITDA represent the twelve month period from July 1, 2017 to June 30, 2018. Weighted Average Diluted Shares, Term Debt, and Cash as of June 30, 2018. Figures presented are unaudited. (3) Share Price and Market Capitalization updated as of August 13, 2018 (4) Adjusted EBITDA is a non - GAAP unaudited term. For the definition of Adjusted EBITDA and a reconciliation to net income (loss), see the Company’s Form 10 - K, and Form 10 - Q filed with the Securities and Exchange Commission on March 30, 2018 and August 14, 2018, respectively. (5) Cumulative annual growth rate of Net Revenues from 2012 to 2017. (6) Term Debt Includes senior bank debt and Seller Notes, but excludes debt payable with stock including contingent obligations. Leverage ratio based on Term Debt, net of Cash, divided by Adjusted EBITDA.
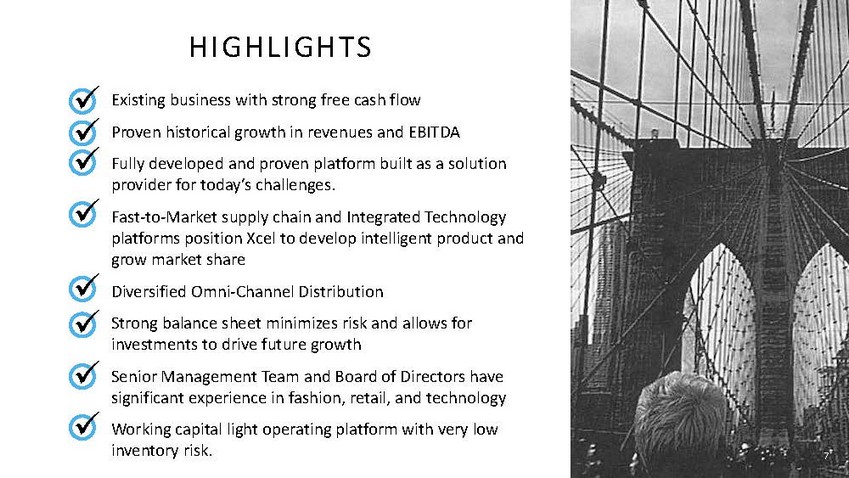
7 HIGHLIGHTS Existing business with strong free cash flow Proven historical growth in revenues and EBITDA Fully developed and proven platform built as a solution provider for today’s challenges. Fast - to - Market supply chain and Integrated Technology platforms position Xcel to develop intelligent product and grow market share Diversified Omni - Channel Distribution Strong balance sheet minimizes risk and allows for investments to drive future growth Senior Management Team and Board of Directors have significant experience in fashion, retail, and technology Working capital light operating platform with very low inventory risk. x x x x x x x x

STRATEGY 8
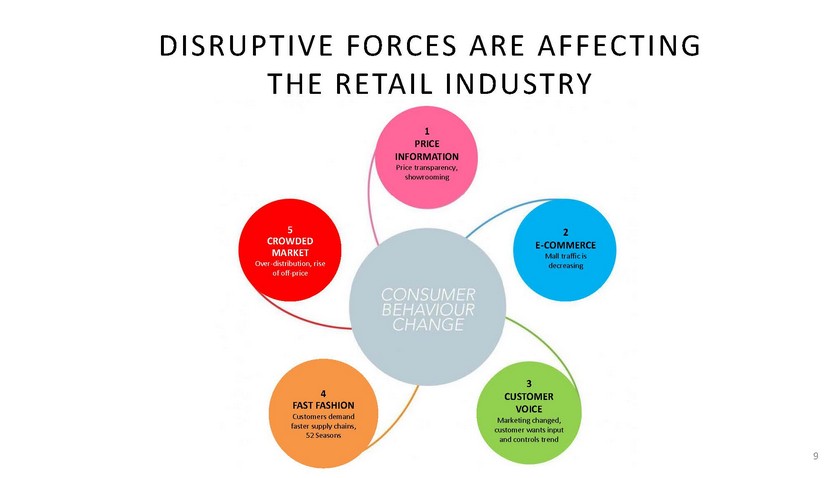
9 DISRUPTIVE FORCES ARE AFFECTING THE RETAIL INDUSTRY 5 CROWDED MARKET Over - distribution, rise of off - price 4 FAST FASHION Customers demand faster supply chains, 52 Seasons 3 CUSTOMER VOICE Marketing changed, customer wants input and controls trend 2 E - COMMERCE Mall traffic is decreasing 1 PRICE INFORMATI ON Price transparency, showrooming
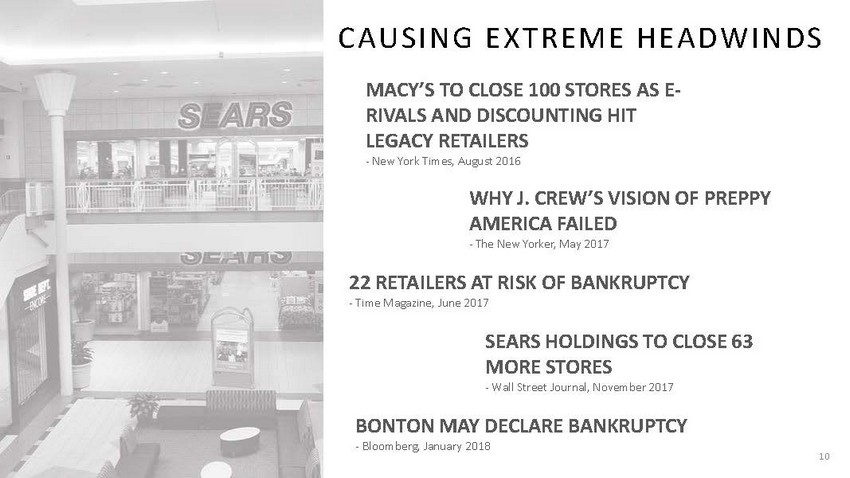
10 SEARS HOLDINGS TO CLOSE 63 MORE STORES - Wall Street Journal, November 2017 MACY’S TO CLOSE 100 STORES AS E - RIVALS AND DISCOUNTING HIT LEGACY RETAILERS - New York Times, August 2016 WHY J. CREW’S VISION OF PREPPY AMERICA FAILED - The New Yorker, May 2017 22 RETAILERS AT RISK OF BANKRUPTCY - Time Magazine, June 2017 BONTON MAY DECLARE BANKRUPTCY - Bloomberg, January 2018 CAUSING EXTREME HEADWINDS
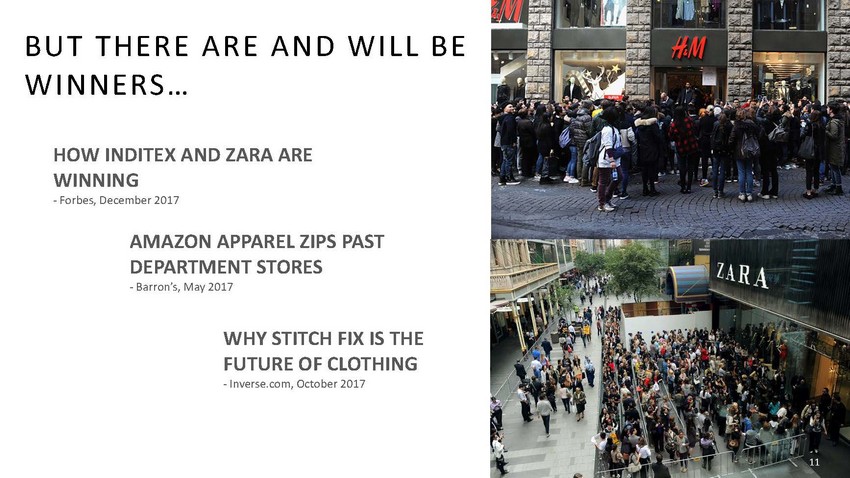
11 BUT THERE ARE AND WILL BE WINNERS… HOW INDITEX AND ZARA ARE WINNING - Forbes, December 2017 AMAZON APPAREL ZIPS PAST DEPARTMENT STORES - Barron’s, May 2017 WHY STITCH FIX IS THE FUTURE OF CLOTHING - Inverse.com, October 2017 11
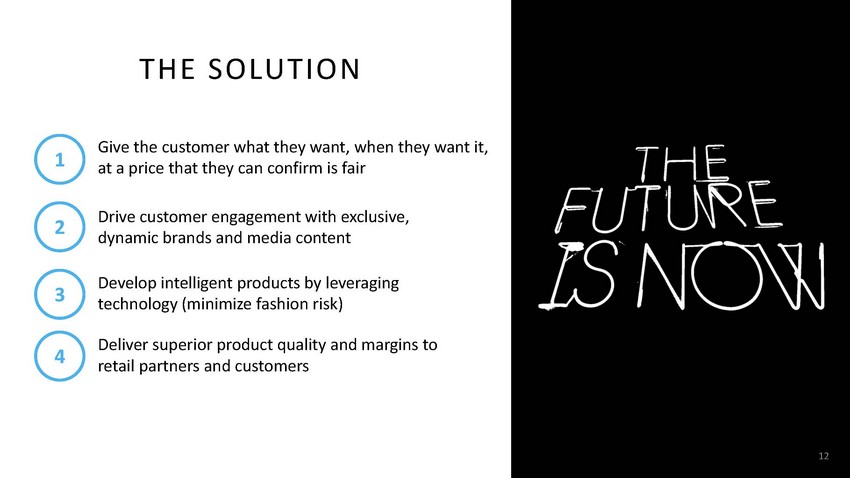
12 THE SOLUTION 1 Give the customer what they want, when they want it, at a price that they can confirm is fair 2 Drive customer engagement with exclusive, dynamic brands and media content 3 Develop intelligent products by leveraging technology (minimize fashion risk) 4 Deliver superior product quality and margins to retail partners and customers
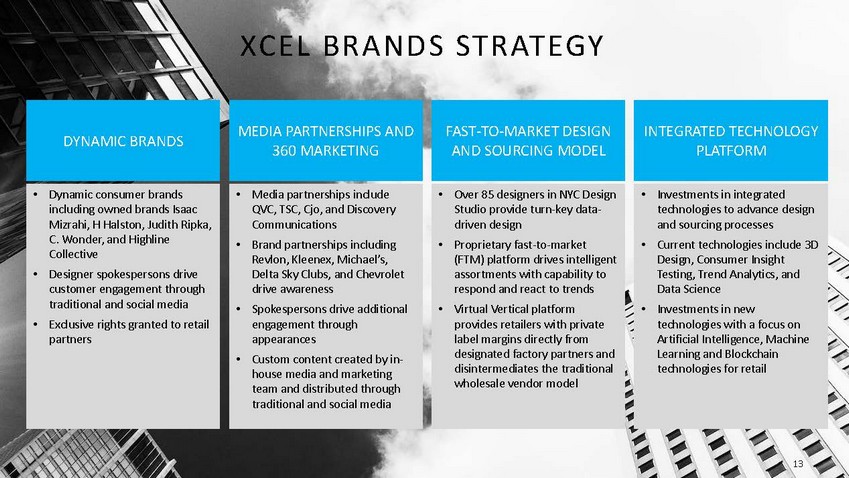
• Investments in integrated technologies to advance design and sourcing processes • Current technologies include 3D Design, Consumer Insight Testing, Trend Analytics, and Data Science • Investments in new technologies with a focus on Artificial Intelligence, Machine Learning and Blockchain technologies for retail 13 XCEL BRANDS STRATEGY DYNAMIC BRANDS MEDIA PARTNERSHIPS AND 360 MARKETING FAST - TO - MARKET DESIGN AND SOURCING MODEL INTEGRATED TECHNOLOGY PLATFORM • Dynamic consumer brands including owned brands Isaac Mizrahi, H Halston, Judith Ripka, C. Wonder, and Highline Collective • Designer spokespersons drive customer engagement through traditional and social media • Exclusive rights granted to retail partners • Media partnerships include QVC, TSC, Cjo , and Discovery Communications • Brand partnerships including Revlon, Kleenex, Michael’s, Delta Sky Clubs, and Chevrolet drive awareness • Spokespersons drive additional engagement through appearances • Custom content created by in - house media and marketing team and distributed through traditional and social media • Over 85 designers in NYC Design Studio provide turn - key data - driven design • Proprietary fast - to - market (FTM) platform drives intelligent assortments with capability to respond and react to trends • Virtual Vertical platform provides retailers with private label margins directly from designated factory partners and disintermediates the traditional wholesale vendor model

OUR BRANDS 14
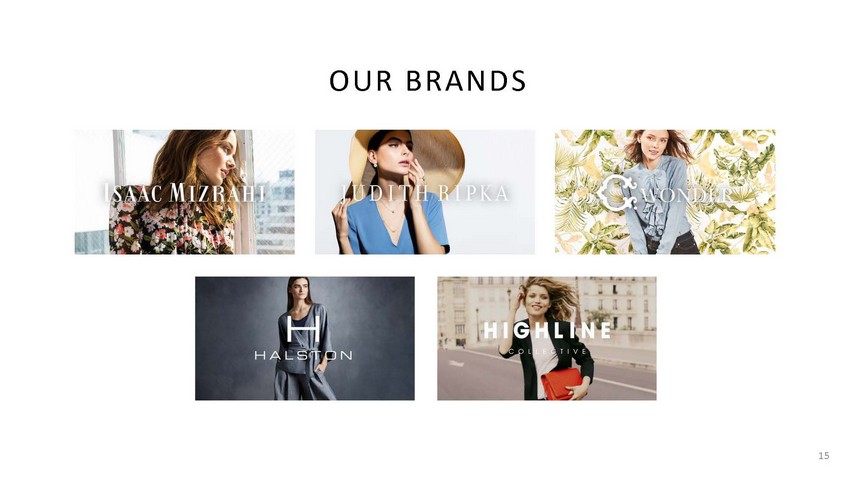
15 OUR BRANDS
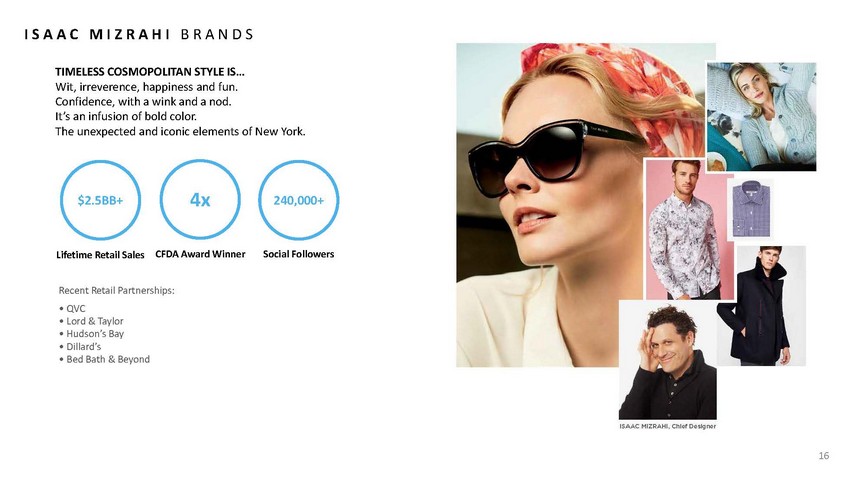
16 I S A A C M I Z R A H I B R A N D S TIMELESS COSMOPOLITAN STYLE IS… Wit, irreverence, happiness and fun. Confidence, with a wink and a nod. It’s an infusion of bold color. The unexpected and iconic elements of New York. $2.5BB+ Lifetime Retail Sales 4x CFDA Award Winner Social Followers 240,000+ Recent Retail Partnerships: • QVC • Lord & Taylor • Hudson’s Bay • Dillard’s • Bed Bath & Beyond
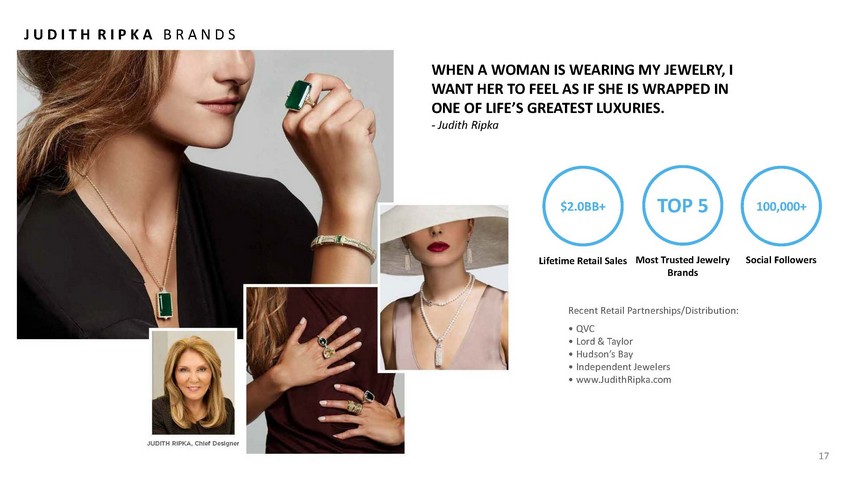
17 J U D I T H R I P K A B R A N D S $2.0BB+ Lifetime Retail Sales TOP 5 Most Trusted Jewelry Brands Social Followers 100,000+ WHEN A WOMAN IS WEARING MY JEWELRY, I WANT HER TO FEEL AS IF SHE IS WRAPPED IN ONE OF LIFE’S GREATEST LUXURIES. - Judith Ripka Recent Retail Partnerships/Distribution: • QVC • Lord & Taylor • Hudson’s Bay • Independent Jewelers • www.JudithRipka.com
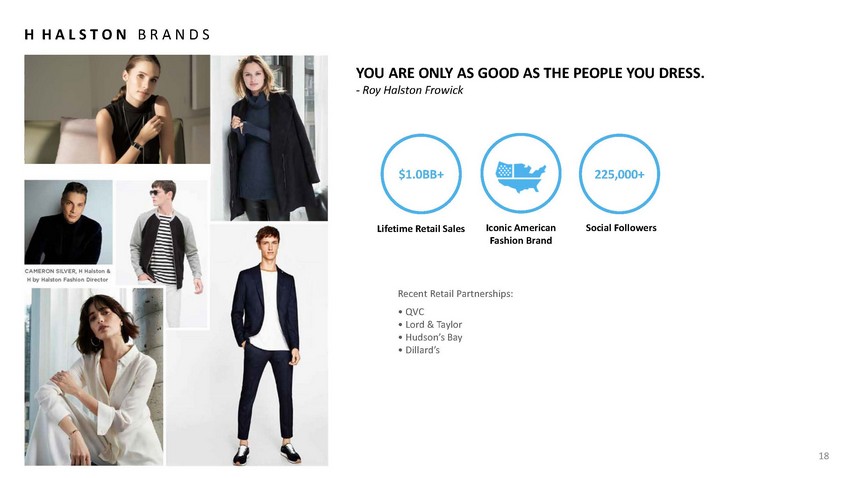
18 H H A L S T O N B R A N D S $1.0BB+ Lifetime Retail Sales Iconic American Fashion Brand Social Followers 225,000+ YOU ARE ONLY AS GOOD AS THE PEOPLE YOU DRESS. - Roy Halston Frowick Recent Retail Partnerships: • QVC • Lord & Taylor • Hudson’s Bay • Dillard’s
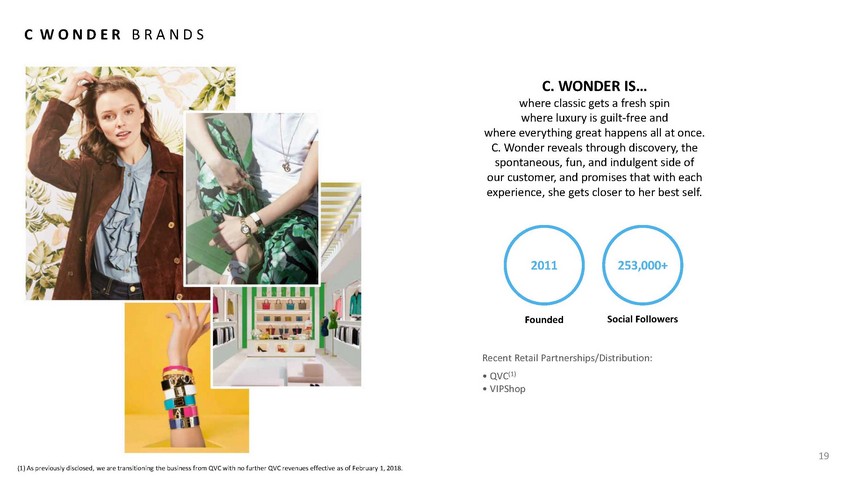
C. WONDER IS… where classic gets a fresh spin where luxury is guilt - free and where everything great happens all at once. C. Wonder reveals through discovery, the spontaneous, fun, and indulgent side of our customer, and promises that with each experience, she gets closer to her best self. 19 C W O N D E R B R A N D S 2011 Founded Social Followers 253,000+ Recent Retail Partnerships/Distribution: • QVC (1) • VIPShop (1) As previously disclosed, we are transitioning the business from QVC with no further QVC revenues effective as of February 1, 2018.
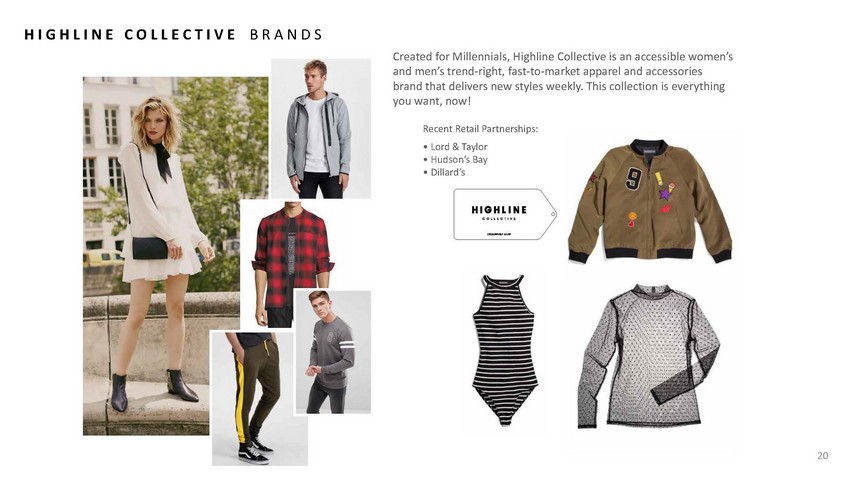
20 H I G H L I N E C O L L E C T I V E B R A N D S Created for Millennials, Highline Collective is an accessible women’s and men’s trend - right, fast - to - market apparel and accessories brand that delivers new styles weekly. This collection is everything you want, now! Recent Retail Partnerships: • Lord & Taylor • Hudson’s Bay • Dillard’s

PLATFORM 21
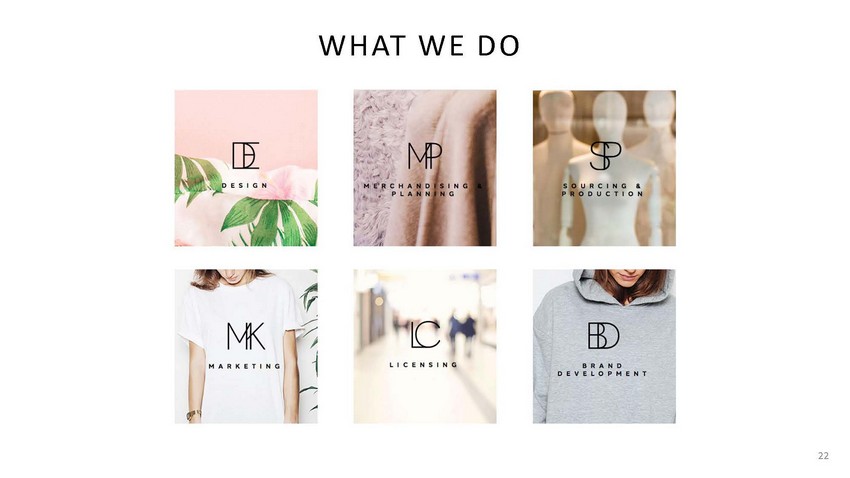
22 WHAT WE DO
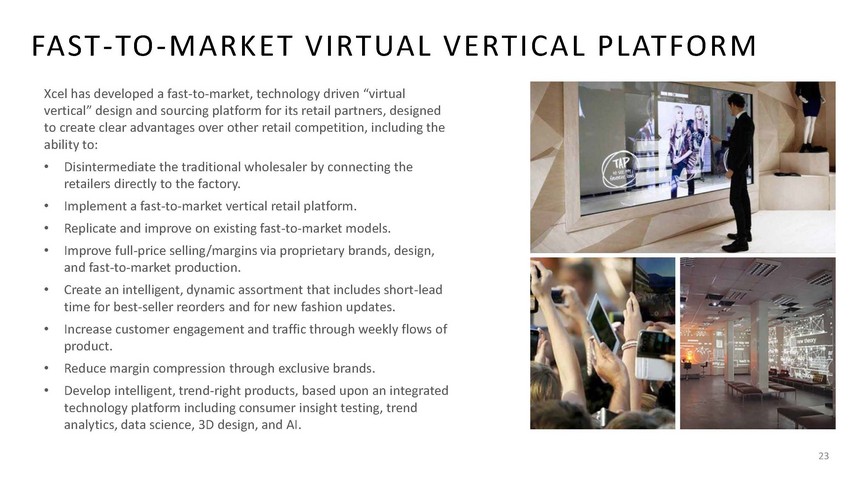
23 FAST - TO - MARKET VIRTUAL VERTICAL PLATFORM Xcel has developed a fast - to - market, technology driven “virtual vertical” design and sourcing platform for its retail partners, designed to create clear advantages over other retail competition, including the ability to: • Disintermediate the traditional wholesaler by connecting the retailers directly to the factory. • Implement a fast - to - market vertical retail platform. • Replicate and improve on existing fast - to - market models. • Improve full - price selling/margins via proprietary brands, design, and fast - to - market production. • Create an intelligent, dynamic assortment that includes short - lead time for best - seller reorders and for new fashion updates. • Increase customer engagement and traffic through weekly flows of product. • Reduce margin compression through exclusive brands. • Develop intelligent, trend - right products, based upon an integrated technology platform including consumer insight testing, trend analytics, data science, 3D design, and AI.
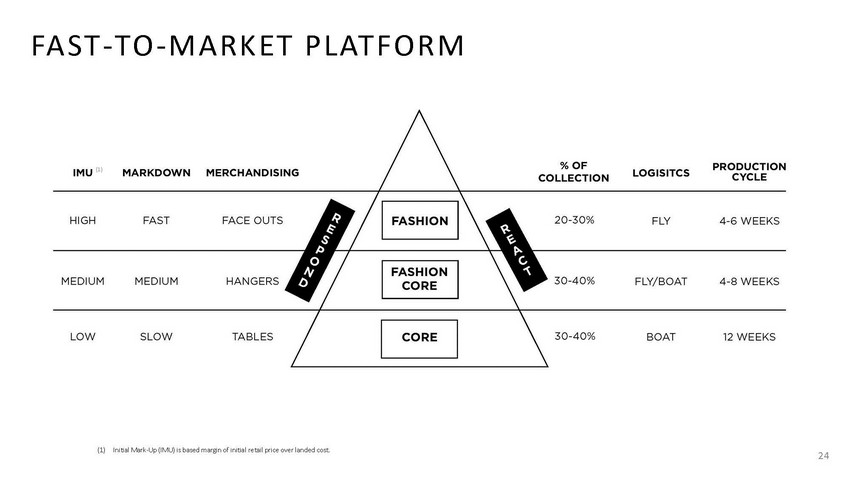
24 FAST - TO - MARKET PLATFORM (1) Initial Mark - Up (IMU) is based margin of initial retail price over landed cost. (1)
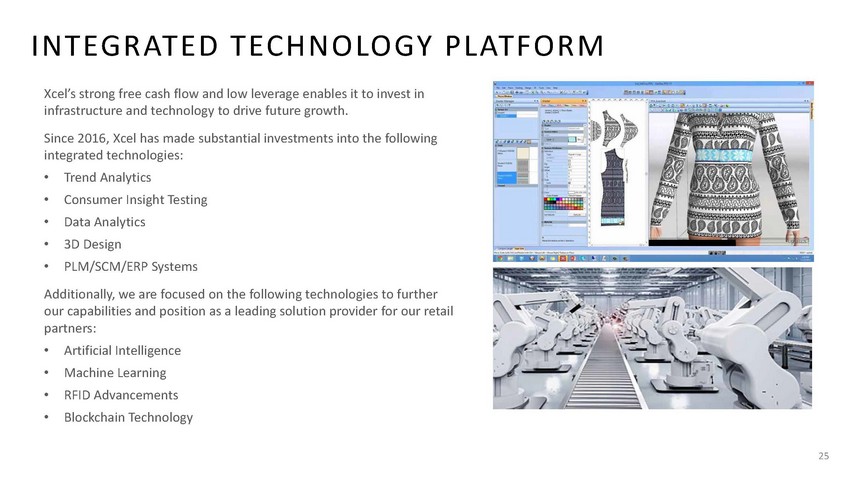
25 INTEGRATED TECHNOLOGY PLATFORM Xcel’s strong free cash flow and low leverage enables it to invest in infrastructure and technology to drive future growth. Since 2016, Xcel has made substantial investments into the following integrated technologies: • Trend Analytics • Consumer Insight Testing • Data Analytics • 3D Design • PLM/SCM/ERP Systems Additionally, we are focused on the following technologies to further our capabilities and position as a leading solution provider for our retail partners: • Artificial Intelligence • Machine Learning • RFID Advancements • Blockchain Technology

FINANCIAL OVERVIEW 26
27 WORKING CAPITAL LIGHT REVENUE MODEL • Xcel’s business model disintermediates the traditional wholesale vendor model • Xcel generates revenues through the following sources: - Royalties - Design & Sourcing Fees - Sales - Margin Participation - Marketing and other fees • By partnering with retailers and suppliers through its Virtual Vertical model, Xcel minimizes working capital requirements and inventory risk • This results in strong free cash flows which, coupled with conservative leverage, enables 27
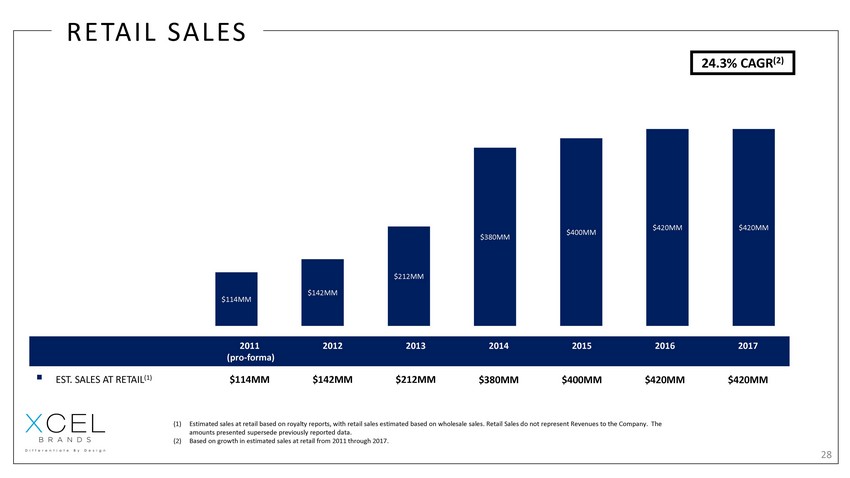
28 RETAIL SALES 2011 (pro - forma) 2012 2013 2014 2015 2016 2017 ▪ EST. SALES AT RETAIL (1) $114MM $142MM $212MM $380MM $400MM $420MM $420MM $450.0MM 24.3% CAGR (2) (1) Estimated sales at retail based on royalty reports, with retail sales estimated based on wholesale sales. Retail Sales do not re present Revenues to the Company. The amounts presented supersede previously reported data. (2) Based on growth in estimated sales at retail from 2011 through 2017. $114MM $142MM $212MM $380MM $400MM $420MM $420MM
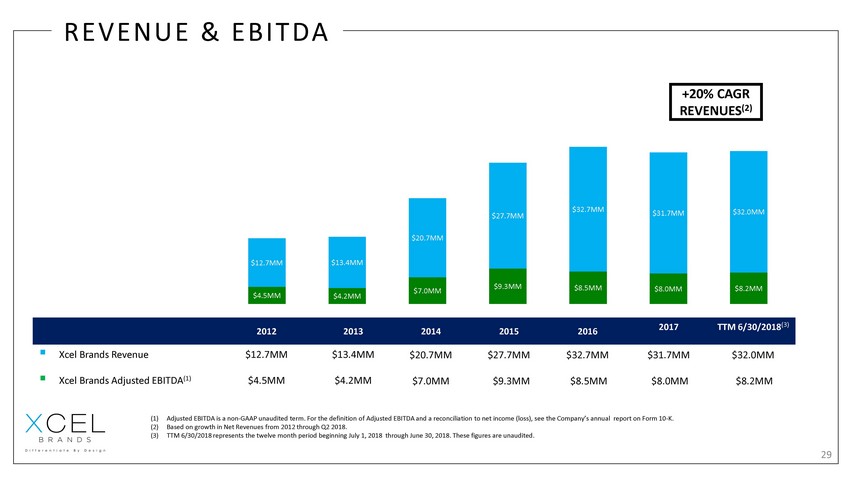
(1) Adjusted EBITDA is a non - GAAP unaudited term. For the definition of Adjusted EBITDA and a reconciliation to net income (loss), s ee the Company’s annual report on Form 10 - K. (2) Based on growth in Net Revenues from 2012 through Q2 2018. (3) TTM 6/30/2018 represents the twelve month period beginning July 1, 2018 through June 30, 2018. These figures are unaudited. 29 REVENUE & EBITDA $ 1.350B $450.0MM $32.6MM +20% CAGR REVENUE S (2) 2012 2013 2014 2015 2016 2017 TTM 6/30/2018 (3) ▪ Xcel Brands Revenue $12.7MM $13.4MM $20.7MM $27.7MM $32.7MM $31.7MM $32.0MM ▪ Xcel Brands Adjusted EBITDA (1) $4.5MM $4.2MM $7.0MM $9.3MM $8.5MM $8.0MM $8.2MM $450.0MM $420MM $420MM $4.5MM $4.2MM $7.0MM $9.3MM $8.5MM $8.0MM $8.2MM $12.7MM $13.4MM $20.7MM $27.7MM $32.7MM $31.7MM $32.0MM
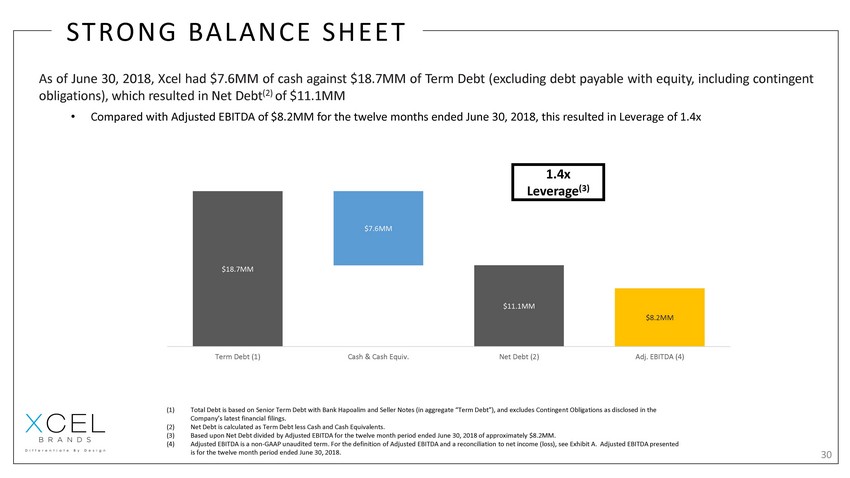
As of June 30 , 2018 , Xcel had $ 7 . 6 MM of cash against $ 18 . 7 MM of Term Debt (excluding debt payable with equity, including contingent obligations), which resulted in Net Debt ( 2 ) of $ 11 . 1 MM • Compared with Adjusted EBITDA of $ 8 . 2 MM for the twelve months ended June 30 , 2018 , this resulted in Leverage of 1 . 4 x 30 STRONG BALANCE SHEET $ 1.350B $450.0MM $32.6MM $420MM $420MM (1) Total Debt is based on Senior Term Debt with Bank Hapoalim and Seller Notes (in aggregate “Term Debt”), and excludes Continge nt Obligations as disclosed in the Company’s latest financial filings. (2) Net Debt is calculated as Term Debt less Cash and Cash Equivalents. (3) Based upon Net Debt divided by Adjusted EBITDA for the twelve month period ended June 30, 2018 of approximately $8.2MM. (4) Adjusted EBITDA is a non - GAAP unaudited term. For the definition of Adjusted EBITDA and a reconciliation to net income (loss), s ee Exhibit A. Adjusted EBITDA presented is for the twelve month period ended June 30, 2018. (1) (2) 1.4x Leverage (3 ) (3)(4) $18.7MM $11.1MM $8.2MM $7.6MM $10.2MM Term Debt (1) Cash & Cash Equiv. Net Debt (2) Adj. EBITDA (4)

GROWTH 31
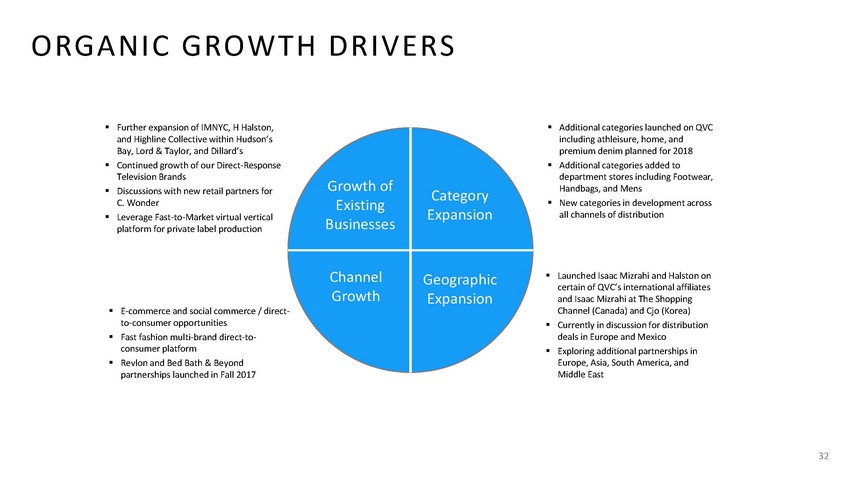
32 ORGANIC GROWTH DRIVERS Growth of Existing Businesses Category Expansion Geographic Expansion Channel Growth ▪ Further expansion of IMNYC, H Halston, and Highline Collective within Hudson’s Bay, Lord & Taylor, and Dillard’s ▪ Continued growth of our Direct - Response Television Brands ▪ Discussions with new retail partners for C. Wonder ▪ Leverage Fast - to - Market virtual vertical platform for private label production ▪ E - commerce and social commerce / direct - to - consumer opportunities ▪ Fast fashion multi - brand direct - to - consumer platform ▪ Revlon and Bed Bath & Beyond partnerships launched in Fall 2017 ▪ Additional categories launched on QVC including athleisure, home, and premium denim planned for 2018 ▪ Additional categories added to department stores including Footwear, Handbags, and Mens ▪ New categories in development across all channels of distribution ▪ Launched Isaac Mizrahi and Halston on certain of QVC’s international affiliates and Isaac Mizrahi at The Shopping Channel (Canada) and Cjo (Korea) ▪ Currently in discussion for distribution deals in Europe and Mexico ▪ Exploring additional partnerships in Europe, Asia, South America, and Middle East
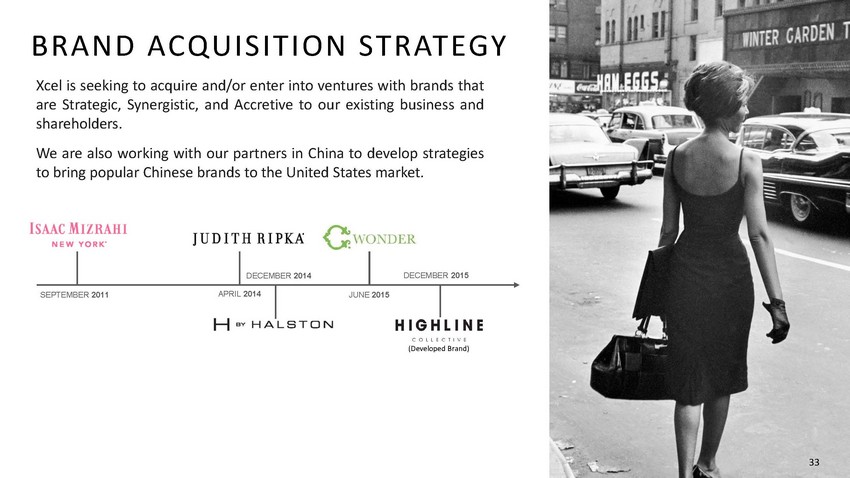
33 BRAND ACQUISITION STRATEGY Xcel is seeking to acquire and/or enter into ventures with brands that are Strategic, Synergistic, and Accretive to our existing business and shareholders . We are also working with our partners in China to develop strategies to bring popular Chinese brands to the United States market . SEPTEMBER 2011 APRIL 2014 DECEMBER 2014 JUNE 2015 DECEMBER 2015 (Developed Brand) 33
34 KEY DRIVERS FOR 2018 - 2020 • Continued growth of existing QVC and Department Store Businesses • Launch and growth of key ancillary categories (denim, footwear, handbags, mens ) • Private Label production through Fast - to - Market Platform • Selectively leverage Fast - to - Market Platform across new brands and retailers • International expansion through licensees and distributors

SUMMARY 35
SUMMARY • Developing innovative solutions to address the changes in our industry. Xcel gives our customers what they want, when they want it, at a price they can confirm as fair. • Dynamic, iconic brands engage customers through media and Ubiquitous - Channel distribution. • Working capital light business model. Xcel provides 360˚ of retail support: design, sourcing, marketing and technology. Our platform is highly scalable. • Proven track record of growth in revenues, EBITDA and net income, and a strong and stable balance sheet. • Well - positioned to continue to grow through organic growth of existing brands, and acquisitions and development of new brands. 36 WWW.XCELBRANDS.COM

NASDAQ: XELB WWW.XCELBRANDS.COM
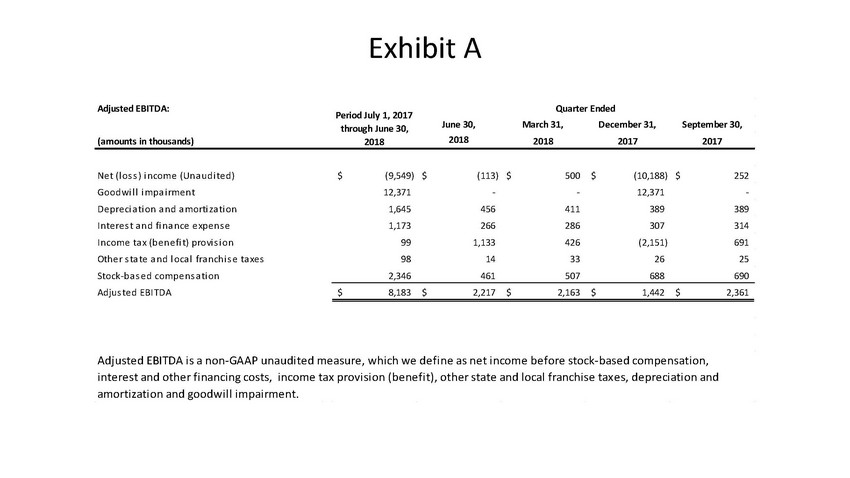
Exhibit A Adjusted EBITDA: June 30, March 31, December 31, September 30, (amounts in thousands) 2018 2018 2017 2017 Net (loss) income (Unaudited) (9,549)$ (113)$ 500$ (10,188)$ 252$ Goodwill impairment 12,371 - - 12,371 - Depreciation and amortization 1,645 456 411 389 389 Interest and finance expense 1,173 266 286 307 314 Income tax (benefit) provision 99 1,133 426 (2,151) 691 Other state and local franchise taxes 98 14 33 26 25 Stock-based compensation 2,346 461 507 688 690 Adjusted EBITDA 8,183$ 2,217$ 2,163$ 1,442$ 2,361$ Period July 1, 2017 through June 30, 2018 Quarter Ended Adjusted EBITDA is a non-GAAP unaudited measure, which we define as net income before stock-based compensation, interest and other financing costs, income tax provision (benefit), other state and local franchise taxes, depreciation and amortization and goodwill impairment.