Attached files
| file | filename |
|---|---|
| EX-99.1 - EXHIBIT 99.1 - Griffin Realty Trust, Inc. | gcearii-06302018earningsre.htm |
| 8-K - 8-K - Griffin Realty Trust, Inc. | gcear2form8-k2q2018earning.htm |

SUMMARY OF EARNINGS RESULTS Second Quarter 2018 We intend to invest in properties leased to blue chip tenants and/or companies with investment grade credit ratings. There is no guarantee all of our properties will be leased to blue chip tenants or companies with investment grade credit ratings. Blue chip companies are well-known and respected publicly traded companies that typically make up the Dow Jones or S&P 500 Index group of companies. Blue chip and investment grade descriptions are those of either tenants and/or guarantors with investment grade credit ratings or whose non-guarantor parent companies have investment grade credit ratings or, in management's belief, equivalent ratings. THIS IS NEITHER AN OFFER TO SELL NOR A SOLICITATION OF AN OFFER TO BUY THE SECURITIES DESCRIBED HEREIN. AN OFFERING IS MADE ONLY BY THE PROSPECTUS. THIS MATERIAL MUST BE READ IN CONJUNCTION WITH THE PROSPECTUS IN ORDER TO UNDERSTAND FULLY ALL OF THE IMPLICATIONS AND RISKS OF THE OFFERING OF SECURITIES TO WHICH IT RELATES. A COPY OF THE PROSPECTUS MUST BE MADE AVAILABLE TO YOU IN CONNECTION WITH THIS OFFERING. NO OFFERING IS MADE TO NEW YORK RESIDENTS EXCEPT BY A PROSPECTUS FILED WITH THE DEPARTMENT OF LAW OF THE STATE OF NEW YORK. NEITHER THE SECURITIES AND EXCHANGE COMMISSION, THE ATTORNEY GENERAL OF THE STATE OF NEW YORK NOR ANY OTHER STATE SECURITIES REGULATOR HAS APPROVED OR DISAPPROVED OF THESE SECURITIES OR DETERMINED IF THE PROSPECTUS IS TRUTHFUL OR COMPLETE. ANY REPRESENTATION TO THE CONTRARY IS A CRIMINAL OFFENSE. AN INVESTMENT IN GRIFFIN 2Q’2017CAPITAL ESSENTIAL EARNINGS ASSET REIT CALL II, INC. PRESENTATION INVOLVES A HIGH DEGREE OF RISK AND THERE CAN BE NO ASSURANCE THAT THE INVESTMENT OBJECTIVES OF THISFOR PROGRAM FINANCIAL WILL BE ADVISORATTAINED. USE ONLY. NOT FOR INVESTOR USE. |
Conference Call Agenda TOPIC SPEAKER Introduction and Portfolio Characteristics Michael Escalante | President & Director Portfolio Update Michael Escalante | President & Director Financial Performance Review Javier Bitar | Chief Financial Officer Questions & Answers Michael Escalante and Javier Bitar GRIFFIN CAPITAL 2

Portfolio Characteristics June 30, 2018 December 31, 2017 Total Capitalization (1) $1.3 billion $1.2 billion Total Acquisition Value $1.1 billion $1.1 billion Number of Properties 27 27 Number of Buildings 35 35 Size of Portfolio (square feet) 7.3 million 7.3 million Occupied/Leased (based on portfolio square feet) 100% 100% Percentage of Cash Flow from Investment Grade Tenants (2) 75.6% 82.7% Weighted Average Remaining Lease Term (Years) 9.8 10.3 Weighted Average Remaining Loan Maturity (Years) (3)(4) 8.1 3.5 Current Weighted Average Debt Rate (4)(5) 3.81% 3.13% (1) Total capitalization includes the outstanding debt balance (excluding deferred financing costs and premium/discounts), plus total equity raised and issued, including limited partnership units issued by Griffin Capital Essential Asset Operating Partnership II, L.P. and shares issued pursuant to the DRP, net of redemptions. (2) Investment grade designations are those of either tenants, non-guarantor parents and/or guarantors with investment grade or what management believes are generally equivalent ratings. The decrease in investment grade tenants is related to Wyndham becoming a sub-investment grade tenant during 2018, which contributes approximately 6.9% of NOI. (3) The weighted average remaining loan maturities for the Company's fixed-rate and variable-rate debt are 9.00 and 4.99 years, respectively. Including the effect of interest rate swaps, the weighted average remaining loan maturities for the Company's fixed-rate and variable-rate debt are 8.16 and 4.99 years, respectively. (4) The increase in the weighted average remaining loan maturity and current weighted average debt rate is a result of the BofA/KeyBank loan executed on April 27, 2018 and the amended and restated credit agreement executed on June 28, 2018. (5) The current weighted average debt rate includes the effect of one interest rate swap with a total notional amount of $100.0 million and excludes the effect of deferred financing costs. GRIFFIN CAPITAL 4
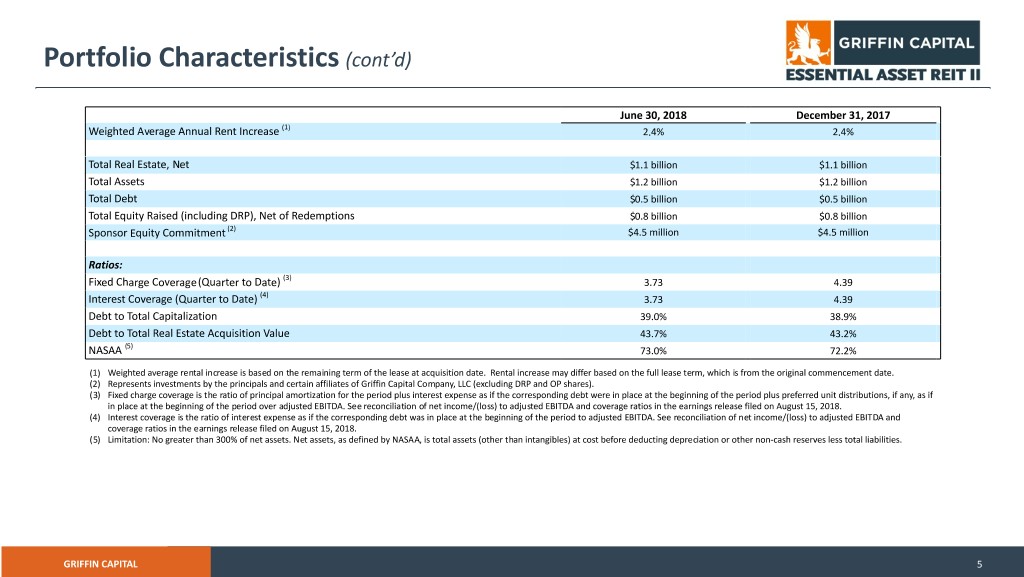
Portfolio Characteristics (cont’d) June 30, 2018 December 31, 2017 Weighted Average Annual Rent Increase (1) 2.4% 2.4% Total Real Estate, Net $1.1 billion $1.1 billion Total Assets $1.2 billion $1.2 billion Total Debt $0.5 billion $0.5 billion Total Equity Raised (including DRP), Net of Redemptions $0.8 billion $0.8 billion Sponsor Equity Commitment (2) $4.5 million $4.5 million Ratios: Fixed Charge Coverage (Quarter to Date) (3) 3.73 4.39 Interest Coverage (Quarter to Date) (4) 3.73 4.39 Debt to Total Capitalization 39.0% 38.9% Debt to Total Real Estate Acquisition Value 43.7% 43.2% NASAA (5) 73.0% 72.2% (1) Weighted average rental increase is based on the remaining term of the lease at acquisition date. Rental increase may differ based on the full lease term, which is from the original commencement date. (2) Represents investments by the principals and certain affiliates of Griffin Capital Company, LLC (excluding DRP and OP shares). (3) Fixed charge coverage is the ratio of principal amortization for the period plus interest expense as if the corresponding debt were in place at the beginning of the period plus preferred unit distributions, if any, as if in place at the beginning of the period over adjusted EBITDA. See reconciliation of net income/(loss) to adjusted EBITDA and coverage ratios in the earnings release filed on August 15, 2018. (4) Interest coverage is the ratio of interest expense as if the corresponding debt was in place at the beginning of the period to adjusted EBITDA. See reconciliation of net income/(loss) to adjusted EBITDA and coverage ratios in the earnings release filed on August 15, 2018. (5) Limitation: No greater than 300% of net assets. Net assets, as defined by NASAA, is total assets (other than intangibles) at cost before deducting depreciation or other non-cash reserves less total liabilities. GRIFFIN CAPITAL 5

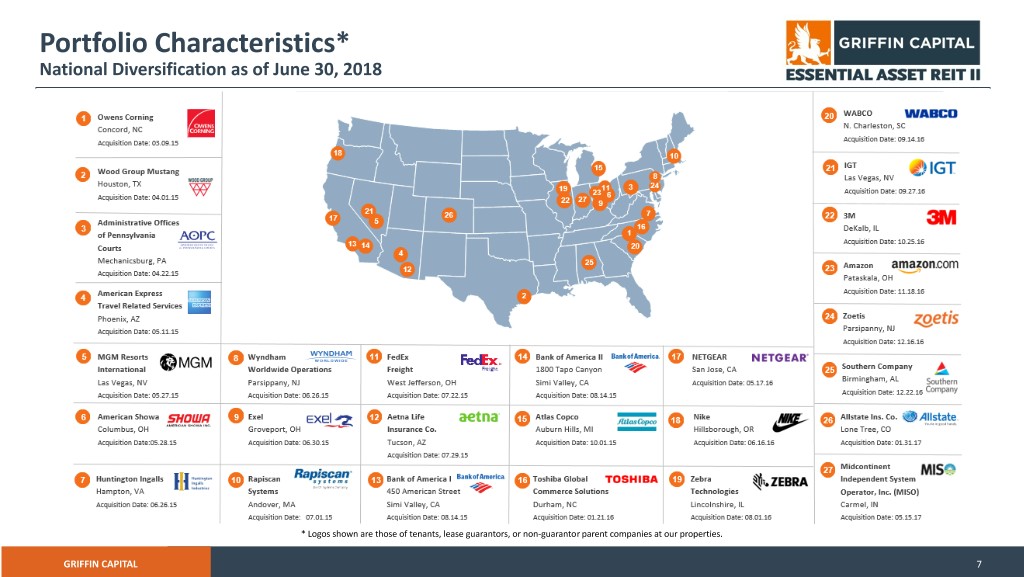
Portfolio Characteristics* National Diversification as of June 30, 2018 18 21 5 13 14 4 12 8 17 6 18 7 13 16 19 *Logos shown are those of tenants, lease guarantors, or non-guarantor parent companies at our properties. * Logos shown are those of tenants, lease guarantors, or non-guarantor parent companies at our properties. GRIFFIN CAPITAL 7

Portfolio Concentration As of June 30, 2018 Consumer Services: 16.6% Tenant Business Diversity (2) Griffin Capital management makes a All Others: 4.8% conscious effort to achieve diversification by tenant industry as Pharmaceuticals, Biotechnology Griffin Capital Essential Asset REIT II’s & Life Sciences: 3.7% Utilities: 13.4% portfolio grows. As of June 30, 2018, our analysis segmented Griffin Capital Essential Asset REIT II’s portfolio into 14 Transportation: 4.0% industry groups(1), the largest of which, Consumer Services, accounted for approximately 16.6% of net rental Consumer Durables and revenue. Apparel: 4.2% Energy: 5.3% Capital Goods: 13.3% Banks: 7.2% Technology Hardware & Equipment: 12.5% Retailing: 7.4% (1) Based on the 2016 Global Industry Classification Standard (GICS). (2) Consists of revenue concentration by industry less than 3% as follows: Diversified Financials: 7.6% Health Care Equipment & Services (2.1%), Automobiles & Components (1.4%) and Insurance (1.3%). GRIFFIN CAPITAL 8

Portfolio Concentration As of June 30, 2018 GEOGRAPHIC DISTRIBUTION ASSET ALLOCATION (By % of Net Rent) (By % of Net Rent) Ohio: 12.8% Office: 76.6% (2) All Others: 11.6% Illinois: 11.3% North Carolina: 3.5% Oregon: 4.2% California: 11.2% Texas: 5.3% Alabama: 10.9% (1) Nevada: 8.9% Arizona: 9.7% New Jersey: 10.6% Industrial: 23.4% (1) Includes escrow proceeds of approximately $0.6 million to be received during the 12-month period subsequent to June 30, 2018. (2) All others represent 3.5% or less of total net rent on an individual basis. GRIFFIN CAPITAL 9
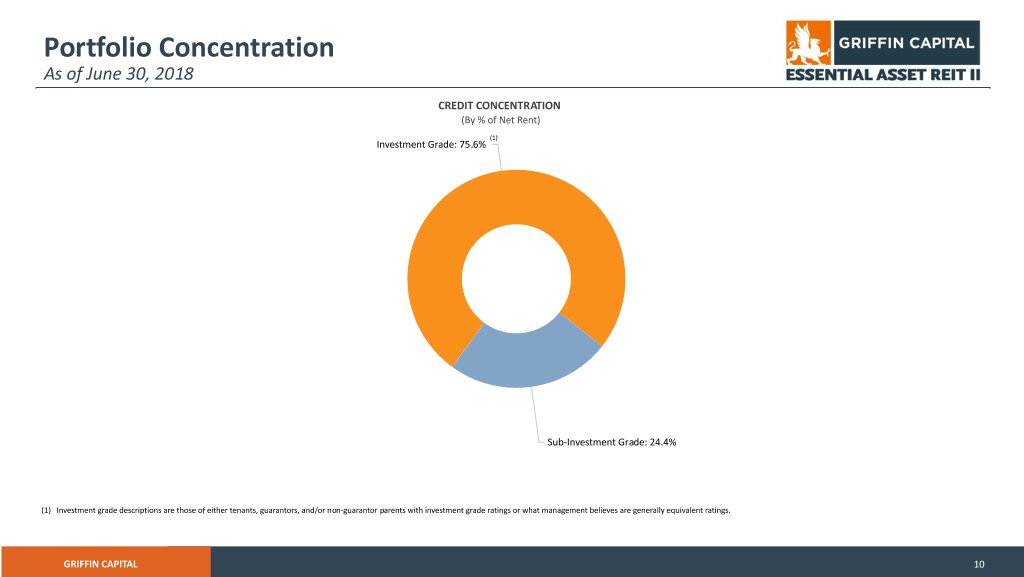
Portfolio Concentration As of June 30, 2018 CREDIT CONCENTRATION (By % of Net Rent) (1) Investment Grade: 75.6% Sub-Investment Grade: 24.4% (1) Investment grade descriptions are those of either tenants, guarantors, and/or non-guarantor parents with investment grade ratings or what management believes are generally equivalent ratings. GRIFFIN CAPITAL 10

Strong Tenant Profile - Top 10 Tenants As of June 30, 2018 Top Tenants % of Portfolio(1) S&P(2) 10.9% A- 7.6% A2(3) 7.4% AA- (4) 7.2% A+(5) 6.9% BB+(6) 6.1% BB+ 5.8% AA- (1) Based on net rental payment. (2) Ratings are those of tenants, guarantors, or non-guarantor 5.5% BB parent entities. (3) Represents Moody’s rating. (7) (4) Represents net rental revenue 5.3% IG7 on the two Bank of America properties. (5) Represents Fitch Rating. (6) Represents Eagan-Jones Rating. 4.2% AA- (7) Represents Bloomberg rating. TOTAL 66.9% GRIFFIN CAPITAL 11

Net Asset Value As of June 30, 2018 Set forth below are the components of our daily NAV as of June 30, 2018 and March 31, 2018 calculated in accordance with our valuation procedures (in thousands, except share and per share amounts)(1): As of June 30, 2018 As of March 31, 2018 Gross Real Estate Asset Value $ 1,219,280 $ 1,212,376 Other Assets, net 18,252 14,524 Mortgage Debt (490,055) (484,728) NAV $ 747,477 $ 742,172 Total Shares Outstanding 77,783,486 77,515,548 NAV per share(2) $ 9.61 $ 9.57 (1) For additional detail on assumptions used and risk factors associated with our daily NAV, see our Form 10-K filed on March 9, 2018 and our Form 10-Q filed on August 10, 2018. (2) Our NAV per share as of June 30, 2018 was as follows: $9.66 for Class T, $9.65 for Class S, $9.64 for Classes D and I, and $9.61 for each of Classes A, AA, and AAA. Our NAV per share as of March 31, 2018 for each share class was as follows: $9.61 for Class T, $9.60 for Classes S and I, $9.59 for Class D, and $9.57 for each of Classes A, AA, and AAA. Each class of shares may have a different NAV per share because certain expenses and fees differ with respect to each share class. GRIFFIN CAPITAL 12

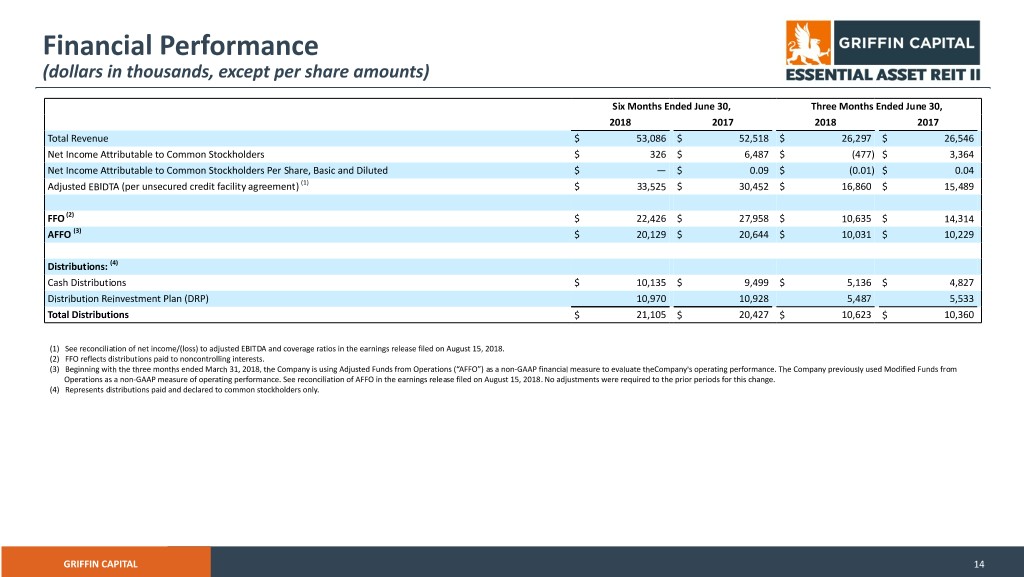
Financial Performance (dollars in thousands, except per share amounts) Six Months Ended June 30, Three Months Ended June 30, 2018 2017 2018 2017 Total Revenue $ 53,086 $ 52,518 $ 26,297 $ 26,546 Net Income Attributable to Common Stockholders $ 326 $ 6,487 $ (477) $ 3,364 Net Income Attributable to Common Stockholders Per Share, Basic and Diluted $ — $ 0.09 $ (0.01) $ 0.04 Adjusted EBIDTA (per unsecured credit facility agreement) (1) $ 33,525 $ 30,452 $ 16,860 $ 15,489 FFO (2) $ 22,426 $ 27,958 $ 10,635 $ 14,314 AFFO (3) $ 20,129 $ 20,644 $ 10,031 $ 10,229 Distributions: (4) Cash Distributions $ 10,135 $ 9,499 $ 5,136 $ 4,827 Distribution Reinvestment Plan (DRP) 10,970 10,928 5,487 5,533 Total Distributions $ 21,105 $ 20,427 $ 10,623 $ 10,360 (1) See reconciliation of net income/(loss) to adjusted EBITDA and coverage ratios in the earnings release filed on August 15, 2018. (2) FFO reflects distributions paid to noncontrolling interests. (3) Beginning with the three months ended March 31, 2018, the Company is using Adjusted Funds from Operations (“AFFO”) as a non-GAAP financial measure to evaluate theCompany's operating performance. The Company previously used Modified Funds from Operations as a non-GAAP measure of operating performance. See reconciliation of AFFO in the earnings release filed on August 15, 2018. No adjustments were required to the prior periods for this change. (4) Represents distributions paid and declared to common stockholders only. GRIFFIN CAPITAL 14
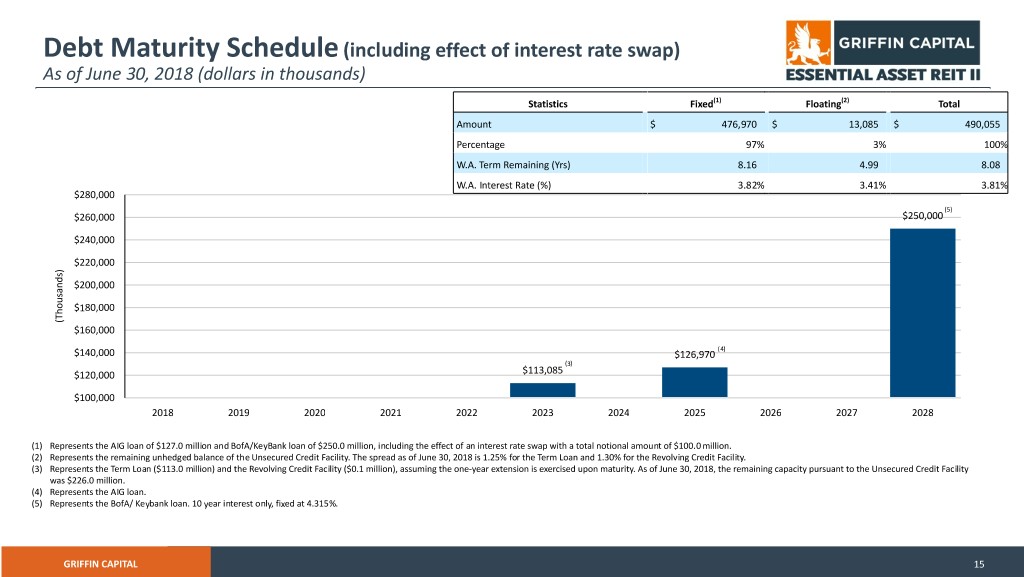
Debt Maturity Schedule (including effect of interest rate swap) As of June 30, 2018 (dollars in thousands) Statistics Fixed(1) Floating(2) Total Amount $ 476,970 $ 13,085 $ 490,055 Percentage 97% 3% 100% W.A. Term Remaining (Yrs) 8.16 4.99 8.08 W.A. Interest Rate (%) 3.82% 3.41% 3.81% $280,000 (5) $260,000 $250,000 $240,000 $220,000 ) s d n $200,000 a s u o $180,000 h T ( $160,000 (4) $140,000 $126,970 (3) $120,000 $113,085 $100,000 2018 2019 2020 2021 2022 2023 2024 2025 2026 2027 2028 (1) Represents the AIG loan of $127.0 million and BofA/KeyBank loan of $250.0 million, including the effect of an interest rate swap with a total notional amount of $100.0 million. (2) Represents the remaining unhedged balance of the Unsecured Credit Facility. The spread as of June 30, 2018 is 1.25% for the Term Loan and 1.30% for the Revolving Credit Facility. (3) Represents the Term Loan ($113.0 million) and the Revolving Credit Facility ($0.1 million), assuming the one-year extension is exercised upon maturity. As of June 30, 2018, the remaining capacity pursuant to the Unsecured Credit Facility was $226.0 million. (4) Represents the AIG loan. (5) Represents the BofA/ Keybank loan. 10 year interest only, fixed at 4.315%. GRIFFIN CAPITAL 15

Financing Activities Quarter Ended June 30, 2018 CMBS loan Closing date: April 27, 2018 Banks: Bank of America and KeyBank, NA Amount/Outstanding: $250.0 million Maturity date: May 1, 2028 Stated interest rate: 4.315% Payments: Monthly/Interest only Secured properties: Southern Company/IGT/Amazon/3M Amended and restated unsecured credit facility Closing date: June 28, 2018 Co-lead banks: KeyBank, NA/Merrill Lynch, Pierce, Fenner and Smith, Inc./Capital One/SunTrust Robinson Humphrey, Inc./U.S. Bank National Association/Wells Fargo Securities, LLC Amount/Outstanding: $113.1 million Initial Commitment: Revolver: $550.0 million/ Term: $200.0 million Maturity date: June 28, 2023 (assuming 1-year extension option is exercised for Revolver) Stated interest rate: (1) for Eurodollar Borrowings, the Adjusted LIBO Rate plus a margin ranging from 1.25 percent to 2.20 percent based on the Company’s consolidated leverage ratio or (2) for Alternate Base Rate Borrowings, the greater of KeyBank, NA’s prime rate or the Federal Funds Effective Rate plus 0.50 percent, plus a margin ranging from 0.25 percent to 1.20 percent based on the Company's consolidated leverage ratio (each term as defined in the amended and restated credit agreement) Payments: Quarterly/Interest only GRIFFIN CAPITAL 16


