Attached files
| file | filename |
|---|---|
| EX-99.3 - EXHIBIT 99.3 - TerraForm Power NY Holdings, Inc. | s002395x1_ex99-3.htm |
| EX-99.1 - EXHIBIT 99.1 - TerraForm Power NY Holdings, Inc. | s002395x1_ex99-1.htm |
| 8-K - FORM 8-K - TerraForm Power NY Holdings, Inc. | s002395x1_8k.htm |
Exhibit 99.2

TERRAFORM POWER Q2 2018 Supplemental Three Months Ended June 30, 2018 Information

CAUTIONARY STATEMENT REGARDING FORWARD-LOOKING STATEMENTS This Supplemental Information contains forward-looking statements within the meaning of Section 27A of the Securities Act of 1933, as amended (the “Securities Act”) and Section 21E of the Securities Exchange Act of 1934, as amended (the “Exchange Act”). Forward-looking statements can be identified by the fact that they do not relate strictly to historical or current facts. These statements involve estimates, expectations, projections, goals, assumptions, known and unknown risks, and uncertainties and typically include words or variations of words such as “expect,” “anticipate,” “believe,” “intend,” “plan,” “seek,” “estimate,” “predict,” “project,” “opportunities,” “goal,” “guidance,” “outlook,” “initiatives,” “objective,” “forecast,” “target,” “potential,” “continue,” “would,” “will,” “should,” “could,” or “may” or other comparable terms and phrases. All statements that address operating performance, events, or developments that the Company expects or anticipates will occur in the future are forward-looking statements. They may include estimates of expected cash available for distribution, dividend growth, cost savings initiatives, earnings, revenues, income, loss, capital expenditures, liquidity, capital structure, future growth, financing arrangements and other financial performance items (including future dividends per share), descriptions of management’s plans or objectives for future operations, products, or services, or descriptions of assumptions underlying any of the above. Forward-looking statements provide the Company’s current expectations or predictions of future conditions, events, or results and speak only as of the date they are made. Although the Company believes its expectations and assumptions are reasonable, it can give no assurance that these expectations and assumptions will prove to have been correct and actual results may vary materially.Important factors that could cause actual results to differ materially from our expectations, or cautionary statements, are listed below and further disclosed in our most recent Annual Report on Form 10-K and any subsequent quarterly report on Form 10-Q. Risk Factors: risks related to the transition to Brookfield Asset Management Inc. sponsorship, including our ability to realize the expected benefits of the sponsorship; risks related to wind conditions at our wind assets or to weather conditions at our solar assets; risks related to the effectiveness of our internal control over financial reporting; pending and future litigation; the willingness and ability of counterparties to fulfill their obligations under offtake agreements; price fluctuations, termination provisions and buyout provisions in offtake agreements; our ability to enter into contracts to sell power on acceptable prices and terms, including as our offtake agreements expire; our ability to compete against traditional and renewable energy companies; government regulation, including compliance with regulatory and permit requirements and changes in tax laws, market rules, rates, tariffs, environmental laws and policies affecting renewable energy; the condition of the debt and equity capital markets and our ability to borrow additional funds and access capital markets, as well as our substantial indebtedness and the possibility that we may incur additional indebtedness in the future; operating and financial restrictions placed on us and our subsidiaries related to agreements governing indebtedness; risks related to our ability to successfully integrate the operations, technologies and personnel of Saeta Yield, S.A.U.; the regulated rate of return of renewable energy facilities in Spain, including Saeta’s wind and solar assets, a reduction of which could have a material negative impact on our results of operations; our ability to successfully identify, evaluate and consummate acquisitions; and our ability to integrate the projects we acquire from third parties, including Saeta, or otherwise and our ability to realize the anticipated benefits from such acquisitions.The Company disclaims any obligation to publicly update or revise any forward-looking statement to reflect changes in underlying assumptions, factors, or expectations, new information, data, or methods, future events, or other changes, except as required by law. The foregoing list of factors that might cause results to differ materially from those contemplated in the forward-looking statements should be considered in connection with information regarding risks and uncertainties, which are described in our most recent Annual Report on Form 10-K and any subsequent Quarterly Report on Form 10-Q, as well as additional factors we may describe from time to time in other filings with the Securities and Exchange Commission (the “SEC”). We operate in a competitive and rapidly changing environment. New risks and uncertainties emerge from time to time, and you should understand that it is not possible to predict or identify all such factors and, consequently, you should not consider any such list to be a complete set of all potential risks or uncertaintiesThis Supplemental Information contains references to Adjusted Revenue, Adjusted EBITDA and CAFD which are non-GAAP measures that should not be viewed as alternatives to GAAP measures of performance, including revenue, net income (loss), operating income or net cash provided by operating activities. Our definitions and calculation of these non-GAAP measures may differ from definitions of Adjusted Revenue, Adjusted EBITDA and CAFD used by other companies. We believe that Adjusted Revenue, Adjusted EBITDA and CAFD are useful supplemental measures that may assist investors in assessing the financial performance of the Company. None of these non-GAAP measures should be considered as the sole measure of our performance, nor should they be considered in isolation from, or as a substitute for, analysis of our financial statements prepared in accordance with GAAP, which are available on our website at www.terraform.com as well as at www.sec.gov.

Q2 2018 HIGHLIGHTS Activities Highlights Following the settlement of our tender offer whereby we acquired 95% of Saeta, we closed the minority squeeze-out on July 2nd, increasing our ownership of Saeta to 100%Executed an 11-year Framework Agreement with an affiliate of General Electric Company (“GE”) to provide us with full-wrap, long-term service agreements (“LTSAs”) for turbine operations and maintenance as well as other balance of plant services for each project in our 1.6 GW North American wind fleet. The LTSAs will leverage GE’s proprietary technology to increase production from our wind fleet. The LTSAs will include a combination of resource-adjusted production guarantees and availability guarantees for all of our turbines, which are designed to improve upon historical resource-adjusted production levels and are consistent with our long-term average generation targets, once fully implemented after a transition period of 9 to 12 months. The LTSAs also lock in cost savings at an amount that is consistent with our cost savings target from operations and that is $20 million less than the comparable amount for our wind fleet in 2017. The balance of the total $25 million in operating cost savings is expected to be delivered in H2 2018 Made significant progress executing the ~$350 million non-recourse debt component of our permanent financing plan for the Saeta acquisition, including closing the first project financing of certain of our unencumbered assets. This first financing yielded net proceeds of ~$83 million. We have launched the second financing which is expected to yield net proceeds of ~$70 million and close later this summerPursuant to a back-stop agreement with our sponsor Brookfield Asset Management (“Brookfield”), issued $650 million in equity as part of our permanent financing plan for the Saeta acquisitionProgressed a number of organic growth initiatives, including (1) closed the previously announced acquisition of a 6 MW portfolio of operating distributed solar generation assets located in California and New Jersey; (2) executed a $2 million buyout of a tax equity partner in a portfolio of solar projects, expecting to yield strong returns well in excess of currently available third-party market transactions; and (3) entering into a letter of intent to expand by 2.5MW our existing Tinkham Hill Project in MassachusettsRepriced $350 million Term Loan B at a 75 basis point reduction in the spread to LIBOR + 200, yielding projected annual savings of ~$2.5 millionApproved quarterly dividend of $0.19 per share, $0.76 per share on an annualized basis – consistent with guidance

Q2 2018 HIGHLIGHTS (continued) Key Balance Sheet Metrics Performance Highlights 1,912 GWhGeneration ~$9 billionTotal Capitalization $30 millionCAFD During the second quarter, our portfolio performed slightly below expectations, delivering Adjusted EBITDA and CAFD of $128 million and $30 million, respectively, versus $117 million and $25 million , respectively, in Q2 2017Adjusted EBITDA increased by $11 million largely attributable to the contribution from Saeta and increased generation from our solar business, offset by a decrease in production from our wind assets and lower net pricing in TexasCAFD increased by $5 million primarily due to the Saeta acquisition and interest savings from corporate refinancing undertaken in Q4 2017Excluding Saeta, the total generation in Q2 2018 of 1,912 GWh, 2% lower than prior period, primarily due to on-going maintenance in our Central Wind portfolios. Including Saeta generation, total generation in Q2 2018 of 2,036 GWhNet loss of ($28) million was $26 million lower than Q2 2017 primarily due to gain on sale of U.K. renewable energy facilities in Q2 2017Total capitalization ~ $9 billion after funding Saeta acquisition Key Performance Metrics

Our Business TerraForm Power’s goal is to own and operate high-quality wind and solar generation assets in North America and Western EuropePerformance Targets and Key MeasuresOur objective is to deliver an attractive total return in the low teens per annum to our shareholdersExpect to generate return from a dividend backed by stable cashflow from our assets and 5-8% annual dividend per share increase that we believe is sustainable over the long termWe target a dividend payout of 80-85% of CAFDOver the next five years, we expect growth to be driven primarily by cost savings, increased production from our assets, accretion from Saeta acquisition, and organic investmentsOpportunistic, value-oriented acquisitions are expected to provide upside to our business planGrowth in CAFD per share is a key performance metric as it is a proxy for our ability to increase distributions
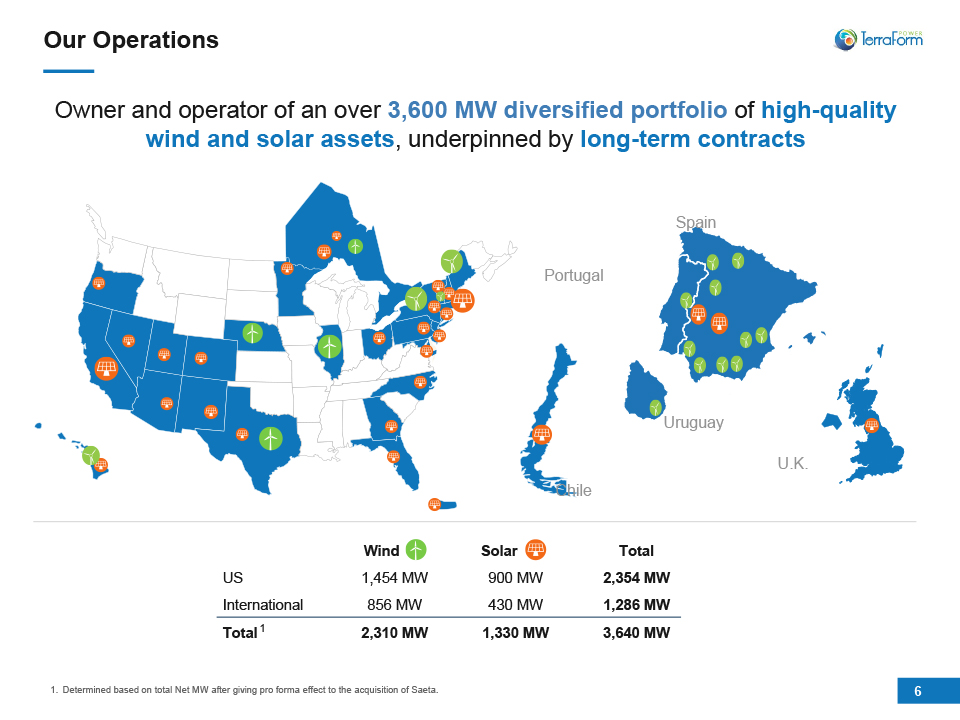
Wind Solar Total US 1,454 MW 900 MW 2,354 MW International 856 MW 430 MW 1,286 MW Total 2,310 MW 1,330 MW 3,640 MW Our Operations Owner and operator of an over 3,600 MW diversified portfolio of high-quality wind and solar assets, underpinned by long-term contracts Spain Portugal Uruguay Chile U.K. 1 Determined based on total Net MW after giving pro forma effect to the acquisition of Saeta.

Portfolio of High Quality Assets with Significant Diversity Determined based on Total Net MW after giving pro forma effect to the acquisition of Saeta.Determined based on TERP projected 2018 revenue pro forma for Saeta acquisition. Assets remunerated through the Spanish guaranteed return on deemed investment (RAB) regime (see Slide 19). Significant Resource Diversity1 Meaningful Portfolio Effect Large-Scale, Diversified Portfolio1 Contracted and regulated assets with significant resource diversity Recently Constructed1 Average age of 5 years 3.6 GWFleet Contracted and Regulated Revenue2 Stable Revenue 3

Tenor of Offtake Contracts1 Creditworthy Investment Grade Offtakers1 94%IG Long Term Stable Cash Flows ~14 years1 of contracted cash flow with creditworthy offtakers~96% of cash flows2 are under long-term contract or regulatory framework3 Tenor of Offtake Contracts and Offtaker Credit Ratings are calculated based on Total Net MW after giving pro forma effect to the acquisition of Saeta, as of March 31, 2018. Offtaker Credit Rating indicates “IG” if rated as Investment Grade by either Moody’s or S&P, “NR” if not rated by either S&P and Moody’s, “< IG” if the former cases are not applicable and rated less than Investment Grade by either Moody’s or S&P.Determined based on TERP projected 2018 revenue pro forma for Saeta. Assets remunerated through the Spanish guaranteed return on deemed investment (RAB) regime (see Slide 19). Average 14 years Remaining

Generation and Revenue Long term average annual generation (LTA) is expected generation at the point of delivery net of all recurring losses and constraints. We expect that our wind and solar fleet will be able to produce at LTA on a run rate basis during 2019 as we improve the performance of our fleetWe compare actual generation levels against the long-term average to highlight the impact of an important factor that affects the variability of our business results. In the short-term, we recognize that wind conditions and irradiance conditions will vary from one period to the next; however, we expect our facilities will produce electricity in-line with their LTA over time

Selected Income Statement and Balance Sheet Information The following tables present selected income statement and balance sheet information by operating segment: Income Statement Balance Sheet

Operating Segments
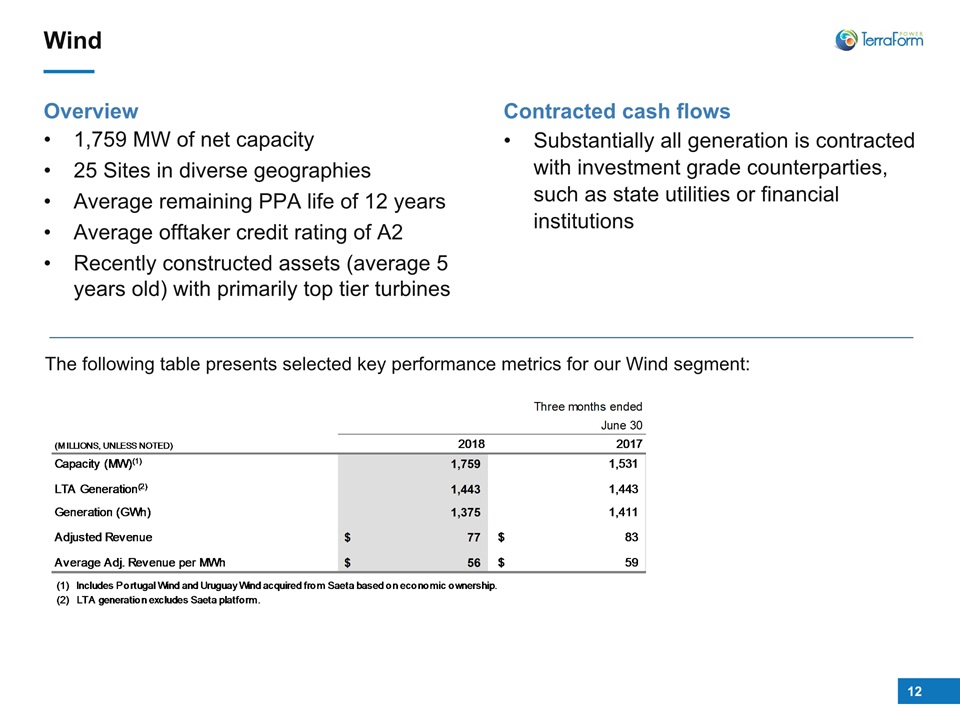
Wind Overview1,759 MW of net capacity25 Sites in diverse geographiesAverage remaining PPA life of 12 years Average offtaker credit rating of A2Recently constructed assets (average 5 years old) with primarily top tier turbines Contracted cash flowsSubstantially all generation is contracted with investment grade counterparties, such as state utilities or financial institutions The following table presents selected key performance metrics for our Wind segment:

Wind (continued) Performance Highlights Including acquired Saeta Wind assets in 2018, Adjusted EBITDA and CAFD were $48 million and $17 million, respectively, versus $55 million and $16 million, respectively, in Q2 2017Adjusted EBITDA decreased $7 million versus Q2 2017, primarily due on-going maintenance activities in Central Wind, negative basis pricing in ERCOT, partially offset by acquired Saeta Wind assets in 2018CAFD was $1 million higher than Q2 2017 due to refinancing of the MidCo term loan with corporate level debt, partially offset by the impacts to Adjusted EBITDANet loss was ($6) million, $6 million better than Q2 2017, due to repayment of the MidCo term loan, partially offset by lower Adjusted EBITDASustaining capital expenditures are reported based on long-term averages starting in 2018. The wind fleet will record $7 million annually ($2 million per quarter), substantially higher than the $2 million recorded in FY 2017

Solar The following table presents selected key performance metrics for our Solar segment: Overview1,081 MW of net capacity521 Sites in diverse geographiesAverage remaining PPA life of 17 years Average offtaker credit rating of Aa3Diverse mix of high quality modules Contracted cash flowsUtility scale – generation contracted by investment grade counterparties (such as state utilities) Distributed generation – mostly behind the meter generation contracted by investment grade public offtakers (municipalities, universities, schools, hospitals), and commercial and industrial offtakers

Solar (continued) Adjusted EBITDA and CAFD were $71 million and $43 million, respectively, versus $69 million and $41 million, respectively, in Q2 2017Adjusted EBITDA increased $2 million driven by greater volumes due to stronger resource in Utility, reduced curtailment in International Utility and increased SREC pricing in 2018, partially offset by SREC inventory monetization in Q2 2017CAFD increased $2 million due to higher Adjusted EBITDA, and lower distributions to non-controlling interests versus Q2 2017. Project defaults in 2016 caused cash traps, which increased distributions to non-controlling interests in Q2 2017 as cash was releasedNet income of $27 million was $46 million lower than Q2 2017 primarily due to gain on sale of U.K. renewable energy facilities in 2017 Performance Highlights

Regulated Spain Overview751 MW of net capacity21 Sites in diverse geographiesAverage remaining PPA life of 15 years Average offtaker credit rating of Baa1 (Government of Spain) Contracted cash flowsSubstantially all generation is contracted with Iberian Electricity Market Operator / Spanish Electricity Tariff (Government of Spain)Revenue framework includes the sale of electricity to the wholesale market, a capacity payment sized to earn a regulated return as determined by the Spanish regulator, and a regulated operating payment for CSP Solar to cover higher cost of operations The following table presents selected key performance metrics for our Regulated Spain segment:

Regulated Spain (continued) Performance Highlights Starting June 13th, 2018, Adjusted EBITDA and CAFD were $16 million and $7 millionNet income was $12 million, including $8 million of positive change in the fair value of Saeta’s interest rate swaps

Corporate The following table presents our Corporate segment’s financial results: Performance Highlights Direct operating costs were in line with Q2 2017 Interest expense was broadly in line with Q2 2017, primarily driven by the Q4 2017 refinancing of our high yield bonds with interest saving of ~200 bps, partially offset by interest expense on the $350 million Term Loan B issued in Q4 2017 to replace Midco debt within the Wind segment. The savings from the repricing of the Term Loan in May (spread reduction of ~75 bps), were offset by revolver and sponsor line draws to fund Saeta transactionNon-operating general and administrative expenses decreased by $14 million primarily driven by reductions in legal fees and consulting feesNet loss of ($61) million was broadly in line with Q2 2017

We operate with sufficient liquidity to enable us to fund expected growth initiatives, capital expenditures, and distributions, and to provide protection against any sudden adverse changes in economic circumstances or short-term fluctuations in generation.Principal sources of liquidity are cash flows from operations, our credit facilities, up-financings of subsidiary borrowings and proceeds from the issuance of securities.Corporate liquidity and available capital were $728 million and $1,152 million, respectively, as of June 30, 2018: Liquidity

Maturity Profile We finance our assets primarily with project level debt that generally has long-term maturities that amortize over the contract life, few restrictive covenants and no recourse to either TerraForm Power or other projects.We have long-dated, staggered debt maturities. The following table summarizes our scheduled principal repayments, overall maturity profile and average interest rates associated with our borrowings over the next five years:

Our portfolio has a weighted-average remaining contract duration of ~14 years. Over the next five years, contracts accounting for 8% of our expected generation expire. We are focused on securing long-term contracts through recontracting or repowering as these contracts expire.The majority of our long-term power purchase agreements are with investment-grade counterparties. The composition of our counterparties under power purchase agreements is as follows:Public utilities: 52%Government institutions: 28%Financial institutions: 16%Commercial and industrial customers: 4% The following table sets out our contracted generation over the next five years as a percentage of expected generation. We currently have a contracted profile of approximately 97% of future generation and our goal is to maintain this profile going forward, increasing 2% vs Q1 2018 due to fully contracted profile in acquired assets. Contract Profile

Appendix 1 - Reconciliation of Non-GAAP Measures

Reconciliation of Non-GAAP Measuresfor the Three and Six Months Ended June 30
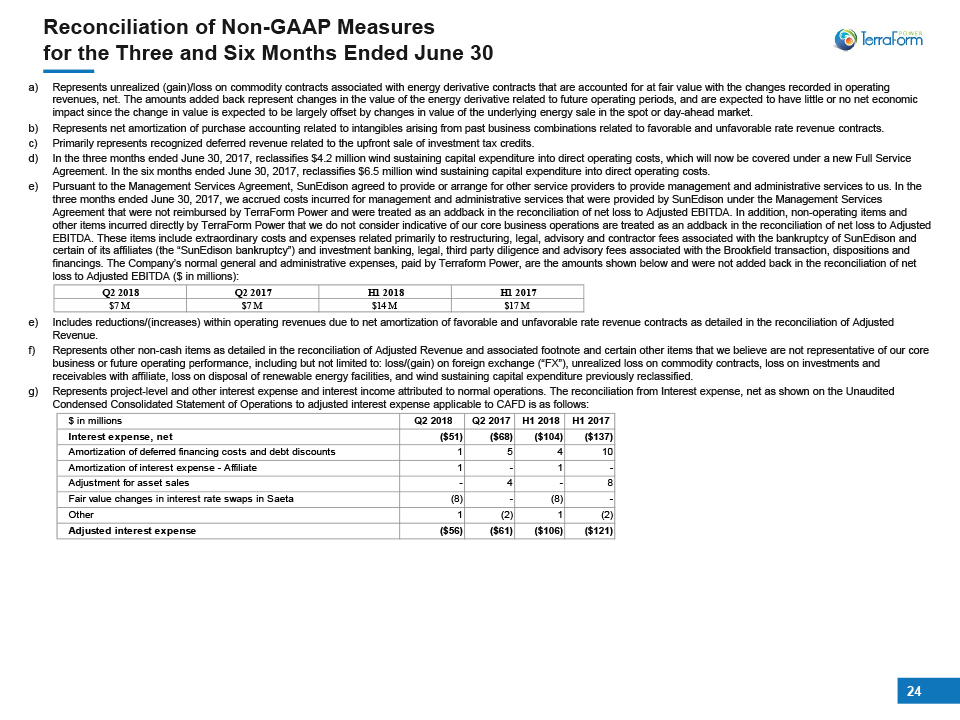
Reconciliation of Non-GAAP Measuresfor the Three and Six Months Ended June 30 Represents unrealized (gain)/loss on commodity contracts associated with energy derivative contracts that are accounted for at fair value with the changes recorded in operating revenues, net. The amounts added back represent changes in the value of the energy derivative related to future operating periods, and are expected to have little or no net economic impact since the change in value is expected to be largely offset by changes in value of the underlying energy sale in the spot or day-ahead market.Represents net amortization of purchase accounting related to intangibles arising from past business combinations related to favorable and unfavorable rate revenue contracts. Primarily represents recognized deferred revenue related to the upfront sale of investment tax credits.In the three months ended June 30, 2017, reclassifies $4.2 million wind sustaining capital expenditure into direct operating costs, which will now be covered under a new Full Service Agreement. In the six months ended June 30, 2017, reclassifies $6.5 million wind sustaining capital expenditure into direct operating costs.Pursuant to the Management Services Agreement, SunEdison agreed to provide or arrange for other service providers to provide management and administrative services to us. In the three months ended June 30, 2017, we accrued costs incurred for management and administrative services that were provided by SunEdison under the Management Services Agreement that were not reimbursed by TerraForm Power and were treated as an addback in the reconciliation of net loss to Adjusted EBITDA. In addition, non-operating items and other items incurred directly by TerraForm Power that we do not consider indicative of our core business operations are treated as an addback in the reconciliation of net loss to Adjusted EBITDA. These items include extraordinary costs and expenses related primarily to restructuring, legal, advisory and contractor fees associated with the bankruptcy of SunEdison and certain of its affiliates (the “SunEdison bankruptcy”) and investment banking, legal, third party diligence and advisory fees associated with the Brookfield transaction, dispositions and financings. The Company’s normal general and administrative expenses, paid by Terraform Power, are the amounts shown below and were not added back in the reconciliation of net loss to Adjusted EBITDA ($ in millions):Includes reductions/(increases) within operating revenues due to net amortization of favorable and unfavorable rate revenue contracts as detailed in the reconciliation of Adjusted Revenue.Represents other non-cash items as detailed in the reconciliation of Adjusted Revenue and associated footnote and certain other items that we believe are not representative of our core business or future operating performance, including but not limited to: loss/(gain) on foreign exchange (“FX”), unrealized loss on commodity contracts, loss on investments and receivables with affiliate, loss on disposal of renewable energy facilities, and wind sustaining capital expenditure previously reclassified.Represents project-level and other interest expense and interest income attributed to normal operations. The reconciliation from Interest expense, net as shown on the Unaudited Condensed Consolidated Statement of Operations to adjusted interest expense applicable to CAFD is as follows:

Represents levelized project-level and other principal debt payments to the extent paid from operating cash.Represents cash distributions paid to non-controlling interests in our renewable energy facilities. The reconciliation from Distributions to non-controlling interests as shown on the Unaudited Condensed Consolidated Statement of Cash Flows to Cash distributions to non-controlling interests, net for the three months ended June 30, 2018 and 2017 is as follows: Represents long-term average sustaining capex starting in 2018 to maintain reliability and efficiency of the assets.Represents other cash flows as determined by management to be representative of normal operations including, but not limited to, wind plant “pay as you go” contributions received from tax equity partners, interconnection upgrade reimbursements, major maintenance reserve releases or (additions), and releases or (postings) of collateral held by counterparties of energy market hedges for certain wind plants.CAFD in 2017 was recast as follows to present the levelized principal payments, adjusted interest expense, and incentive revenue recognition recast to provide period to period comparisons that are consistent and more easily understood. The 2017 incentive revenue was recast based on an estimate in the same proportions as the 2018 phasing, which differs from the actual 2017 phasing due to the adoption of the revenue recognition standard. In the twelve months ended December 31, 2017, CAFD remained $88 million as reported previously. Reconciliation of Non-GAAP Measuresfor the Three and Six Months Ended June 30 (Continued)

Appendix 2 – Additional Information

Annualized Long-term Average Generation

Calculation and Use of Non-GAAP Measures Adjusted Revenue, Adjusted EBITDA and CAFD are supplemental non-GAAP measures that should not be viewed as alternatives to GAAP measures of performance, including revenue, net income (loss), operating income or net cash provided by operating activities. Our definitions and calculation of these non-GAAP measures may not necessarily be the same as those used by other companies. These non-GAAP measures have certain limitations, which are described below, and they should not be considered in isolation. We encourage you to review, and evaluate the basis for, each of the adjustments made to arrive at Adjusted Revenue, Adjusted EBITDA and CAFD.Calculation of Non-GAAP MeasuresWe define adjusted revenue as operating revenues, net, adjusted for non-cash items including unrealized gain/loss on derivatives, amortization of favorable and unfavorable rate revenue contracts, net and other non-cash revenue items. We define adjusted EBITDA as net income (loss) plus depreciation, accretion and amortization, non-cash general and administrative costs, interest expense, income tax (benefit) expense, acquisition related expenses, and certain other non-cash charges, unusual or non-recurring items and other items that we believe are not representative of our core business or future operating performance. We define “cash available for distribution” or “CAFD” as adjusted EBITDA (i) minus cash distributions paid to non-controlling interests in our renewable energy facilities, if any, (ii) minus annualized scheduled interest and project level amortization payments in accordance with the related borrowing arrangements, (iii) minus average annual sustaining capital expenditures (based on the long-sustaining capital expenditure plans) which are recurring in nature and used to maintain the reliability and efficiency of our power generating assets over our long-term investment horizon, (iv) plus or minus operating items as necessary to present the cash flows we deem representative of our core business operations. As compared to the preceding period, we revised our definition of CAFD to (i) exclude adjustments related to deposits into and withdrawals from restricted cash accounts, required by project financing arrangements, (ii) replace sustaining capital expenditures payment made in the year with the average annualized long-term sustaining capital expenditures to maintain reliability and efficiency of our assets, and (iii) annualized debt service payments. We revised our definition as we believe it provides a more meaningful measure for investors to evaluate our financial and operating performance and ability to pay dividends. For items presented on an annualized basis, we will present actual cash payments as a proxy for an annualized number until the period commencing January 1, 2018.Furthermore, to provide investors with the most appropriate measures to assess the financial and operating performance of our existing fleet and the ability to pay dividends in the future, we have excluded results associated with our UK solar and Residential portfolios, which were sold in 2017, from adjusted revenue, EBITDA and CAFD reported for all periods. Use of Non-GAAP MeasuresWe disclose Adjusted Revenue because it presents the component of operating revenue that relates to energy production from our plants, and is, therefore, useful to investors and other stakeholders in evaluating performance of our renewable energy assets and comparing that performance across periods in each case without regard to non-cash revenue items. We disclose Adjusted EBITDA because we believe it is useful to investors and other stakeholders as a measure of financial and operating performance and debt service capabilities. We believe Adjusted EBITDA provides an additional tool to investors and securities analysts to compare our performance across periods and among us and our peer companies without regard to interest expense, taxes and depreciation and amortization. Adjusted EBITDA has certain limitations, including that it: (i) does not reflect cash expenditures or future requirements for capital expenditures or contractual liabilities or future working capital needs, (ii) does not reflect the significant interest expenses that we expect to incur or any income tax payments that we may incur, and (iii) does not reflect depreciation and amortization and, although these charges are non-cash, the assets to which they relate may need to be replaced in the future, and (iv) does not take into account any cash expenditures required to replace those assets. Adjusted EBITDA also includes adjustments for goodwill impairment charges, gains and losses on derivatives and foreign currency swaps, acquisition related costs and items we believe are infrequent, unusual or non-recurring, including adjustments for general and administrative expenses we have incurred as a result of the SunEdison bankruptcy. We disclose CAFD because we believe cash available for distribution is useful to investors in evaluating our operating performance and because securities analysts and other stakeholders analyze CAFD as a measure of our financial and operating performance and our ability to pay dividends. CAFD is not a measure of liquidity or profitability, nor is it indicative of the funds needed by us to operate our business. CAFD has certain limitations, such as the fact that CAFD includes all of the adjustments and exclusions made to Adjusted EBITDA described above. The adjustments made to Adjusted EBITDA and CAFD for infrequent, unusual or non-recurring items and items that we do not believe are representative of our core business involve the application of management judgment, and the presentation of Adjusted EBITDA and CAFD should not be construed to infer that our future results will be unaffected by infrequent, non-operating, unusual or non-recurring items.In addition, these measures are used by our management for internal planning purposes, including for certain aspects of our consolidated operating budget, as well as evaluating the attractiveness of investments and acquisitions. We believe these Non-GAAP measures are useful as a planning tool because it allows our management to compare performance across periods on a consistent basis in order to more easily view and evaluate operating and performance trends and as a means of forecasting operating and financial performance and comparing actual performance to forecasted expectations. For these reasons, we also believe these Non-GAAP measures are also useful for communicating with investors and other stakeholders.

NASDAQ: TERP http://www.terraformpower.com 29