Attached files
| file | filename |
|---|---|
| EX-32.1 - EX-32.1 - EMMAUS LIFE SCIENCES, INC. | emma-ex321_10.htm |
| EX-31.2 - EX-31.2 - EMMAUS LIFE SCIENCES, INC. | emma-ex312_12.htm |
| EX-31.1 - EX-31.1 - EMMAUS LIFE SCIENCES, INC. | emma-ex311_8.htm |
| EX-10.1 - EX-10.1 - EMMAUS LIFE SCIENCES, INC. | emma-ex101_39.htm |
| EX-4.5 - EX-4.5 - EMMAUS LIFE SCIENCES, INC. | emma-ex45_38.htm |
| EX-4.4 - EX-4.4 - EMMAUS LIFE SCIENCES, INC. | emma-ex44_37.htm |
| EX-4.3 - EX-4.3 - EMMAUS LIFE SCIENCES, INC. | emma-ex43_36.htm |
| EX-4.2 - EX-4.2 - EMMAUS LIFE SCIENCES, INC. | emma-ex42_35.htm |
| EX-4.1 - EX-4.1 - EMMAUS LIFE SCIENCES, INC. | emma-ex41_34.htm |
i
UNITED STATES
SECURITIES AND EXCHANGE COMMISSION
Washington, D.C. 20549
FORM 10-Q
|
☒ |
QUARTERLY REPORT PURSUANT TO SECTION 13 OR 15(d) OF THE SECURITIES EXCHANGE ACT OF 1934 |
For the Quarterly Period Ended June 30, 2018
OR
|
☐ |
TRANSITION REPORT PURSUANT TO SECTION 13 OR 15(d) OF THE SECURITIES EXCHANGE ACT OF 1934 |
For the transition period from to
Commission File No.: 000-53072
EMMAUS LIFE SCIENCES, INC.
(Exact name of Registrant as specified in its charter)
|
Delaware |
|
41-2254389 |
|
(State or other jurisdiction of incorporation or organization) |
|
(I.R.S. Employer Identification No.) |
|
21250 Hawthorne Boulevard, Suite 800, Torrance, California |
|
90503 |
|
(Address of principal executive offices) |
|
(Zip code) |
(310) 214-0065
(Registrant’s telephone number, including area code)
Indicate by check mark whether the registrant (1) has filed all reports required to be filed by Section 13 or 15(d) of the Securities Exchange Act of 1934 during the preceding 12 months (or for such shorter period that the registrant was required to file such reports), and (2) has been subject to such filing requirements for the past 90 days. Yes ☒ No ☐
Indicate by check mark whether the registrant has submitted electronically and posted on its corporate Web site, if any, every Interactive Data File required to be submitted and posted pursuant to Rule 405 of Regulation S-T (§232.405 of this chapter) during the preceding 12 months (or for such shorter period that the registrant was required to submit and post such files). Yes ☒ No ☐
Indicate by check mark whether the registrant is a large accelerated filer, an accelerated filer, a non-accelerated filer, smaller reporting company, or an emerging growth company. See the definition of “large accelerated filer,” “accelerated filer,” “smaller reporting company,” and “emerging growth company” in Rule 12b-2 of the Exchange Act.
|
☐ |
Accelerated filer |
☐ |
Non-accelerated filer |
☐ |
Smaller reporting company |
☒ |
|
|
Emerging growth company |
☒ |
|
|
|
|
|
|
If an emerging growth company, indicate by check mark if the registrant has elected not to use the extended transition period for complying with any new or revised financial accounting standards provided pursuant to Section 13(a) of the Exchange Act. ☒
Indicate by check mark whether the registrant is a shell company (as defined in Rule 12b-2 of the Exchange Act). Yes ☐ No ☒
The registrant had 34,218,822 shares of common stock, par value $0.001 per share, outstanding as of August 10, 2018.
FORM 10-Q
For the Quarterly Period Ended June 30, 2018
INDEX
|
|
|
Page |
|
|
Part I Financial Information |
|
||
|
|
|
|
|
|
Item 1. |
3 |
||
|
|
|
|
|
|
|
(a)Consolidated Balance Sheets as of June 30, 2018 (Unaudited) and December 31, 2017 |
3 |
|
|
|
|
|
|
|
|
4 |
||
|
|
|
|
|
|
|
5 |
||
|
|
|
|
|
|
|
(d)Consolidated Statements of Cash Flows for the Six Months ended June 30, 2018 and 2017 (Unaudited) |
6 |
|
|
|
|
|
|
|
|
7 |
||
|
|
|
|
|
|
Item 2. |
Management’s Discussion and Analysis of Financial Condition and Results of Operations |
24 |
|
|
|
|
|
|
|
Item 3. |
32 |
||
|
|
|
|
|
|
Item 4. |
32 |
||
|
|
|
|
|
|
Part II Other Information |
|
||
|
|
|
|
|
|
Item 1. |
35 |
||
|
|
|
|
|
|
Item 1A. |
35 |
||
|
|
|
|
|
|
Item 2. |
35 |
||
|
|
|
|
|
|
Item 3. |
36 |
||
|
|
|
|
|
|
Item 4. |
36 |
||
|
|
|
|
|
|
Item 5. |
36 |
||
|
|
|
|
|
|
Item 6. |
37 |
||
|
|
|
|
|
|
38 |
|||
EMMAUS LIFE SCIENCES, INC.
|
|
|
As of |
|
|||||
|
|
|
June 30, 2018 |
|
|
December 31, 2017 |
|
||
|
|
|
(unaudited) |
|
|
|
|
|
|
|
ASSETS |
|
|
|
|
|
|
|
|
|
CURRENT ASSETS |
|
|
|
|
|
|
|
|
|
Cash and cash equivalents |
|
$ |
2,168,934 |
|
|
$ |
15,836,063 |
|
|
Restricted cash |
|
|
— |
|
|
|
6,720,000 |
|
|
Accounts receivable |
|
|
1,701,521 |
|
|
|
26,814 |
|
|
Inventories, net |
|
|
2,434,841 |
|
|
|
625,299 |
|
|
Investment in marketable securities |
|
|
66,007,364 |
|
|
|
99,836,397 |
|
|
Marketable securities, pledged to creditor |
|
|
340,643 |
|
|
|
160,925 |
|
|
Prepaid expenses and other current assets |
|
|
217,161 |
|
|
|
290,371 |
|
|
Total current assets |
|
|
72,870,464 |
|
|
|
123,495,869 |
|
|
PROPERTY AND EQUIPMENT, NET |
|
|
138,045 |
|
|
|
105,302 |
|
|
OTHER ASSETS |
|
|
|
|
|
|
|
|
|
Long-term investment at cost |
|
|
538,202 |
|
|
|
65,520 |
|
|
Intangibles, net |
|
|
60,480 |
|
|
|
67,200 |
|
|
Deposits |
|
|
327,313 |
|
|
|
111,581 |
|
|
Total other assets |
|
|
925,995 |
|
|
|
244,301 |
|
|
Total assets |
|
$ |
73,934,504 |
|
|
$ |
123,845,472 |
|
|
LIABILITIES AND STOCKHOLDERS’ EQUITY |
|
|
|
|
|
|
|
|
|
CURRENT LIABILITIES |
|
|
|
|
|
|
|
|
|
Accounts payable and accrued expenses |
|
$ |
5,978,331 |
|
|
$ |
5,695,310 |
|
|
Deferred revenue |
|
|
2,010,876 |
|
|
|
— |
|
|
Deferred rent |
|
|
— |
|
|
|
30,078 |
|
|
Other current liabilities |
|
|
30,438 |
|
|
|
10,109 |
|
|
Warrant derivative liabilities |
|
|
19,611,000 |
|
|
|
26,377,000 |
|
|
Notes payable, net |
|
|
4,435,983 |
|
|
|
7,871,143 |
|
|
Notes payable to related parties, net |
|
|
1,344,973 |
|
|
|
2,036,261 |
|
|
Convertible notes payable, net |
|
|
8,170,416 |
|
|
|
7,025,002 |
|
|
Convertible notes payable to related parties, net |
|
|
400,000 |
|
|
|
400,000 |
|
|
Total current liabilities |
|
|
41,982,017 |
|
|
|
49,444,903 |
|
|
LONG-TERM LIABILITIES |
|
|
|
|
|
|
|
|
|
Deferred rent |
|
|
143,451 |
|
|
|
10,821 |
|
|
Other long-term liabilities |
|
|
41,841,500 |
|
|
|
36,852,290 |
|
|
Warrant derivative liabilities |
|
|
1,567,000 |
|
|
|
1,882,000 |
|
|
Conversion option liabilities |
|
|
— |
|
|
|
1,289,000 |
|
|
Convertible notes payable, net |
|
|
5,035,661 |
|
|
|
20,075,780 |
|
|
Convertible notes payable to related parties, net |
|
|
12,653,538 |
|
|
|
— |
|
|
Total long-term liabilities |
|
|
61,241,150 |
|
|
|
60,109,891 |
|
|
Total liabilities |
|
|
103,223,167 |
|
|
|
109,554,794 |
|
|
STOCKHOLDERS’ EQUITY |
|
|
|
|
|
|
|
|
|
Preferred stock — par value $0.001 per share, 20,000,000 shares authorized, none issued and outstanding |
|
|
— |
|
|
|
— |
|
|
Common stock — par value $0.001 per share, 100,000,000 shares authorized, 34,218,822 shares and 34,885,506 shares issued and outstanding at June 30, 2018 and December 31, 2017, respectively |
|
|
34,219 |
|
|
|
34,886 |
|
|
Additional paid-in capital |
|
|
124,273,569 |
|
|
|
113,111,745 |
|
|
Accumulated other comprehensive income (loss) |
|
|
(69,512 |
) |
|
|
41,275,785 |
|
|
Treasury stock, at cost — 700,000 shares and 0 shares at June 30, 2018 and December 31, 2017, respectively |
|
|
(1,314,000 |
) |
|
|
— |
|
|
Accumulated deficit |
|
|
(152,212,939 |
) |
|
|
(140,131,738 |
) |
|
Total stockholders’ equity (deficit) |
|
|
(29,288,663 |
) |
|
|
14,290,678 |
|
|
Total liabilities & stockholders’ equity |
|
$ |
73,934,504 |
|
|
$ |
123,845,472 |
|
The accompanying notes are an integral part of these consolidated financial statements.
3
CONSOLIDATED STATEMENTS OF COMPREHENSIVE LOSS
(UNAUDITED)
|
|
|
Three months ended June 30, |
|
|
Six months ended June 30, |
|
||||||||||
|
|
2018 |
|
|
2017 |
|
|
2018 |
|
|
2017 |
|
|||||
|
REVENUES, NET |
|
|
2,571,097 |
|
|
|
118,641 |
|
|
|
3,352,411 |
|
|
|
226,118 |
|
|
COST OF GOODS SOLD |
|
|
220,701 |
|
|
|
45,252 |
|
|
|
355,380 |
|
|
|
93,512 |
|
|
GROSS PROFIT |
|
|
2,350,396 |
|
|
|
73,389 |
|
|
|
2,997,031 |
|
|
|
132,606 |
|
|
OPERATING EXPENSES |
|
|
|
|
|
|
|
|
|
|
|
|
|
|
|
|
|
Research and development |
|
|
395,763 |
|
|
|
1,196,630 |
|
|
|
807,164 |
|
|
|
1,952,358 |
|
|
Selling |
|
|
1,568,690 |
|
|
|
89,638 |
|
|
|
2,438,829 |
|
|
|
191,299 |
|
|
General and administrative |
|
|
3,142,042 |
|
|
|
3,514,302 |
|
|
|
6,948,625 |
|
|
|
6,313,342 |
|
|
Total operating expenses |
|
|
5,106,495 |
|
|
|
4,800,570 |
|
|
|
10,194,618 |
|
|
|
8,456,999 |
|
|
LOSS FROM OPERATIONS |
|
|
(2,756,099 |
) |
|
|
(4,727,181 |
) |
|
|
(7,197,587 |
) |
|
|
(8,324,393 |
) |
|
OTHER INCOME (EXPENSE) |
|
|
|
|
|
|
|
|
|
|
|
|
|
|
|
|
|
Loss on debt extinguishment |
|
|
— |
|
|
|
— |
|
|
|
(3,244,769 |
) |
|
|
— |
|
|
Change in fair value of warrant derivative liabilities |
|
|
55,000 |
|
|
|
(4,434,000 |
) |
|
|
895,000 |
|
|
|
(5,662,000 |
) |
|
Change in fair value of embedded conversion option |
|
|
— |
|
|
|
— |
|
|
|
466,000 |
|
|
|
— |
|
|
Unrealized loss on investment in marketable securities |
|
|
(39,184,749 |
) |
|
|
— |
|
|
|
(33,649,314 |
) |
|
|
— |
|
|
Interest and other income (loss) |
|
|
(11,567 |
) |
|
|
(8,711 |
) |
|
|
33,985 |
|
|
|
(21,941 |
) |
|
Interest expense |
|
|
(5,445,825 |
) |
|
|
(2,605,903 |
) |
|
|
(10,743,846 |
) |
|
|
(4,259,794 |
) |
|
Total other expense |
|
|
(44,587,141 |
) |
|
|
(7,048,614 |
) |
|
|
(46,242,944 |
) |
|
|
(9,943,735 |
) |
|
LOSS BEFORE INCOME TAXES |
|
|
(47,343,240 |
) |
|
|
(11,775,795 |
) |
|
|
(53,440,531 |
) |
|
|
(18,268,128 |
) |
|
INCOME TAXES |
|
|
— |
|
|
|
— |
|
|
|
2,400 |
|
|
|
2,400 |
|
|
NET LOSS |
|
|
(47,343,240 |
) |
|
|
(11,775,795 |
) |
|
|
(53,442,931 |
) |
|
|
(18,270,528 |
) |
|
COMPONENTS OF OTHER COMPREHENSIVE INCOME (LOSS) |
|
|
|
|
|
|
|
|
|
|
|
|
|
|
|
|
|
Unrealized loss on investment in marketable securities |
|
|
— |
|
|
|
(461,382 |
) |
|
|
— |
|
|
|
(412,412 |
) |
|
Unrealized gain (loss) in foreign translation |
|
|
2,632 |
|
|
|
602 |
|
|
|
16,433 |
|
|
|
(11,005 |
) |
|
Other comprehensive income (loss) |
|
|
2,632 |
|
|
|
(460,780 |
) |
|
|
16,433 |
|
|
|
(423,417 |
) |
|
COMPREHENSIVE LOSS |
|
$ |
(47,340,608 |
) |
|
$ |
(12,236,575 |
) |
|
$ |
(53,426,498 |
) |
|
$ |
(18,693,945 |
) |
|
NET LOSS PER COMMON SHARE |
|
$ |
(1.36 |
) |
|
$ |
(0.34 |
) |
|
$ |
(1.53 |
) |
|
$ |
(0.53 |
) |
|
WEIGHTED AVERAGE COMMON SHARES OUTSTANDING |
|
|
34,824,961 |
|
|
|
34,736,681 |
|
|
|
34,858,022 |
|
|
|
34,721,633 |
|
The accompanying notes are an integral part of these consolidated financial statements.
4
CONSOLIDATED STATEMENT OF CHANGES IN STOCKHOLDERS’ EQUITY
FOR THE SIX MONTHS ENDED JUNE 30, 2018
(UNAUDITED)
|
|
|
Common stock – par value $0.001 per share, 100,000,000 |
|
|
|
|
|
|
Accumulated Other |
|
|
|
|
|
|
|
|
|
|
|
|
|
||||||
|
|
|
Shares authorized |
|
|
Additional |
|
|
Comprehensive |
|
|
Treasury Stock, |
|
|
Accumulated |
|
|
|
|
|
|||||||||
|
|
|
Shares |
|
|
Common Stock |
|
|
Paid-In Capital |
|
|
Income (Loss) |
|
|
at cost |
|
|
Deficit |
|
|
Total |
|
|||||||
|
Balance, December 31, 2017 |
|
|
34,885,506 |
|
|
$ |
34,886 |
|
|
$ |
113,111,745 |
|
|
$ |
41,275,785 |
|
|
$ |
— |
|
|
$ |
(140,131,738 |
) |
|
$ |
14,290,678 |
|
|
Cumulative effect adjustment on adoption of ASU 2016-01 |
|
|
— |
|
|
|
— |
|
|
|
— |
|
|
|
(41,361,730 |
) |
|
|
— |
|
|
|
41,361,730 |
|
|
|
— |
|
|
Beneficial conversion feature relating to convertible notes |
|
|
— |
|
|
|
— |
|
|
|
9,220,856 |
|
|
|
— |
|
|
|
— |
|
|
|
— |
|
|
|
9,220,856 |
|
|
Stock issued for cash |
|
|
25,000 |
|
|
|
25 |
|
|
|
274,975 |
|
|
|
— |
|
|
|
— |
|
|
|
— |
|
|
|
275,000 |
|
|
Repurchase of common stock |
|
|
(700,000 |
) |
|
|
(700 |
) |
|
|
700 |
|
|
|
— |
|
|
|
(1,314,000 |
) |
|
|
— |
|
|
|
(1,314,000 |
) |
|
Share-based compensation |
|
|
— |
|
|
|
— |
|
|
|
1,665,301 |
|
|
|
— |
|
|
|
— |
|
|
|
— |
|
|
|
1,665,301 |
|
|
Exercise of warrants (cashless) |
|
|
8,316 |
|
|
|
8 |
|
|
|
(8 |
) |
|
|
— |
|
|
|
— |
|
|
|
— |
|
|
|
— |
|
|
Foreign currency translation effect |
|
|
— |
|
|
|
— |
|
|
|
— |
|
|
|
16,433 |
|
|
|
— |
|
|
|
— |
|
|
|
16,433 |
|
|
Net loss |
|
|
— |
|
|
|
— |
|
|
|
— |
|
|
|
— |
|
|
|
— |
|
|
|
(53,442,931 |
) |
|
|
(53,442,931 |
) |
|
Balance, June 30, 2018 |
|
|
34,218,822 |
|
|
$ |
34,219 |
|
|
$ |
124,273,569 |
|
|
$ |
(69,512 |
) |
|
$ |
(1,314,000 |
) |
|
$ |
(152,212,939 |
) |
|
$ |
(29,288,663 |
) |
The accompanying notes are an integral part of these consolidated financial statements.
5
CONSOLIDATED STATEMENTS OF CASH FLOWS
(UNAUDITED)
|
|
|
Six months ended June 30, |
|
|||||
|
|
|
2018 |
|
|
2017 |
|
||
|
CASH FLOWS FROM OPERATING ACTIVITIES |
|
|
|
|
|
|
|
|
|
Net loss |
|
$ |
(53,442,931 |
) |
|
$ |
(18,270,528 |
) |
|
Adjustments to reconcile net loss to net cash flows from operating activities |
|
|
|
|
|
|
|
|
|
Depreciation and amortization |
|
|
27,468 |
|
|
|
9,357 |
|
|
Cost of scrapped inventory written off |
|
|
11,191 |
|
|
|
— |
|
|
Amortization of discount of convertible notes |
|
|
8,613,793 |
|
|
|
3,310,318 |
|
|
Foreign exchange adjustments on convertible notes and notes payable |
|
|
39,331 |
|
|
|
85,096 |
|
|
Loss on debt extinguishment |
|
|
3,244,769 |
|
|
|
— |
|
|
Share-based compensation |
|
|
1,665,301 |
|
|
|
2,803,759 |
|
|
Change in fair value of warrant derivative liabilities |
|
|
(895,000 |
) |
|
|
5,662,000 |
|
|
Change in fair value of embedded conversion option |
|
|
(466,000 |
) |
|
|
— |
|
|
Unrealized loss on investment in marketable securities |
|
|
33,649,314 |
|
|
|
— |
|
|
Net changes in operating assets and liabilities |
|
|
|
|
|
|
|
|
|
Investment capital reserve |
|
|
— |
|
|
|
(31,841,500 |
) |
|
Accounts receivable |
|
|
(1,675,859 |
) |
|
|
3,448 |
|
|
Inventories |
|
|
(1,820,389 |
) |
|
|
(101,225 |
) |
|
Prepaid expenses and other current assets |
|
|
79,899 |
|
|
|
(147,143 |
) |
|
Deposits |
|
|
(215,923 |
) |
|
|
106,821 |
|
|
Accounts payable and accrued expenses |
|
|
980,122 |
|
|
|
4,091,074 |
|
|
Deferred revenue |
|
|
2,010,876 |
|
|
|
— |
|
|
Deferred rent |
|
|
102,553 |
|
|
|
(7,684 |
) |
|
Other current liabilities |
|
|
19,961 |
|
|
|
36,841,500 |
|
|
Other long-term liabilities |
|
|
5,000,000 |
|
|
|
— |
|
|
Net cash flows provided by (used in) operating activities |
|
|
(3,071,524 |
) |
|
|
2,545,293 |
|
|
CASH FLOWS FROM INVESTING ACTIVITIES |
|
|
|
|
|
|
|
|
|
Purchases of property and equipment |
|
|
(53,486 |
) |
|
|
(84,569 |
) |
|
Purchase of marketable securities and investment at cost |
|
|
(469,052 |
) |
|
|
— |
|
|
Net cash flows used in investing activities |
|
|
(522,538 |
) |
|
|
(84,569 |
) |
|
CASH FLOWS FROM FINANCING ACTIVITIES |
|
|
|
|
|
|
|
|
|
Repurchase of common stock and warrants |
|
|
(7,500,000 |
) |
|
|
— |
|
|
Proceeds from notes payable issued |
|
|
— |
|
|
|
100,000 |
|
|
Proceeds from convertible notes payable issued, net of issuance cost and discount |
|
|
14,644,700 |
|
|
|
1,200,000 |
|
|
Payments of notes payable |
|
|
(4,200,000 |
) |
|
|
(344,339 |
) |
|
Payments of convertible notes |
|
|
(20,000,000 |
) |
|
|
— |
|
|
Proceeds from issuance of common stock |
|
|
275,000 |
|
|
|
311,600 |
|
|
Net cash flows provided by (used in) financing activities |
|
|
(16,780,300 |
) |
|
|
1,267,261 |
|
|
Effect of exchange rate changes on cash |
|
|
(12,767 |
) |
|
|
42,184 |
|
|
Net increase (decrease) in cash, cash equivalents and restricted cash |
|
|
(20,387,129 |
) |
|
|
3,770,169 |
|
|
Cash, cash equivalents and restricted cash, beginning of period |
|
|
22,556,063 |
|
|
|
1,317,340 |
|
|
Cash, cash equivalents and restricted cash, end of period |
|
$ |
2,168,934 |
|
|
$ |
5,087,509 |
|
|
SUPPLEMENTAL DISCLOSURES OF CASH FLOW ACTIVITIES |
|
|
|
|
|
|
|
|
|
Interest paid |
|
$ |
1,032,423 |
|
|
$ |
557,998 |
|
|
Income taxes paid |
|
$ |
2,400 |
|
|
$ |
2,400 |
|
|
SUPPLEMENTAL DISCLOSURES OF NON-CASH INFORMATION |
|
|
|
|
|
|
|
|
|
Common stocks issued on exercise of warrants |
|
$ |
8,316 |
|
|
$ |
— |
|
The accompanying notes are an integral part of these consolidated financial statements.
6
NOTES TO CONSOLIDATED FINANCIAL STATEMENTS
JUNE 30, 2018
(UNAUDITED)
NOTE 1 — BASIS OF PRESENTATION
The accompanying unaudited consolidated interim financial statements of Emmaus Life Sciences, Inc. and subsidiaries (collectively, the “Company” or “Emmaus”) have been prepared in accordance with accounting principles generally accepted in the United States of America (“GAAP”) on the basis that the Company will continue as a going concern. The consolidated financial statements include the accounts of the Company and its consolidated subsidiaries. All significant intercompany transactions have been eliminated. The Company’s unaudited consolidated interim financial statements contain adjustments, including normal recurring accruals necessary to present fairly the Company’s consolidated financial position, results of operations, comprehensive income (loss) and cash flows. Due to the uncertainty of the Company’s ability to meet its current operating and capital expenses, there is substantial doubt about the Company’s ability to continue as a going concern, as the continuation and expansion of its business is dependent upon obtaining further financing, market acceptance of Endari™, and achieving a profitable level of revenues. The consolidated interim financial statements do not include any adjustments that might result from the outcome of these uncertainties. The consolidated interim financial statements should be read in conjunction with the Company’s Annual Report on Form 10-K for the year ended December 31, 2017, filed with the Securities and Exchange Commission (“SEC”) on April 16, 2018 (the “Annual Report”). Interim results for the periods presented herein are not necessarily indicative of the results that may be expected for the fiscal year ending December 31, 2018.
The preparation of the consolidated financial statements requires the use of management estimates. Actual results could differ materially from those estimates.
NOTE 2 — SUMMARY OF SIGNIFICANT ACCOUNTING POLICIES
Refer to the Annual Report for a summary of significant accounting policies. There have been no material changes to the Company’s significant accounting policies during the six months ended June 30, 2018. Below are disclosures of certain interim balances, transactions, and significant assumptions used in computing fair value as of and for the six months ended June 30, 2018 and comparative amounts from the prior fiscal periods:
Accounts receivable — Accounts receivable consisted of the following:
|
|
|
June 30, 2018 |
|
|
December 31, 2017 |
|
||||||||||
|
Customer |
|
Accounts Receivable Amount |
|
|
% of Total Accounts Receivable Amount |
|
|
Accounts Receivable Amount |
|
|
% of Total Accounts Receivable Amount |
|
||||
|
US Bioservices |
|
$ |
955,450 |
|
|
|
56 |
% |
|
$ |
— |
|
|
— |
|
|
|
ASD Healthcare |
|
|
584,798 |
|
|
|
34 |
% |
|
|
— |
|
|
— |
|
|
|
Others |
|
|
161,273 |
|
|
|
10 |
% |
|
|
26,814 |
|
|
|
100 |
% |
|
Total |
|
$ |
1,701,521 |
|
|
|
|
|
|
$ |
26,814 |
|
|
|
|
|
Inventories — All of the raw material purchased during the six months ended June 30, 2018 and for the year ended December 31, 2017 were purchased from one vendor. The below table presents inventory by category:
|
Inventories by category |
|
June 30, 2018 |
|
|
December 31, 2017 |
|
||
|
Raw materials and components |
|
$ |
182,746 |
|
|
$ |
— |
|
|
Work-in-process |
|
|
828,621 |
|
|
|
124,801 |
|
|
Finished goods |
|
|
1,423,474 |
|
|
|
500,498 |
|
|
Total |
|
$ |
2,434,841 |
|
|
$ |
625,299 |
|
Advertising cost — Advertising costs are expensed as incurred. Advertising costs for the three months ended June 30, 2018 and 2017 were $35,503 and $8,807, respectively. Advertising costs for the six months ended June 30, 2018 and 2017 were $59,904 and $17,198, respectively.
7
Marketable securities— The Company’s marketable securities consist of four securities; (a) 39,250 shares of capital stock of CellSeed, Inc. (“CellSeed”) which are part of 147,100 shares acquired in January 2009 for ¥100,028,000 Japanese Yen (JPY) (equivalent to $1.1 million USD), at ¥680 JPY per share; (b) 849,744 shares of capital stock of KPM Tech Co., Ltd. (“KPM”) which were acquired in October 2016 for ₩14,318,186,400 South Korean Won (KRW) (equivalent to $13.0 million USD) at ₩16,850 KRW per share; (c) 271,950 shares of capital stock of Hanil Vacuum Co., Ltd. (“Hanil”) which were acquired in October 2016 for ₩1,101,397,500 KRW (equivalent to $1.0 million USD) at ₩4,050 KRW per share; and (d) 6,643,559 shares of capital stock of Telcon, Inc. (“Telcon”) which were acquired in July 2017 for ₩36,001,446,221 KRW (equivalent to $31.8 million USD) at ₩5,419 KRW per share.
As of June 30, 2018 and December 31, 2017, the closing prices per share for CellSeed on the Tokyo Stock Exchange were ¥961 ($8.68 USD) and ¥462 JPY ($4.10 USD), respectively, the closing prices per share for KPM on the Korean Securities Dealers Automated Quotations (“KOSDAQ”) were ₩1,790 ($1.61 USD) and ₩1,625 KRW ($1.52 USD), respectively, after giving effect to a 1-for-5 reverse stock split effected on June 28, 2017, respectively, the closing prices per share for Hanil on KOSDAQ were ₩1.995 ($1.79 USD) and ₩2,830 KRW ($2.65 USD), respectively, and the closing prices per share for Telcon on KOSDAQ were ₩9,850 ($8.84 USD) and ₩14,900 KRW ($13.95 USD), respectively.
As of June 30, 2018 and December 31, 2017, 39,250 shares of CellSeed common stock were pledged to secure a $300,000 convertible note of the Company issued to Mitsubishi UFJ Capital III Limited Partnership that is due on demand and were classified as current assets, as marketable securities, pledged to creditor. In addition, 6,643,559 shares of Telcon and 4,248,720 shares of KPM Tech were pledged to secure the API Supply Agreement (see Note 8) in which Emmaus received $31,800,000 related to a trade advance discount. These shares were classified as current assets, as investment in marketable securities.
Prepaid expenses and other current assets — Prepaid expenses and other current assets consisted of the following at June 30, 2018 and December 31, 2017:
|
|
|
June 30, 2018 |
|
|
December 31, 2017 |
|
||
|
|
$ |
72,756 |
|
|
$ |
132,387 |
|
|
|
Other prepaid expenses and current assets |
|
|
144,405 |
|
|
|
157,984 |
|
|
Total prepaid expenses |
|
$ |
217,161 |
|
|
$ |
290,371 |
|
Other long-term liabilities—Other long-term liabilities consisted of the following at June 30, 2018 and December 31, 2017:
|
|
|
June 30, 2018 |
|
|
December 31, 2017 |
|
||
|
Trade discount |
|
$ |
31,841,500 |
|
|
$ |
31,841,500 |
|
|
Unearned revenue |
|
|
10,000,000 |
|
|
|
5,000,000 |
|
|
Other long-term liabilities |
|
|
— |
|
|
|
10,790 |
|
|
Total other long-term liabilities |
|
$ |
41,841,500 |
|
|
$ |
36,852,290 |
|
The Company has entered into an API Supply Agreement (the “API Agreement”) with Telcon pursuant to which Telcon advanced to the Company approximately ₩36.0 billion KRW (approximately $31.8 million USD) as a trade discount to supply 25% of the Company’s requirements for bulk containers of pharmaceutical grade L-glutamine (“PGLG”) for a term of five years, with 10 one-year renewal terms. The agreement will automatically renew unless terminated by either party in writing. The agreement does not include yearly purchase commitments or margin guarantees. The advance trade discount shall be applied against purchases made by the Company from Telcon over the life of the agreement.
Fair value measurements — The following table presents the activity for those items measured at fair value on a recurring basis using Level 3 inputs during the six months ended June 30, 2018 and the year ended December 31, 2017:
|
|
|
Six Months Ended |
|
|
Year Ended |
|
||
|
|
June 30, 2018 |
|
|
December 31, 2017 |
|
|||
|
Balance, beginning of period |
|
$ |
26,377,000 |
|
|
$ |
10,600,000 |
|
|
Repurchased |
|
|
(6,186,000 |
) |
|
|
— |
|
|
Change in fair value included in the statement of comprehensive loss |
|
|
(580,000 |
) |
|
|
15,777,000 |
|
|
Balance, end of period |
|
$ |
19,611,000 |
|
|
$ |
26,377,000 |
|
The value of the liability classified warrants, the value of warrant derivative liabilities and the change in fair value of the liability classified warrants and warrant derivative liabilities were determined using a Binomial Monte-Carlo Cliquet (aka “Ratchet”) Option Pricing Model. The model is similar to traditional Black-Scholes-type option pricing models, except that the exercise price
8
resets at certain dates in the future. The values as of June 30, 2018, December 31, 2017 and the initial value as of September 11, 2013 were calculated based on the following assumptions:
|
|
|
June 30, 2018 |
|
|
March 31, 2018 |
|
|
December 31, 2017 |
|
|
December 31, 2016 |
|
|
December 31, 2015 |
|
|
December 31, 2014 |
|
|
December 31, 2013 |
|
|
Initial Value |
|
||||||||
|
|
$ |
11.30 |
|
|
$ |
11.20 |
|
|
$ |
11.40 |
|
|
$ |
6.00 |
|
|
$ |
4.70 |
|
|
$ |
4.90 |
|
|
$ |
3.60 |
|
|
$ |
3.60 |
|
|
|
Risk‑free interest rate |
|
|
1.88 |
% |
|
|
2.06 |
% |
|
|
1.62 |
% |
|
|
1.09 |
% |
|
|
1.23 |
% |
|
|
1.38 |
% |
|
|
1.75 |
% |
|
|
1.72 |
% |
|
Expected volatility (peer group) |
|
|
49.80 |
% |
|
|
57.10 |
% |
|
|
55.80 |
% |
|
|
68.30 |
% |
|
|
64.10 |
% |
|
|
71.50 |
% |
|
|
63.20 |
% |
|
|
72.40 |
% |
|
Expected life (in years) |
|
|
0.20 |
|
|
|
0.45 |
|
|
|
0.70 |
|
|
|
1.70 |
|
|
|
2.70 |
|
|
|
3.70 |
|
|
|
4.70 |
|
|
|
5.00 |
|
|
Expected dividend yield |
|
— |
|
|
— |
|
|
— |
|
|
— |
|
|
— |
|
|
— |
|
|
— |
|
|
— |
|
||||||||
|
Number outstanding |
|
|
2,508,501 |
|
|
|
2,520,501 |
|
|
|
3,320,501 |
|
|
|
3,320,501 |
|
|
|
3,320,501 |
|
|
|
3,320,501 |
|
|
|
3,320,501 |
|
|
|
3,320,501 |
|
|
Balance, end of period: |
|
|
|
|
|
|
|
|
|
|
|
|
|
|
|
|
|
|
|
|
|
|
|
|
|
|
|
|
|
|
|
|
|
Liability classified warrants |
|
$ |
— |
|
|
$ |
— |
|
|
$ |
— |
|
|
$ |
— |
|
|
$ |
— |
|
|
$ |
3,206,000 |
|
|
$ |
6,517,000 |
|
|
$ |
7,541,000 |
|
|
Warrant derivative liabilities |
|
$ |
19,611,000 |
|
|
$ |
19,491,000 |
|
|
$ |
26,377,000 |
|
|
$ |
10,600,000 |
|
|
$ |
7,863,000 |
|
|
$ |
6,520,000 |
|
|
$ |
— |
|
|
$ |
— |
|
The following table presents warrants issued to GPB Debt Holdings II, LLC as described in Note 7 measured at fair value as of June 30, 2018:
|
|
|
Six Months Ended June 30, 2018 |
|
|
Year Ended December 31, 2017 |
|
||||||||||
|
|
Warrants |
|
|
Embedded Conversion Option |
|
|
Warrants |
|
|
Embedded Conversion Option |
|
|||||
|
Balance, beginning of period |
|
$ |
1,882,000 |
|
|
$ |
1,289,000 |
|
|
$ |
— |
|
|
$ |
— |
|
|
Fair value at issuance date |
|
|
— |
|
|
|
— |
|
|
|
1,882,000 |
|
|
|
1,289,000 |
|
|
Change in fair value included in the statement of comprehensive loss |
|
|
(315,000 |
) |
|
|
(466,000 |
) |
|
|
— |
|
|
|
— |
|
|
Extinguished upon debt repayment |
|
|
— |
|
|
|
(823,000 |
) |
|
|
— |
|
|
|
— |
|
|
Balance, end of period |
|
$ |
1,567,000 |
|
|
$ |
— |
|
|
$ |
1,882,000 |
|
|
$ |
1,289,000 |
|
Debt and related party debt — The following table presents the effective interest rates on loans originated and refinanced in the respective periods that either had a beneficial conversion feature or an attached warrant:
|
Type of Loan |
|
Term of Loan |
|
Stated Annual Interest |
|
|
Original Loan Principal Amount |
|
|
Conversion Rate |
|
Beneficial Conversion Discount Amount |
|
|
Warrants Issued with Notes |
|
|
Exercise Price |
|
|
Warrant FMV Discount Amount |
|
Effective Interest Rate Including Discounts |
||||||
|
2017 convertible notes payable |
|
Due on demand - 3 years |
|
10% - 13.5% |
|
|
$ |
36,113,296 |
|
|
$3.50 - $10.31 |
|
$ |
11,678,725 |
|
|
|
240,764 |
|
|
$ |
10.80 |
|
|
$ |
1,882,000 |
|
10% - 110% |
|
|
2018 convertible notes payable |
|
Due on demand - 2 years |
|
10% |
|
|
|
22,894,055 |
|
|
$3.50 - $10.00 |
|
|
9,220,856 |
|
|
|
— |
|
|
|
— |
|
|
|
— |
|
22% - 110% |
|
|
|
|
|
|
|
|
|
|
$ |
59,007,351 |
|
|
|
|
$ |
20,899,581 |
|
|
|
240,764 |
|
|
|
|
|
|
$ |
1,882,000 |
|
|
Related party notes are disclosed as separate line items in the Company’s consolidated balance sheets.
Renenues, net — For the three months ended June 30, 2018 and 2017, the Company earned revenue from customers as outlined in the table below:
|
Customer |
|
Revenue for the Three Months Ended June 30, 2018 |
|
|
% of Total Revenue for the Three Months Ended June 30, 2018 |
|
|
Revenue for the Three Months Ended June 30, 2017 |
|
|
% of Total Revenue for the Three Months Ended June 30, 2017 |
|
||||
|
US Bioservices |
|
$ |
2,288,975 |
|
|
|
89 |
% |
|
$ |
— |
|
|
— |
|
|
|
Johnson Chemical Pharmaceutical Works Co. Ltd. |
|
|
137,722 |
|
|
|
5 |
% |
|
|
49,467 |
|
|
|
42 |
% |
|
Others |
|
|
144,400 |
|
|
|
6 |
% |
|
|
69,174 |
|
|
|
58 |
% |
|
Total |
|
$ |
2,571,097 |
|
|
|
|
|
|
$ |
118,641 |
|
|
|
|
|
9
For the six months ended June 30, 2018 and 2017, the Company earned revenue from customers as outlined in the table below:
|
Customer |
|
Revenue for the Six Months Ended June 30, 2018 |
|
|
% of Total Revenue for the Six Months Ended June 30, 2018 |
|
|
Revenue for the Six Months Ended June 30, 2017 |
|
|
% of Total Revenue for the Six Months Ended June 30, 2017 |
|
||||
|
US Bioservices |
|
$ |
2,949,894 |
|
|
|
88 |
% |
|
$ |
— |
|
|
— |
|
|
|
Johnson Chemical Pharmaceutical Works Co. Ltd. |
|
|
163,822 |
|
|
|
5 |
% |
|
|
113,767 |
|
|
|
50 |
% |
|
Others |
|
|
238,695 |
|
|
|
7 |
% |
|
|
112,351 |
|
|
|
50 |
% |
|
Total |
|
$ |
3,352,411 |
|
|
|
|
|
|
$ |
226,118 |
|
|
|
|
|
Net loss per share — As of June 30, 2018 and 2017, respectively, potentially dilutive securities exercisable or convertible into 17,143,773 and 15,568,835 shares of Company common stock were outstanding. No potentially dilutive securities were included in the calculation of diluted net loss per share since their effect would be anti-dilutive for all periods presented.
Recent accounting pronouncements—In January 2016, the Financial Accounting Standards Board (“FASB”) issued Accounting Standards Update (“ASU”) No. 2016-01, Recognition and Measurement of Financial Assets and Financial Liabilities. The amendments applicable to the Company in this Update (1) supersede the guidance to classify equity securities, except equity method securities, with readily determinable fair values into trading or available-for-sale categories and require equity securities to be measured at fair value with changes in the fair value recognized through net income, (2) allow equity investments that do not have readily determinable fair values to be remeasured at fair value either upon the occurrence of an observable price change or upon identification of an impairment, (3) require assessment for impairment of equity investments without readily determinable fair values qualitatively at each reporting period, (4) eliminate the requirement to disclose the methods and significant assumptions used in calculating the fair value of financial instruments required to be disclosed for financial instruments measured at amortized cost on the balance sheet, (5) require public business entities to use the exit price notion when measuring the fair value of financial instruments for disclosure purposes, (6) require separate presentation of financial assets and financial liabilities by measurement category and form of financial asset (that is, securities or loans and receivables) on the balance sheet or the accompanying notes to the financial statements, (7) clarify that an entity should evaluate the need for a valuation allowance on a deferred tax asset related to available-for-sale securities in combination with the entity’s other deferred tax assets. This Update was effective beginning January 1, 2018 and the Company is now recognizing any changes in the fair value of certain equity investments in net income as prescribed by the new standard rather than in other comprehensive income. The Company recognized a cumulative effect adjustment to increase the opening balance of retained earnings as of January 1, 2018 by $41.4 million, net of $12.3 million income tax benefit. Refer to Note 4 for additional disclosures required by this ASU.
In February 2016, the FASB issued ASU No. 2016-02, Leases. The amendments in this Update require a lessee to recognize in the statement of financial position a liability to make lease payments (the lease liability) and a right-of-use asset representing its right to use the underlying asset for the lease term for all leases with terms greater than twelve months. For leases less than twelve months, an entity is permitted to make an accounting policy election by class of underlying asset not to recognize lease assets and lease liabilities. If a lessee makes this election, it should recognize lease expense for such leases generally on a straight-line basis over the lease term. The amendments in this Update are effective for the Company for fiscal years beginning after December 15, 2018, including interim periods within those years, with early adoption permitted. The Company is currently in the process of evaluating the impact of adoption of the amendments in this Update on the Company’s consolidated financial position and results of operations; however, adoption of the amendments in this Update are expected to be material for most entities who have a material lease with a term of greater than twelve months.
In April 2016, the FASB issued ASU 2016-10, Revenue from Contracts with Customers (Topic 606): Identifying Performance Obligations and Licensing (“ASU 2016-10”). The amendments in ASU 2016-10 clarify identification of performance obligations and licensing implementation. The amendments do not change the core principle of the guidance in Topic 606. The effective date and transition requirements for the amendments are the same as the effective date and transition requirements in Topic 606: For public companies, this Update is effective for annual periods, including interim periods within those annual periods, beginning after December 15, 2017. The Company adopted the new revenue standard as of January 1, 2018 using the modified retrospective transition method. The adoption of ASC 606 did not have a material impact on the measurement nor on the recognition of revenue of contracts for which all revenue had not been recognized as of January 1, 2018, therefore no cumulative adjustment has been made to the opening balance of accumulated deficit at the beginning of 2018. The comparative information has not been restated and continues to be reported under the accounting standards in effect for the period presented.
In July 2017, the FASB issued ASU No. 2017-11, Earnings Per Share (Topic 260) Distinguishing Liabilities from Equity (Topic 480) Derivatives and Hedging (Topic 815): I. Accounting for Certain Financial Instruments with Down Round Features, II.
10
Replacement of the Indefinite Deferral for Mandatorily Redeemable Financial Instruments of Certain Nonpublic Entities and Certain Mandatorily Redeemable Noncontrolling Interests with a Scope Exception. The amendments in this guidance intended to reduce the complexity associated with the issuer’s accounting for certain financial instruments with characteristics of liabilities and equity. Specifically, the Board determined that a down round feature (as defined) would no longer cause a freestanding equity-linked financial instrument (or an embedded conversion option) to be accounted for as a derivative liability at fair value with changes in fair value recognized in current earnings. In addition, the Board re-characterized the indefinite deferral of certain provisions of Topic 480 to a scope exception. The re-characterization has no accounting effect. Down round features will no longer cause freestanding equity-linked financial instruments and embedded conversion options to be considered “not indexed to an entity’s own stock.” ASU 2017-11 is effective for public business entities in 2019. All others have an additional year. Early adoption is permitted for all entities, including in an interim period. Entities may use the retrospective or modified retrospective transition method. The Company is currently assessing the impact the adoption of ASU 2017-11 will have on its consolidated financial statements.
In February 2018, the FASB issued ASU No. 2018-02, Income Statement – Reporting Comprehensive Income (Topic 220): Reclassification of Certain Tax Effects from Accumulated Other Comprehensive Income (“ASU 2018-02”). ASU 2018-02 allows a reclassification from accumulated other comprehensive income to retained earnings for stranded tax effects resulting from the Tax Cuts and Jobs Act. Consequently, the amendments eliminate the stranded tax effects resulting from the Tax Cuts and Jobs Act and will improve the usefulness of information reported to financial statement users. However, because the amendments only relate to the reclassification of the income tax effects of the Tax Cuts and Jobs Act, the underlying guidance that requires that the effect of a change in tax laws or rates be included in income from continuing operations is not affected. The ASU also requires certain disclosures about stranded tax effects. ASU 2018-02 is effective for all entities for fiscal years beginning after December 15, 2018, and interim periods within those fiscal years, with early adoption permitted. ASU 2018-02 should be applied either in the period of adoption or retrospectively to each period (or periods) in which the effect of the change in the U.S. federal corporate income tax rate in the Tax Cuts and Jobs Act is recognized. The Company is currently assessing the impact the adoption of ASU 2018-02 will have on its consolidated financial statements.
In February 2018, the FASB issued ASU No. 2018-03, Technical Corrections and Improvements to Financial Instruments—Overall (Subtopic 825-10): Recognition and Measurement of Financial Assets and Financial Liabilities (“ASU 2018-03”). The amendments in this Update (1) clarify that an entity measuring an equity security using the measurement alternative may change its measurement approach to a fair value method in accordance with Topic 820, Fair Value Measurement, through an irrevocable election that would apply to that security and all identical or similar investments of the same issuer, (2) clarify that the adjustments made under the measurement alternative are intended to reflect the fair value of the security as of the date that the observable transaction for a similar security took place, (3) clarify that remeasuring the entire value of forward contracts and purchased options is required when observable transactions occur on the underlying equity securities, (4) clarify that when the fair value option is elected for a financial liability, the guidance in paragraph 825-10- 45-5 should be applied, regardless of whether the fair value option was elected under either Subtopic 815-15, Derivatives and Hedging— Embedded Derivatives, or 825- 10, Financial Instruments— Overall, (5) clarify that for financial liabilities for which the fair value option is elected, the amount of change in fair value that relates to the instrument specific credit risk should first be measured in the currency of denomination when presented separately from the total change in fair value of the financial liability, and then both components of the change in the fair value of the liability should be remeasured into the functional currency of the reporting entity using end-of-period spot rates, (6) clarify that the prospective transition approach for equity securities without a readily determinable fair value in the amendments in ASU 2016-01 is meant only for instances in which the measurement alternative is applied. For public business entities, ASU 2018-03 is effective for fiscal years beginning after December 15, 2017, and interim periods within those fiscal years beginning after June 15, 2018. Public business entities with fiscal years beginning between December 15, 2017, and June 15, 2018, are not required to adopt these amendments until the interim period beginning after June 15, 2018, and public business entities with fiscal years beginning between June 15, 2018, and December 15, 2018, are not required to adopt these amendments before adopting the amendments in ASU 2016-01. The impact of the adoption of the amendments in this Update will depend on the amount of equity securities and financial instruments subject to the amendments in this Update held by the Company at the time of adoption.
NOTE 3 — PROPERTY AND EQUIPMENT
Property and equipment consisted of the following at:
|
|
|
June 30, 2018 |
|
|
December 31, 2017 |
|
||
|
|
$ |
269,009 |
|
|
$ |
225,615 |
|
|
|
Leasehold improvements |
|
|
66,312 |
|
|
|
61,054 |
|
|
Furniture and fixtures |
|
|
79,001 |
|
|
|
74,090 |
|
|
Subtotal |
|
|
414,322 |
|
|
|
360,759 |
|
|
Less: accumulated depreciation |
|
|
(276,277 |
) |
|
|
(255,457 |
) |
|
Total |
|
$ |
138,045 |
|
|
$ |
105,302 |
|
11
During the three months ended June 30, 2018 and 2017, depreciation expense was $7,693 and $4,049, respectively. During the six months ended June 30, 2018 and 2017, depreciation expense was $20,748 and $9,357, respectively.
NOTE 4 — INVESTMENTS
Equity Securities—Effective January 1, 2018, the Company adopted ASU 2016-01 which requires the Company to measure all equity investments that do not result in consolidation and are not accounted for under the equity method at fair value and recognize any changes in earnings. The Company use quoted market prices to determine the fair value of equity securities with readily determinable fair values. For equity securities without readily determinable fair values, the Company has elected the measurement alternative under which the Company measures these investments at cost minus impairment, if any, plus or minus changes resulting from observable price changes in orderly transactions for the identical or a similar investment of the same issuer. Management assesses each of these investments on an individual basis. Additionally, on a quarterly basis, management is required to make a qualitative assessment of whether the investment is impaired. During the six months ended June 30, 2018, the Company did not recognize any fair value adjustments for equity securities without readily determinable fair values. The Company recognized a cumulative effect adjustment of $41.4 million, net of $12.3 million income tax benefit, to increase the opening balance of retained earnings with an offset to accumulated other comprehensive income as of January 1, 2018, in connection with the adoption of ASU 2016-01.
For fiscal periods beginning prior to January 1, 2018, marketable equity securities not accounted for under the equity method were classified as available-for-sale. There were no marketable equity securities classified as trading. For equity securities classified as available-for-sale, realized gains and losses were included in net loss. Unrealized gains and losses on equity securities classified as available-for-sale were recognized in accumulated other comprehensive income (loss), net of deferred taxes. In addition, the Company had equity securities without readily determinable fair values that were recorded at cost. For these cost method investments, the Company recorded dividend income, if any, when applicable dividends were declared. Cost method investments were reported as other investments in our consolidated balance sheets, and dividend income from cost method investments was reported in other income (loss) net in our consolidated statements of comprehensive loss. The Company reviewed all of its cost method investments quarterly to determine if impairment indicators were present; however, the Company was not required to determine the fair value of these investments unless impairment indicators existed. When impairment indicators did exist, the Company generally used discounted cash flow analyses to determine the fair value. The Company estimated that the fair values of its cost method investments approximated their carrying values as of December 31, 2017. The Company’s cost method investments had a carrying value of $65,520 as of December 31, 2017.
As of June 30, 2018, the carrying values of our equity securities were included in the following line items in our consolidated balance sheets:
|
|
At June 30, 2018 |
|
||||||
|
|
|
Fair Value with Changes Recognized in Income |
|
|
Measurement Alternative - No Readily Determinable Fair Value |
|
||
|
Marketable securities |
|
$ |
66,348,007 |
|
|
$ |
— |
|
|
Other investments |
|
|
— |
|
|
|
538,202 |
|
|
Total equity securities |
|
$ |
66,348,007 |
|
|
$ |
538,202 |
|
The calculation of net unrealized gains and losses for the period that relate to equity securities still held at June 30, 2018 is as follows:
|
|
|
Six Months Ended June 30, 2018 |
|
|
|
Net losses recognized during the period related to equity securities |
|
$ |
(33,649,314 |
) |
|
Less: Net gain (loss) recognized during the period related to equity securities sold during the period |
|
|
— |
|
|
Unrealized gain (loss) recognized during the period related to equity securities still held at the end of the period |
|
$ |
(33,649,314 |
) |
12
As of December 31, 2017, equity securities consisted of the following:
|
|
|
|
|
|
Gross Unrealized |
|
|
Estimated |
|
|||||||
|
|
|
Cost |
|
|
Gains |
|
|
Losses |
|
|
Fair Value |
|
||||
|
Trading securities |
|
$ |
— |
|
|
$ |
— |
|
|
$ |
— |
|
|
$ |
— |
|
|
Available-for-sale securities |
|
|
46,209,017 |
|
|
|
60,812,231 |
|
|
|
(6,958,406 |
) |
|
|
100,062,842 |
|
|
Total equity securities |
|
$ |
46,209,017 |
|
|
$ |
60,812,231 |
|
|
$ |
(6,958,406 |
) |
|
$ |
100,062,842 |
|
As of December 31, 2017, the Company had investments classified as available-for-sale in which our cost basis exceeded the fair value of our investment. Management assessed each of the investment in marketable securities that were in a gross unrealized loss position on an individual basis to determine if the decline in fair value was other than temporary. Management's assessment as to the nature of a decline in fair value is based on, among other things, the length of time and the extent to which the market value has been less than our cost basis; the financial condition and near-term prospects of the issuer; and our intent and ability to retain the investment for a period of time sufficient to allow for any anticipated recovery in market value. As a result of these assessments, management determined that the decline in fair value of these investments was not other than temporary and did not record any impairment charges.
As of December 31, 2017, the fair values of our equity securities were included in the following line items in our consolidated balance sheets:
|
|
|
Available-for-Sale Securities |
|
|
|
Marketable securities |
|
$ |
99,997,322 |
|
|
Long-term investment at cost |
|
|
65,520 |
|
|
Total equity securities |
|
$ |
100,062,842 |
|
There were no sales of available-for-sale equity securities during the six months ended June 30, 2018.
NOTE 5 — ACCOUNTS PAYABLE AND ACCRUED EXPENSES
Accounts payable and accrued expenses consisted of the following at:
|
|
June 30, 2018 |
|
|
December 31, 2017 |
|
|||
|
Accounts payable: |
|
|
|
|
|
|
|
|
|
Regulatory fees |
|
$ |
— |
|
|
$ |
715,999 |
|
|
Clinical and regulatory expenses |
|
|
112,130 |
|
|
|
116,736 |
|
|
Commercialization consulting fees |
|
|
13,574 |
|
|
|
30,000 |
|
|
Manufacturing cost |
|
|
496,494 |
|
|
|
217,155 |
|
|
Legal expenses |
|
|
106,832 |
|
|
|
87,701 |
|
|
Consulting fees |
|
|
365,285 |
|
|
|
147,038 |
|
|
Accounting fees |
|
|
54,012 |
|
|
|
67,293 |
|
|
Selling expenses |
|
|
1,249,502 |
|
|
|
35,383 |
|
|
Investor relations and public relations expenses |
|
|
12,750 |
|
|
|
45,526 |
|
|
Board member compensation |
|
|
183,333 |
|
|
|
11,200 |
|
|
Other vendors |
|
|
391,774 |
|
|
|
125,605 |
|
|
Total accounts payable |
|
|
2,985,686 |
|
|
|
1,599,636 |
|
|
Accrued interest payable, related parties |
|
|
568,730 |
|
|
|
318,120 |
|
|
Accrued interest payable |
|
|
1,622,275 |
|
|
|
1,449,154 |
|
|
Accrued expenses: |
|
|
|
|
|
|
|
|
|
Wages and payroll taxes payable |
|
|
110,964 |
|
|
|
1,711,541 |
|
|
Deferred salary |
|
|
291,667 |
|
|
|
291,667 |
|
|
Paid vacation payable |
|
|
241,071 |
|
|
|
186,978 |
|
|
Other accrued expenses |
|
|
157,938 |
|
|
|
138,214 |
|
|
Total accrued expenses |
|
|
801,640 |
|
|
|
2,328,400 |
|
|
Total accounts payable and accrued expenses |
|
$ |
5,978,331 |
|
|
$ |
5,695,310 |
|
13
Notes payable consisted of the following at June 30, 2018 and December 31, 2017:
|
Year Issued |
|
Interest Rate Range |
|
|
Term of Notes |
|
Conversion Price |
|
|
Principal Outstanding June 30, 2018 |
|
|
Discount Amount June 30, 2018 |
|
|
Carrying Amount June 30, 2018 |
|
|
Shares Underlying Notes June 30, 2018 |
|
|
Principal Outstanding December 31, 2017 |
|
|
Discount Amount December 31, 2017 |
|
|
Carrying Amount December 31, 2017 |
|
|
Shares Underlying Notes December 31, 2017 |
|
||||||||||
|
Notes payable |
|
|
|
|
|
|
|
|
|
|
|
|
|
|
|
|
|
|
|
|
|
|
|
|
|
|
|
|
|
|
|
|
|
|||||||||
|
2013 |
|
10% |
|
|
Due on demand |
|
|
— |
|
|
$ |
903,100 |
|
|
$ |
— |
|
|
$ |
903,100 |
|
|
|
— |
|
|
$ |
887,600 |
|
|
$ |
— |
|
|
$ |
887,600 |
|
|
|
— |
|
|
|
2015 |
|
10% |
|
|
Due on demand |
|
|
— |
|
|
|
10,000 |
|
|
|
— |
|
|
|
10,000 |
|
|
|
— |
|
|
|
— |
|
|
|
— |
|
|
|
— |
|
|
|
— |
|
|
|
2016 |
|
10% - 11% |
|
|
Due on demand |
|
|
— |
|
|
|
843,335 |
|
|
|
— |
|
|
|
843,335 |
|
|
|
— |
|
|
|
833,335 |
|
|
|
— |
|
|
|
833,335 |
|
|
|
— |
|
|
|
2017 |
|
11% |
|
|
Due on demand |
|
|
— |
|
|
|
2,568,548 |
|
|
|
— |
|
|
|
2,568,548 |
|
|
|
— |
|
|
|
6,150,208 |
|
|
|
— |
|
|
|
6,150,208 |
|
|
|
— |
|
|
|
2018 |
|
11% |
|
|
Due on demand |
|
|
— |
|
|
|
111,000 |
|
|
|
— |
|
|
|
111,000 |
|
|
|
— |
|
|
|
— |
|
|
|
— |
|
|
|
— |
|
|
|
— |
|
|
|
|
|
|
|
|
|
|
|
|
|
|
|
$ |
4,435,983 |
|
|
$ |
— |
|
|
$ |
4,435,983 |
|
|
|
— |
|
|
$ |
7,871,143 |
|
|
$ |
— |
|
|
$ |
7,871,143 |
|
|
|
— |
|
|
|
|
|
|
|
|
|
|
|
|
|
|
|
|
|
|
|
|
|
|
|
|
|
|
|
|
|
|
|
|
|
|
|
|
|
|
|
|
|
|
|
|
|
|
|
|
|
|
|
|
Current |
|
|
|
|
|
$ |
4,435,983 |
|
|
$ |
— |
|
|
$ |
4,435,983 |
|
|
|
— |
|
|
$ |
7,871,143 |
|
|
$ |
— |
|
|
$ |
7,871,143 |
|
|
|
— |
|
|
|
|
|
|
|
|
Non-current |
|
|
|
|
|
$ |
— |
|
|
$ |
— |
|
|
$ |
— |
|
|
|
— |
|
|
$ |
— |
|
|
$ |
— |
|
|
$ |
— |
|
|
|
— |
|
|
Notes payable - related party |
|
|
|
|
|
|
|
|
|
|
|
|
|
|
|
|
|
|
|
|
|
|
|
|
|
|
|
|
|
|
|
|
|
|||||||||
|
2015 |
|
11% |
|
|
Due on demand |
|
|
— |
|
|
|
— |
|
|
|
— |
|
|
|
— |
|
|
|
— |
|
|
|
310,000 |
|
|
|
— |
|
|
|
310,000 |
|
|
|
— |
|
|
|
2016 |
|
10% |
|
|
Due on demand |
|
|
— |
|
|
|
270,000 |
|
|
|
— |
|
|
|
270,000 |
|
|
|
— |
|
|
|
810,510 |
|
|
|
— |
|
|
|
810,510 |
|
|
|
— |
|
|
|
2017 |
|
10% |
|
|
Due on demand |
|
|
— |
|
|
|
915,751 |
|
|
|
— |
|
|
|
915,751 |
|
|
|
— |
|
|
|
915,751 |
|
|
|
— |
|
|
|
915,751 |
|
|
|
— |
|
|
|
2018 |
|
11% |
|
|
Due on demand |
|
|
— |
|
|
|
159,222 |
|
|
|
— |
|
|
|
159,222 |
|
|
|
— |
|
|
|
— |
|
|
|
— |
|
|
|
— |
|
|
|
— |
|
|
|
|
|
|
|
|
|
|
|
|
|
|
|
$ |
1,344,973 |
|
|
$ |
— |
|
|
$ |
1,344,973 |
|
|
|
— |
|
|
$ |
2,036,261 |
|
|
$ |
— |
|
|
$ |
2,036,261 |
|
|
|
— |
|
|
|
|
|
|
|
|
|
|
|
|
|
|
|
|
|
|
|
|
|
|
|
|
|
|
|
|
|
|
|
|
|
|
|
|
|
|
|
|
|
|
|
|
|
|
|
|
|
|
|
|
Current |
|
|
|
|
|
$ |
1,344,973 |
|
|
$ |
— |
|
|
$ |
1,344,973 |
|
|
|
— |
|
|
$ |
2,036,261 |
|
|
$ |
— |
|
|
$ |
2,036,261 |
|
|
|
— |
|
|
|
|
|
|
|
|
Non-current |
|
|
|
|
|
$ |
— |
|
|
$ |
— |
|
|
$ |
— |
|
|
|
— |
|
|
$ |
— |
|
|
$ |
— |
|
|
$ |
— |
|
|
|
— |
|
|
Convertible notes payable |
|
|
|
|
|
|
|
|
|
|
|
|
|
|
|
|
|
|
|
|
|
|
|
|
|
|
|
|
|
|
|
|
|
|||||||||
|
2011 |
|
10% |
|
|
5 years |
|
$ |
3.05 |
|
|
$ |
300,000 |
|
|
$ |
— |
|
|
$ |
300,000 |
|
|
|
98,285 |
|
|
$ |
300,000 |
|
|
$ |
— |
|
|
$ |
300,000 |
|
|
|
98,285 |
|
|
|
2014 |
|
10% |
|
|
Due on demand - 2 years |
|
$3.05 - $3.60 |
|
|
|
504,482 |
|
|
|
— |
|
|
|
504,482 |
|
|
|
176,720 |
|
|
|
486,878 |
|
|
|
— |
|
|
|
486,878 |
|
|
|
168,766 |
|
||
|
2016 |
|
10% |
|
|
1 year - 2 years |
|
$3.60 - $4.50 |
|
|
|
182,495 |
|
|
|
18,256 |
|
|
|
164,239 |
|
|
|
54,790 |
|
|
|
1,516,329 |
|
|
|
83,298 |
|
|
|
1,433,031 |
|
|
|
441,048 |
|
||
|
2017 |
|
10% |
|
|
Due on demand - 2 years |
|
$3.50 - $10.00 |
|
|
|
5,256,547 |
|
|
|
1,852,916 |
|
|
|
3,403,631 |
|
|
|
1,409,247 |
|
|
|
36,113,296 |
|
|
|
11,232,423 |
|
|
|
24,880,873 |
|
|
|
5,357,488 |
|
||
|
2018 |
|
10% |
|
|
Due on demand - 2 years |
|
$3.50 - $10.00 |
|
|
|
13,494,055 |
|
|
|
4,660,330 |
|
|
|
8,833,725 |
|
|
|
3,611,398 |
|
|
|
— |
|
|
|
— |
|
|
|
— |
|
|
|
— |
|
||
|
|
|
|
|
|
|
|
|
|
|
|
|
$ |
19,737,579 |
|
|
$ |
6,531,502 |
|
|
$ |
13,206,077 |
|
|
|
5,350,440 |
|
|
$ |
38,416,503 |
|
|
$ |
11,315,721 |
|
|
$ |
27,100,782 |
|
|
|
6,065,587 |
|
|
|
|
|
|
|
|
|
|
|
|
|
|
|
|
|
|
|
|
|
|
|
|
|
|
|
|
|
|
|
|
|
|
|
|
|
|
|
|
|
|
|
|
|
|
|
|
|
|
|
|
Current |
|
|
|
|
|
$ |
13,230,978 |
|
|
$ |
5,060,562 |
|
|
$ |
8,170,416 |
|
|
|
3,552,804 |
|
|
$ |
12,860,912 |
|
|
$ |
5,835,910 |
|
|
$ |
7,025,002 |
|
|
|
3,449,984 |
|
|
|
|
|
|
|
|
Non-current |
|
|
|
|
|
$ |
6,506,601 |
|
|
$ |
1,470,940 |
|
|
$ |
5,035,661 |
|
|
|
1,797,636 |
|
|
$ |
25,555,591 |
|
|
$ |
5,479,811 |
|
|
$ |
20,075,780 |
|
|
|
2,615,603 |
|
|
Convertible notes payable - related party |
|
|
|
|
|
|
|
|
|
|
|
|
|
|
|
|
|
|
|
|
|
|
|
|
|
|
|
|
|
|
|
|
|
|||||||||
|
2012 |
|
10% |
|
|
Due on demand |
|
$ |
3.30 |
|
|
$ |
200,000 |
|
|
$ |
— |
|
|
$ |
200,000 |
|
|
|
71,127 |
|
|
$ |
200,000 |
|
|
$ |
— |
|
|
$ |
200,000 |
|
|
|
68,122 |
|
|
|
2015 |
|
10% |
|
|
2 years |
|
$ |
4.50 |
|
|
|
200,000 |
|
|
|
— |
|
|
|
200,000 |
|
|
|
56,109 |
|
|
|
200,000 |
|
|
|
— |
|
|
|
200,000 |
|
|
|
53,905 |
|
|
|
2017 |
|
10% |
|
|
2 years |
|
$ |
10.00 |
|
|
|
5,000,000 |
|
|
|
503,125 |
|
|
|
4,496,875 |
|
|
|
507,465 |
|
|
|
— |
|
|
|
— |
|
|
|
— |
|
|
|
— |
|
|
|
2018 |
|
10% |
|
|
2 years |
|
$ |
10.00 |
|
|
|
9,400,000 |
|
|
|
1,243,337 |
|
|
|
8,156,663 |
|
|
|
971,577 |
|
|
|
— |
|
|
|
— |
|
|
|
— |
|
|
|
— |
|
|
|
|
|
|
|
|
|
|
|
|
|
|
|
$ |
14,800,000 |
|
|
$ |
1,746,462 |
|
|
$ |
13,053,538 |
|
|
|
1,606,278 |
|
|
$ |
400,000 |
|
|
$ |
— |
|
|
$ |
400,000 |
|
|
|
122,027 |
|
|
|
|
|
|
|
|
|
|
|
|
|
|
|
|
|
|
|
|
|
|
|
|
|
|
|
|
|
|
|
|
|
|
|
|
|
|
|
|
|
|
|
|
|
|
|
|
|
|
|
|
Current |
|
|
|
|
|
$ |
400,000 |
|
|
$ |
— |
|
|
$ |
400,000 |
|
|
|
127,236 |
|
|
$ |
400,000 |
|
|
$ |
— |
|
|
$ |
400,000 |
|
|
|
122,027 |
|
|
|
|
|
|
|
|
Non-current |
|
|
|
|
|
$ |
14,400,000 |
|
|
$ |
1,746,462 |
|
|
$ |
12,653,538 |
|
|
|
1,479,042 |
|
|
$ |
— |
|
|
$ |
— |
|
|
$ |
— |
|
|
|
— |
|
|
|
|
|
|
|
|
Total |
|
|
|
|
|
$ |
40,318,535 |
|
|
$ |
8,277,964 |
|
|
$ |
32,040,571 |
|
|
|
6,956,718 |
|
|
$ |
48,723,907 |
|
|
$ |
11,315,721 |
|
|
$ |
37,408,186 |
|
|
|
6,187,614 |
|
14
The weighted average stated interest rates of notes payable as of June 30, 2018 and December 31, 2017 were 10% and 11%, respectively. The weighted average effective interest rates of notes payable for the six-month period ended June 30, 2018 and the year ended December 31, 2017 were 39% and 24% respectively, after giving effect to discounts relating to beneficial conversion features and the fair value of warrants issued in connection with these notes. The notes payable and convertible notes payable do not have restrictive financial covenants or acceleration clauses associated with a material adverse change event. The holders of the convertible notes have the option to convert their notes into Company common stock at the stated conversion price during the term of their convertible notes. Conversion prices on these convertible notes payable range from $3.05 to $10.00 per share. Certain notes with a $4.50 or a $10.00 stated conversion price in the second year of their two-year term are subject to automatic conversion into shares of Company common stock at a conversion price equal to 80% of the initial public offering price at the time of a qualified public offering. All notes due on demand are treated as current liabilities.
Contractual principal payments due on notes payable are as follows:
The Company estimated the total fair value of any beneficial conversion feature and accompanying warrants in allocating the note proceeds. The proceeds allocated to the beneficial conversion feature were determined by taking the estimated fair value of shares issuable under the convertible notes less the fair value of the number of shares that would be issued if the conversion rate equaled the fair value of Company common stock as of the date of issuance (see Note 2). The fair value of the warrants issued in conjunction with notes was determined using the Black Scholes Merton Option Pricing Model with the following inputs for the period ended December 31, 2017.
|
|
2018 |
|
|
2017 |
|
|||
|
Stock price |
|
|
— |
|
|
$ |
11.40 |
|
|
Exercise price |
|
|
— |
|
|
$ |
10.80 |
|
|
Term |
|
|
— |
|
|
5 years |
|
|
|
Risk‑free interest rate |
|
|
— |
|
|
|
2.20 |
% |
|
Expected dividend yield |
|
|
— |
|
|
|
— |
|
|
Expected volatility |
|
|
— |
|
|
|
70.0 |
% |
In situations where the notes included both a beneficial conversion feature and a warrant, the proceeds were allocated to the warrants and beneficial conversion feature based on their respective pro rata fair values.
The Company did not issue any warrants in conjunction with notes in the six months ended June 30, 2018.
NOTE 7 — STOCKHOLDERS’ DEFICIT
Private placement — On September 11, 2013, the Company issued an aggregate of 3,020,501 units at a price of $2.50 per unit (the “Private Placement”). Each unit consisted of one share of common stock and one common stock warrant for the purchase of an additional share of common stock. The aggregate purchase price for the units was $7,551,253. In addition, 300,000 warrants for the purchase of a share of common stock were issued to a broker under the same terms as the Private Placement transaction (the “Broker Warrants”).
The warrants issued in the Private Placement and the Broker Warrants entitle the holders thereof to purchase, at any time on or prior to September 11, 2018, shares of common stock of the Company at an exercise price of $3.50 per share. The warrants contain non-standard anti-dilution protection and, consequently, are being accounted for as liabilities, were originally recorded at fair value, and are adjusted to fair market value each reporting period. Because the shares of common stock underlying the Private Placement warrants and Broker Warrants were not effectively registered for resale by September 11, 2014, the warrant holders have an option to exercise the warrants using a cashless exercise feature. The shares have not been registered for resale as of June 30, 2018. The availability to warrant holders of the cashless exercise feature as of September 11, 2014 caused the then-outstanding 2,225,036 Private Placement warrants and Broker Warrants with fair value of $7,068,000 to be reclassified from liability classified warrants to warrant derivative liabilities and to continue to be remeasured at fair value each reporting period. On June 10, 2014, certain warrant holders exercised 1,095,465 warrants issued in the Private Placement for the exercise price of $3.50 per share, resulting in the Company receiving aggregate exercise proceeds of $3.8 million and issuing 1,095,465 shares of common stock. Prior to exercise, these Private
15
Placement warrants were accounted for at fair value as liability classified warrants. As of June 10, 2014, immediately prior to exercise, the carrying value of these Private Placement warrants was reduced to their fair value immediately prior to exercise of $1.8 million, representing their intrinsic value, with this adjusted carrying value of $1.8 million being transferred to additional paid-in capital. Also on June 10, 2014, based on an offer made to holders of Private Placement warrants in connection with such exercises, the Company issued an aggregate of 1,095,465 replacement warrants to holders exercising Private Placement warrants, which replacement warrants have terms that are generally the same as the exercised warrants, including an expiration date of September 11, 2018 and an exercise price of $3.50 per share.
The replacement warrants are treated for accounting purposes as liability classified warrants, and their issuance gave rise to a $3.5 million warrant exercise inducement expense based on their fair value as of issuance as determined using a Binomial Monte-Carlo Cliquet (aka Ratchet) Option Pricing Model. Because the shares of common stock underlying the replacement warrants were not effectively registered for resale by June 10, 2015, the warrant holders have an option to exercise the warrants using a cashless exercise feature. The shares have not been registered for resale as of June 30, 2018. The availability to warrant holders of the cashless exercise feature as of June 10, 2015 caused the then-outstanding 1,095,465 replacement warrants with fair value of $2,545,000 to be reclassified from liability classified warrants to warrant derivative liabilities and to continue to be remeasured at fair value each reporting period.
As of June 30, 2018, the aggregate fair value of the Private Placement warrants, replacement warrants and the Broker Warrants was $19,611,000 (see Note 2). For further details regarding registration rights associated with the Private Placement warrants, replacement warrants and Broker Warrants, see the Registration Rights section below in this footnote.
A summary of outstanding warrants as of June 30, 2018 and December 31, 2017 is presented below:
|
|
|
Six Months Ended |
|
|
Year Ended |
|
||
|
|
|
June 30, 2018 |
|
|
December 31, 2017 |
|
||
|
Warrants outstanding, beginning of period |
|
|
5,265,432 |
|
|
|
5,024,668 |
|
|
Granted |
|
|
— |
|
|
|
240,764 |
|
|
Exercised |
|
|
(8,316 |
) |
|
— |
|
|
|
Cancelled, forfeited and expired |
|
|
(853,684 |
) |
|
— |
|
|
|
Warrants outstanding, end of period |
|
|
4,403,432 |
|
|
|
5,265,432 |
|
A summary of outstanding warrants by year issued and exercise price as of June 30, 2018 is presented below:
|
|
|
|
|
|
Outstanding |
|
|
Exercisable |
|
||||||||||||||
|
Year issued and Exercise Price |
|
|
Number of Warrants Issued |
|
|
Weighted Average Remaining Contractual Life (Years) |
|
|
Weighted Average Exercise Price |
|
|
Total |
|
|
Weighted Average Exercise Price |
|
|||||||
|
At December 31, 2013 |
|
|
|
|
|
|
|
|
|
|
|
|
|
|
|
|
|
|
|
|
|
|
|
|
|
$ |
3.30 |
|
|
|
— |
|
|
|
— |
|
|
$ |
3.30 |
|
|
|
— |
|
|
$ |
3.30 |
|
|
|
$ |
3.50 |
|
|
|
1,413,036 |
|
|
|
0.26 |
|
|
$ |
3.50 |
|
|
|
1,413,036 |
|
|
$ |
3.50 |
|
|
|
2013 total |
|
|
|
1,413,036 |
|
|
|
|
|
|
|
|
|
|
|
1,413,036 |
|
|
|
|
|
|
|
At December 31, 2014 |
|
|
|
|
|
|
|
|
|
|
|
|
|
|
|
|
|
|
|
|
|
|
|
|
|
$ |
3.50 |
|
|
|
1,145,465 |
|
|
|
0.23 |
|
|
$ |
3.50 |
|
|
|
1,145,465 |
|
|
$ |
3.50 |
|
|
|
2014 Total |
|
|
|
1,145,465 |
|
|
|
|
|
|
|
|
|
|
|
1,145,465 |
|
|
|
|
|
|
|
At December 31, 2015 |
|
|
|
|
|
|
|
|
|
|
|
|
|
|
|
|
|
|
|
|
|
|
|
|
|
$ |
4.90 |
|
|
|
110,417 |
|
|
|
1.68 |
|
|
$ |
4.90 |
|
|
|
110,417 |
|
|
$ |
4.90 |
|
|
|
2015 Total |
|
|
|
110,417 |
|
|
|
|
|
|
|
|
|
|
|
110,417 |
|
|
|
|
|
|
|
|
|
|
|
|
|
|
|
|
|
|
|
|
|
|
|
|
|
|
|
|
|
|
|
|
|
$ |
4.50 |
|
|
|
118,750 |
|
|
|
3.00 |
|
|
$ |
4.50 |
|
|
|
118,750 |
|
|
$ |
4.50 |
|
|
|
$ |
4.70 |
|
|
|
75,000 |
|
|
|
2.84 |
|
|
$ |
4.70 |
|
|
|
75,000 |
|
|
$ |
4.70 |
|
|
|
$ |
5.00 |
|
|
|
1,300,000 |
|
|
|
2.86 |
|
|
$ |
5.00 |
|
|
|
1,300,000 |
|
|
$ |
5.00 |
|
|
|
2016 Total |
|
|
|
1,493,750 |
|
|
|
|
|
|
|
|
|
|
|
1,493,750 |
|
|
|
|
|
|
|
At December 31, 2017 |
|
|
|
|
|
|
|
|
|
|
|
|
|
|
|
|
|
|
|
|
|
|
|
|
|
$ |
10.80 |
|
|
|
240,764 |
|
|
|
5.00 |
|
|
$ |
10.80 |
|
|
|
240,764 |
|
|
$ |
10.80 |
|
|
At June 30, 2018 |
Total |
|
|
|
4,403,432 |
|
|
|
|
|
|
|
|
|
|
|
4,403,432 |
|
|
|
|
|
|
16
Stock options — During the six months ended June 30, 2018, the Company granted 30,000 options to its directors. During the year ended December 31, 2017, 50,000 options were granted by the Company’s Board of Directors to a consultant. These options vested immediately, have an exercise price of $11.40 per share and are exercisable through 2027. As of June 30, 2018, there were 6,755,200 options outstanding under the Company’s 2011 Stock Incentive Plan.
Summaries of outstanding options as of June 30, 2018 and December 31, 2017 are presented below.
|
|
June 30, 2018 |
|
|
December 31, 2017 |
|
|||||||||||
|
|
|
Number of Options |
|
|
Weighted‑ Average Exercise Price |
|
|
Number of Options |
|
|
Weighted‑ Average Exercise Price |
|
||||
|
Options outstanding, beginning of period |
|
|
6,775,200 |
|
|
$ |
4.12 |
|
|
|
6,955,200 |
|
|
$ |
4.10 |
|
|
Granted or deemed issued |
|
|
30,000 |
|
|
$ |
11.40 |
|
|
|
50,000 |
|
|
$ |
11.40 |
|
|
Exercised |
|
|
— |
|
|
$ |
— |
|
|
|
(11,895 |
) |
|
$ |
4.19 |
|
|
Cancelled, forfeited and expired |
|
|
(50,000 |
) |
|
$ |
5.00 |
|
|
|
(218,105 |
) |
|
$ |
4.98 |
|
|
Options outstanding, end of period |
|
|
6,755,200 |
|
|
$ |
4.15 |
|
|
|
6,775,200 |
|
|
$ |
4.12 |
|
|
Options exercisable, end of period |
|
|
6,041,750 |
|
|
$ |
4.02 |
|
|
|
5,604,439 |
|
|
$ |
3.95 |
|
|
Options available for future grant |
|
|
2,244,800 |
|
|
|
|
|
|
|
2,224,800 |
|
|
|
|
|
During the six months ended June 30, 2018 and 2017, the Company recognized $1.7 million and $2.8 million, respectively, of share-based compensation expense arising from stock options. As of June 30, 2018, there was $2.2 million of total unrecognized compensation expense related to unvested share-based compensation arrangements granted under the Company’s 2011 Stock Incentive Plan. That expense is expected to be recognized over the weighted-average remaining period of 0.9 years.
Registration rights — Pursuant to the Purchase Warrant relating to the GPB Debt Holdings II, LLC issued by the Company on December 29, 2017, the Company entered into a Registration Rights Agreement (the “Registration Rights Agreement”) pursuant to which the Company has agreed to file a registration statement with the Securities and Exchange Commission (the “Commission”) relating to the offer and sale by GPB of the Company Shares underlying the Warrants. The Company is required to file a registration statement within one hundred eighty (180) days of closing of a public listing of the Company’s Common Stock for trading on any national securities exchange (excluding any over-the-counter market), whether through a direct listing application or merger transaction. The Company is required to have the registration statement become effective on the earlier of (A) the date that is two-hundred and forty (240) days following the later to occur of (i) the date of closing of the public listing or (ii) or in the event the registration statement receives a “full review” by the Commission, the date that is 300 days following the date of closing of the public listing, or (B) the date which is within three (3) business days after the date on which the Commission informs the Company (i) that the Commission will not review the registration statement or (ii) that the Company may request the acceleration of the effectiveness of the registration statement. If the Company does not effect such registration within that period of time, it will be required to pay GPB for liquidated damages an amount of cash equal to 2% of the product of (i) the number of Registrable Securities and (ii) the Closing Sale Price or Closing Bid Price as of the trading day immediately prior to the Event Date, such payments to be made on the Event Date and every thirty (30) day anniversary thereafter with a maximum penalty of 12% until the applicable Event is cured; provided, however, that in the event the Commission does not permit all of the Registrable Securities to be included in the Registration Statement because of its application of Rule 415, liquidated damages shall only be payable by the Company based on the portion of the Holder’s initial investment in the Securities that corresponds to the number of such Holder’s Registrable Securities permitted to be registered by the Commission in such Registration Statement pursuant to Rule 415.
Pursuant to the Subscription Agreements relating to the Private Placement and certain warrants, as well as the replacement warrants issued by the Company on June 10, 2014, the Company agreed to use its commercially reasonable best efforts to have on file with the SEC, by September 11, 2014 and at the Company’s sole expense, a registration statement to permit the public resale of 4,115,966 shares of Company common stock and 3,320,501 shares of common stock underlying warrants (collectively, the “Registrable Securities”). In the event such registration statement includes securities to be offered and sold by the Company in a fully underwritten primary public offering pursuant to an effective registration under the Securities Act of 1933, as amended (the “Securities Act”), and the Company is advised in good faith by any managing underwriter of securities being offered pursuant to such registration statement that the number of Registrable Securities proposed to be sold in such offering is greater than the number of such securities which can be included in such offering without materially adversely affecting such offering, the Company will include in such registration the following securities in the following order of priority: (i) any securities the Company proposes to sell, and (ii) the Registrable Securities, with any reductions in the number of Registrable Securities actually included in such registration to be allocated on a pro rata basis among the holders thereof. The registration rights described above apply until all Registrable Securities have been sold pursuant to Rule 144 under the Securities Act or may be sold without registration in reliance on Rule 144 under the
17
Securities Act without limitation as to volume and without the requirement of any notice filing. If the shares of common stock underlying these warrants to purchase 3,320,501 shares are not registered for resale at the time of exercise, and the registration rights described above then apply with respect to the holder of such warrants, such holder may exercise such warrants on a cashless basis. In such a cashless exercise of all the shares covered by the warrant, the warrant holder would receive a number of shares equal to the quotient of (i) the difference between the fair market value of the common stock, as defined, and the $3.50 exercise price, as adjusted, multiplied by the number of shares exercisable under the warrant, divided by (ii) the fair market value of the common stock, as defined. As of June 30, 2018, based on a fair market value of a share of Company common stock of $11.30 and 2,520,501 warrants issued and outstanding and eligible for cashless exercise after cancellation of 800,000 of such warrants as of March 29, 2018, the maximum number of shares the Company would be required to issue, if the warrant holders elected to exercise the cashless exercise feature with respect to all then eligible warrants, is 1,739,815 shares. If the fair market value of a share of Company common stock were to increase by $1.00 from $11.30 to $12.30, the maximum number of shares the Company would be required to issue, if the warrant holders elected to exercise the cashless exercise feature with respect to all then eligible warrants, would increase to 1,803,285 shares as of June 30, 2018.
The Company has not yet filed a registration statement with respect to the resale of the Registrable Securities. The Company believes that it has used commercially reasonable efforts to file a registration statement with respect to the resale of Registrable Securities.
Korean Private Placement — On September 12, 2016, the Company entered into Letter of Agreement with KPM and Hanil, both Korean-based public companies whose shares are listed on KOSDAQ, a trading board of Korea Exchange in South Korea. In the Letter of Agreement, the parties agreed that KPM and Hanil would purchase $17.0 million and $3.0 million, respectively, of shares of the Company’s common stock at a price of $4.50 per share. In exchange, the Company agreed to invest $13.0 million and $1.0 million in future capital increases by KPM and Hanil, respectively, at prices based upon the trading prices of KPM and Hanil shares on KOSDAQ. In connection with the Letter of Agreement, KPM and Hanil entered into the Company’s standard form subscription agreement with respect to their purchase of shares which contains customary representations and warranties of the parties.
On September 29, 2016, KPM and Hanil purchased from the Company 3,777,778 shares and 666,667 shares, respectively, of common stock at a price of $4.50 a share for $17 million and $3 million, respectively, or a total of $20.0 million. The Company recognized $720,000 as a reduction to its additional paid-in-capital for fees and commissions payable by the Company in connection with the transaction.
Pursuant to the terms of the Letter of Agreement dated September 12, 2016, the Company invested $13.0 million and $1.0 million in capital increases by KPM and Hanil, respectively, at $15.32 and $3.68, respectively, per capital share.
Pursuant to the terms of a subscription agreement dated as of September 11, 2013 among the Company and certain purchasers of shares of the Company’s common stock and warrants to purchase shares of our common stock, the purchasers are entitled to participation rights with respect to the sale of shares or placement of debt. To the extent the purchasers exercise their participation rights, the Company may be obliged to sell to them a specified number of shares of our common stock at the price per share and other terms set forth in the Letter of Agreement. There can be no assurance that any purchaser will exercise its participation rights or that any shares of the Company’s common stock will be issued to any purchaser.
NOTE 8 — COMMITMENTS AND CONTINGENCIES
Distribution contracts —To support Endari sales, the Company has selected AmerisourceBergen for its integrated commercialization solution, US Bioservices as the Specialty Pharmacy, ASD Healthcare for Specialty Distribution and ICS for third-party logistics.
Cardinal Health Specialty Pharmacy Services has been contracted to distribute NutreStore to other wholesale distributors and some independent pharmacies since April 2008.
On August 29, 2017, the Company signed a distributor agreement, effective as of August 23, 2017, with Megapharm Ltd., an Israeli Corporation (“Megapharm”), under which the Company granted Megapharm the exclusive rights to distribute Endari in Israel and in the Palestinian Authority (“the Territories”).
The term of the distributor agreement is for seven years from the product registration approval in the territory, unless earlier terminated as provided therein, and will renew with respect to a particular territory automatically for successive one-year terms unless terminated by either party by written notice to the other party no less than 60 days prior to the date the term would renew.
In the distributor agreement, Megapharm agrees to use its reasonable best efforts to actively and diligently promote the sale of Endari in the Territories and to maintain a competent and experienced sales force to serve each of the Territories. Megapharm also
18
agrees in the distributor agreement to purchase from the Company specified annual minimum quantities of Endari during each of the first five years of the term. The distributor agreement contains customary representations and warranties of the parties and customary mutual indemnification provisions.
Operating leases — The Company leases its office space under operating leases with unrelated entities. The Company has opened its New York office in February 2018 to support a sales team focused on commercial sales for Endari.
The rent expense during the three months ended June 30, 2018 and 2017 amounted to $178,123 and $141,790, respectively. The rent expense during the six months ended June 30, 2018 and 2017 amounted to $302,410 and $293,102, respectively.
Future minimum lease payments under the agreements are as follows as of June 30, 2018:
|
Amount |
|
||
|
2018 (six months) |
$ |
203,604 |
|
|
2019 |
|
687,032 |
|
|
2020 |
|
611,012 |
|
|
2021 |
|
626,545 |
|
|
2022 |
|
646,047 |
|
|
Thereafter |
|
777,344 |
|
|
Total |
$ |
3,551,584 |
|
Management Control Acquisition Agreement — As reported in its Form 8-K filed on June 19, 2017 and Form 10-Q filed on August 17, 2017, on June 12, 2017, the Company entered into a Management Control Acquisition Agreement (the “MCAA”) with Telcon Holdings, Inc. (“Telcon Holdings”), a Korean corporation, and Telcon (“Telcon”), a Korean-based public company whose shares are listed on KOSDAQ, a trading board of Korea Exchange in South Korea. In accordance with the MCAA, the Company invested ₩36.0 billion KRW (approximately $31.8 million USD) to purchase 6,643,559 shares of Telcon’s common stock shares at a purchase price of ₩5,419 KRW (approximately $4.79 USD) per share. Upon consummation of the MCAA, the Company became Telcon’s largest shareholder owning approximately 10.3% of Telcon’s outstanding common stock shares and received representation on its board of directors.
Subsequent to entering into the MCAA, the Company held discussions with Telcon Holdings and Telcon to re-negotiate and clarify certain of the terms in the MCAA. On September 29, 2017, the Company executed a revised agreement with Telcon Holdings and Telcon which called for the Company’s representatives on Telcon’s board of directors to resign effective as of September 29, 2017 and granted the voting rights of the Company’s shares of Telcon’s common stock to Telcon Holdings to change the composition of the board of directors of Telcon. In addition, the revised agreement contains a provision for Telcon Holdings or any persons designated by Telcon Holdings to lend to the Company a bridge loan for $3.5 million. The Company has repaid the loan in full along with any interest accrued at 5% per annum immediately upon receipt of the $10.0 million due by December 31, 2017 under the distribution agreements for diverticulosis treatment for the geographical regions of Korea, Japan, China, and Australia. The loan was collateralized by a $5.0 million security interest in the amount due to the Company for the aforementioned distribution agreements as well as by shares of Telcon and KPM held by the Company pledged as additional security interest for the loan.
API Supply Agreement — The Company reported in its Form 8-K filed on June 19, 2017, that on June 12, 2017, the Company entered into an API Supply Agreement (the “API Agreement”) with Telcon pursuant to which Telcon paid the Company approximately ₩36.0 billion KRW (approximately $31.8 million USD) in consideration of the right to supply 25% of the Company’s requirements for bulk containers of PGLG for a fifteen-year term. Due to unforeseen circumstances, the Company and Telcon held new discussions to re-negotiate certain terms of the API Agreement. The Company and Telcon made significant changes to critical terms of the API Agreement, which resulted in the Company and Telcon signing a Raw Material Supply Agreement (“Revised API Agreement”) on July 12, 2017. The Revised API Agreement is effective for a term of five years with 10 one-year renewal periods for a maximum of 15 years and the agreement will automatically renew unless terminated by either party in writing. The Revised API Agreement does not include yearly purchase commitments or margin guarantees, but revises the API Agreement such that a unit price is established for 940,000 kilograms of PGLG at $50 USD per kilogram for a total of $47.0 million over the 15 years. The Revised API Supply Agreement is silent on yearly purchase commitments and margin guarantees on purchases of $5.0 million and $2.5 million, respectively.
19
NOTE 9 — RELATED PARTY TRANSACTIONS
The following table sets forth information relating to our loans from related persons outstanding as of the date hereof or at any time during the six months ended June 30, 2018:
|
Class |
Lender |
|
Interest Rate |
|
|
Date of Loan |
|
Term of Loan |
|
Principal Amount Outstanding at June 30, 2018 |
|
|
Highest Principal Outstanding |
|
|
Amount of Principal Repaid or Converted into Stock |
|
|
Amount of Interest Paid |
|
|
Conversion Rate |
|
|
Shares Underlying Notes June 30, 2018 |
|
|||||||
|
Current, Promissory note payable to related parties: |
|
|
|
|
|
|
|
|
|
|
|
|
|
|
|
|
|
|
|
|
|
|
|
|
|||||||||
|
|
Masaharu & Emiko Osato (3) |
|
11% |
|
|
12/29/2015 |
|
Due on Demand |
|
|
— |
|
|
|
300,000 |
|
|
|
300,000 |
|
|
|
76,036 |
|
|
|
— |
|
|
|
— |
|
|
|
|
Yutaka Niihara (2)(3) |
|
10% |
|
|
5/21/2015 |
|
Due on Demand |
|
|
— |
|
|
|
826,105 |
|
|
|
94,339 |
|
|
|
61,829 |
|
|
|
— |
|
|
|
— |
|
|
|
|
Masaharu & Emiko Osato (3) |
|
11% |
|
|
2/25/2016 |
|
Due on Demand |
|
|
— |
|
|
|
400,000 |
|
|
|
400,000 |
|
|
|
94,389 |
|
|
|
— |
|
|
|
— |
|
|
|
|
Hope Hospice (1) |
|
10% |
|
|
4/4/2016 |
|
Due on Demand |
|
|
— |
|
|
|
50,000 |
|
|
|
50,000 |
|
|
|
8,110 |
|
|
|
— |
|
|
|
— |
|
|
|
|
Lan T. Tran (2) |
|
10% |
|
|
4/29/2016 |
|
Due on Demand |
|
|
20,000 |
|
|
|
20,000 |
|
|
|
— |
|
|
|
— |
|
|
|
— |
|
|
|
— |
|
|
|
|
Hope Hospice (1) |
|
10% |
|
|
6/3/2016 |
|
Due on Demand |
|
|
250,000 |
|
|
|
250,000 |
|
|
|
— |
|
|
|
— |
|
|
|
— |
|
|
|
— |
|
|
|
|
Lan T. Tran (2) |
|
10% |
|
|
2/9/2017 |
|
Due on Demand |
|
|
12,000 |
|
|
|
12,000 |
|
|
|
— |
|
|
|
— |
|
|
|
— |
|
|
|
— |
|
|
|
|
Yutaka Niihara (2)(3) |
|
10% |
|
|
9/14/2017 |
|
Due on Demand |
|
|
903,751 |
|
|
|
903,751 |
|
|
|
— |
|
|
|
— |
|
|
|
— |
|
|
|
— |
|
|
|
|
Lan T. Tran (2) |
|
10% |
|
|
2/10/2018 |
|
Due on Demand |
|
|
159,222 |
|
|
|
159,222 |
|
|
|
— |
|
|
|
— |
|
|
|
— |
|
|
|
— |
|
|
|
|
|
|
|
|
|
|
|
|
Subtotal |
|
$ |
1,344,973 |
|
|
$ |
2,921,078 |
|
|
$ |
844,339 |
|
|
$ |
240,364 |
|
|
|
|
|
|
|
|
|
|
|
|
|
|
|
|
|
|
|
|
|
|
|
|
|
|
|
|
|
|
|
|
|
|
|
|
|
|
|
|
|
|
|
|
|
Current, Convertible notes payable to related parties: |
|
|
|
|
|
|
|
|
|
|
|
|
|
|
|
|
|
|
|
|
|
|
|
|
|||||||||
|
|
Yasushi Nagasaki (2) |
|
10% |
|
|
6/29/2012 |
|
Due on Demand |
|
$ |
200,000 |
|
|
$ |
388,800 |
|
|
$ |
188,800 |
|
|
$ |
57,886 |
|
|
$ |
3.30 |
|
|
|
71,127 |
|
|
|
|
Charles & Kimxa Stark (2) |
|
10% |
|
|
10/1/2015 |
|
2 years |
|
— |
|
|
|
20,000 |
|
|
|
20,000 |
|
|
|
4,405 |
|
|
$ |
4.50 |
|
|
— |
|
|||
|
|
Yutaka & Soomi Niihara (2)(3) |
|
10% |
|
|
11/16/2015 |
|
2 years |
|
|
200,000 |
|
|
|
200,000 |
|
|
— |
|
|
— |
|
|
$ |
4.50 |
|
|
|
56,109 |
|
|||
|
|
|
|
|
|
|
|
|
|
Subtotal |
|
$ |
400,000 |
|
|
$ |
608,800 |
|
|
$ |
208,800 |
|
|
$ |
62,291 |
|
|
|
|
|
|
|
127,236 |
|
|
|
|
|
|
|
|
|
|
|
|
|
|
|
|
|
|
|
|
|
|
|
|
|
|
|
|
|
|
|
|
|
|
|
|
|
Non-Current, Convertible notes payable to related parties: |
|
|
|
|
|
|
|
|
|
|
|
|
|
|
|
|
|
|
|
|
|
|
|
|
|||||||||
|
|
Wei Peu Zen (3) |
|
10% |
|
|
11/6/2017 |
|
2 years |
|
|
5,000,000 |
|
|
|
5,000,000 |
|
|
— |
|
|
|
250,000 |
|
|
$ |
10.00 |
|
|
|
507,465 |
|
||
|
|
Profit Preview Int'l Group, Ltd. (4) |
|
10% |
|
|
2/1/2018 |
|
2 years |
|
|
4,037,000 |
|
|
|
4,037,000 |
|
|
— |
|
|
— |
|
|
$ |
10.00 |
|
|
|
420,290 |
|
|||
|
|
Profit Preview Int'l Group, Ltd. (4) |
|
10% |
|
|
3/21/2018 |
|
2 years |
|
|
5,363,000 |
|
|
|
5,363,000 |
|
|
— |
|
|
— |
|
|
$ |
10.00 |
|
|
|
551,287 |
|
|||
|
|
|
|
|
|
|
|
|
|
Subtotal |
|
$ |
14,400,000 |
|
|
$ |
14,400,000 |
|
|
$ |
— |
|
|
$ |
250,000 |
|
|
|
|
|
|
|
1,479,042 |
|
|
|
|
|
|
|
|
|
|
|
|
|
|
|
|
|
|
|
|
|
|
|
|
|
|
|
|
|
|
|
|
|
|
|
|
|
|
|
|
|
|
|
|
|
|
Total |
|
$ |
16,144,973 |
|
|
$ |
17,929,878 |
|
|
$ |
1,053,139 |
|
|
$ |
552,655 |
|
|
|
|
|
|
|
1,606,278 |
|
|
(1) |
Dr. Niihara, a Director and Chief Executive Officer of the Company, is also the Chief Executive Officer of Hope Hospice. |
|
(2) |
Officer. |
|
(3) |
Director. |
|
(4) |
Mr. Zen, a Director, is the sole owner of Profit Preview Int'l Group, Ltd. |
20
The following table sets forth information relating to our loans from related persons outstanding as of the date hereof or at any time during the year ended December 31, 2017:
|
Class |
Lender |
|
Interest Rate |
|
|
Date of Loan |
|
Term of Loan |
|
Principal Amount Outstanding at December 31, 2017 |
|
|
Highest Principal Outstanding |
|
|
Amount of Principal Repaid or Converted into Stock |
|
|
Amount of Interest Paid |
|
|
Conversion Rate |
|
|
Shares Underlying Notes December 31, 2017 |
|
|||||||
|
Current, Promissory note payable to related parties: |
|
|
|
|
|
|
|
|
|
|
|
|
|
|
|
|
|
|
|
|
|
|
|
|
|||||||||
|
|
Hope Hospice (1) |
|
8% |
|
|
1/17/2012 |
|
Due on Demand |
|
$ |
— |
|
|
$ |
200,000 |
|
|
$ |
200,000 |
|
|
$ |
7,331 |
|
|
|
— |
|
|
|
— |
|
|
|
|
Hope Hospice (1) |
|
8% |
|
|
6/14/2012 |
|
Due on Demand |
|
|
— |
|
|
|
200,000 |
|
|
|
200,000 |
|
|
|
14,762 |
|
|
|
— |
|
|
|
— |
|
|
|
|
Hope Hospice (1) |
|
8% |
|
|
6/21/2012 |
|
Due on Demand |
|
|
— |
|
|
|
100,000 |
|
|
|
100,000 |
|
|
|
7,249 |
|
|
|
— |
|
|
|
— |
|
|
|
|
Hope Hospice (1) |
|
8% |
|
|
2/11/2013 |
|
Due on Demand |
|
|
— |
|
|
|
50,000 |
|
|
|
50,000 |
|
|
|
1,559 |
|
|
|
— |
|
|
|
— |
|
|
|
|
Hope Hospice (1) |
|
10% |
|
|
1/7/2015 |
|
Due on Demand |
|
|
— |
|
|
|
100,000 |
|
|
|
100,000 |
|
|
|
28,630 |
|
|
|
— |
|
|
|
— |
|
|
|
|
IRA Service Trust Co. FBO Peter B. Ludlum (2) |
|
10% |
|
|
2/20/2015 |
|
Due on Demand |
|
|
10,000 |
|
|
|
10,000 |
|
|
|
— |
|
|
|
— |
|
|
|
— |
|
|
|
— |
|
|
|
|
Masaharu & Emiko Osato (3) |
|
11% |
|
|
12/29/2015 |
|
Due on Demand |
|
|
300,000 |
|
|
|
300,000 |
|
|
|
— |
|
|
|
— |
|
|
|
— |
|
|
|
— |
|
|
|
|
Yutaka Niihara (2)(3) |
|
10% |
|
|
5/21/2015 |
|
Due on Demand |
|
|
— |
|
|
|
826,105 |
|
|
|
94,339 |
|
|
|
61,829 |
|
|
|
— |
|
|
|
— |
|
|
|
|
Lan T. Tran (2) |
|
11% |
|
|
2/10/2016 |
|
Due on Demand |
|
|
130,510 |
|
|
|
130,510 |
|
|
|
— |
|
|
|
— |
|
|
|
— |
|
|
|
— |
|
|
|
|
Masaharu & Emiko Osato (3) |
|
11% |
|
|
2/25/2016 |
|
Due on Demand |
|
|
400,000 |
|
|
|
400,000 |
|
|
|
— |
|
|
|
— |
|
|
|
— |
|
|
|
— |
|
|
|
|
Hope Hospice (1) |
|
10% |
|
|
4/4/2016 |
|
Due on Demand |
|
|
— |
|
|
|
50,000 |
|
|
|
50,000 |
|
|
|
8,110 |
|
|
|
— |
|
|
|
— |
|
|
|
|
Lan T. Tran (2) |
|
10% |
|
|
4/29/2016 |
|
Due on Demand |
|
|
20,000 |
|
|
|
20,000 |
|
|
|
— |
|
|
|
— |
|
|
|
— |
|
|
|
— |
|
|
|
|
IRA Service Trust Co. FBO Peter B. Ludlum (2) |
|
10% |
|
|
5/5/2016 |
|
Due on Demand |
|
|
10,000 |
|
|
|
10,000 |
|
|
|
— |
|
|
|
— |
|
|
|
— |
|
|
|
— |
|
|
|
|
Hope Hospice (1) |
|
10% |
|
|
6/3/2016 |
|
Due on Demand |
|
|
250,000 |
|
|
|
250,000 |
|
|
|
— |
|
|
|
— |
|
|
|
— |
|
|
|
— |
|
|
|
|
Lan T. Tran (2) |
|
10% |
|
|
2/9/2017 |
|
Due on Demand |
|
|
12,000 |
|
|
|
12,000 |
|
|
|
— |
|
|
|
— |
|
|
|
— |
|
|
|
— |
|
|
|
|
Yutaka Niihara (2)(3) |
|
10% |
|
|
9/14/2017 |
|
Due on Demand |
|
|
903,751 |
|
|
|
903,751 |
|
|
|
— |
|
|
|
— |
|
|
|
— |
|
|
|
— |
|
|
|
|
|
|
|
|
|
|
|
|
Subtotal |
|
$ |
2,036,261 |
|
|
$ |
3,562,366 |
|
|
$ |
794,339 |
|
|
$ |
129,470 |
|
|
|
|
|
|
— |
|
|
|
|
|
|
|
|
|
|
|
|
|
|
|
|
|
|
|
|
|
|
|
|
|
|
|
|
|
|
|
|
|
|
|
|
|
|
Current, Convertible notes payable to related parties: |
|
|
|
|
|
|
|
|
|
|
|
|
|
|
|
|
|
|
|
|
|
|
|
|
|||||||||
|
|
Yasushi Nagasaki (2) |
|
10% |
|
|
6/29/2012 |
|
Due on Demand |
|
$ |
200,000 |
|
|
$ |
388,800 |
|
|
$ |
188,800 |
|
|
$ |
57,886 |
|
|
$ |
3.30 |
|
|
|
68,122 |
|
|
|
|
Charles & Kimxa Stark (2) |
|
10% |
|
|
10/1/2015 |
|
2 years |
|
— |
|
|
|
20,000 |
|
|
|
20,000 |
|
|
|
4,405 |
|
|
$ |
4.50 |
|
|
— |
|
|||
|
|
Yutaka & Soomi Niihara (2)(3) |
|
10% |
|
|
11/16/2015 |
|
2 years |
|
|
200,000 |
|
|
|
200,000 |
|
|
— |
|
|
— |
|
|
$ |
4.50 |
|
|
|
53,905 |
|
|||
|
|
|
|
|
|
|
|
|
|
Subtotal |
|
$ |
400,000 |
|
|
$ |
608,800 |
|
|
$ |
208,800 |
|
|
$ |
62,291 |
|
|
|
|
|
|
|
122,027 |
|
|
|
|
|
|
|
|
|
|
|
|
|
|
|
|
|
|
|
|
|
|
|
|
|
|
|
|
|
|
|
|
|
|
|
|
|
|
|
|
|
|
|
|
|
|
Total |
|
$ |
2,436,261 |
|
|
$ |
4,171,166 |
|
|
$ |
1,003,139 |
|
|
$ |
191,761 |
|
|
|
|
|
|
|
122,027 |
|
|
(1) |
Dr. Niihara, a Director and Chief Executive Officer of the Company, is also the Chief Executive Officer of Hope Hospice. |
|
(2) |
Officer |
|
(3) |
Director |
21
NOTE 10 — GEOGRAPHIC INFORMATION
For the six months ended June 30, 2018 and 2017, the Company earned revenue from countries as outlined in the table below:
|
Country |
Revenue for the Six Months Ended June 30, 2018 |
|
% of Total Revenue for the Six Months Ended June 30, 2018 |
|
Revenue for the Six Months Ended June 30, 2017 |
|
% of Total Revenue for the Six Months Ended June 30, 2017 |
|
||||
|
United States |
$ |
2,903,749 |
|
|
87 |
% |
$ |
41,503 |
|
|
19 |
% |
|
Japan |
|
131,043 |
|
|
4 |
% |
|
70,848 |
|
|
31 |
% |
|
Taiwan |
|
163,822 |
|
|
5 |
% |
|
113,767 |
|
|
50 |
% |
|
France |
|
144,053 |
|
|
4 |
% |
|
— |
|
|
— |
|
|
Saudi Arabia |
|
9,744 |
|
|
— |
|
|
— |
|
|
— |
|
For the three months ended June 30, 2018 and 2017, the Company earned revenue from countries as outlined in the table below:
|
Country |
Revenue for the Three Months Ended June 30, 2018 |
|
% of Total Revenue for the Three Months Ended June 30, 2018 |
|
Revenue for the Three Months Ended June 30, 2017 |
|
% of Total Revenue for the Three Months Ended June 30, 2017 |
|
||||
|
United States |
$ |
2,228,702 |
|
|
87 |
% |
$ |
26,884 |
|
|
22 |
% |
|
Japan |
|
88,038 |
|
|
4 |
% |
|
42,290 |
|
|
36 |
% |
|
Taiwan |
|
137,722 |
|
|
5 |
% |
|
49,467 |
|
|
42 |
% |
|
France |
|
106,891 |
|
|
4 |
% |
|
— |
|
|
— |
|
|
Saudi Arabia |
|
9,744 |
|
|
— |
|
|
— |
|
|
— |
|
The Company did not have any significant currency translation or foreign transaction adjustments during the six months ended June 30, 2018 or 2017.
NOTE 11 — SUBSEQUENT EVENTS
Subsequent to June 30, 2018, the Company issued the following:
|
|
Principal Amounts |
|
|
Annual Interest Rate |
|
|
Term of Notes |
|
Conversion Price |
|
|||
|
Convertible note |
|
$ |
3,000,000 |
|
|
6.00% |
|
|
1 Year |
|
$ |
10.00 |
|
On July 2, 2018, we entered into an Additional Agreement with Evercore Investment Holdings Co., Ltd. (formerly Telcon Holdings Co., Ltd.), a Korean corporation (“Evercore”), and Telcon RF Pharmaceutical Inc. (formerly Telcon Inc.), a Korean-based public company (“Telcon”) whose shares are listed on KOSDAQ. The Additional Agreement amended in certain respects and supplemented the MCAA entered into on June 12, 2017 among Emmaus, Evercore and Telcon under which, among other things, we purchased 6,643,559 shares of Telcon’s common stock at a purchase price of 5,460 KRW (approximately $4.83 USD) per share, or a total of 36.0 billion KRW (approximately $31.8 million USD). The MCAA was amended in certain respect and supplemented by an Agreement, dated as of September 29, 2017, among the parties. Pursuant to the September 2017 Agreement, among other things, Telcon purchased 4,444,445 Emmaus shares from KPM and Hanil at a price of $6.60 per share.
In the Additional Agreement, we agreed to use the proceeds from any sales of our KPM shares to repurchase Emmaus shares from Telcon at a price of $7.60 a share, subject to certain exceptions, and Telcon granted us the right to purchase from Telcon all or a portion of its Emmaus shares at a price of $7.60 a share until October 31, 2018 and at a price to be agreed upon after October 31, 2018.
Telcon also granted us under the Additional Agreement a right of first refusal until June 30, 2019 to purchase any Emmaus shares that Telcon may wish to sell.
22
In connection with the MCAA, on June 15, 2017, Emmaus and Telcon entered into exclusive Distribution Agreements for the distribution of L-glutamine powder for diverticulosis treatment for the South Korea, Japan and China Territories, with the intention to add the Australia territory. In the Additional Agreement, the parties agreed to dispense with a Distribution Agreement for Australia, and that the parties have no liabilities or obligations with respect to the intended Australia distribution, including any related liabilities and obligations under the September 2017 Agreement.
The Additional Agreement provides for specified damages in the event of a breach of the Additional Agreement by any party.
23
Item 2. Management’s Discussion and Analysis of Financial Condition and Results of Operations
With respect to the following discussion, the terms, “we,” “us,” “our” or the “Company” refer to Emmaus Life Sciences, Inc., and its wholly-owned subsidiary Emmaus Medical, Inc., a Delaware corporation, which we refer to as Emmaus Medical, and Emmaus Medical’s wholly-owned subsidiaries, Newfield Nutrition Corporation, a Delaware corporation, which we refer to as Newfield Nutrition, Emmaus Medical Japan, Inc., a Japanese corporation, which we refer to as EM Japan, Emmaus Life Sciences Korea, a Korean corporation which we refer to as ELSK and Emmaus Medical Europe Ltd., a U.K. corporation, which we refer to as EM Europe.
Forward-Looking Statements
This management’s discussion and analysis of financial condition and results of operations should be read in conjunction with the audited consolidated financial statements for the year ended December 31, 2017 and the related notes included in the Company’s Annual Report on Form 10-K for the year ended December 31, 2017 filed with the SEC on April 16, 2018 (the “Annual Report”).
This Quarterly Report contains forward-looking statements that involve substantial risks and uncertainties. All statements other than historical facts contained in this report, including statements regarding our future financial position, capital expenditures, cash flows, business strategy and plans and objectives of management for future operations are forward-looking statements. The words “anticipate,” “believe,” “expect,” “plan,” “intend,” “seek,” “estimate,” “project,” “could,” “may” and similar expressions are intended to identify forward-looking statements. These statements include, among others, information regarding future operations, future capital expenditures, and future net cash flow. Such statements reflect our management’s current views with respect to future events and financial performance and involve risks and uncertainties, including, without limitation, our ability to raise additional capital to fund our operations, our ability to commercialize Endari (pharmaceutical grade L-glutamine oral powder), market acceptance of Endari, our reliance on third-party manufacturers for our drug products, our dependence on licenses for certain of our products, exposure to product liability and defect claims, obtaining, and, or, maintaining the U.S. Food and Drug Administration (“FDA”) and other regulatory authorization to market our other drug and biological products, development of a public trading market for our securities, and various other matters, many of which are beyond our control.
Should one or more of these risks or uncertainties occur, or should underlying assumptions prove to be incorrect, actual results may vary materially and adversely from those anticipated, believed, estimated or otherwise indicated. Consequently, all of the forward-looking statements made in this Form 10-Q are qualified by these cautionary statements. We undertake no duty to amend or update these statements beyond what is required by SEC reporting requirements.
Company Overview
We are a biopharmaceutical company engaged in the discovery, development and commercialization of innovative treatments and therapies primarily for rare and orphan diseases. We are currently focusing on sickle cell disease (“SCD”), a genetic disorder and a significant unmet medical need.
Endari™ (L-glutamine oral powder), a prescription oral drug, was approved by FDA in July 2017 for SCD. Endari is the first treatment approved in nearly 20 years for adults and the first treatment approved for children five years and older, when used as directed. Endari is indicated to reduce the acute complications of SCD in adult and pediatric patients 5 years of age and older. The most common adverse reactions (incidence >10 percent) in clinical studies were constipation, nausea, headache, abdominal pain, cough, pain in extremities, back pain and chest pain. Adverse reactions leading to treatment discontinuation included one case each of hypersplenism, abdominal pain, dyspepsia, burning sensation and hot flash. The safety and efficacy of Endari in pediatric patients with sickle cell disease younger than five years of age has not been established.
Endari is currently being marketed in the U.S. by Emmaus. A Marketing Authrotization Application, or MAA, was submitted to the Euopean Medicines Agency, or EMA, and is currently under review. Endari has received Orphan Drug designation in the U.S., and Orphan Medicinal Product designation in the EU.
An investigational new drug application, or IND, to study divierticulosis was submitted to the FDA and we have received the Study May Proceed letter from the FDA. We anticipate the pilot study for diverticulosis shall commence in early 2019.
24
We intend to utilize strategic partnerships to market Endari in certain of the foreign jurisdictions in which we are able to obtain marketing approval. We have submitted a Marketing Authorization Application for Xyndari (the name under which Endari will be marketed in Europe) which has been fully validated and is now under assessment by the European Medicines Agency for the treatment of SCD.
We have extensive experience in the field of SCD, including the development, outsourcing manufacturing and conducting clinical trials of Endari. Our Chairman of the Board and Chief Executive Officer, Yutaka Niihara, M.D., M.P.H., is a leading hematologist in the field of SCD. Dr. Niihara is licensed to practice medicine in both the United States and Japan and has been actively engaged in SCD research and the care of patients with SCD for over 20 years, primarily at the University of California Los Angeles and the Los Angeles Biomedical Research Institute at Harbor-UCLA Medical Center (“LA BioMed”), a nonprofit biomedical research institute.
To a much lesser extent, we are also engaged in the sale of NutreStore, L-glutamine powder for oral solution, which has received FDA approval as a treatment for short bowel syndrome (“SBS”) in patients receiving specialized nutritional support when used in conjunction with a recombinant human growth hormone that is approved for this indication. Our indirect wholly owned subsidiary, Newfield Nutrition, sells L-glutamine as a nutritional supplement under the brand name AminoPure through retail stores in multiple states in the United States and via importers and distributors in Japan, Taiwan and South Korea. Since inception, we have generated minimal revenues from the sale and promotion of NutreStore and AminoPure.
In May 2006, we formed Newfield Nutrition, a wholly-owned subsidiary of Emmaus Medical, that distributes L-glutamine as a nutritional supplement under the brand name AminoPure.
In October 2010, we formed EM Japan, a wholly-owned subsidiary of Emmaus Medical, that markets and sells AminoPure in Japan and other countries in Asia. EM Japan also manages our distributors in Japan and may also import other medical products and drugs in the future.
In November 2011, we formed EM Europe, a wholly-owned subsidiary of Emmaus Medical, whose primary focus is expanding our business in Europe.
In December 2016, we formed Emmaus Life Sciences Korea (“ELSK”), a wholly owned subsidiary of Emmaus Medical, whose primary focus is expanding our business in Korea.
Our corporate structure is illustrated below:
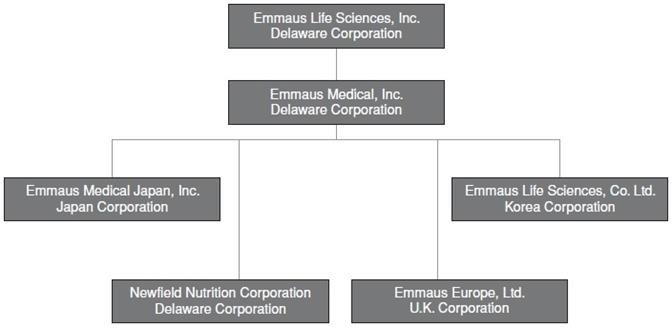
Emmaus Medical, LLC was organized on December 20, 2000. In October 2003, Emmaus Medical, LLC undertook a reorganization and merged with Emmaus Medical, which was originally incorporated in September 2003.
25
Pursuant to an Agreement and Plan of Merger dated April 21, 2011, which we refer to as the Merger Agreement, by and among us, AFH Merger Sub, Inc., our wholly-owned subsidiary, which we refer to as AFH Merger Sub, AFH Advisory and Emmaus Medical, Emmaus Medical merged with and into AFH Merger Sub on May 3, 2011 with Emmaus Medical continuing as the surviving entity, which we refer to as the Merger. Upon the closing of the Merger, we changed our name from “AFH Acquisition IV, Inc.” to “Emmaus Holdings, Inc.” Subsequently, on September 14, 2011, we changed our name from “Emmaus Holdings, Inc.” to “Emmaus Life Sciences, Inc.”
Our future capital requirements are substantial and may increase beyond our current expectations depending on many factors, including, but not limited to: our success in commercializing Endari in the U.S. or elsewhere; the duration and results of the clinical trials for our other product candidates; unexpected delays or developments when seeking regulatory approvals; the time and cost in preparing, filing, prosecuting, maintaining and enforcing patent claims; current and future unexpected developments encountered in implementing our business development and commercialization strategies; the outcome of any future litigation; and further arrangements, if any, with collaborators.
Until we can generate a sufficient amount of product revenue, future cash requirements are expected to be financed through public or private equity offerings, debt financings or corporate collaboration and licensing arrangements. As of June 30, 2018, our accumulated deficit was $152.2 million and we had cash and cash equivalents of $2.2 million. Since inception we have had minimal revenues and have been required to rely on funding from sales of equity securities and debt financings and loans, including loans from related parties. Because of the numerous risks and uncertainties associated with pharmaceutical development, we are unable to predict if or when we will become profitable through the sales of Endari.
Financial Overview
Revenues
Since January 2018, we have generated revenues through the sale of Endari as a treatment for SCD. We also generate revenues to a much lesser extent from NutreStore L-glutamine powder for oral solution as a treatment for SBS, as well as AminoPure, a nutritional supplement. We currently recognize revenue for Endari based upon the script data reports by one of our two distributors, US Bioservices, to patients as we do not have sufficient historical information to reliably estimate returns or adequate script level data from our other distributor.
Cost of Goods Sold
Cost of goods sold includes the raw materials, packaging, shipping and distribution costs of Endari, NutreStore and AminoPure.
Research and Development Expenses
Research and development costs consist of expenditures for new products and technologies, which primarily involve fees paid to the contract research organization (“CRO”) that conducts the clinical trials of our product candidates, payroll-related expenses, study site payments, consultant fees, and activities related to regulatory filings, manufacturing development costs and other related supplies. The costs of later-stage clinical studies, such as Phase 2 and 3 trials, are generally higher than those of earlier stages of development, such as preclinical studies and Phase 1 trials. This is primarily due to the increased size, expanded scope, patient related healthcare and regulatory compliance costs, and generally longer duration of later-stage clinical studies.
The most significant clinical trial expenditures in prior years have been related to the CRO costs and the payments to study sites. The contract with the CRO is based on time and material expended, whereas the study site agreements are based on per patient costs as well as other pass-through costs, including, but not limited to, start-up costs and institutional review board fees. The financial terms of these agreements are subject to negotiation and vary from contract to contract and may result in uneven payment flows. Payments under some of these contracts depend on factors such as the successful enrollment of patients and the completion of clinical trial milestones.
Future research and development expenses will depend on any new product candidates or technologies that we may introduce into our research and development pipeline. In addition, we cannot forecast with any degree of certainty which product candidates may be subject to future collaborations, when such arrangements will be secured, if at all, and to what degree, if any, such arrangements would affect our development plans and capital requirements.
At this time, due to the inherently unpredictable nature of the process for developing drugs, biologics and cell-based therapies and the interpretation of the regulatory requirements, we are unable to estimate with any degree of certainty the amount of costs which will be incurred in obtaining regulatory approval of Endari outside of the U.S. and the continued development of our other preclinical
26
and clinical programs. Clinical development timelines, the probability of success and development costs can differ materially from expectations and can vary widely. These and other risks and uncertainties relating to product development are described in the Annual Report under the headings “Risk Factors—Risks Related to Development of our Product Candidates,” “Risk Factors—Risks Related to our Reliance on Third Parties,” and “Risk Factors—Risks Related to Regulatory Approval of our Product Candidates and Other Legal Compliance Matters.”
General and Administrative Expenses
General and administrative expenses consist principally of salaries and related costs, including share-based compensation, for personnel in executive, finance, business development, information technology, marketing and legal functions. Other general and administrative expenses include facility costs, patent filing costs and professional fees and expenses for legal, consulting, auditing and tax services. Inflation has not had a material impact on our general and administrative expenses over the past two years. We expect general and administrative expenses to increase as we add additional personnel to support the operation of the Company.
Selling Expenses
Selling expenses consist principally of salaries and related costs for personnel involved in the launch, promotion and marketing of our products. Other selling cost include advertising, commissions, third party consulting costs, the cost of contracted sales personnel and travel. We expect general and administrative expenses to increase as we add additional sales and administrative personnel to support the commercialization of Endari.
Environmental Expenses
The cost of compliance with environmental laws has not been material over the past two years and any such costs are included in general and administrative costs.
Inventories
Inventories consist of raw material, finished goods and work-in-process and are valued on a first-in, first-out basis and at the lower of cost or market value. All of the raw material purchased during the six months ended June 30, 2018 and 2017 was from one vendor.
Results of Operations
Three months ended June 30, 2018 and 2017
Net Losses. Net losses increased by $35.5 million, or 301%, to $47.3 million from $11.8 million for the three months ended June 30, 2018 and 2017, respectively. The increase in net losses is primarily a result of a $37.6 million increase in other expenses and a $0.3 million increase in operating expenses, offset by a $2.5 million increase in net revenues as discussed below. As of June 30, 2018, we had an accumulated deficit of approximately $152.2 million. Losses will continue as we transition from developmental stage to our next phase as a commercial organization. As a result, we anticipate that we will continue to incur net losses and be unprofitable for the foreseeable future. There can be no assurance that we will ever operate at a profit, even if all of our products are commercialized.
Revenues, Net. Net revenues increased by $2.5 million, or 2,500%, to $2.6 million from $0.1 million for the three months ended June 30, 2018 and 2017, respectively. The majority of these revenues was from Endari, while contributions from AminoPure L-glutamine nutritional supplement product and our NutreStore L-glutamine powder for oral solution for treatment of SBS were fairly modest. At June 30, 2018, we have deferred revenue of $2.0 million, which represents Endari shipped to US Bioservices, our Specialty Pharmacy and ASD Healthcare, Specialty Distributor, but not yet shipped to patients through prescriptions, net of prompt payment discounts and rebates. We expect Endari revenue and prescriptions shipped to patients to increase in 2018 as we continue the commercialization of Endari.
Cost of Goods Sold. Cost of goods sold increased by $176,000, or 391%, to $221,000 from $45,000 for the three months ended June 30, 2018 and 2017, respectively. Cost of goods sold includes costs for raw material, packaging, testing, shipping and costs related to scrapped inventory. All of the raw material purchased during the three months ended June 30, 2018 and 2017 was from one vendor. Cost of goods sold increased due to the increase in Endari sales during the second quarter of 2018.
Research and Development Expenses. Research and development expenses decreased by $0.8 million, or 67%, to $0.4 million from $1.2 million for the three months ended June 30, 2018 and 2017, respectively. This decrease was primarily due to a
27
decrease in regulatory consulting expenses. We expect our research and development costs to increase in the remainder of 2018 to support our post‑approval commitment, work on marketing approvals outside the U.S. and potentially future clinical trial activity.
Selling Expenses. Selling expenses increased by $1.6 million, or 1,500%, to $1.6 million from $0.1 million for the three months ended June 30, 2018 and 2017, respectively. Selling expenses include the distribution fees, sales force fees, promotion, travel, marketing and branding expenses for Endari. Also included are the costs for distribution, promotion, travel, tradeshows and exhibits related to NutreStore and AminoPure. The increase was primarily related to Endari as we launched the product during the current reporting period. We anticipate that our selling expenses will increase during the remainder of 2018 based on an increased selling effort of Endari.
General and Administrative Expenses. General and administrative expenses decreased by $0.4 million, or 11%, to $3.1 million from $3.5 million for the three months ended June 30, 2018 and 2017, respectively. General and administrative expenses include share-based compensation expenses, professional fees, office rent and payroll expenses. This decrease was primarily due to a decrease of $0.8 million in share-based compensation expense, a decrease of $0.1 million in due diligence expense and a decrease of $0.1 million in travel expense, partially offset by an increase of $0.6 million of profession fees. We expect general and administrative expenses to increase as we add additional personnel to support the commercialization of Endari.
Other Income and Expense. Total other expense increased by $37.6 million, or 537%, to $44.6 million for the three months ended June 30, 2018, compared to $7.0 million in other expense for the three months ended June 30, 2017. The increase was primarily due to an increase in unrealized gain on investment in marketable securities of $39.2 million and a $2.8 million increase in interest costs as a result of increased debt, partially offset by a change in the fair value of the warrant derivative liabilities and embedded conversion option of $4.5 million.
Operating Expenses Overall. We anticipate that our operating expenses will increase for, among others, the following reasons:
|
|
• |
We intend to reinforce our sales and marketing team to commercialize Endari in the U.S.; |
|
|
• |
We anticipate increases in payroll associated with an expanded infrastructure, higher consulting, legal, accounting and investor relations costs, and increases in director and officer insurance premiums; and |
|
|
• |
We expect increases in research and development activities as we undertake to obtain marketing approval for Endari outside the U.S. and as development of our product candidates continues. |
Six months ended June 30, 2018 and 2017
Net Losses. Net losses increased by $35.1 million, or 193%, to $53.4 million from $18.3 million for the six months ended June 30, 2018 and 2017, respectively. The increase in net losses is primarily a result of a $36.3 million increase in other expenses and a $1.7 million increase in operating expenses, offset by a $3.1 million increase in net revenues as discussed below. As of June 30, 2018, we had an accumulated deficit of approximately $152.2 million. Losses will continue as we transition from developmental stage to our next phase as a commercial organization. As a result, we anticipate that we will continue to incur net losses and be unprofitable for the foreseeable future. There can be no assurance that we will ever operate at a profit, even if all of our products are commercialized.
Revenues, Net. Net revenues increased by $3.2 million, or 1,383%, to $3.4 million from $0.2 million for the six months ended June 30, 2018 and 2017, respectively. The majority of these revenues was from Endari while contributions from AminoPure L-glutamine nutritional supplement product and our NutreStore L-glutamine powder for oral solution for treatment of SBS were fairly modest. At June 30, 2018, we have deferred revenue of $2.0 million, which represents Endari shipped to US Bioservices, our Specialty Pharmacy and ASD Healthcare, Specialty Distributor, but not yet shipped to patients through prescriptions, net of prompt payment discounts and rebates. We expect Endari revenue and prescriptions shipped to patients to increase in 2018 as we continue the commercialization of Endari.
Cost of Goods Sold. Cost of goods sold increased by $0.3 million, or 280%, to $0.4 million from $0.1 million for the six months ended June 30, 2018 and 2017, respectively. Cost of goods sold includes costs for raw material, packaging, testing, shipping and costs related to scrapped inventory. All of the raw material purchased during the six months ended June 30, 2018 and 2017 came from one vendor. The increases in cost of goods sold were associated with increased sales of Endari sales during this period.
Research and Development Expenses. Research and development expenses decreased by $1.2 million, or 59%, to $0.8 million from $2.0 million for the six months ended June 30, 2018 and 2017, respectively. This decrease was primarily due to a
28
decrease in regulatory consulting expenses. We expect our research and development costs to increase during the remainder of 2018 to support our post‑approval commitment, work on marketing approvals outside the U.S. and potentially future clinical trial activity.
Selling Expenses. Selling expenses increased by $2.2 million, or 1,175%, to $2.4 million from $0.2 million for the six months ended June 30, 2018 and 2017, respectively. Selling expenses include the distribution fees, sales force fees, promotion, travel, marketing and branding expenses for Endari. Also included are the costs for distribution, promotion, travel, tradeshows and exhibits related to NutreStore and AminoPure. The increase was primarily related to Endari as we launched the product during the current reporting period. We anticipate that our selling expenses will increase during the remainder of 2018 as we expand our selling efforts.
General and Administrative Expenses. General and administrative expenses increased by $0.6 million, or 10%, to $6.9 million from $6.3 million for the six months ended June 30, 2018 and 2017, respectively. General and administrative expenses include share-based compensation expenses, professional fees, office rent and payroll expenses. This increase was primarily due to an increase of $0.9 million of profession fees, an increase of $0.3 million in salaries expenses, partially offset by a decrease of $1.1 million in share-based compensation expense. We expect general and administrative expenses to increase as we add additional sales and administrative personnel to support the commercialization of Endari.
Other Income and Expense. Total other expense increased by $36.3 million, or 365%, to $46.2 million for the six months ended June 30, 2018, compared to $9.9 million in other expense for the six months ended June 30, 2017. The increase was primarily due to a negative change in the fair value of the warrant derivative liabilities and embedded conversion option of $7.0 million, partially offset by an increase in unrealized loss on investment in marketable securities of $33.6 million, a $6.5 million increase in interest costs as a result of increased debt and a $3.2 million loss on debt extinguishment upon early repayment of debt to GPB.
Operating Expenses Overall. We anticipate that our operating expenses will increase for, among others, the following reasons:
|
|
• |
We intend to reinforce our sales and marketing team to commercialize Endari in the U.S.; |
|
|
• |
We anticipate increases in payroll associated with an expanded infrastructure, higher consulting, legal, accounting and investor relations costs, and increases in director and officer insurance premiums; and |
|
|
• |
We expect increases in research and development activities as we undertake to obtain marketing approval for Endari outside the U.S. and as development of our product candidates continues. |
Liquidity and Capital Resources
Based on our losses to date, anticipated future revenues and operating expenses, debt repayment obligations and cash and cash equivalents balance of $2.2 million as of June 30, 2018, we do not have sufficient operating capital for our business without raising additional capital. We had an accumulated deficit at June 30, 2018 of $152.2 million. We anticipate that we will continue to incur net losses for the foreseeable future as we incur expenses for the commercialization of Endari, research costs for corneal cell sheets using Cultured Autologous Oral Mucosal Epithelial Cell Sheet (“CAOMECS”) technology and the expansion of corporate infrastructure, including costs associated with being a public reporting company. We have previously relied on private equity offerings, debt financings and loans, including loans from related parties. As part of this effort, we have received various loans from officers, stockholders and other investors as discussed below. As of June 30, 2018, we had outstanding notes payable in an aggregate principal amount of $40.3 million, consisting of $5.8 million of non-convertible promissory notes and $34.5 million of convertible notes. Of the $40.3 million aggregate principal amount of notes outstanding as of June 30, 2018, approximately $19.4 million is either due on demand or will become due and payable within the next 12 months. Our failure to raise capital as and when needed would have a negative impact on our financial condition and our ability to pursue our business strategies, including the commercialization of Endari and the development in the United States of CAOMECS-based cell sheet technology.
As described in Note 2 to our consolidated financial statements, we have had recurring operating losses, have a significant amount of notes payable and other obligations due within the next year and projected operating losses, including the expected costs relating to the commercialization of Endari that exceed both the existing cash balances and cash expected to be generated from operations for at least the remainder of 2018. In order to meet our expected obligations, management intends to raise additional funds through equity and debt financings and partnership agreements. In addition, we may seek to raise additional funds through collaborations with other companies or financing from other sources. Additional funding may not be available in amounts or on terms which are acceptable to us, if at all. Due to the uncertainty of our ability to meet our current operating and capital expenses, there is substantial doubt about our ability to continue as a going concern.
Our current cash burn rate for the six months ended June 30, 2018 was approximately $0.5 million per month.
29
Our cash flow from operations is not adequate and our future capital requirements will be substantial and may increase beyond our current expectations depending on many factors including, but not limited to: the number, duration and results of the clinical trials for our various product candidates going forward; unexpected delays or developments in seeking regulatory approvals; the time and cost in preparing, filing, prosecuting, maintaining and enforcing patent claims; other unexpected developments encountered in implementing our business and commercialization strategies; the outcome of existing and any future litigation; and further arrangements, if any, with collaborators. Revenues from AminoPure and NutreStore products are currently not significant and we are unsure whether sales of these products will increase or sales of Endari will grow as expected. Until we can generate a sufficient amount of product revenue, future cash needs are expected to be financed through public or private equity offerings, debt financings, loans, including loans from related parties, or other sources, such as strategic partnership agreements and corporate collaboration and licensing arrangements. Until we can generate a sufficient amount of product revenue, there can be no assurance of the availability of such capital on terms acceptable to us (or at all).
For the six months ended June 30, 2018 and during the year ended December 31, 2017, we borrowed varying amounts pursuant to convertible notes and non-convertible promissory notes, the majority of which have been issued to our officers and stockholders. As of June 30, 2018 and December 31, 2017, the aggregate principal amounts outstanding under convertible notes and non-convertible promissory notes totaled $34.5 million and $5.8 million, respectively. The convertible notes and non-convertible promissory notes bear interest at rates ranging from 10% to 11% and, except for the 2011 convertible note listed below in the principal amount of $0.3 million, are unsecured. The net proceeds of the loans were used for working capital purposes.
30
The table below lists our outstanding notes payable as of June 30, 2018 and December 31, 2017 and the material terms of our outstanding borrowings:
|
Year Issued |
|
Interest Rate Range |
|
|
Term of Notes |
|
Conversion Price |
|
|
Principal Outstanding June 30, 2018 |
|
|
Discount Amount June 30, 2018 |
|
|
Carrying Amount June 30, 2018 |
|
|
Shares Underlying Notes June 30, 2018 |
|
|
Principal Outstanding December 31, 2017 |
|
|
Discount Amount December 31, 2017 |
|
|
Carrying Amount December 31, 2017 |
|
|
Shares Underlying Notes December 31, 2017 |
|
||||||||||
|
Notes payable |
|
|
|
|
|
|
|
|
|
|
|
|
|
|
|
|
|
|
|
|
|
|
|
|
|
|
|
|
|
|
|
|
|
|||||||||
|
2013 |
|
10% |
|
|
Due on demand |
|
|
— |
|
|
$ |
903,100 |
|
|
$ |
— |
|
|
$ |
903,100 |
|
|
|
— |
|
|
$ |
887,600 |
|
|
$ |
— |
|
|
$ |
887,600 |
|
|
|
— |
|
|
|
2015 |
|
10% |
|
|
Due on demand |
|
|
— |
|
|
|
10,000 |
|
|
|
— |
|
|
|
10,000 |
|
|
|
— |
|
|
|
— |
|
|
|
— |
|
|
|
— |
|
|
|
— |
|
|
|
2016 |
|
10% - 11% |
|
|
Due on demand |
|
|
— |
|
|
|
843,335 |
|
|
|
— |
|
|
|
843,335 |
|
|
|
— |
|
|
|
833,335 |
|
|
|
— |
|
|
|
833,335 |
|
|
|
— |
|
|
|
2017 |
|
11% |
|
|
Due on demand |
|
|
— |
|
|
|
2,568,548 |
|
|
|
— |
|
|
|
2,568,548 |
|
|
|
— |
|
|
|
6,150,208 |
|
|
|
— |
|
|
|
6,150,208 |
|
|
|
— |
|
|
|
2018 |
|
11% |
|
|
Due on demand |
|
|
— |
|
|
|
111,000 |
|
|
|
— |
|
|
|
111,000 |
|
|
|
— |
|
|
|
— |
|
|
|
— |
|
|
|
— |
|
|
|
— |
|
|
|
|
|
|
|
|
|
|
|
|
|
|
|
$ |
4,435,983 |
|
|
$ |
— |
|
|
$ |
4,435,983 |
|
|
|
— |
|
|
$ |
7,871,143 |
|
|
$ |
— |
|
|
$ |
7,871,143 |
|
|
|
— |
|
|
|
|
|
|
|
|
|
|
|
|
|
|
|
|
|
|
|
|
|
|
|
|
|
|
|
|
|
|
|
|
|
|
|
|
|
|
|
|
|
|
|
|
|
|
|
|
|
|
|
|
Current |
|
|
|
|
|
$ |
4,435,983 |
|
|
$ |
— |
|
|
$ |
4,435,983 |
|
|
|
— |
|
|
$ |
7,871,143 |
|
|
$ |
— |
|
|
$ |
7,871,143 |
|
|
|
— |
|
|
|
|
|
|
|
|
Non-current |
|
|
|
|
|
$ |
— |
|
|
$ |
— |
|
|
$ |
— |
|
|
|
— |
|
|
$ |
— |
|
|
$ |
— |
|
|
$ |
— |
|
|
|
— |
|
|
Notes payable - related party |
|
|
|
|
|
|
|
|
|
|
|
|
|
|
|
|
|
|
|
|
|
|
|
|
|
|
|
|
|
|
|
|
|
|||||||||
|
2015 |
|
11% |
|
|
Due on demand |
|
|
— |
|
|
|
— |
|
|
|
— |
|
|
|
— |
|
|
|
— |
|
|
|
310,000 |
|
|
|
— |
|
|
|
310,000 |
|
|
|
— |
|
|
|
2016 |
|
10% |
|
|
Due on demand |
|
|
— |
|
|
|
270,000 |
|
|
|
— |
|
|
|
270,000 |
|
|
|
— |
|
|
|
810,510 |
|
|
|
— |
|
|
|
810,510 |
|
|
|
— |
|
|
|
2017 |
|
10% |
|
|
Due on demand |
|
|
— |
|
|
|
915,751 |
|
|
|
— |
|
|
|
915,751 |
|
|
|
— |
|
|
|
915,751 |
|
|
|
— |
|
|
|
915,751 |
|
|
|
— |
|
|
|
2018 |
|
11% |
|
|
Due on demand |
|
|
— |
|
|
|
159,222 |
|
|
|
— |
|
|
|
159,222 |
|
|
|
— |
|
|
|
— |
|
|
|
— |
|
|
|
— |
|
|
|
— |
|
|
|
|
|
|
|
|
|
|
|
|
|
|
|
$ |
1,344,973 |
|
|
$ |
— |
|
|
$ |
1,344,973 |
|
|
|
— |
|
|
$ |
2,036,261 |
|
|
$ |
— |
|
|
$ |
2,036,261 |
|
|
|
— |
|
|
|
|
|
|
|
|
|
|
|
|
|
|
|
|
|
|
|
|
|
|
|
|
|
|
|
|
|
|
|
|
|
|
|
|
|
|
|
|
|
|
|
|
|
|
|
|
|
|
|
|
Current |
|
|
|
|
|
$ |
1,344,973 |
|
|
$ |
— |
|
|
$ |
1,344,973 |
|
|
|
— |
|
|
$ |
2,036,261 |
|
|
$ |
— |
|
|
$ |
2,036,261 |
|
|
|
— |
|
|
|
|
|
|
|
|
Non-current |
|
|
|
|
|
$ |
— |
|
|
$ |
— |
|
|
$ |
— |
|
|
|
— |
|
|
$ |
— |
|
|
$ |
— |
|
|
$ |
— |
|
|
|
— |
|
|
Convertible notes payable |
|
|
|
|
|
|
|
|
|
|
|
|
|
|
|
|
|
|
|
|
|
|
|
|
|
|
|
|
|
|
|
|
|
|||||||||
|
2011 |
|
10% |
|
|
5 years |
|
$ |
3.05 |
|
|
$ |
300,000 |
|
|
$ |
— |
|
|
$ |
300,000 |
|
|
|
98,285 |
|
|
$ |
300,000 |
|
|
$ |
— |
|
|
$ |
300,000 |
|
|
|
98,285 |
|
|
|
2014 |
|
10% |
|
|
Due on demand - 2 years |
|
$3.05 - $3.60 |
|
|
|
504,482 |
|
|
|
— |
|
|
|
504,482 |
|
|
|
176,720 |
|
|
|
486,878 |
|
|
|
— |
|
|
|
486,878 |
|
|
|
168,766 |
|
||
|
2016 |
|
10% |
|
|
1 year - 2 years |
|
$3.60 - $4.50 |
|
|
|
182,495 |
|
|
|
18,256 |
|
|
|
164,239 |
|
|
|
54,790 |
|
|
|
1,516,329 |
|
|
|
83,298 |
|
|
|
1,433,031 |
|
|
|
441,048 |
|
||
|
2017 |
|
10% |
|
|
Due on demand - 2 years |
|
$3.50 - $10.00 |
|
|
|
5,256,547 |
|
|
|
1,852,916 |
|
|
|
3,403,631 |
|
|
|
1,409,247 |
|
|
|
36,113,296 |
|
|
|
11,232,423 |
|
|
|
24,880,873 |
|
|
|
5,357,488 |
|
||
|
2018 |
|
10% |
|
|
Due on demand - 2 years |
|
$3.50 - $10.00 |
|
|
|
13,494,055 |
|
|
|
4,660,330 |
|
|
|
8,833,725 |
|
|
|
3,611,398 |
|
|
|
— |
|
|
|
— |
|
|
|
— |
|
|
|
— |
|
||
|
|
|
|
|
|
|
|
|
|
|
|
|
$ |
19,737,579 |
|
|
$ |
6,531,502 |
|
|
$ |
13,206,077 |
|
|
|
5,350,440 |
|
|
$ |
38,416,503 |
|
|
$ |
11,315,721 |
|
|
$ |
27,100,782 |
|
|
|
6,065,587 |
|
|
|
|
|
|
|
|
|
|
|
|
|
|
|
|
|
|
|
|
|
|
|
|
|
|
|
|
|
|
|
|
|
|
|
|
|
|
|
|
|
|
|
|
|
|
|
|
|
|
|
|
Current |
|
|
|
|
|
$ |
13,230,978 |
|
|
$ |
5,060,562 |
|
|
$ |
8,170,416 |
|
|
|
3,552,804 |
|
|
$ |
12,860,912 |
|
|
$ |
5,835,910 |
|
|
$ |
7,025,002 |
|
|
|
3,449,984 |
|
|
|
|
|
|
|
|
Non-current |
|
|
|
|
|
$ |
6,506,601 |
|
|
$ |
1,470,940 |
|
|
$ |
5,035,661 |
|
|
|
1,797,636 |
|
|
$ |
25,555,591 |
|
|
$ |
5,479,811 |
|
|
$ |
20,075,780 |
|
|
|
2,615,603 |
|
|
Convertible notes payable - related party |
|
|
|
|
|
|
|
|
|
|
|
|
|
|
|
|
|
|
|
|
|
|
|
|
|
|
|
|
|
|
|
|
|
|||||||||
|
2012 |
|
10% |
|
|
Due on demand |
|
$ |
3.30 |
|
|
$ |
200,000 |
|
|
$ |
— |
|
|
$ |
200,000 |
|
|
|
71,127 |
|
|
$ |
200,000 |
|
|
$ |
— |
|
|
$ |
200,000 |
|
|
|
68,122 |
|
|
|
2015 |
|
10% |
|
|
2 years |
|
$ |
4.50 |
|
|
|
200,000 |
|
|
|
— |
|
|
|
200,000 |
|
|
|
56,109 |
|
|
|
200,000 |
|
|
|
— |
|
|
|
200,000 |
|
|
|
53,905 |
|
|
|
2017 |
|
10% |
|
|
2 years |
|
$ |
10.00 |
|
|
|
5,000,000 |
|
|
|
503,125 |
|
|
|
4,496,875 |
|
|
|
507,465 |
|
|
|
— |
|
|
|
— |
|
|
|
— |
|
|
|
— |
|
|
|
2018 |
|
10% |
|
|
2 years |
|
$ |
10.00 |
|
|
|
9,400,000 |
|
|
|
1,243,337 |
|
|
|
8,156,663 |
|
|
|
971,577 |
|
|
|
— |
|
|
|
— |
|
|
|
— |
|
|
|
— |
|
|
|
|
|
|
|
|
|
|
|
|
|
|
|
$ |
14,800,000 |
|
|
$ |
1,746,462 |
|
|
$ |
13,053,538 |
|
|
|
1,606,278 |
|
|
$ |
400,000 |
|
|
$ |
— |
|
|
$ |
400,000 |
|
|
|
122,027 |
|
|
|
|
|
|
|
|
|
|
|
|
|
|
|
|
|
|
|
|
|
|
|
|
|
|
|
|
|
|
|
|
|
|
|
|
|
|
|
|
|
|
|
|
|
|
|
|
|
|
|
|
Current |
|
|
|
|
|
$ |
400,000 |
|
|
$ |
— |
|
|
$ |
400,000 |
|
|
|
127,236 |
|
|
$ |
400,000 |
|
|
$ |
— |
|
|
$ |
400,000 |
|
|
|
122,027 |
|
|
|
|
|
|
|
|
Non-current |
|
|
|
|
|
$ |
14,400,000 |
|
|
$ |
1,746,462 |
|
|
$ |
12,653,538 |
|
|
|
1,479,042 |
|
|
$ |
— |
|
|
$ |
— |
|
|
$ |
— |
|
|
|
— |
|
|
|
|
|
|
|
|
Total |
|
|
|
|
|
$ |
40,318,535 |
|
|
$ |
8,277,964 |
|
|
$ |
32,040,571 |
|
|
|
6,956,718 |
|
|
$ |
48,723,907 |
|
|
$ |
11,315,721 |
|
|
$ |
37,408,186 |
|
|
|
6,187,614 |
|
31
Cash flows for the six months ended June 30, 2018 and June 30, 2017
Net cash provided by operating activities
Net cash flows provided by operating activities decreased by $5.6 million, or 221%, to a negative net cash flow of $3.1 million from a positive net cash flow of $2.5 million for the six months ended June 30, 2018 and 2017, respectively. This decrease was primarily due to a $35.1 million increase in net loss, offset by a $38.3 million decrease of working capital, a $34.0 million increase in the non-cash adjustments to net loss. The decrease in non-cash adjustments to net loss was primarily attributable to the following: a $33.6 million increase in unrealized loss on investment in marketable securities; a $7.0 million decrease for the change in the fair value of warrant derivative liabilities and embedded conversion option; and a $1.1 million decrease in share-based compensation, partially offset by a $3.2 million increase for loss on debt extinguishment, a $5.3 million increase in amortization of discount of convertible notes.
Net cash used in investing activities
Net cash flows used in investing activities increased by $440,000, or 518%, to $520,000 from $80,000 for the six months ended June 30, 2018 and 2017, respectively. Net cash used in investing activities includes purchase of marketable securities and investment at cost, as well as purchase of property and equipment.
Net cash from financing activities
Net cash flows from financing activities decreased by $18.1 million, or 1,424%, to negative cash flow of $16.8 million from positive cash flow of $1.3 million for the six months ended June 30, 2018 and 2017, respectively, as a result of a $23.9 million increase in repayment of convertible and non-convertible promissory notes and a $7.5 million increase in repurchase of common stock and warrants, offset by a $13.4 million increase in proceeds from issuance of convertible and non-convertible promissory notes.
Off-Balance-Sheet Arrangements
We have no off-balance sheet arrangements.
Critical Accounting Policies
Management’s discussion and analysis of financial condition and results of operations is based on our financial statements, which have been prepared in accordance with U.S. generally accepted accounting principles (“GAAP”), on the basis that the Company will continue as a going concern. Due to the uncertainty of the Company’s ability to meet its current operating and capital expenses, there is substantial doubt about the Company’s ability to continue as a going concern, as the continuation and expansion of its business is dependent upon obtaining further financing, successful and sufficient market acceptance of its products, and finally, achieving a profitable level of operations. The consolidated interim financial statements do not include any adjustments that might result from the outcome of these uncertainties. The preparation of these financial statements requires us to make estimates and judgments that affect the reported amounts of assets, liabilities and expenses. On an ongoing basis, we evaluate these estimates and judgments, including those described below. We base our estimates on our historical experience and on various other assumptions that we believe to be reasonable under the present circumstances. These estimates and assumptions form the basis for making judgments about the carrying values of assets and liabilities that are not readily apparent from other sources. Actual results may differ materially from these estimates.
Refer to “Critical Accounting Policies” in Part II, Item 7, “Management’s Discussion and Analysis of Financial Condition and Results of Operations” of the Annual Report for our critical accounting policies. There have been no material changes in any of our critical accounting policies during the six months ended June 30, 2018.
Item 3. Quantitative and Qualitative Disclosures about Market Risk
Not required for a smaller reporting company.
Item 4. Controls and Procedures
Evaluation of Disclosure Controls and Procedures
Disclosure controls and procedures (“DCP”) are controls and other procedures that are designed to ensure that information required to be disclosed by us in the reports that we file or submit under the Securities Exchange Act of 1934 (the “Exchange Act”) is recorded, processed, summarized and reported within the time periods specified in the SEC’s rules and forms. DCP include, without
32
limitation, controls and procedures designed to ensure that information required to be disclosed by us in the reports that we file under the Exchange Act is accumulated and communicated to our management, including our principal executive and financial officers, as appropriate to allow timely decisions regarding required disclosures.
As of the end of the period covered by this Form 10-Q, we conducted an evaluation, under the supervision and with the participation of our Chief Executive Officer and Chief Financial Officer, of the effectiveness of our DCP (as defined in Rule 13a-15(e) of the Exchange Act). Based upon this evaluation and due to the material weaknesses in our internal control over financial reporting as of December 31, 2017 described below, our Chief Executive Officer and Chief Financial Officer concluded that the Company’s DCP are not effective. Our management is working at remediating the material weaknesses in our internal controls over financial reporting. However, we have not yet completed a full annual accounting cycle since December 31, 2017 to fully validate the remediation of the material weaknesses in our internal controls and the effectiveness of the Company’s DCP.
Changes in Internal Control over Financial Reporting
There were no changes in our internal control over financial reporting (as defined in Rules 13a-15(f) and 15d-15(f) under the Exchange Act) that occurred during the fiscal quarter ended June 30, 2018 which have materially affected, or are reasonably likely to materially affect, our internal control over financial reporting.
Material Weakness and Plan of Remediation
A material weakness is a deficiency, or combination of deficiencies, in internal control over financial reporting such that there is a reasonable possibility that a material misstatement of the Company’s annual or interim financial statements will not be prevented or detected on a timely basis. Material weaknesses would permit information required to be disclosed by the Company in the reports that it files or submits to not be recorded, processed, summarized and reported, within the time periods specified in the SEC’s rules and forms.
We conducted an evaluation pursuant to Rule 13a‑15 of the Exchange Act of the effectiveness of the design and operation of our DCP as of December 31, 2017. This evaluation was conducted under the supervision (and with the participation) of our management, including our Chief Executive Officer and Chief Financial Officer. Based on that evaluation, our Chief Executive Officer and Chief Financial Officer concluded that our DCP were not effective as of December 31, 2017, because of the continuance of a material weakness (the “Material Weakness”) in our internal control over financial reporting, initially identified in our evaluations of the effectiveness of our internal control over financial reporting as of December 31, 2014 and 2013, with respect to the application of GAAP on certain complex transactions, as well as maintaining effective controls over the completeness and accuracy of financial reporting for complex or unusual transactions and internal communication of significant transactions.
We committed to remediating the control deficiencies that constituted the Material Weakness by implementing changes to our internal control over financial reporting. In 2017, we implemented measures designed to remediate the underlying causes of the control deficiencies that gave rise to the Material Weakness, including, without limitation:
|
|
• |
engaging a third-party accounting consulting firm to assist us in the review of our application of GAAP on complex debt financing transactions; |
|
|
• |
use of GAAP Disclosure and SEC Reporting Checklist; |
|
|
• |
increased the amount of external continuing professional training and academic education on accounting subjects for accounting staff including management staff to receive professional certification as a CPA or CMA; |
|
|
• |
enhanced the level of the precision of review controls related to our financial close and reporting; and |
|
|
• |
engaging supplemental internal and external resources. |
Our management and Board of Directors are committed to the remediation of the Material Weakness, as well as the continued improvement of our overall system of DCP. We are in the process of implementing measures to remediate the underlying causes of the control deficiencies that gave rise to the Material Weakness, which primarily include engaging additional and supplemental internal and external resources with the technical expertise in GAAP, as well as to implement new policies and procedures to provide more effective controls to track, process, analyze, and consolidate the financial data and reports.
33
We believe these measures, once fully implemented, will remediate the control deficiencies that gave rise to the Material Weakness. As we continue to evaluate and work to remediate these control deficiencies, we may determine that additional remedial measures are required.
34
Not applicable.
Please refer to the risk factors disclosed in the “Risk Factors” section of the Annual Report.
Item 2. Unregistered Sales of Equity Securities and Use of Proceeds
On April 3, 2018, the Company issued a convertible note to a third party in the principal amount of $250,000 that bears interest at 10% per annum and matures on the two-year anniversary date of the note. The principal amount plus any unpaid accrued interest due under the convertible note is convertible into shares of the Company’s common stock at $10.00 per share at any time during the term of the note upon the election of the holder.
On April 14, 2018, the Company refinanced a convertible note to a third party in the original principal amount of $3,946,340 with a new convertible note in the principal amount of $4,143,657 that bears interest at 10% per annum and matures in six months with an option on the part of the holder to renew for up to six months. The principal amount plus any unpaid accrued interest due under the convertible note is convertible into shares of Company common stock at $3.50 per share at any time during the term of the note upon the election of the holder.
On May 29, 2018, the Company refinanced a convertible note payable to a third party in the original principal amount of $260,334 with a new convertible note in the principal amount of $312,401 that bears interest at 10% per annum. The term of this note is two years from the date of issuance. The principal amount and any unpaid interest due under the note are convertible into shares of the Company’s common stock at $3.60 per share at any time during the term of this note upon election of the holder.
On May 30, 2018, the Company refinanced a convertible note payable to a third party in the original principal amount of $360,000 with a new convertible note in the principal amount of $432,000 that bears interest at 10% per annum. The term of this note is due on demand up to two years from the date of issuance. The principal amount and any unpaid interest due under the note are convertible into shares of the Company’s common stock at $4.50 per share at any time during the term of this note upon election of the holder.
On May 30, 2018, the Company refinanced a convertible note payable a third party in the original principal amount of $1,000,000 with a new convertible note in the principal amount of $1,100,000 that bears interest at 10% per annum. The note is due on demand up to one year from the date of issuance. The principal amount and any unpaid interest due under the note are convertible into shares of the Company’s common stock at $7.60 per share at any time during the term of the note upon election of the holder.
On June 6, 2018, the Company refinanced a convertible note payable to a third party in the original principal amount of $120,000 with a new convertible note in the principal amount of $144,000 that bears interest at 10% per annum. The term of this note is due on demand up to two years from the date of issuance. The principal amount and any unpaid interest due under the note are convertible into shares of the Company’s common stock at $4.50 per share at any time during the term of this note upon election of the holder.
All of the securities noted above were issued in reliance upon the exemption from registration provided by Section 4(a)(2) of the Securities Act of 1933, as amended (the “Securities Act”), or Regulation D under the Securities Act or, in the case of refinancings, upon the exemption from registration provided by Section 3(a)(9) of the Securities Act. These securities qualified for exemption under Section 4(a)(2) of the Securities Act or Regulation D because the issuances did not involve a “public offering.” The issuances were not a public offering based upon the following factors: (i) a limited number of securities were issued to a limited number of investors; (ii) there was no public solicitation; (iii) each investor was an “accredited investor” as such term is defined by Rule 501 under the Securities Act; and (iv) the investment intent of the investors. No broker-dealers were used in connection with such sales of unregistered securities. The securities issued in reliance upon the exemption from regulation Section 365(a) of the Securities Act qualified for the exemption because they were issued exclusively in exchange for our outstanding securities where no commission or remuneration was paid or given in soliciting the exchange.
35
The following table sets forth information with respect to the Company’s purchase of shares of the Company common stock during the three-month period ended June 30, 2018:
ISSUER PURCHASES OF EQUITY SECURITIES
|
|
(a) Total Number of Shares Purchased |
|
|
(b) Average Price Paid per Share |
|
|
(c) Total Number of Shares Purchased as part of Publicly Announced Plans or Programs |
|
|
(d) Maximum Number (or Approximate Dollar Value) of Shares (or Units) that May Yet Be Purchased Under the Plans or Programs |
|
|||||
|
January 1 - 31, 2018 |
|
|
— |
|
|
|
— |
|
|
|
— |
|
|
|
— |
|
|
February 1 - 28, 2018 |
|
|
— |
|
|
|
— |
|
|
|
— |
|
|
|
— |
|
|
March 1 - 31, 2018 |
|
700,000(1) |
|
|
$ |
5.00 |
|
|
|
— |
|
|
N/A |
|
||
|
(1) |
The shares were purchased on March 29, 2018 from a single stockholder in a privately negotiated transaction. In connection with the repurchase, the Company also purchased from the stockholder warrants to purchase a total of 800,000 shares of the Company common stock. The total purchase price was $7.5 million. |
Item 3. Defaults Upon Senior Securities
None.
Item 4. Mine Safety Disclosures
Not applicable.
None.
36
(a)Exhibits
|
Exhibit Number |
|
Description of Document |
|
|
|
|
|
4.1 |
|
Convertible Promissory Note dated April 3, 2018 issued by the registrant to Tong Kam Ho. |
|
|
|
|
|
4.2 |
|
|
|
|
|
|
|
4.3 |
|
Convertible Promissory Note dated May 29, 2018 issued by the registrant to Wong Shuk Ching Judy. |
|
|
|
|
|
4.4 |
|
|
|
|
|
|
|
4.5 |
|
|
|
|
|
|
|
10.1 |
|
Promissory Note dated May 30, 2018 issued by the registrant to The Shitabata Family Trust. |
|
|
|
|
|
31.1 |
|
|
|
|
|
|
|
31.2 |
|
|
|
|
|
|
|
32.1* |
|
|
|
|
|
|
|
101.INS |
|
XBRL Instance Document |
|
|
|
|
|
101.SCH |
|
XBRL Taxonomy Extension Schema Document |
|
|
|
|
|
101.CAL |
|
XBRL Taxonomy Extension Calculation Linkbase Document |
|
|
|
|
|
101.DEF |
|
XBRL Taxonomy Extension Definition Linkbase Document |
|
|
|
|
|
101.LAB |
|
XBRL Taxonomy Extension Label Linkbase Document |
|
|
|
|
|
101.PRE |
|
XBRL Taxonomy Extension Presentation Linkbase Document |
|
* |
This exhibit shall not be deemed “filed” for purposes of Section 18 of the Securities Exchange Act of 1934 or otherwise subject to the liabilities of that section, nor shall it be deemed incorporated by reference in any filing under the Securities Act of 1933 or the Securities Exchange Act of 1934, whether made before or after the date hereof and irrespective of any general incorporation language in any filings. |
37
Pursuant to the requirements of the Securities Exchange Act of 1934, the Registrant has duly caused this report to be signed on its behalf by the undersigned, thereunto duly authorized.
|
|
Emmaus Life Sciences, Inc. |
||
|
|
|
|
|
|
Dated: August 14, 2018 |
By: |
|
/s/ Yutaka Niihara |
|
|
Name: |
|
Yutaka Niihara, M.D., M.P.H. |
|
|
Its: |
|
Chief Executive Officer |
|
|
|
|
(principal executive officer and duly authorized officer) |
|
|
|
|
|
|
|
By: |
|
/s/ Kurt H. Kruger |
|
|
Name: |
|
Kurt H. Kruger |
|
|
Its: |
|
Chief Financial Officer |
|
|
|
|
(principal financial and accounting officer) |
38