Attached files
| file | filename |
|---|---|
| 8-K - 8-K - Boot Barn Holdings, Inc. | a18-18688_18k.htm |
IMPORTANT INFORMATION Forward-Looking Statements This presentation contains forward-looking statements that are subject to risks and uncertainties. All statements other than statements of historical fact included in this presentation are forward-looking statements. You can identify forward-looking statements by the fact that they generally include words such as "anticipate," "estimate," "expect," "project," "plan,“ "intend," "believe," “outlook” and other words of similar meaning in connection with any discussion of the timing or nature of future operating or financial performance or other events but not all forward-looking statements contain these identifying words. These forward-looking statements are based on assumptions that the Company’s management has made in light of their industry experience and on their perceptions of historical trends, current conditions, expected future developments and other factors they believe are appropriate under the circumstances. As you consider this presentation, you should understand that these statements are not guarantees of performance or results. They involve risks, uncertainties (some of which are beyond the Company’s control) and assumptions. These risks, uncertainties and assumptions include, but are not limited to, the following: decreases in consumer spending due to declines in consumer confidence, local economic conditions or changes in consumer preferences and the Company’s ability to effectively: execute on its growth strategy; maintain and enhance its strong brand image; compete effectively; maintain good relationships with its key suppliers; and improve and expand its exclusive product offerings. The Company discusses the foregoing risks and other risks in greater detail under the heading “Risk factors” in the periodic reports filed by the Company with the Securities and Exchange Commission. Although the Company believes that these forward-looking statements are based on reasonable assumptions, you should be aware that many factors could affect the Company’s actual financial results and cause them to differ materially from those anticipated in the forward-looking statements. Because of these factors, the Company cautions that you should not place undue reliance on any of these forward-looking statements. New risks and uncertainties arise from time to time, and it is impossible for the Company to predict those events or how they may affect the Company. Further, any forward-looking statement speaks only as of the date on which it is made. Except as required by law, the Company does not intend to update or revise the forward-looking statements in this presentation after the date of this presentation. Industry and Market Information Statements in this presentation concerning our industry and the markets in which we operate, including our general expectations and competitive position, business opportunity and market size, growth and share, are based on information from independent industry organizations and other third-party sources, data from our internal research and management estimates. Management estimates are derived from publicly available information and the information and data referred to above, and are based on assumptions and calculations made by us based upon our interpretation of such information and data. The information and data referred to above are imprecise and may prove to be inaccurate because the information cannot always be verified with complete certainty due to the limitations on the availability and reliability of raw data, the voluntary nature of the data gathering process and other limitations and uncertainties. As a result, please be aware that the data and statistical information in this presentation may differ from information provided by our competitors or from information found in current or future studies conducted by market research institutes, consultancy firms or independent sources. Non-GAAP Financial Measures The Company presents Adjusted EBITDA and Adjusted EBIT because they are important financial measures that its management, board of directors and lenders use to assess the Company’s operating performance. However, Adjusted EBITDA and Adjusted EBIT are non-GAAP financial measures and should not be considered in isolation or as an alternative to net income or any other measure of financial performance calculated and presented in accordance with GAAP. The Company defines Adjusted EBITDA as earnings before interest, income tax, depreciation and amortization, or EBITDA, adjusted to exclude non-cash stock-based compensation, the non-cash accrual for future award redemptions, acquisition- related expenses, acquisition-related integration costs, amortization of inventory fair value adjustment, loss on disposal of assets and contract termination costs, secondary offering costs, store impairment charges and other due diligence expenses. Adjusted EBIT is defined as Adjusted EBITDA less depreciation and amortization. In addition, for fiscal year 2017, which was a 53-week fiscal year, the Company has made further adjustments to account for the extra week. Since Adjusted EBITDA and Adjusted EBIT are non-GAAP financial measures, they are susceptible to varying calculations and the Company’s Adjusted EBITDA and Adjusted EBIT may not be comparable to similarly titled measures of other companies, including companies in its industry. See the Appendix to this presentation for a reconciliation of Adjusted EBITDA to Net Income. 2
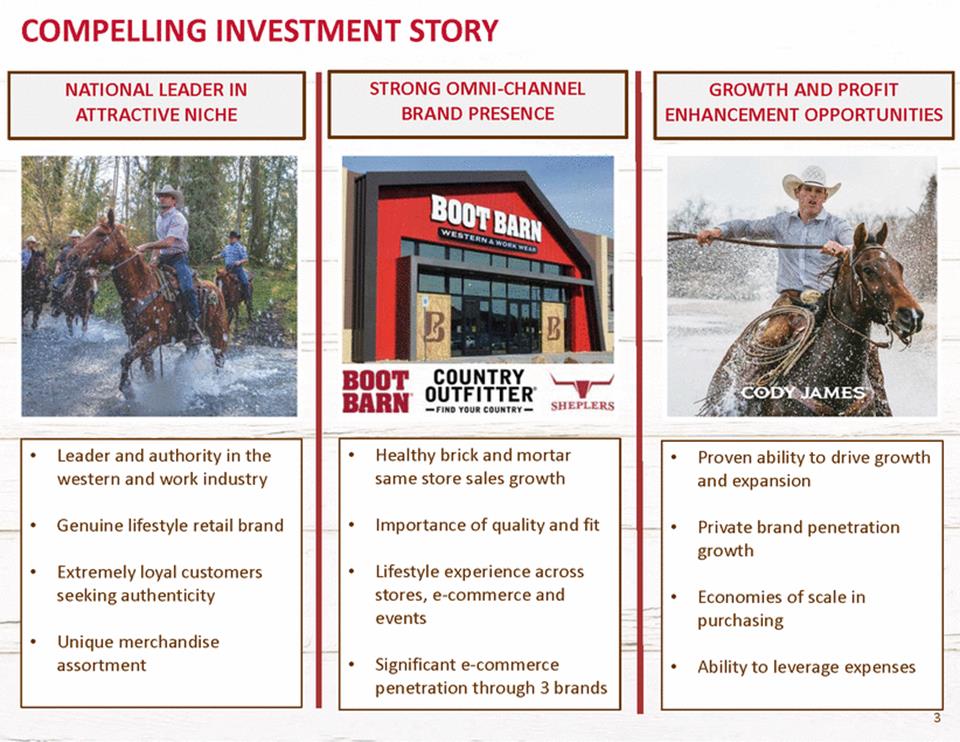
COMPELLING INVESTMENT STORY • • Healthy brick and mortar same store sales growth Leader and authority in the western and work industry • Proven ability to drive growth and expansion • • Genuine lifestyle retail brand Importance of quality and fit • Private brand penetration growth • • Lifestyle experience across stores, e-commerce and events Extremely loyal customers seeking authenticity • Economies of scale in purchasing • Unique merchandise assortment • Significant e-commerce penetration through 3 brands • Ability to leverage expenses 3 GROWTH AND PROFIT ENHANCEMENT OPPORTUNITIES STRONG OMNI-CHANNEL BRAND PRESENCE NATIONAL LEADER IN ATTRACTIVE NICHE
AGENDA BOOT BARN STORY STRATEGIC INITIATIVES DRIVE SAME STORE SALES GROWTH 1 CONTINUE OMNI-CHANNEL LEADERSHIP 2 BUILD OUT EXCLUSIVE BRAND PORTFOLIO 3 EXPAND OUR STORE BASE 4 APPENDIX 4
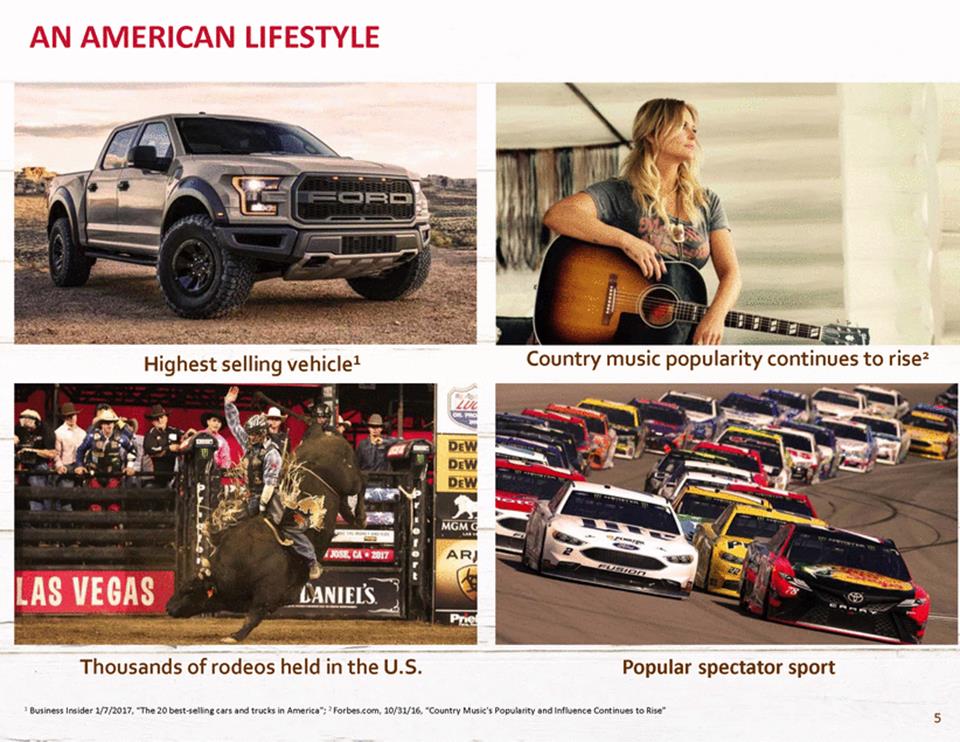
AN AMERICAN LIFESTYLE Country music popularity continues to rise2 Highest selling vehicle1 Thousands of rodeos held in the U.S. Popular spectator sport 1 Business Insider 1/7/2017, “The 20 best-selling cars and trucks in America”; 2 Forbes.com, 10/31/16, “Country Music’s Popularity and Influence Continues to Rise” 5
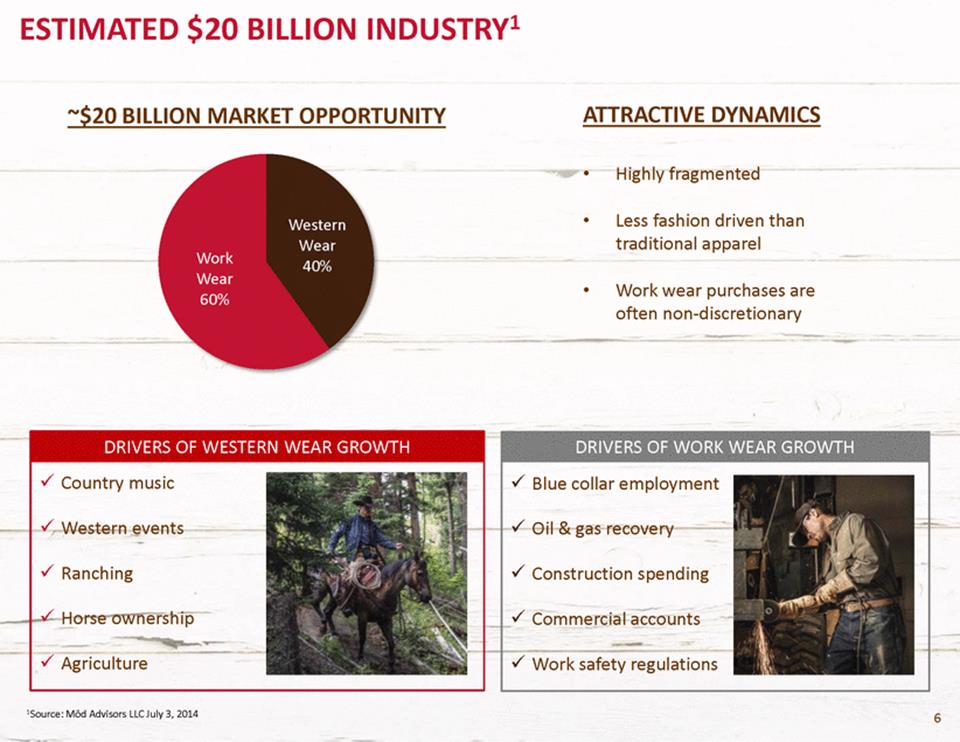
ESTIMATED $20 BILLION INDUSTRY1 ATTRACTIVE DYNAMICS ~$20 BILLION MARKET OPPORTUNITY • Highly fragmented • Less fashion driven than traditional apparel Western Wear 40% Work Wear 60% • Work wear purchases are often non-discretionary 1Source: Mod Advisors LLC July 3, 2014 6 DRIVERS OF WESTERN WEAR GROWTH Country music Western events Ranching Horse ownership Agriculture DRIVERS OF WORK WEAR GROWTH Blue collar employment Oil & gas recovery Construction spending Commercial accounts Work safety regulations
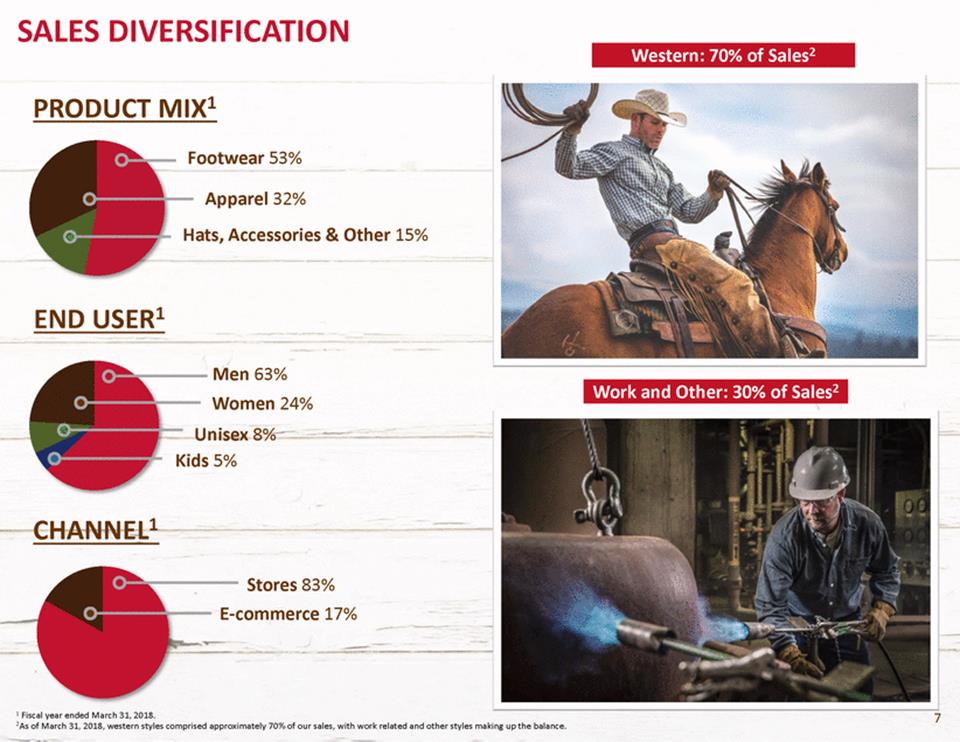
SALES DIVERSIFICATION PRODUCT MIX1 Footwear 53% Apparel 32% Hats, Accessories & Other 15% END USER1 Men 63% Women 24% Unisex 8% Kids 5% CHANNEL1 Stores 83% E-commerce 17% 1 Fiscal year ended March 31, 2018. 2As of March 31, 2018, western styles comprised approximately 70% of our sales, with work related and other styles making up the balance. 7 Work and Other: 30% of Sales2 Western: 70% of Sales2
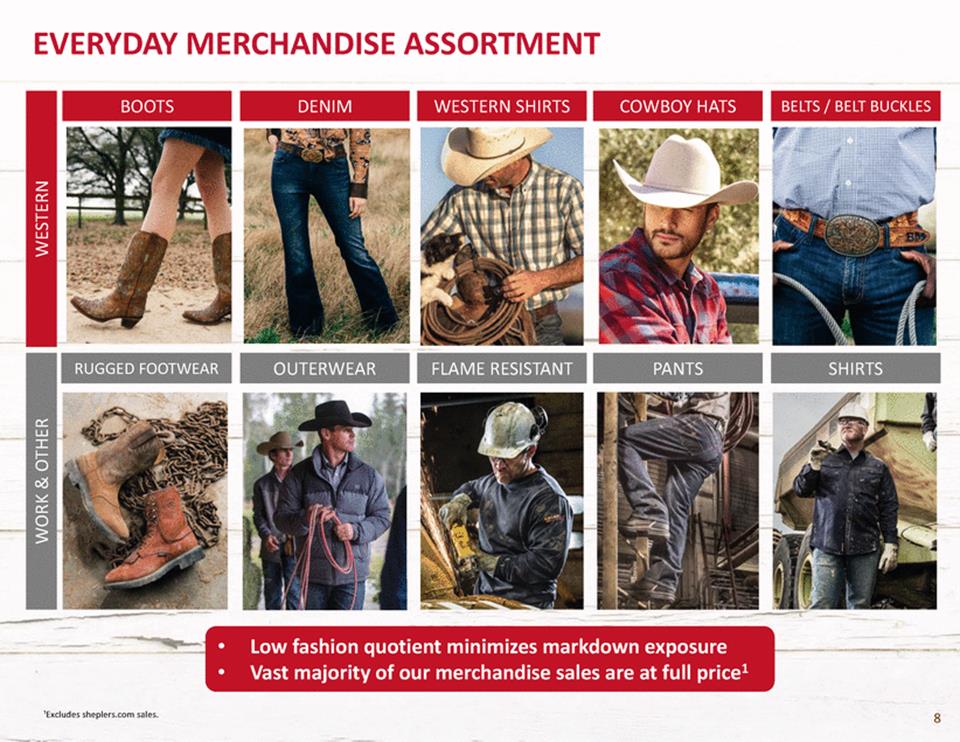
EVERYDAY MERCHANDISE ASSORTMENT • • Low fashion quotient minimizes markdown exposure Vast majority of our merchandise sales are at full price1 ¹Excludes sheplers.com sales. 8 WORK & OTHER WESTERN SHIRTS PANTS FLAME RESISTANT OUTERWEAR RUGGED FOOTWEAR BELTS / BELT BUCKLES COWBOY HATS WESTERN SHIRTS DENIM BOOTS
STRONG HISTORY OF GROWTH NET SALES ($MM) 10% CAGR ~24% $678 9% $619 $569 41% $403 48% $346 1 FY13 FY14 FY15 FY16 FY17 FY18 ADJUSTED EBITDA ($MM) ADJUSTED EBIT ($MM) $66 $49 $46 1 1 FY13 FY14 FY15 FY16 FY17 FY18 FY13 FY14 FY15 FY16 FY17 FY18 Note: Fiscal year ends March. FY13 includes 29 stores acquired from RCC with 7 month net sales of $35.5 million. FY14 includes 30 stores acquired from Baskins with 10 month net sales of $63.4 million. Sheplers was acquired June 29, 2015, the beginning of Q2 FY16. ¹Fiscal 2017 was a 53-week year. The fiscal 2017 reported results have been adjusted above to reflect management’s estimated 52-week results. See the reconciliation included in the Appendix. 9 $39 $41 $32 $23 $60$58 $48 $40 $29 16% $233
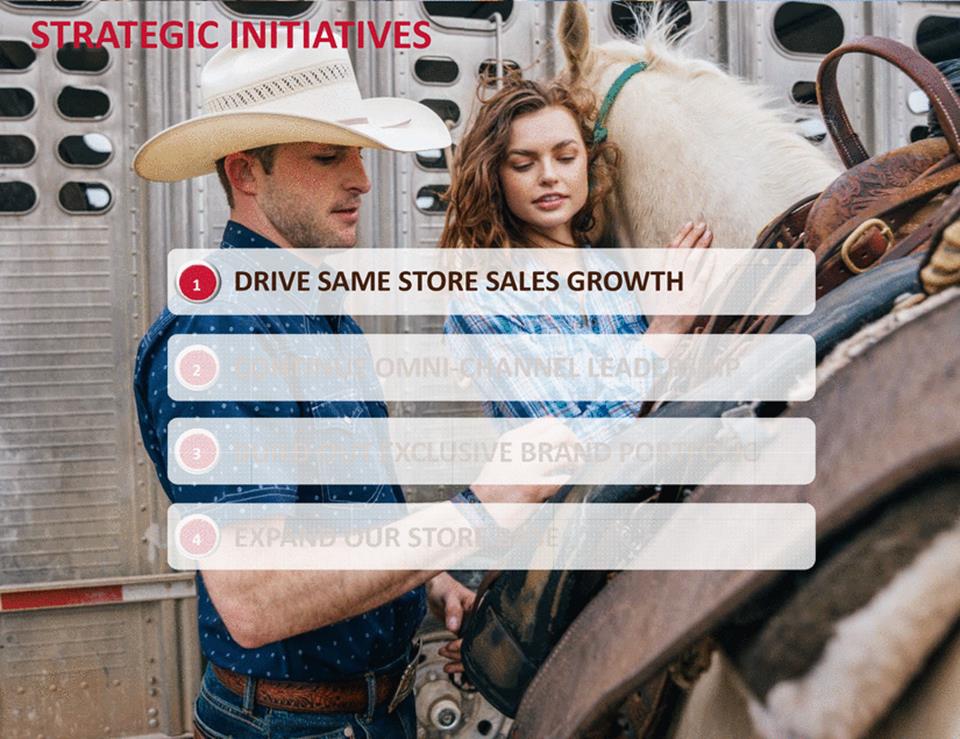
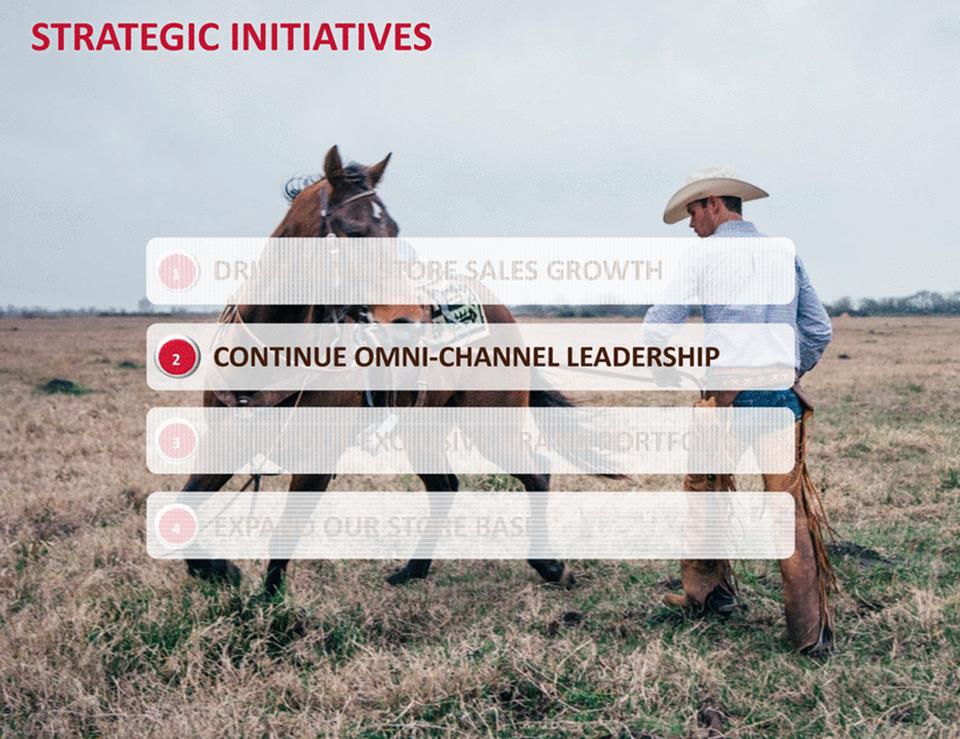
STRATEGIC INITIATIVES DRIVE SAME STORE SALES GROWTH 1 CONTINUE OMNI-CHANNEL LEADERSHIP 2 BUILD OUT EXCLUSIVE BRAND PORTFOLIO 3 EXPAND OUR STORE BASE 4 10 10
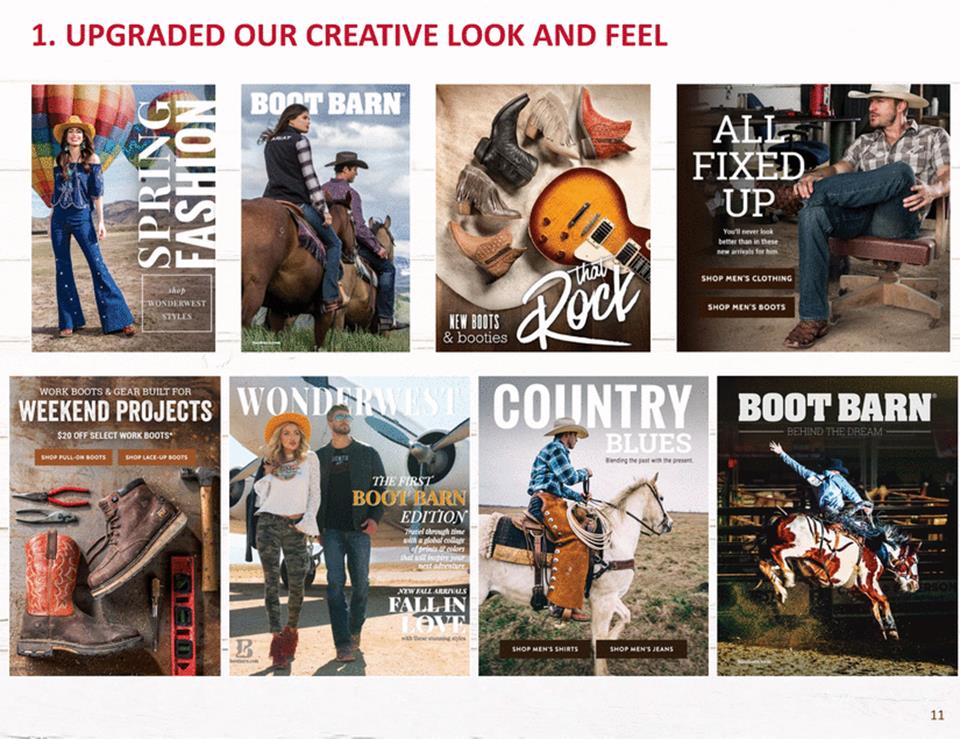
1. UPGRADED OUR CREATIVE LOOK AND FEEL 11
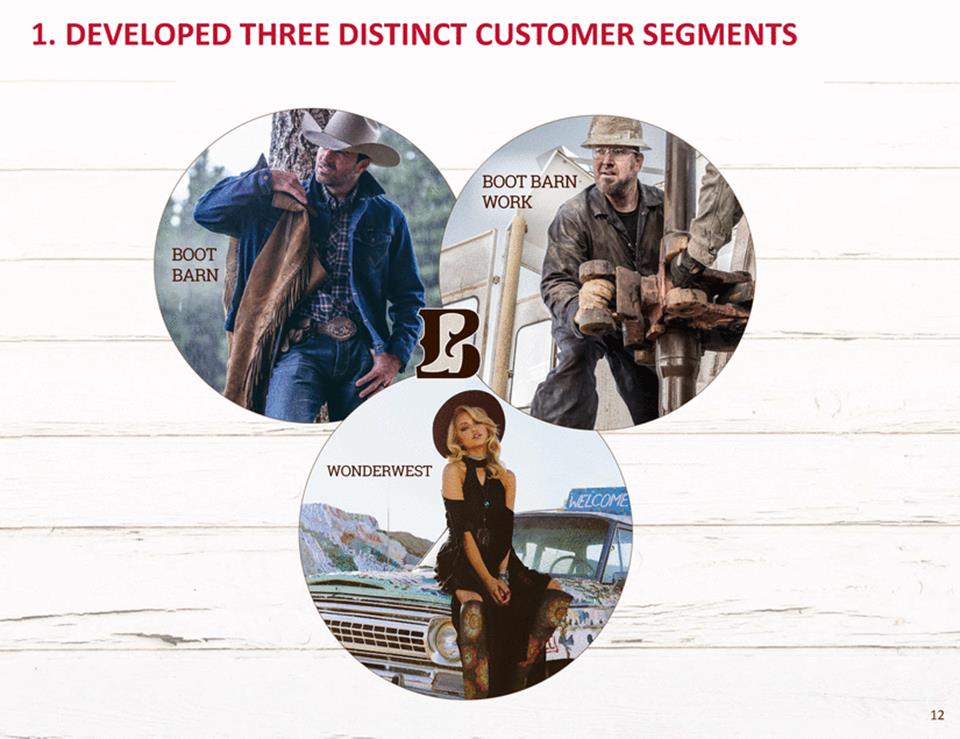
1. DEVELOPED THREE DISTINCT CUSTOMER SEGMENTS 12
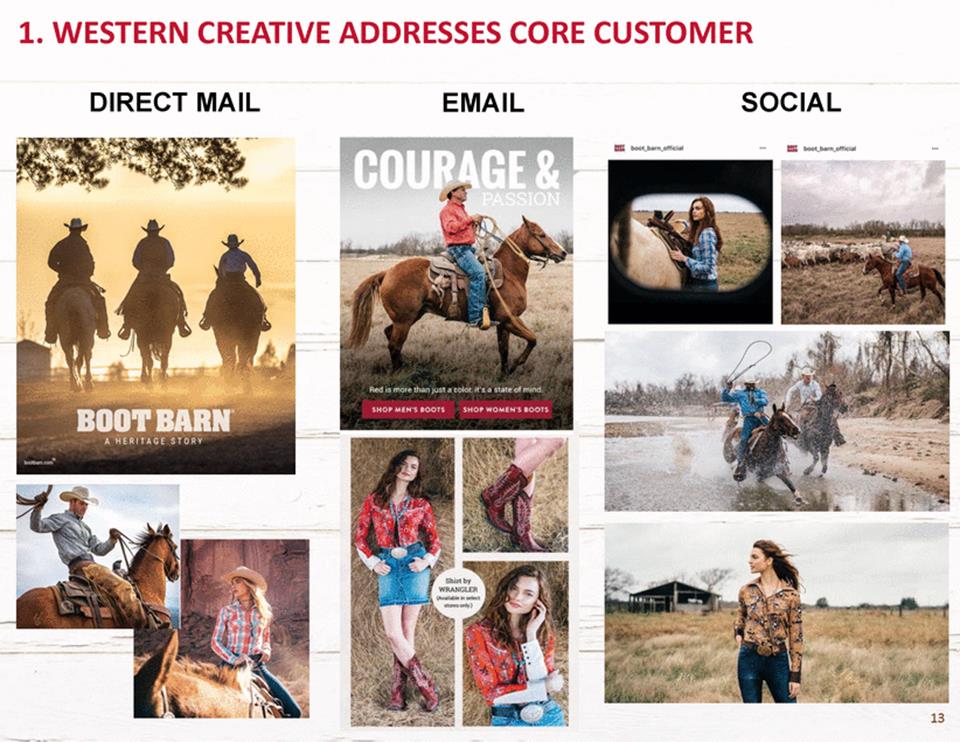
1. WESTERN CREATIVE ADDRESSES CORE CUSTOMER DIRECT MAIL SOCIAL EMAIL ... 1m booU>om..ofllclol
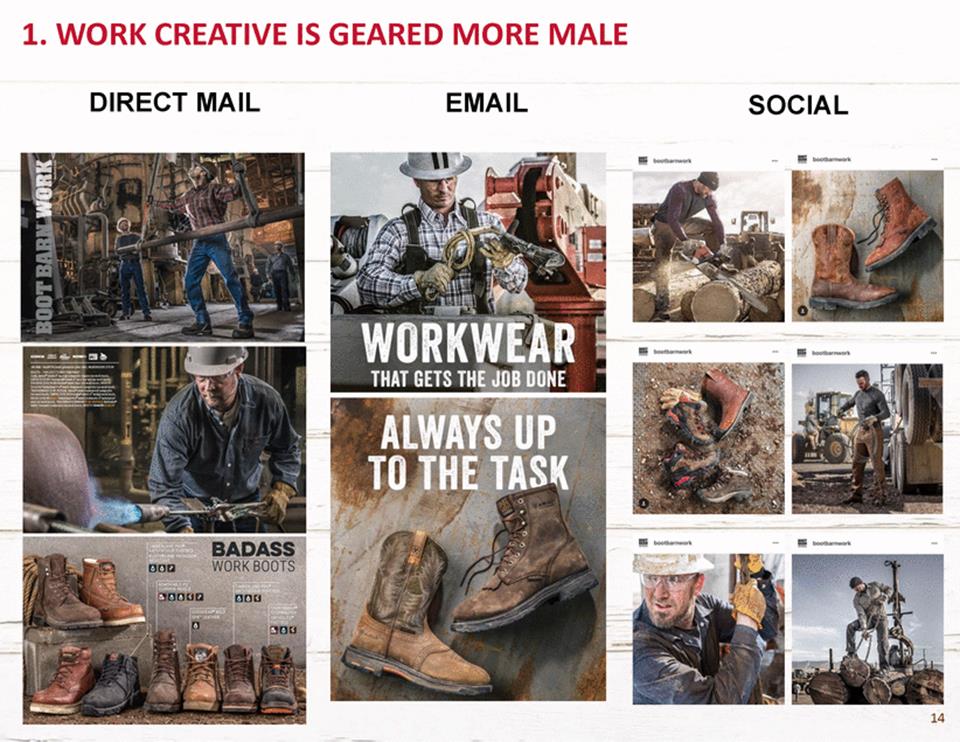
1. WORK CREATIVE IS GEARED MORE MALE DIRECT MAIL EMAIL SOCIAL
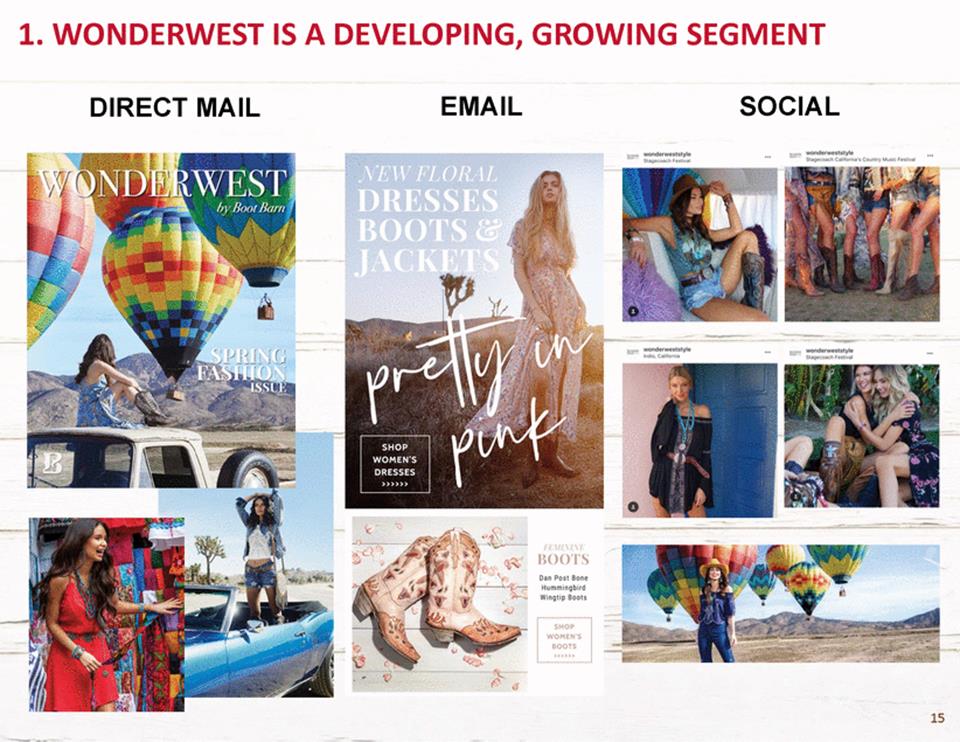
1.WONDERWEST IS A DEVELOPING,GROWING SEGMENT SOCIAL DIRECT MAIL EMAIL .. • • wonct«wtatnvt• St hC•rortu·•CourtfryMUMr••trv.. ... • wonc:t..-w. .tttyt. hfett•.... f; "' 1/lll\1\1 H>O'', Dan Post Bone Hummingbird Wingtip Boots <V-15
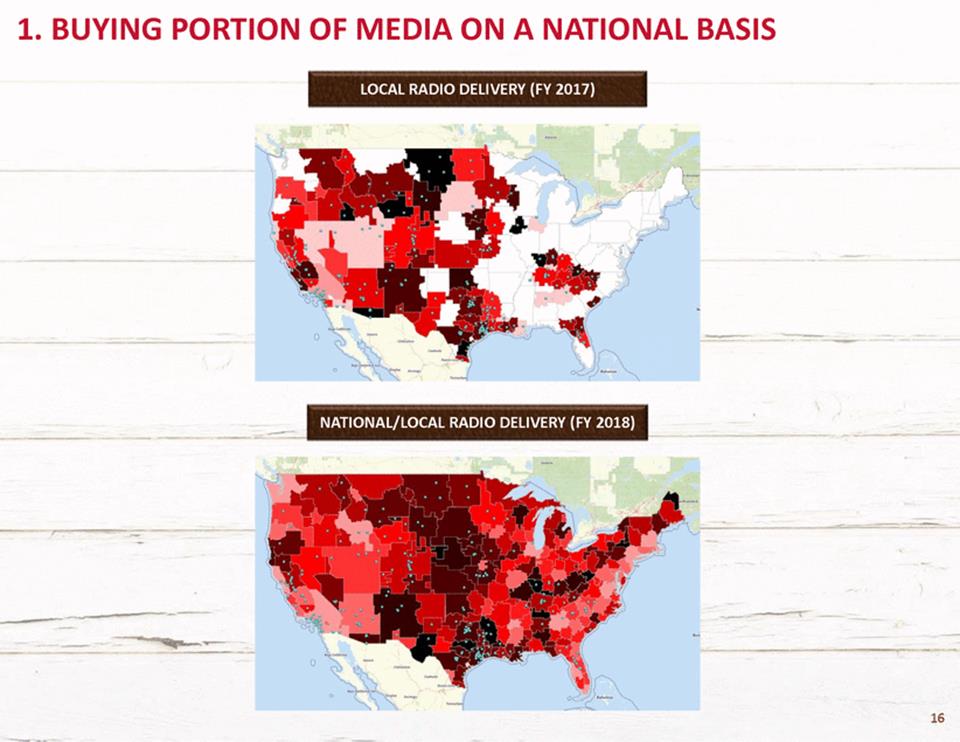
1. BUYING PORTION OF MEDIA ON A NATIONAL LOCAL RADIO DELIVERY (FY 2017) BASIS NATIONAL/LOCAL RADIO DELIVERY (FY 2018) 16
1.LEVERAGING BROAD REACH OF TV TO ATTRACT NEW CUSTOMERS - - --17
1. DRIVE SAME STORE SALES GROWTH 19.6% 17.8% 14.3% 12.1% 11.6% 7.7% 7.3% 7.2% -0.9% 1.2% -2.0% Q1Q2Q3Q4Q1 Q2Q3 '12'12 Q4Q1Q2 '12'13'13 Q3Q4Q1Q2Q3Q4Q1 '13'13'14'14'14'14'15 Q2 '15 Q3 '15 Q4Q1Q2Q3Q4Q1Q2Q3Q4Q1Q2Q3Q4Q1 '15'16'16'16'16'17'17'17'17'18'18'18'18'19 '11 '11'11'11'12 18 18.1% 16.2% 13.8%14.2% 14.1% 7.7% 16.9% 10.7% 8.9% 8.2% 7.1%7.0% 5.6%5.2% 3.8% 1.8%1.8% 0.1%0.4%0.2% 7.5% 1.3% -
STRATEGIC INITIATIVES DRIVE SAME STORE SALES GROWTH 1 CONTINUE OMNI-CHANNEL LEADERSHIP 2 BUILD OUT EXCLUSIVE BRAND PORTFOLIO 3 EXPAND OUR STORE BASE 4 19 19
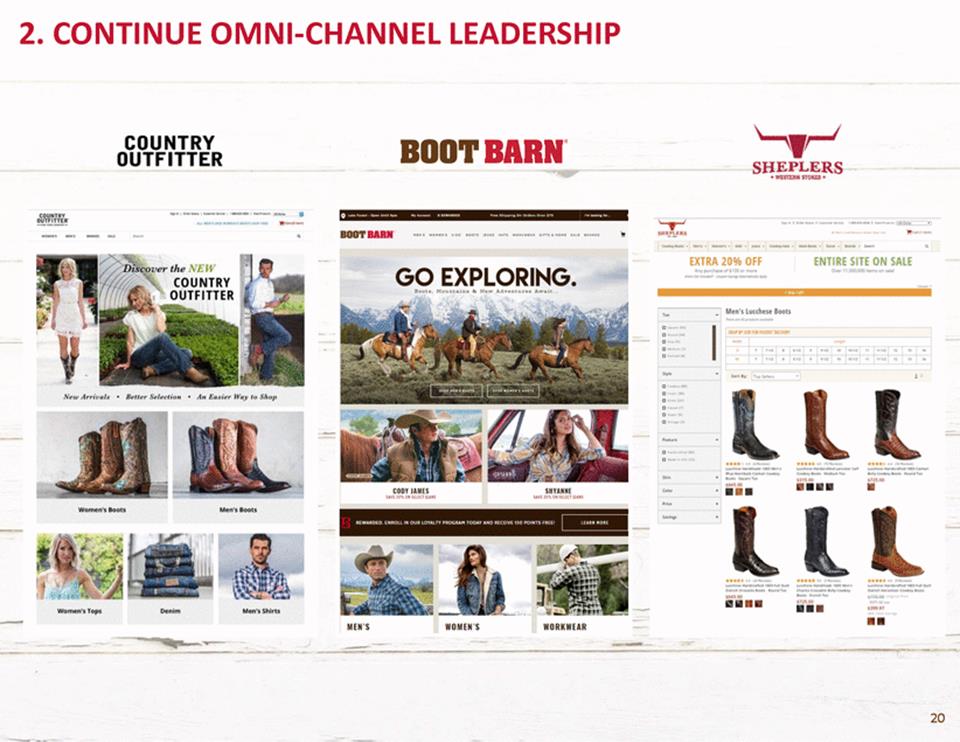
2. CONTINUE OMNI-CHANNEL LEADERSHIP .,-I SHEPLERS •WES'I'ERHSTOW• COUNTRY OUTFITTER BOO,.BARN. . .....,._.... ----·---·---,._ ,.., o...,.,.'....'"• '"•••• or-uoro COUNTRY T!,I!!!, '••• ' ..• .,_. o...o••• O••• $" -..,. -... _,. -·,..... .....,_. - EXTRA 20% OFF ·,....... ENTIRE SITE ON SALE tt.QCQ.OOO..........,.... 800'1'BARN' Discover the NEW GO EXPLORING. COUNTRY OUTFITTER Mtn's lucchtst Boots I 0 0 0 0 0 0 0 0 0 0 0 ,....... 0 0 Nw Arrivals • B.tltu• Stlectio r • Att Ea.1ier Way to Shop ........-,.. .... ...... - • nnoo ••• CODY JAMES U'fllO'Ii.Oif SiUCTIU.ItS SHYANNE Sh'[ JO"OH Si:UOlUlU Men's loots Women's Boots II£WA AD£0 £NAOLL IN OUR LOYALTY PAOC.A.lM TODAY AND A£UIY[ 150 POINTS rAH• ....,...._ -'"-·-.....-,.....-....·. .............•.'"_""_"'llt.U_f....,.. =:.:.:::.-...c...-.... a••• St4)00 •171)0•0• '"''" women·srops Denim Men'sShirts •• - - -MEN'S WOMEN 'S WORKWEAR 20 0 ••••,.
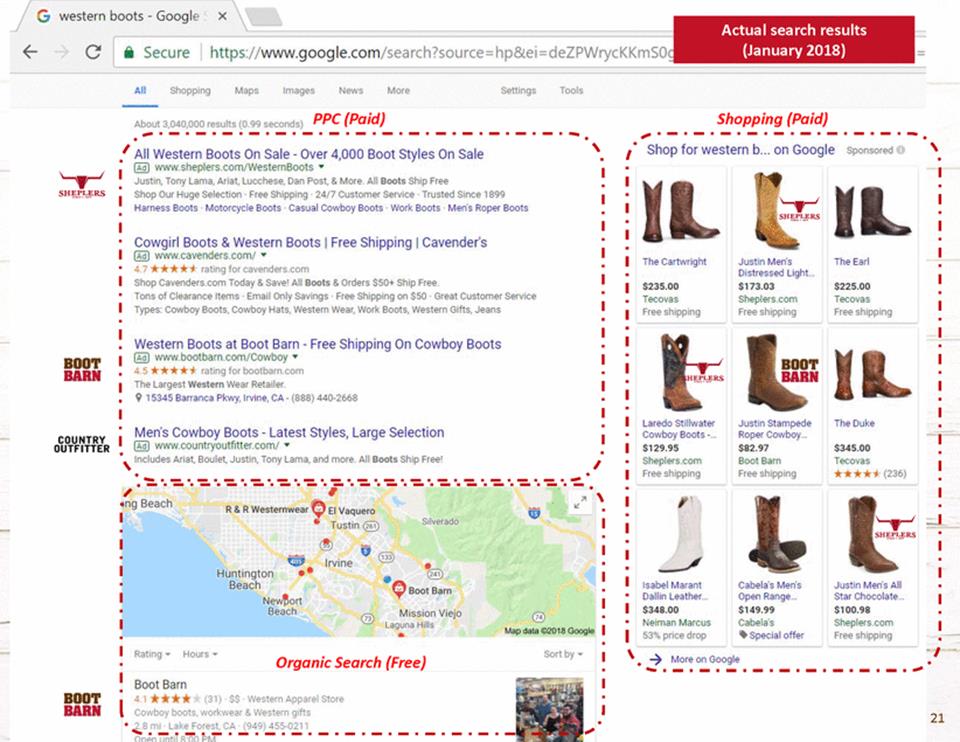
j G western boots - Google x c iSecure I https://www.google.com/search?source=hp&ei=deZPWrycKKmSO• (January 2018) All Shoppmg Maps Images News More Sett1ngs Tools Ab-ou-t 3-,04·0,0-00·res-ult·s (0-.9·9 s-eco·nd-s) ·P-P·C-(P·a-id·} -·-·-·-·-·-·-·-Shopping (Paid) • .,-·-·-·-·-·-·-··-·-·--.• • • ' Shop for western b... on Google .' All Western Boots On Sale - Over 4,000 Boot Styles On Sale Iwww.sheplers.com/WestemBoots • Justin,Tony Lama,Ariat, Lucchese, Dan Post,& More All Boots Sh1p Free 1 Sponsored ' • Shop Our Huge Selection Free Shipping 24/7 Customer Service · Trusted Since 1899 Harness Boots · Motorcycle Boots ·Casual Cowboy Boots ·Work Boots Mens Roper Boots Cowgirl Boots & Western Boots I Free Shipping I Cavender's • www.cavenders.com/ ... 4 7 ****1 rating for cavenders.com Justin Men's Distressed Light.. $173.03 Sheplers.com Free shipping The Cartwright The Earl • Shop Cavenders.com Today & Save! All Boots & Orders $50+ Ship Free. Tons of Clearance Items · EmailOnly Savings·Free Shipping on S50 Great Customer Service Types·Cowboy Boots,Cowboy Hats,Westem Wear, Work Boots,Western Gifts,Jeans $235.00 Tecovas Free shipping . $225.00 Tecovas Free shipping • • Western Boots at Boot Barn - Free Shipping On Cowboy Boots www.bootbam.com/Cowboy ... BOOT 4 5 ****1 rating for bootbam.com The Largest Western Wear Retailer. 9 15345 Barranca Pkwy,Irvine,CA - {888) 440-2668 BARN • • Laredo Stillwater Cowboy Boots -... $129.95 Sheplers.com Free shipping Justin Stampede Roper Cowboy... $82.97 Boot Barn Free shipping The Duke -. • Men's Cowboy Boots - Latest Styles, Large Selection www.countryoutfrtter.com/ ... COUNTRY OUTFITTER S345.00 •'Includes Ariat,Boulet, Justin,Tony Lama, and more. All Boots Ship Free! ·._-.·--.·--.·--.·--• .·--.·--.·-·.-·.-·. -·. -·. -·-·. -·. -·..-.,.•. Tecovas ****"' (236) e \ •g Beach R & R Westemwear 'Y' ElVaquero • Tustin Silverado -· ijjj rvine @) •(§ Boot Barn •• Huntington Beach Isabel Marant Dallin Leather... $348.00 Neiman Marcus 53% price drop Cabela's Men's Open Range... $149.99 Cabela's •Special offer Just n Men's All Star Chocolate... $100.98 Sheplers.com Free shipping Neort Beach @) Lag.u.na Hills Mission Vlejo @ Map dala @2018 Google _ , \ • .-.7. ·M-ore·on-G·oog-le ·-·-·-·-·-·-·'• Ratmg • Hours • SOrt by • Organic Search (Free) Boot Barn BOOT 4 1 (31) SS Western ApparelStore l Cowboy boots. workwear & Western gifts BARN 21 • Actual search results
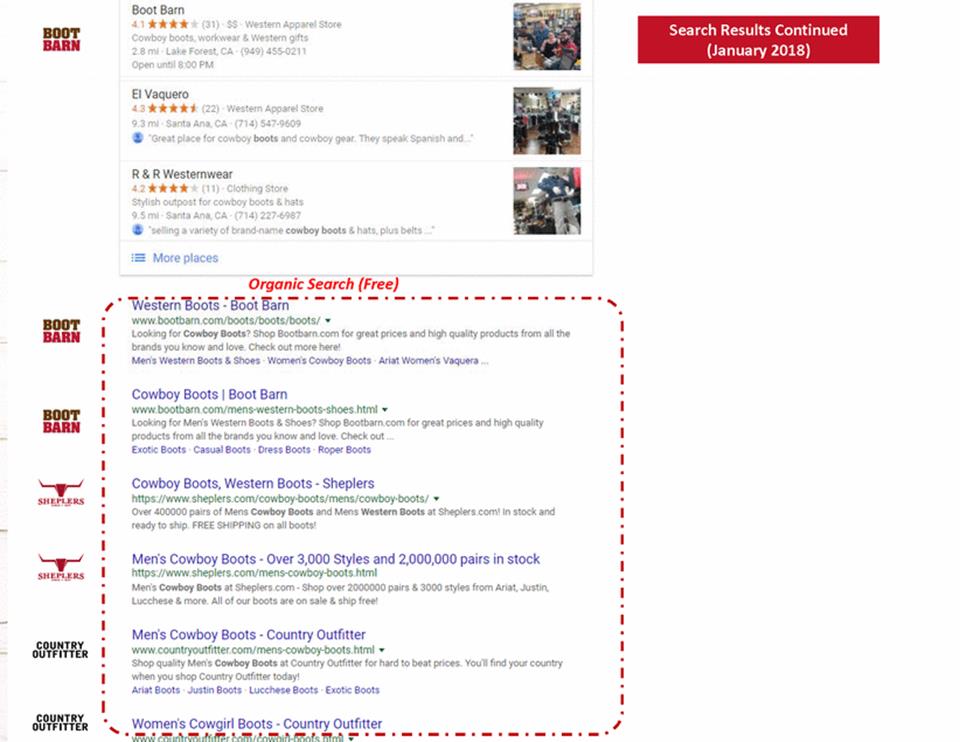
Organic Search (Free) 22 Search Results Continued (January 2018)
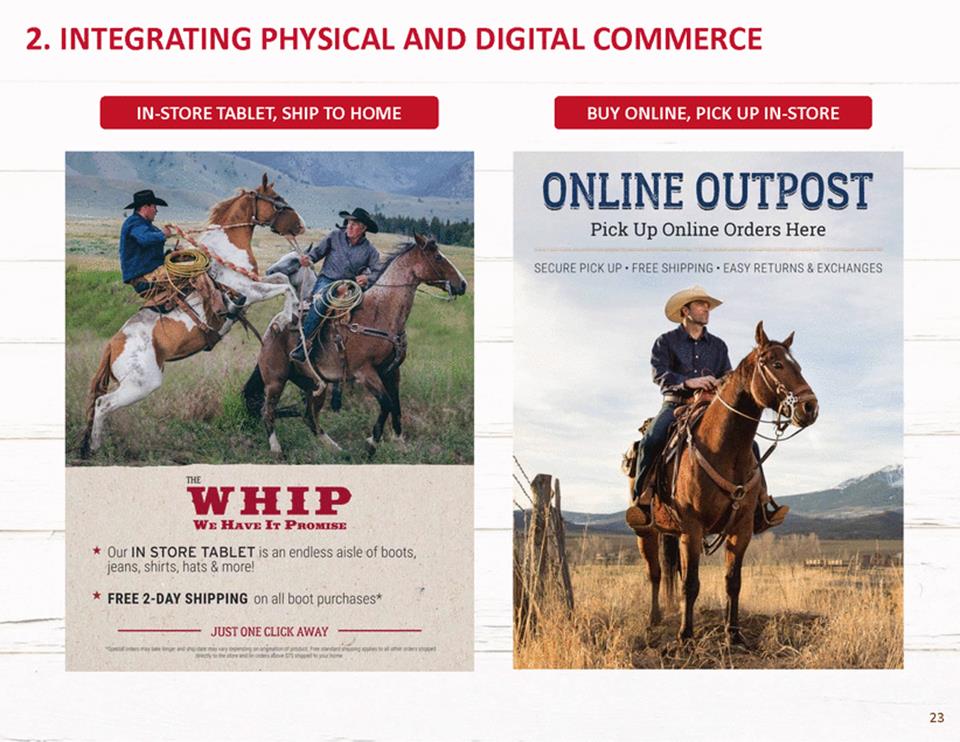
2. INTEGRATING PHYSICAL AND DIGITAL COMMERCE HOME ONLINE OUTPOST Pick Up Online Orders Here SECURE PICK UP ·FREE SHIPPING ·EASY RETURNS & EXCHANGES WHIP WE HAVE IT PROMISE * Our IN STORE TABLET is an endless aisle of boots, jeans, shirts., hats &. more! * FREE ·2-DAY SHIPPING on all boot purchases* -----:---JUSTONECLICKAWAY ----23 BUY ONLINE PICK UP IN-STORE 1 IN-STORE TABLET, SHIP TO
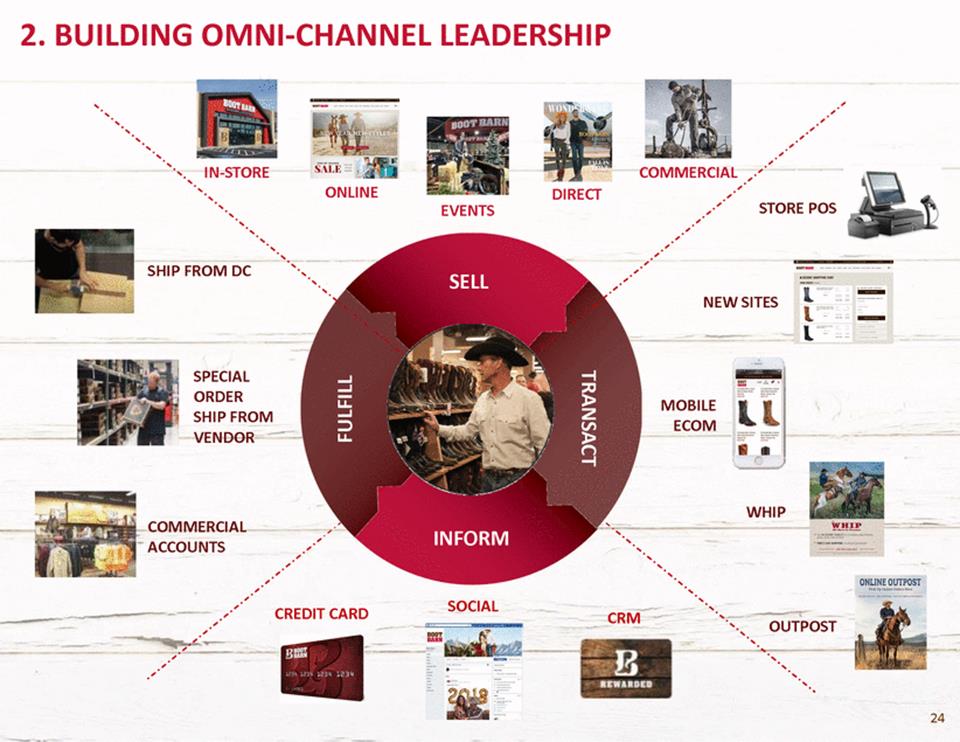
2. BUILDING OMNI-CHANNEL LEADERSHIP IN-STORE COMMERCIAL ONLINE DIRECT STORE POS EVENTS SHIP FROM DC SELL NEW SITES SPECIAL ORDER SHIP FROM VENDOR MOBILE ECOM WHIP COMMERCIAL ACCOUNTS ORM SOCIAL CREDIT CARD CRM OUTPOST 24 TRANSACT FULFILL
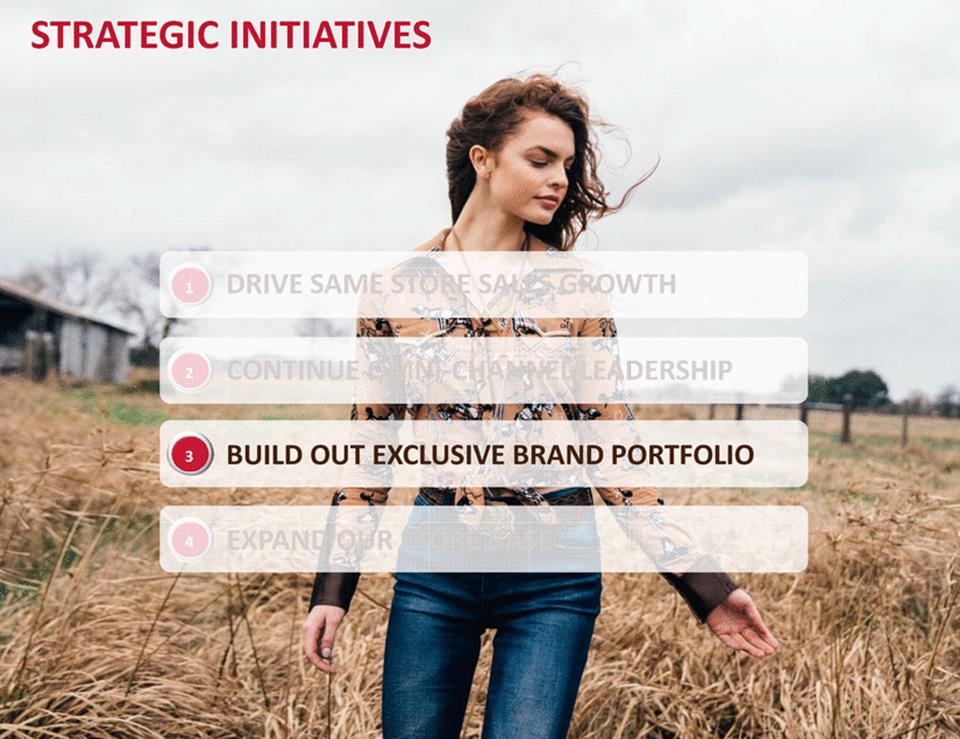
STRATEGIC INITIATIVES DRIVE SAME STORE SALES GROWTH 1 CONTINUE OMNI-CHANNEL LEADERSHIP 2 BUILD OUT EXCLUSIVE BRAND PORTFOLIO 3 EXPAND OUR STORE BASE 4 25
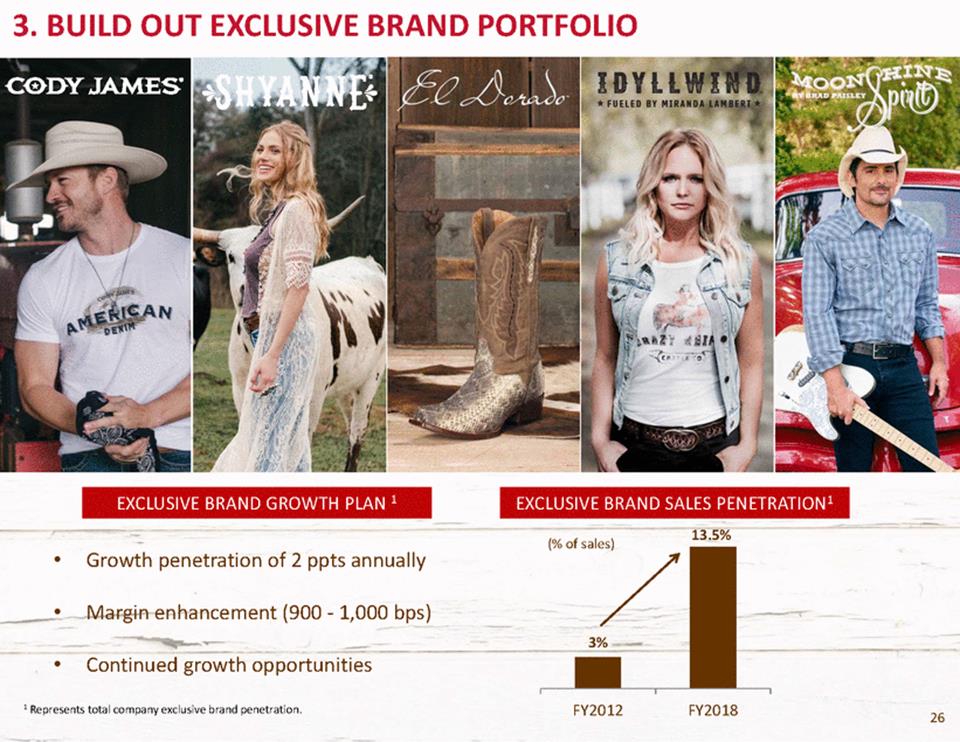
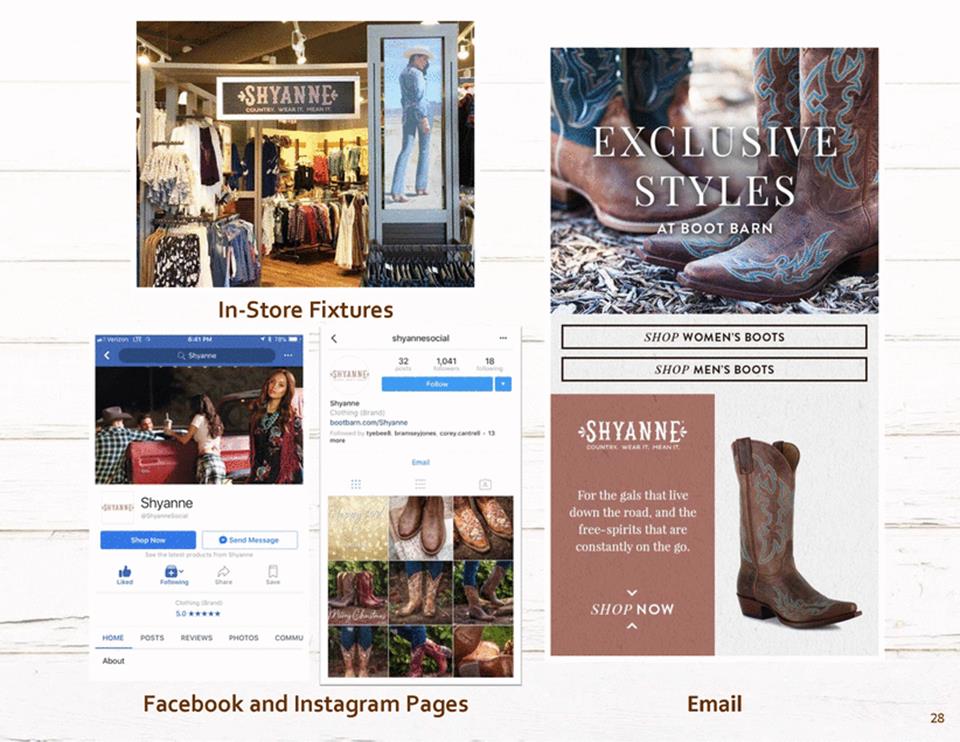
3. BUILD OUT EXCLUSIVE BRAND PORTFOLIO 13.5% (% of sales) • Growth penetration of 2 ppts annually • Margin enhancement (900 - 1,000 bps) • Continued growth opportunities 1 Represents total company exclusive brand penetration. FY2012 FY2018 26 3% EXCLUSIVE BRAND SALES PENETRATION1 EXCLUSIVE BRAND GROWTH PLAN 1
[LOGO]
In-Store Fixtures Facebook and Instagram Pages Email 28
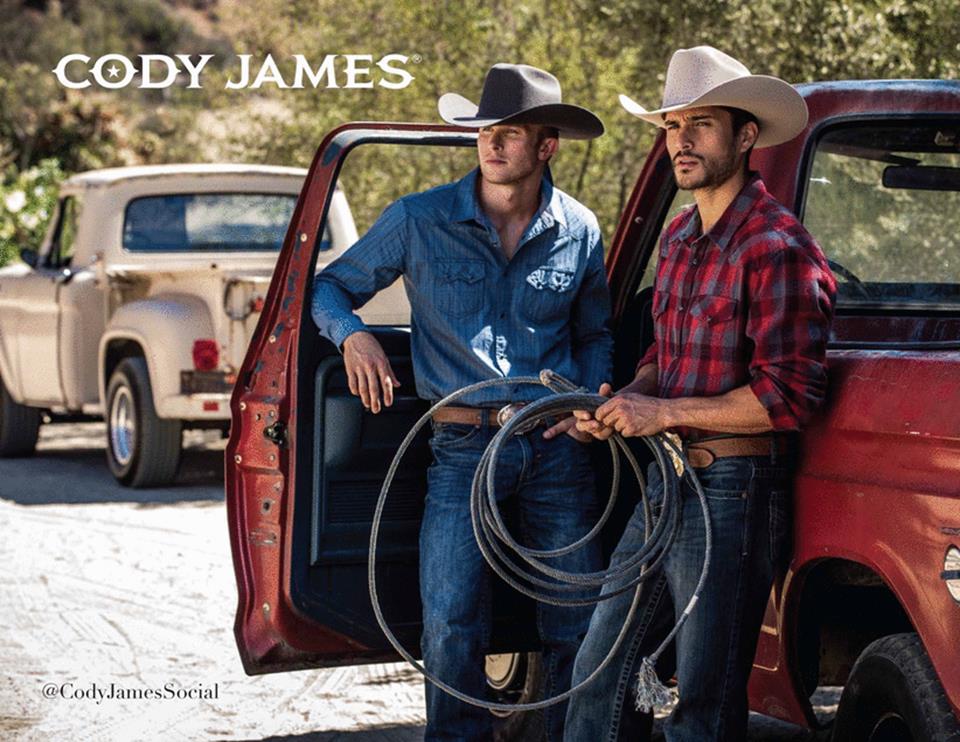
;; ©CodyJan1esSoci a l
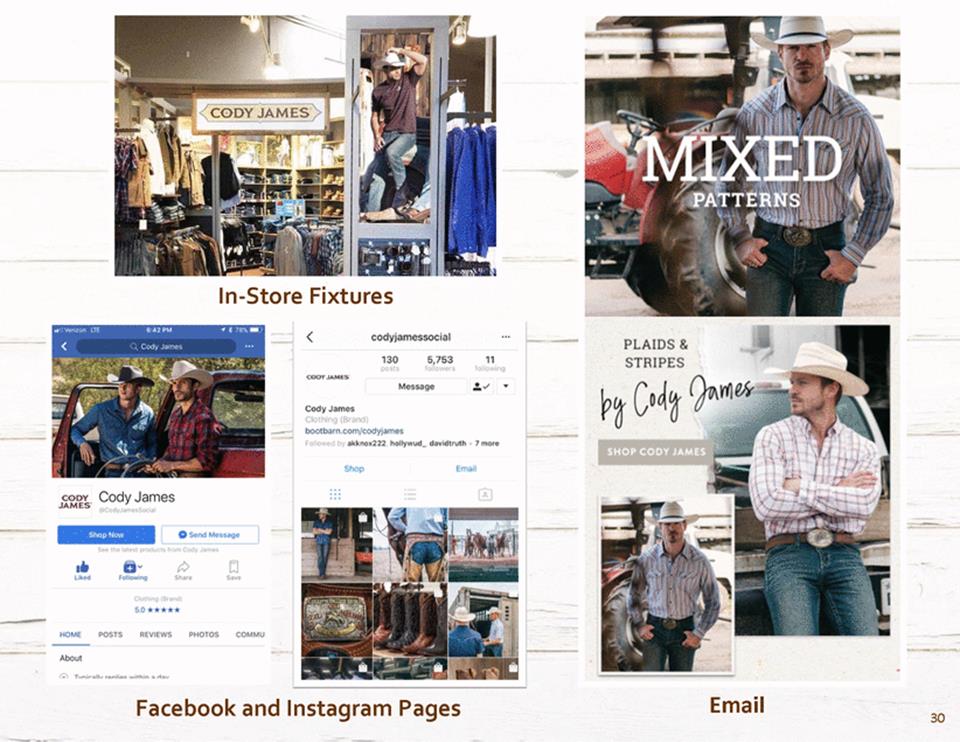
In-Store Fixtures Email Facebook and Instagram Pages 30
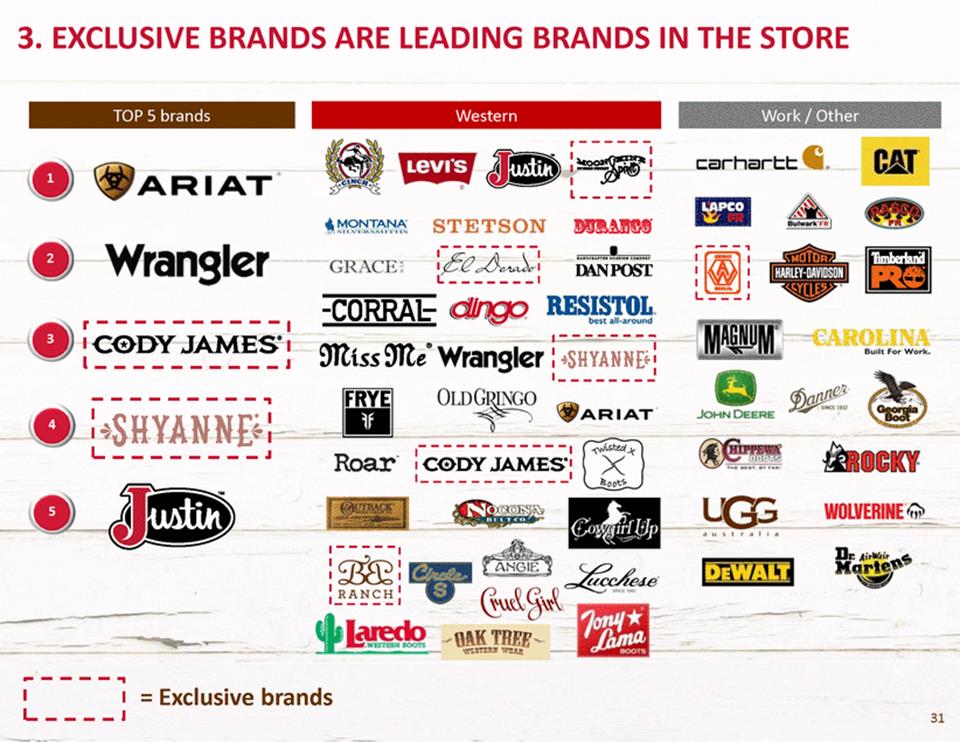
3.EXCLUSIVE BRANDS ARE LEADING BRANDS IN THE STORE Work I Other c:arhart:t:ti. r------MA!JU • ir«O :: ARIAT. L------I ..---, Wrangler :ff-2OAA(\,-: L-------1 I -=:;-I GRACE DANPOST 1 1 I...,. I L---J :lntss:lne® Wrangler :-sH-YANNE+: Built For Work. ·--------ARIAT Iilii Roar· ---------.. · DG) O L JOHNDEERE Iilioen W.,.;;;::O::: LVERINE Q 1-- - - - - - - - - - -. 1 ceovJAMEs· I_----------_I _ UQ3 a u t ralta :: · I ·-----· 1 RANCH 1 ----------- .. ----... 1 = Exclusive brands 1 L----1 31 C.AT Western TOP 5 brands
STRATEGIC INITIATIVES DRIVE SAME STORE SALES GROWTH 1 CONTINUE OMNI-CHANNEL LEADERSHIP 2 BUILD OUT EXCLUSIVE BRAND PORTFOLIO 3 EXPAND OUR STORE BASE 4 3322
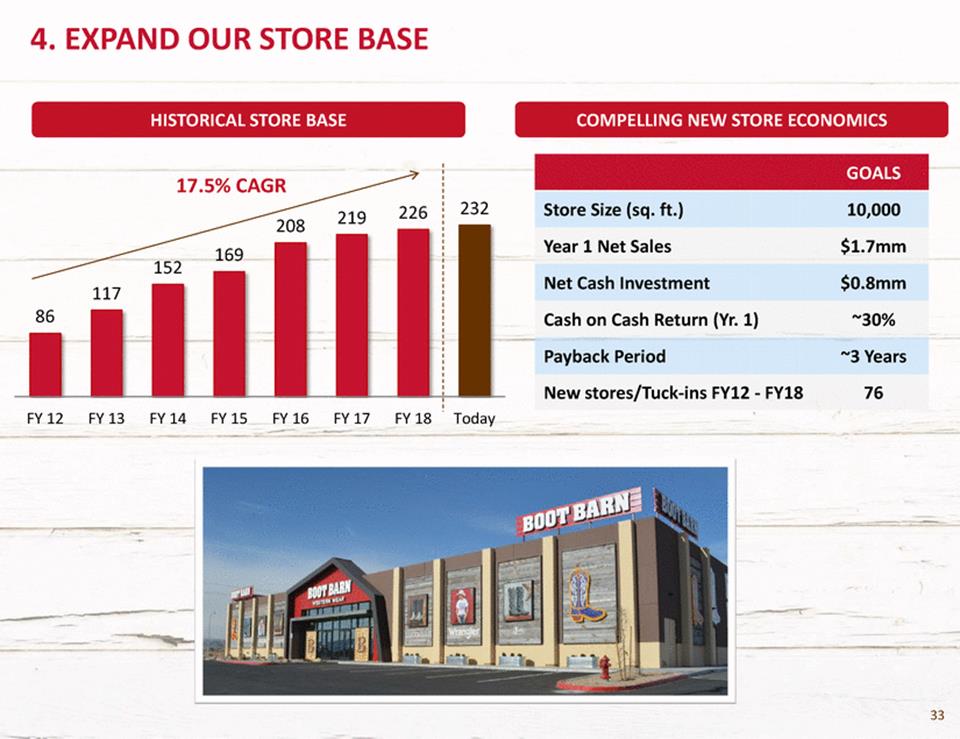
4. EXPAND OUR STORE BASE COMPELLING NEW STORE ECONOMICS HISTORICAL STORE BASE 17.5% CAGR 208 232 Store Size (sq. ft.) Year 1 Net Sales Net Cash Investment Cash on Cash Return (Yr. 1) Payback Period New stores/Tuck-ins FY12 - FY18 10,000 $1.7mm $0.8mm ~30% ~3 Years 76 226 219 169 152 117 86 FY 12 FY 13 FY 14 FY 15 FY 16 FY 17 FY 18 Today 33 GOALS
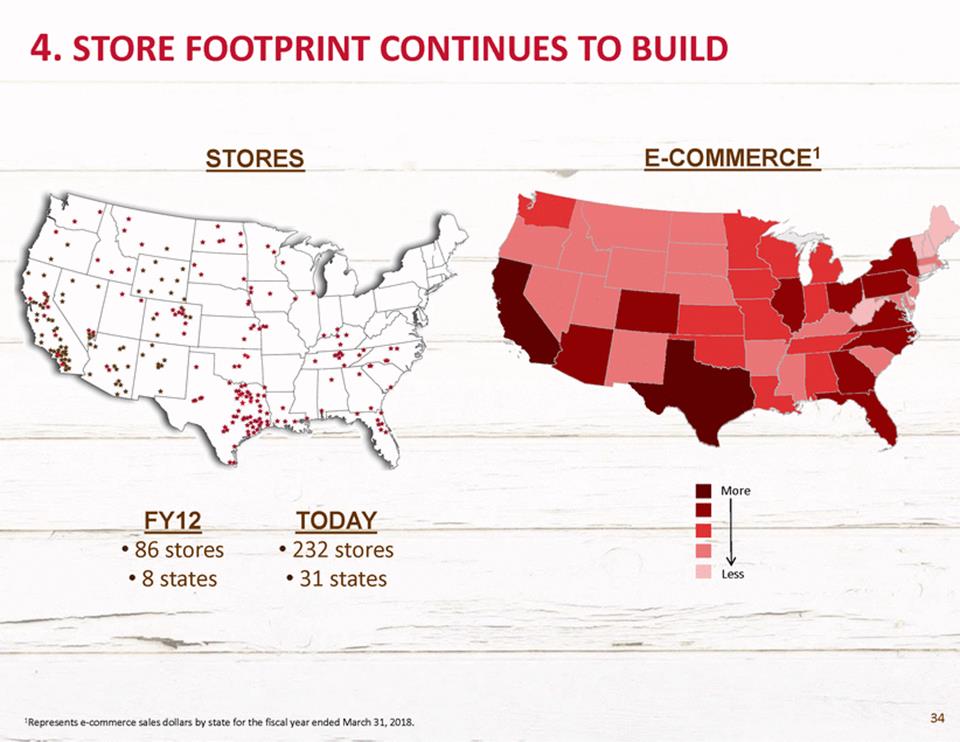
4. STORE FOOTPRINT CONTINUES TO BUILD E-COMMERCE1 STORES More FY12 • 86 stores • 8 states TODAY • 232 stores • 31 states Less 34 1Represents e-commerce sales dollars by state for the fiscal year ended March 31, 2018.
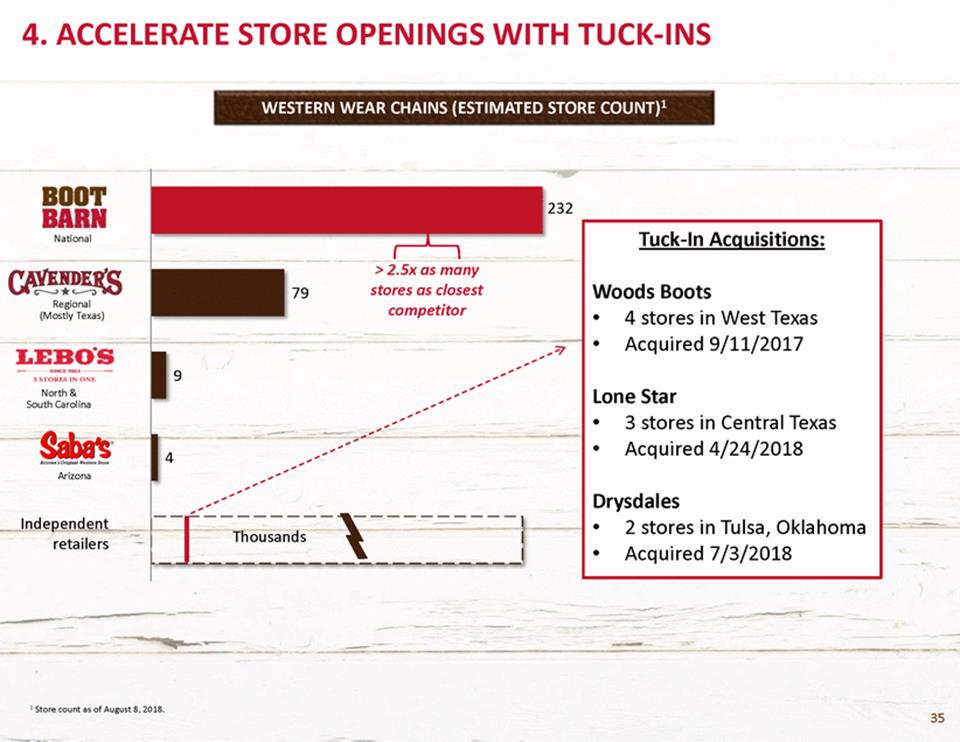
4. ACCELERATE STORE OPENINGS WITH TUCK-INS WESTERN WEAR CHAINS (ESTIMATED STORE COUNT)1 232 Tuck-In Acquisitions: National > 2.5x as many stores as closest competitor Woods Boots 79 Regional (Mostly Texas) • • 4 stores in West Texas Acquired 9/11/2017 9 Lone Star North & South Carolina • • 3 stores in Central Texas Acquired 4/24/2018 4 Arizona Drysdales Independent retailers • • 2 stores in Tulsa, Oklahoma Acquired 7/3/2018 Thousands 1 Store count as of August 8, 2018. 35
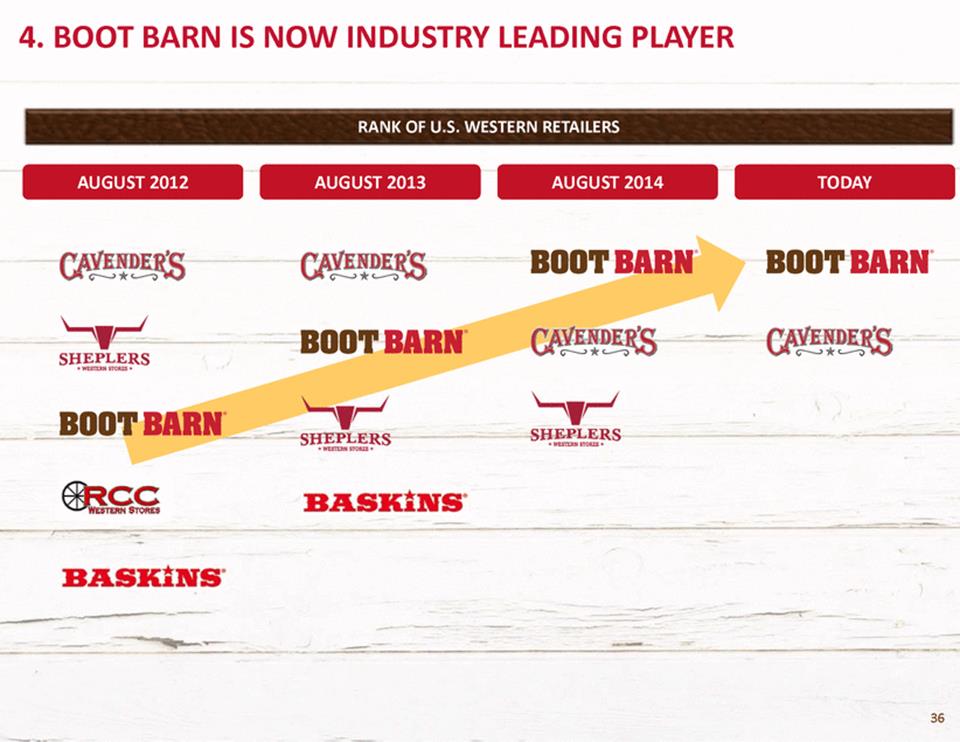
4. BOOT BARN IS NOW INDUSTRY LEADING PLAYER RANK OF U.S. WESTERN RETAILERS AUGUST 2012 AUGUST 2013 AUGUST 2014 TODAY 1 3 36
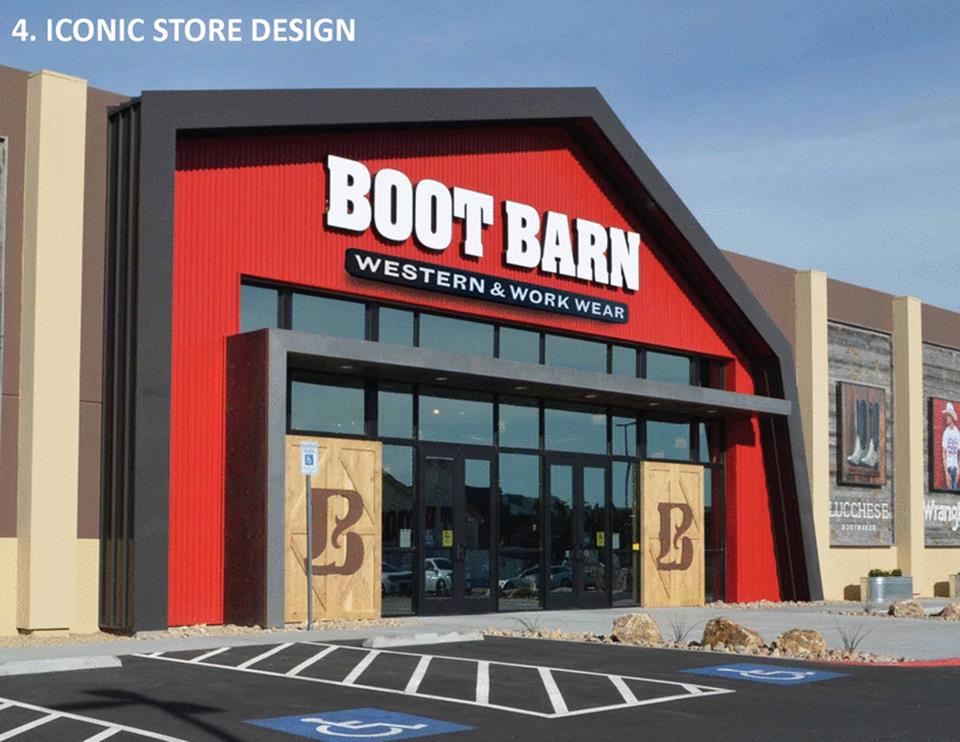
4. ICONIC STORE DESIGN 37
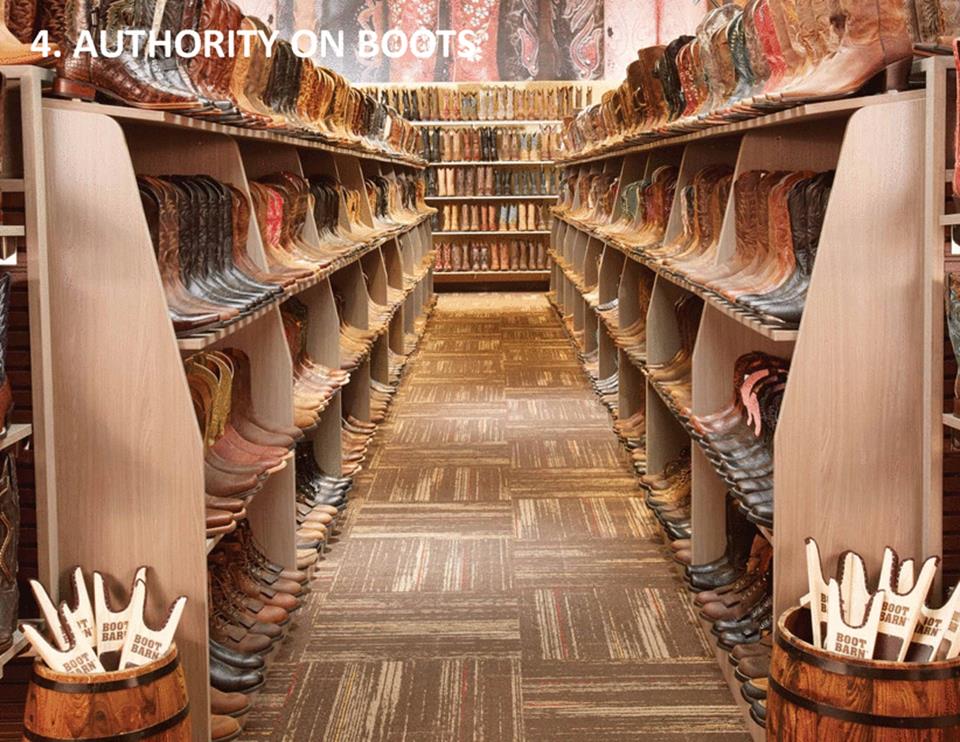
4. AUTHORITY ON BOOTS 38
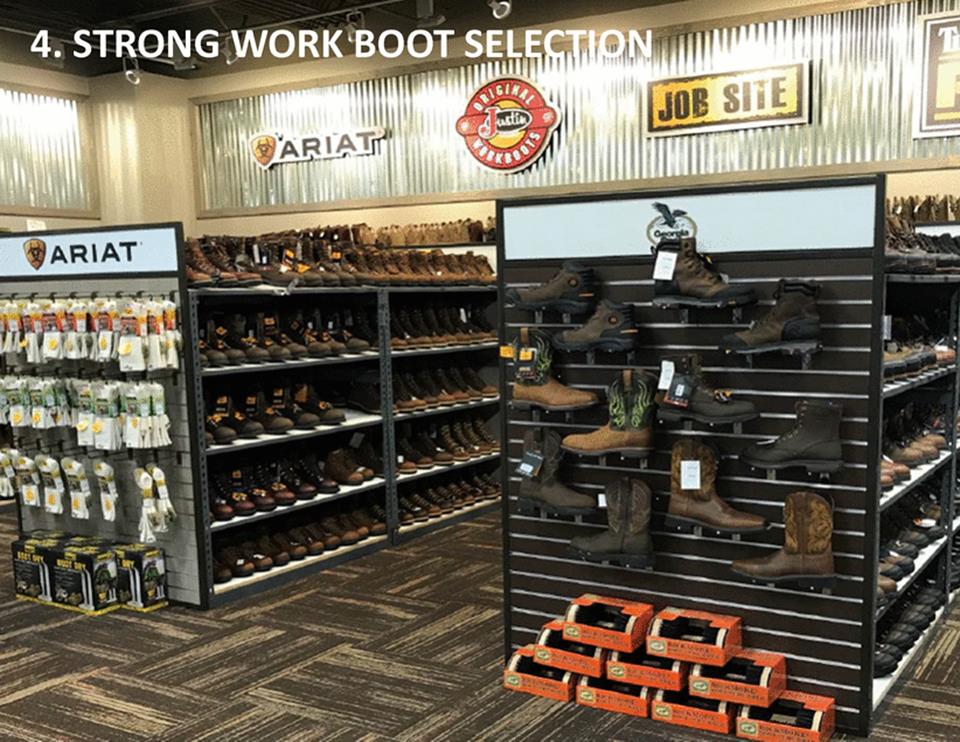
4. STRONG WORK BOOT SELECTION 39
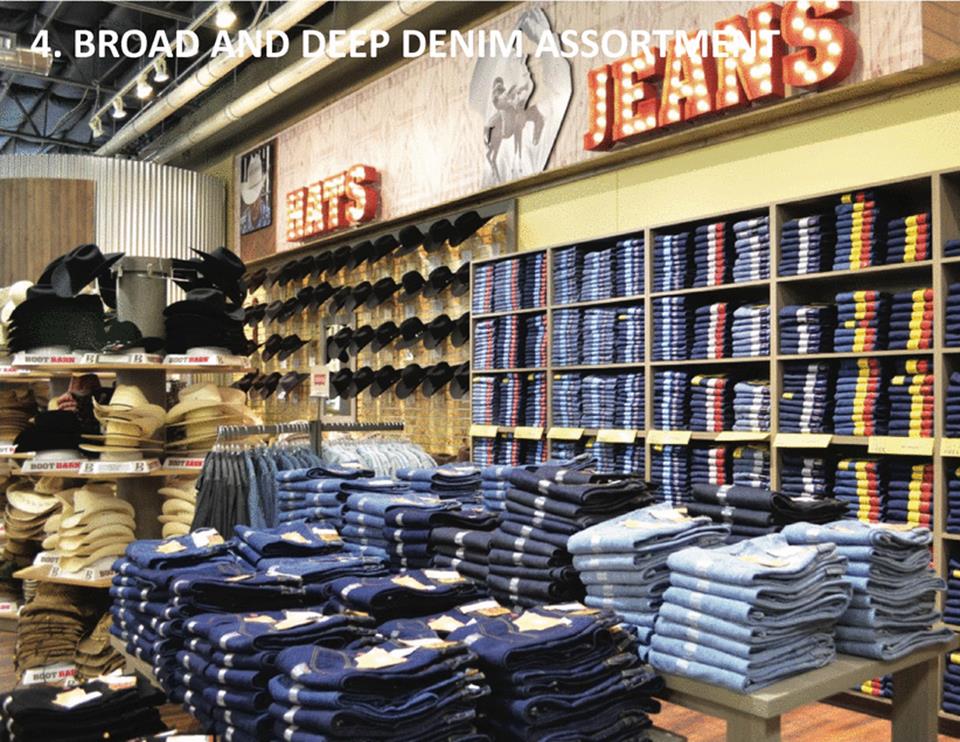
4. BROAD AND DEEP DENIM ASSORTMENT 40
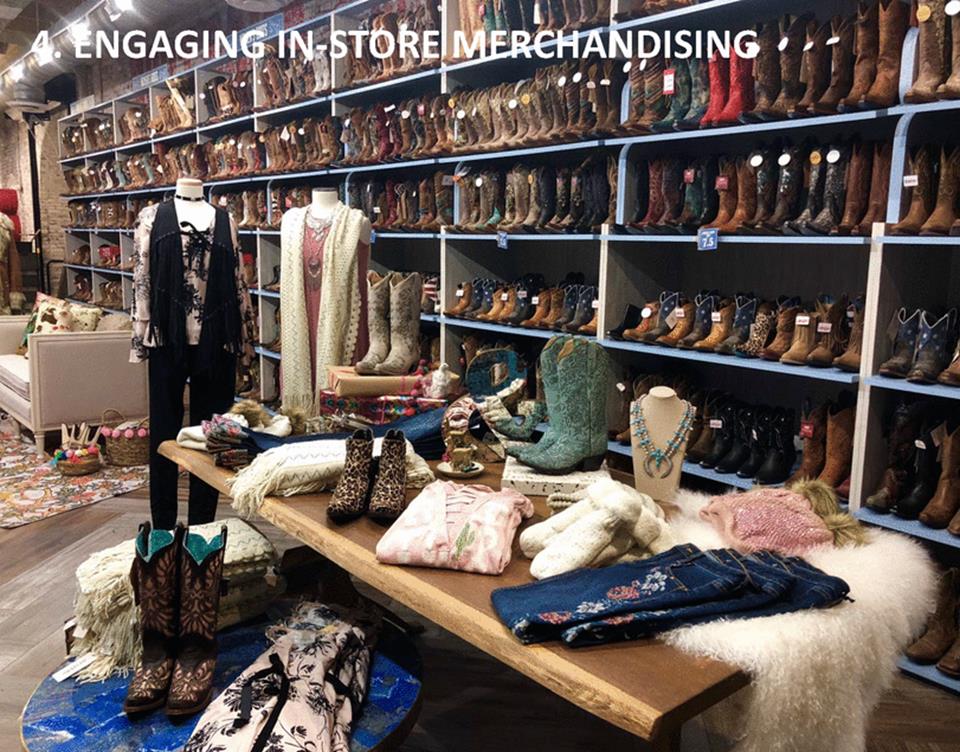
4. ENGAGING IN-STORE MERCHANDISING 41
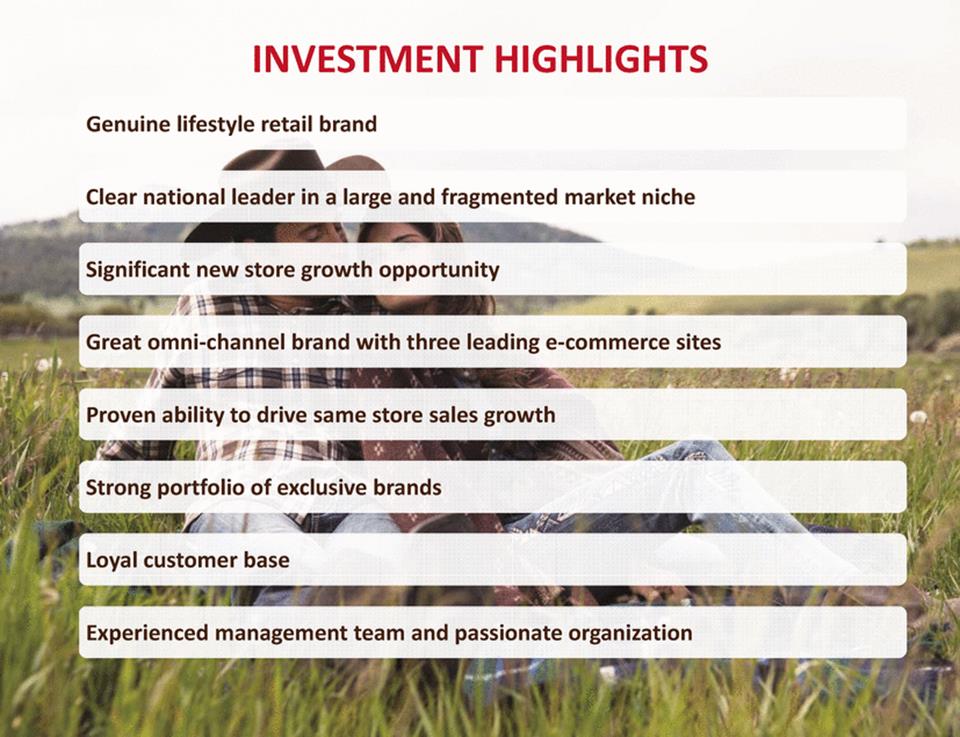
INVESTMENT HIGHLIGHTS Genuine lifestyle retail brand Clear national leader in a large and fragmented market niche Significant new store growth opportunity Great omni-channel brand with three leading e-commerce sites Proven ability to drive same store sales growth Strong portfolio of exclusive brands Loyal customer base Experienced management team and passionate organization 42
APPENDIX 43
ADJUSTED EBITDA RECONCILIATION 1The fiscal 2017 column has been adjusted to reflect management’s estimated 52-week results as fiscal 2017 was a 53-week year. The Company estimated that included in fiscal 2017 reported earnings per share was $0.03 attributed to the 53rd week. As such, the Company has estimated fiscal 2017 net income, excluding the 53rd week, to be $13.4 million compared to GAAP net income of $14.2 million. In calculating estimated Adjusted EBITDA and Adjusted EBIT on a 52-week basis, the Company also adjusted income tax expense, interest expense, and stock based compensation expense by taking 52/53rds of the GAAP reported fiscal 2017 numbers. (a) Represents non-cash compensation expenses related to stock options, restricted stock awards and restricted stock units granted to certain of our employees and directors. (b) Represents the non-cash accrual for future award redemptions in connection with our customer loyalty program. (c) Includes direct costs and fees related to the acquisitions of RCC, Baskins and Sheplers, which we acquired in August 2012, May 2013 and June 2015, respectively. (d) Represents certain store integration, remerchandising, inventory obsolescence and corporate consolidation costs incurred in connection with the integration of RCC, Baskins and Sheplers, which we acquired in August 2012, May 2013 and June 2015, respectively. Fiscal 2016 includes an adjustment to normalize the gross margin impact of sales of discontinued inventory from Sheplers, which was sold at a discount or written off. The adjustment assumes such inventory was sold at Sheplers’ normalized margin rate. (e) Represents the amortization of purchase-accounting adjustments that adjusted the value of inventory acquired to its fair value. (f) Represents loss on disposal of assets and contract termination costs from store closures and unused office and warehouse space. (g) Represents professional fees and expenses incurred in connection with secondary offerings conducted in January 2018 and February 2015 and a Form S-1 Registration Statement filed in July 2015 and withdrawn in November 2015. (h) Represents professional fees and expenses incurred in connection with a prior due diligence process of Sheplers. (i) Represents store impairment charges recorded in order to reduce the carrying amount of the assets to their estimated fair values. 44