Attached files
UNITED STATES
SECURITIES AND EXCHANGE COMMISSION
Washington, D. C. 20549
FORM 10-Q
x | QUARTERLY REPORT PURSUANT TO SECTION 13 OR 15(d) OF THE SECURITIES EXCHANGE ACT OF 1934 |
For the quarterly period ended June 30, 2018
or
¨ | TRANSITION REPORT PURSUANT TO SECTION 13 OR 15(d) OF THE SECURITIES EXCHANGE ACT OF 1934 |

Exact name of registrant as specified in its charter | State or other jurisdiction of incorporation or organization | Commission File Number | I.R.S. Employer Identification No. | |||
Windstream Holdings, Inc. | Delaware | 001-32422 | 46-2847717 | |||
Windstream Services, LLC | Delaware | 001-36093 | 20-0792300 | |||
4001 Rodney Parham Road | ||||
Little Rock, Arkansas | 72212 | |||
(Address of principal executive offices) | (Zip Code) | |||
(501) 748-7000 | ||||
(Registrants’ telephone number, including area code) | ||||
Indicate by check mark whether the registrant (1) has filed all reports required to be filed by Section 13 or 15(d) of the Securities Exchange Act of 1934 during the preceding 12 months (or for such shorter period that the registrant was required to file such reports), and (2) has been subject to such filing requirements for the past 90 days.
Windstream Holdings, Inc. | ý YES ¨ NO | |||
Windstream Services, LLC | ý YES ¨ NO | |||
Indicate by check mark whether the registrant has submitted electronically and posted on its corporate Web site, if any, every Interactive Data File required to be submitted and posted pursuant to Rule 405 of Regulation S-T (§232.405 of this chapter) during the preceding 12 months (or for such shorter period that the registrant was required to submit and post such files).
Windstream Holdings, Inc. | ý YES ¨ NO | |||
Windstream Services, LLC | ý YES ¨ NO | |||
Indicate by check mark whether the registrant is a large accelerated filer, an accelerated filer, a non-accelerated filer, smaller reporting company, or an emerging growth company. See the definitions of large accelerated filer, accelerated filer, smaller reporting company, and emerging growth company in Rule 12b-2 of the Exchange Act:
Windstream Holdings, Inc. | Large accelerated filer ý | Accelerated filer ¨ | ||
Non-accelerated filer ¨ | (Do not check if a smaller reporting company) | |||
Smaller reporting company ¨ | ||||
Emerging growth company ¨ | ||||
Windstream Services, LLC | Large accelerated filer ¨ | Accelerated filer ¨ | ||
Non-accelerated filer ý | (Do not check if a smaller reporting company) | |||
Smaller reporting company ¨ | ||||
Emerging growth company ¨ | ||||
If an emerging growth company, indicate by check mark if the registrant has elected not to use the extended transition period for complying with any new or revised financial accounting standards provided pursuant to Section 13(a) of the Exchange Act.
Windstream Holdings, Inc. | ¨ YES ¨ NO | |||
Windstream Services, LLC | ¨ YES ¨ NO | |||
Indicate by check mark whether the registrant is a shell company (as defined by Rule 12b-2 of the Exchange Act).
Windstream Holdings, Inc. | ¨ YES ý NO | |||
Windstream Services, LLC | ¨ YES ý NO | |||
As of August 6, 2018, 42,938,115 shares of common stock of Windstream Holdings, Inc.were outstanding. Windstream Holdings, Inc. holds a 100 percent interest in Windstream Services, LLC.
This Form 10-Q is a combined quarterly report being filed separately by two registrants: Windstream Holdings, Inc. and Windstream Services, LLC. Windstream Services, LLC is a direct, wholly-owned subsidiary of Windstream Holdings, Inc. Accordingly, Windstream Services, LLC meets the conditions set forth in general instruction H(1)(a) and (b) of Form 10-Q and is therefore filing this form with the reduced disclosure format. Unless the context indicates otherwise, the use of the terms “Windstream,” “we,” “us” or “our” shall refer to Windstream Holdings, Inc. and its subsidiaries, including Windstream Services, LLC, and the term “Windstream Services” shall refer to Windstream Services, LLC and its subsidiaries.
The Exhibit Index is located on page 91. | ||
WINDSTREAM HOLDINGS, INC.
WINDSTREAM SERVICES, LLC
FORM 10-Q
TABLE OF CONTENTS
Page No. | ||
Item 1. | ||
Item 2. | ||
Item 3. | ||
Item 4. | ||
Item 1. | ||
Item 1A. | ||
Item 2. | Unregistered Sales of Equity Securities and Use of Proceeds | * |
Item 3. | Defaults Upon Senior Securities | * |
Item 4. | Mine Safety Disclosures | * |
Item 5. | Other Information | * |
Item 6. | ||
_____________
* | No reportable information under this item. |
1
WINDSTREAM HOLDINGS, INC.
WINDSTREAM SERVICES, LLC
FORM 10-Q
PART I - FINANCIAL INFORMATION
Item 1. Financial Statements
WINDSTREAM HOLDINGS, INC.
CONSOLIDATED STATEMENTS OF OPERATIONS (UNAUDITED)
Three Months Ended June 30, | Six Months Ended June 30, | |||||||||||||||
(Millions, except per share amounts) | 2018 | 2017 | 2018 | 2017 | ||||||||||||
Revenues and sales: | ||||||||||||||||
Service revenues | $ | 1,424.6 | $ | 1,465.6 | $ | 2,860.0 | $ | 2,810.0 | ||||||||
Product sales | 19.8 | 26.0 | 38.7 | 47.3 | ||||||||||||
Total revenues and sales | 1,444.4 | 1,491.6 | 2,898.7 | 2,857.3 | ||||||||||||
Costs and expenses: | ||||||||||||||||
Cost of services (exclusive of depreciation and amortization included below) | 722.8 | 750.7 | 1,459.7 | 1,434.5 | ||||||||||||
Cost of products sold | 18.2 | 29.7 | 35.0 | 50.5 | ||||||||||||
Selling, general and administrative | 224.5 | 226.4 | 453.3 | 440.2 | ||||||||||||
Depreciation and amortization | 370.7 | 362.4 | 752.5 | 700.9 | ||||||||||||
Merger, integration and other costs | 14.1 | 16.4 | 21.4 | 73.7 | ||||||||||||
Restructuring charges | 5.8 | 3.5 | 19.5 | 10.9 | ||||||||||||
Total costs and expenses | 1,356.1 | 1,389.1 | 2,741.4 | 2,710.7 | ||||||||||||
Operating income | 88.3 | 102.5 | 157.3 | 146.6 | ||||||||||||
Other income, net | 12.0 | 4.2 | 9.7 | 6.8 | ||||||||||||
Net loss on early extinguishment of debt | — | — | — | (3.2 | ) | |||||||||||
Interest expense | (224.4 | ) | (214.4 | ) | (447.5 | ) | (426.2 | ) | ||||||||
Loss before income taxes | (124.1 | ) | (107.7 | ) | (280.5 | ) | (276.0 | ) | ||||||||
Income tax benefit | (30.4 | ) | (39.6 | ) | (65.4 | ) | (96.6 | ) | ||||||||
Net loss | $ | (93.7 | ) | $ | (68.1 | ) | $ | (215.1 | ) | $ | (179.4 | ) | ||||
Basic and diluted loss per share: | ||||||||||||||||
Net loss | ($2.30 | ) | ($1.83 | ) | ($5.51 | ) | ($5.75 | ) | ||||||||
See the accompanying notes to the unaudited interim consolidated financial statements.
2
WINDSTREAM HOLDINGS, INC.
CONSOLIDATED STATEMENTS OF COMPREHENSIVE INCOME (LOSS) (UNAUDITED)
Three Months Ended June 30, | Six Months Ended June 30, | |||||||||||||||
(Millions) | 2018 | 2017 | 2018 | 2017 | ||||||||||||
Net loss | $ | (93.7 | ) | $ | (68.1 | ) | $ | (215.1 | ) | $ | (179.4 | ) | ||||
Other comprehensive income (loss): | ||||||||||||||||
Interest rate swaps: | ||||||||||||||||
Unrealized gain (loss) on designated interest rate swaps | 4.9 | (5.3 | ) | 19.7 | (1.9 | ) | ||||||||||
Amortization of net unrealized losses on de-designated interest rate swaps | 0.8 | 1.4 | 1.7 | 2.9 | ||||||||||||
Income tax (expense) benefit | (1.5 | ) | 1.5 | (5.5 | ) | (0.4 | ) | |||||||||
Change in interest rate swaps | 4.2 | (2.4 | ) | 15.9 | 0.6 | |||||||||||
Postretirement and pension plans: | ||||||||||||||||
Prior service credit arising during the period | 2.7 | — | 2.7 | — | ||||||||||||
Change in net actuarial gain for employee benefit plans | 5.4 | 1.4 | 5.4 | 1.4 | ||||||||||||
Amounts included in net periodic benefit cost: | ||||||||||||||||
Amortization of net actuarial loss | — | 0.1 | 0.1 | 0.1 | ||||||||||||
Amortization of prior service credits | (1.3 | ) | (0.2 | ) | (2.6 | ) | (0.4 | ) | ||||||||
Income tax expense | (0.9 | ) | (0.5 | ) | (0.6 | ) | (0.4 | ) | ||||||||
Change in postretirement and pension plans | 5.9 | 0.8 | 5.0 | 0.7 | ||||||||||||
Other comprehensive income (loss) | 10.1 | (1.6 | ) | 20.9 | 1.3 | |||||||||||
Comprehensive loss | $ | (83.6 | ) | $ | (69.7 | ) | $ | (194.2 | ) | $ | (178.1 | ) | ||||
See the accompanying notes to the unaudited interim consolidated financial statements.
3
WINDSTREAM HOLDINGS, INC.
CONSOLIDATED BALANCE SHEETS (UNAUDITED)
(Millions, except par value) | June 30, 2018 | December 31, 2017 | ||||||
Assets | ||||||||
Current Assets: | ||||||||
Cash and cash equivalents | $ | 45.3 | $ | 43.4 | ||||
Accounts receivable (less allowance for doubtful | ||||||||
accounts of $25.3 and $29.7, respectively) | 623.9 | 643.0 | ||||||
Inventories | 85.0 | 93.0 | ||||||
Prepaid expenses and other | 181.0 | 154.3 | ||||||
Total current assets | 935.2 | 933.7 | ||||||
Goodwill | 2,873.9 | 2,842.4 | ||||||
Other intangibles, net | 1,349.4 | 1,454.4 | ||||||
Net property, plant and equipment | 5,156.6 | 5,391.8 | ||||||
Deferred income taxes | 416.2 | 370.8 | ||||||
Other assets | 108.5 | 91.2 | ||||||
Total Assets | $ | 10,839.8 | $ | 11,084.3 | ||||
Liabilities and Shareholders’ Deficit | ||||||||
Current Liabilities: | ||||||||
Current maturities of long-term debt | $ | 17.9 | $ | 169.3 | ||||
Current portion of long-term lease obligations | 200.1 | 188.6 | ||||||
Accounts payable | 495.2 | 494.0 | ||||||
Advance payments and customer deposits | 199.7 | 207.3 | ||||||
Accrued taxes | 87.5 | 89.5 | ||||||
Accrued interest | 62.2 | 52.6 | ||||||
Other current liabilities | 278.9 | 342.1 | ||||||
Total current liabilities | 1,341.5 | 1,543.4 | ||||||
Long-term debt | 5,867.9 | 5,674.6 | ||||||
Long-term lease obligations | 4,540.5 | 4,643.3 | ||||||
Other liabilities | 496.4 | 521.9 | ||||||
Total liabilities | 12,246.3 | 12,383.2 | ||||||
Commitments and Contingencies (See Note 15) | ||||||||
Shareholders’ Deficit: | ||||||||
Common stock, $.0001 par value, 75.0 shares authorized, | ||||||||
42.7 and 36.5 shares issued and outstanding, respectively | — | — | ||||||
Additional paid-in capital | 1,243.2 | 1,191.9 | ||||||
Accumulated other comprehensive income | 44.0 | 21.4 | ||||||
Accumulated deficit | (2,693.7 | ) | (2,512.2 | ) | ||||
Total shareholders’ deficit | (1,406.5 | ) | (1,298.9 | ) | ||||
Total Liabilities and Shareholders’ Deficit | $ | 10,839.8 | $ | 11,084.3 | ||||
See the accompanying notes to the unaudited interim consolidated financial statements.
4
WINDSTREAM HOLDINGS, INC.
CONSOLIDATED STATEMENTS OF CASH FLOWS (UNAUDITED)
Six Months Ended June 30, | ||||||||
(Millions) | 2018 | 2017 | ||||||
Cash Flows from Operating Activities: | ||||||||
Net loss | $ | (215.1 | ) | $ | (179.4 | ) | ||
Adjustments to reconcile net loss to net cash provided from operations: | ||||||||
Depreciation and amortization | 752.5 | 700.9 | ||||||
Provision for doubtful accounts | 15.2 | 19.7 | ||||||
Share-based compensation expense | 18.4 | 32.4 | ||||||
Deferred income taxes | (64.7 | ) | (97.3 | ) | ||||
Net loss on early extinguishment of debt | — | 3.2 | ||||||
Other, net | 4.3 | 7.9 | ||||||
Changes in operating assets and liabilities, net | ||||||||
Accounts receivable | 5.8 | 15.7 | ||||||
Prepaid income taxes | (4.7 | ) | (5.2 | ) | ||||
Prepaid expenses and other | 7.3 | (14.3 | ) | |||||
Accounts payable | 17.2 | (56.3 | ) | |||||
Accrued interest | 9.9 | (6.8 | ) | |||||
Accrued taxes | (9.3 | ) | 2.0 | |||||
Other current liabilities | (18.7 | ) | (20.1 | ) | ||||
Other liabilities | 7.0 | 1.5 | ||||||
Other, net | 14.6 | (29.0 | ) | |||||
Net cash provided from operating activities | 539.7 | 374.9 | ||||||
Cash Flows from Investing Activities: | ||||||||
Additions to property, plant and equipment | (406.3 | ) | (507.8 | ) | ||||
Cash acquired from EarthLink | — | 5.0 | ||||||
Acquisition of MASS | (37.6 | ) | — | |||||
Other, net | (8.8 | ) | (11.8 | ) | ||||
Net cash used in investing activities | (452.7 | ) | (514.6 | ) | ||||
Cash Flows from Financing Activities: | ||||||||
Dividends paid to shareholders | — | (35.6 | ) | |||||
Proceeds from issuance of stock | 11.1 | 9.6 | ||||||
Repayments of debt and swaps | (413.1 | ) | (1,282.2 | ) | ||||
Proceeds from debt issuance | 450.0 | 1,535.6 | ||||||
Debt issuance costs | (11.6 | ) | (7.3 | ) | ||||
Payments under long-term lease obligations | (91.4 | ) | (82.2 | ) | ||||
Payments under capital lease obligations | (27.7 | ) | (22.0 | ) | ||||
Other, net | (2.4 | ) | (10.6 | ) | ||||
Net cash (used in) provided from financing activities | (85.1 | ) | 105.3 | |||||
Increase (decrease) in cash and cash equivalents | 1.9 | (34.4 | ) | |||||
Cash and Cash Equivalents: | ||||||||
Beginning of period | 43.4 | 59.1 | ||||||
End of period | $ | 45.3 | $ | 24.7 | ||||
Supplemental Cash Flow Disclosures: | ||||||||
Interest paid, net of interest capitalized | $ | 428.9 | $ | 417.7 | ||||
Income taxes (refunded) paid, net | $ | (15.1 | ) | $ | 1.3 | |||
See the accompanying notes to the unaudited interim consolidated financial statements.
5
WINDSTREAM HOLDINGS, INC.
CONSOLIDATED STATEMENT OF SHAREHOLDERS’ DEFICIT (UNAUDITED)
(Millions, except per share amounts) | Common Stock and Additional Paid-In Capital | Accumulated Other Comprehensive Income | Accumulated Deficit | Total | ||||||||||||
Balance at December 31, 2017 | $ | 1,191.9 | $ | 21.4 | $ | (2,512.2 | ) | $ | (1,298.9 | ) | ||||||
Cumulative effect adjustments, net of tax: | ||||||||||||||||
Adoption of ASU 2014-09 (See Note 1) | — | — | 35.3 | 35.3 | ||||||||||||
Adoption of ASU 2017-12 (See Note 1) | — | 1.7 | (1.7 | ) | — | |||||||||||
Net loss | — | — | (215.1 | ) | (215.1 | ) | ||||||||||
Other comprehensive income (loss), net of tax: | ||||||||||||||||
Change in postretirement and pension plans | — | 5.0 | — | 5.0 | ||||||||||||
Amortization of net unrealized losses on de-designated interest rate swaps | — | 1.2 | — | 1.2 | ||||||||||||
Change in designated interest rate swaps | — | 14.7 | — | 14.7 | ||||||||||||
Comprehensive income (loss) | — | 20.9 | (215.1 | ) | (194.2 | ) | ||||||||||
Share-based compensation | 7.4 | — | — | 7.4 | ||||||||||||
Stock issued under equity distribution agreement | 11.1 | — | — | 11.1 | ||||||||||||
Stock issued for pension contribution | 5.8 | — | — | 5.8 | ||||||||||||
Stock issued to employee savings plan | 28.3 | — | — | 28.3 | ||||||||||||
Taxes withheld on vested restricted stock and other | (1.3 | ) | — | — | (1.3 | ) | ||||||||||
Balance at June 30, 2018 | $ | 1,243.2 | $ | 44.0 | $ | (2,693.7 | ) | $ | (1,406.5 | ) | ||||||
See the accompanying notes to the unaudited interim consolidated financial statements.
6
WINDSTREAM SERVICES, LLC
CONSOLIDATED STATEMENTS OF OPERATIONS (UNAUDITED)
Three Months Ended June 30, | Six Months Ended June 30, | |||||||||||||||
(Millions) | 2018 | 2017 | 2018 | 2017 | ||||||||||||
Revenues and sales: | ||||||||||||||||
Service revenues | $ | 1,424.6 | $ | 1,465.6 | $ | 2,860.0 | $ | 2,810.0 | ||||||||
Product sales | 19.8 | 26.0 | 38.7 | 47.3 | ||||||||||||
Total revenues and sales | 1,444.4 | 1,491.6 | 2,898.7 | 2,857.3 | ||||||||||||
Costs and expenses: | ||||||||||||||||
Cost of services (exclusive of depreciation and amortization included below) | 722.8 | 750.7 | 1,459.7 | 1,434.5 | ||||||||||||
Cost of products sold | 18.2 | 29.7 | 35.0 | 50.5 | ||||||||||||
Selling, general and administrative | 223.8 | 225.6 | 452.1 | 439.1 | ||||||||||||
Depreciation and amortization | 370.7 | 362.4 | 752.5 | 700.9 | ||||||||||||
Merger, integration and other costs | 14.1 | 16.4 | 21.4 | 73.7 | ||||||||||||
Restructuring charges | 5.8 | 3.5 | 19.5 | 10.9 | ||||||||||||
Total costs and expenses | 1,355.4 | 1,388.3 | 2,740.2 | 2,709.6 | ||||||||||||
Operating income | 89.0 | 103.3 | 158.5 | 147.7 | ||||||||||||
Other income, net | 12.0 | 4.2 | 9.7 | 6.8 | ||||||||||||
Net loss on early extinguishment of debt | — | — | — | (3.2 | ) | |||||||||||
Interest expense | (224.4 | ) | (214.4 | ) | (447.5 | ) | (426.2 | ) | ||||||||
Loss before income taxes | (123.4 | ) | (106.9 | ) | (279.3 | ) | (274.9 | ) | ||||||||
Income tax benefit | (30.2 | ) | (39.3 | ) | (65.1 | ) | (96.2 | ) | ||||||||
Net loss | $ | (93.2 | ) | $ | (67.6 | ) | $ | (214.2 | ) | $ | (178.7 | ) | ||||
See the accompanying notes to the unaudited interim consolidated financial statements.
7
WINDSTREAM SERVICES, LLC
CONSOLIDATED STATEMENTS OF COMPREHENSIVE INCOME (LOSS) (UNAUDITED)
Three Months Ended June 30, | Six Months Ended June 30, | |||||||||||||||
(Millions) | 2018 | 2017 | 2018 | 2017 | ||||||||||||
Net loss | $ | (93.2 | ) | $ | (67.6 | ) | $ | (214.2 | ) | $ | (178.7 | ) | ||||
Other comprehensive income (loss): | ||||||||||||||||
Interest rate swaps: | ||||||||||||||||
Unrealized gain (loss) on designated interest rate swaps | 4.9 | (5.3 | ) | 19.7 | (1.9 | ) | ||||||||||
Amortization of net unrealized losses on de-designated interest rate swaps | 0.8 | 1.4 | 1.7 | 2.9 | ||||||||||||
Income tax (expense) benefit | (1.5 | ) | 1.5 | (5.5 | ) | (0.4 | ) | |||||||||
Change in interest rate swaps | 4.2 | (2.4 | ) | 15.9 | 0.6 | |||||||||||
Postretirement and pension plans: | ||||||||||||||||
Prior service credit arising during the period | 2.7 | — | 2.7 | — | ||||||||||||
Change in net actuarial gain for employee benefit plans | 5.4 | 1.4 | 5.4 | 1.4 | ||||||||||||
Amounts included in net periodic benefit cost: | ||||||||||||||||
Amortization of net actuarial loss | — | 0.1 | 0.1 | 0.1 | ||||||||||||
Amortization of prior service credits | (1.3 | ) | (0.2 | ) | (2.6 | ) | (0.4 | ) | ||||||||
Income tax expense | (0.9 | ) | (0.5 | ) | (0.6 | ) | (0.4 | ) | ||||||||
Change in postretirement and pension plans | 5.9 | 0.8 | 5.0 | 0.7 | ||||||||||||
Other comprehensive income (loss) | 10.1 | (1.6 | ) | 20.9 | 1.3 | |||||||||||
Comprehensive loss | $ | (83.1 | ) | $ | (69.2 | ) | $ | (193.3 | ) | $ | (177.4 | ) | ||||
See the accompanying notes to the unaudited interim consolidated financial statements.
8
WINDSTREAM SERVICES, LLC
CONSOLIDATED BALANCE SHEETS (UNAUDITED)
(Millions) | June 30, 2018 | December 31, 2017 | ||||||
Assets | ||||||||
Current Assets: | ||||||||
Cash and cash equivalents | $ | 45.3 | $ | 43.4 | ||||
Accounts receivable (less allowance for doubtful | ||||||||
accounts of $25.3 and $29.7, respectively) | 623.9 | 643.0 | ||||||
Inventories | 85.0 | 93.0 | ||||||
Prepaid expenses and other | 181.0 | 154.3 | ||||||
Total current assets | 935.2 | 933.7 | ||||||
Goodwill | 2,873.9 | 2,842.4 | ||||||
Other intangibles, net | 1,349.4 | 1,454.4 | ||||||
Net property, plant and equipment | 5,156.6 | 5,391.8 | ||||||
Deferred income taxes | 416.2 | 370.8 | ||||||
Other assets | 108.5 | 91.2 | ||||||
Total Assets | $ | 10,839.8 | $ | 11,084.3 | ||||
Liabilities and Member Deficit | ||||||||
Current Liabilities: | ||||||||
Current maturities of long-term debt | $ | 17.9 | $ | 169.3 | ||||
Current portion of long-term lease obligations | 200.1 | 188.6 | ||||||
Accounts payable | 495.2 | 494.0 | ||||||
Advance payments and customer deposits | 199.7 | 207.3 | ||||||
Accrued taxes | 87.5 | 89.5 | ||||||
Accrued interest | 62.2 | 52.6 | ||||||
Other current liabilities | 278.9 | 342.1 | ||||||
Total current liabilities | 1,341.5 | 1,543.4 | ||||||
Long-term debt | 5,867.9 | 5,674.6 | ||||||
Long-term lease obligations | 4,540.5 | 4,643.3 | ||||||
Other liabilities | 496.4 | 521.9 | ||||||
Total liabilities | 12,246.3 | 12,383.2 | ||||||
Commitments and Contingencies (See Note 15) | ||||||||
Member Deficit: | ||||||||
Additional paid-in capital | 1,237.5 | 1,187.1 | ||||||
Accumulated other comprehensive income | 44.0 | 21.4 | ||||||
Accumulated deficit | (2,688.0 | ) | (2,507.4 | ) | ||||
Total member deficit | (1,406.5 | ) | (1,298.9 | ) | ||||
Total Liabilities and Member Deficit | $ | 10,839.8 | $ | 11,084.3 | ||||
See the accompanying notes to the unaudited interim consolidated financial statements.
9
WINDSTREAM SERVICES, LLC
CONSOLIDATED STATEMENTS OF CASH FLOWS (UNAUDITED)
Six Months Ended June 30, | ||||||||
(Millions) | 2018 | 2017 | ||||||
Cash Flows from Operating Activities: | ||||||||
Net loss | $ | (214.2 | ) | $ | (178.7 | ) | ||
Adjustments to reconcile net loss to net cash provided from operations: | ||||||||
Depreciation and amortization | 752.5 | 700.9 | ||||||
Provision for doubtful accounts | 15.2 | 19.7 | ||||||
Share-based compensation expense | 18.4 | 32.4 | ||||||
Deferred income taxes | (64.7 | ) | (97.3 | ) | ||||
Net loss on early extinguishment of debt | — | 3.2 | ||||||
Other, net | 4.3 | 7.9 | ||||||
Changes in operating assets and liabilities, net | ||||||||
Accounts receivable | 5.8 | 15.7 | ||||||
Prepaid income taxes | (4.7 | ) | (5.2 | ) | ||||
Prepaid expenses and other | 7.3 | (14.3 | ) | |||||
Accounts payable | 17.2 | (56.3 | ) | |||||
Accrued interest | 9.9 | (6.8 | ) | |||||
Accrued taxes | (9.3 | ) | 2.0 | |||||
Other current liabilities | (18.6 | ) | (21.1 | ) | ||||
Other liabilities | 7.0 | 1.5 | ||||||
Other, net | 14.6 | (29.0 | ) | |||||
Net cash provided from operating activities | 540.7 | 374.6 | ||||||
Cash Flows from Investing Activities: | ||||||||
Additions to property, plant and equipment | (406.3 | ) | (507.8 | ) | ||||
Cash acquired from EarthLink | — | 5.0 | ||||||
Acquisition of MASS | (37.6 | ) | — | |||||
Other, net | (8.8 | ) | (11.8 | ) | ||||
Net cash used in investing activities | (452.7 | ) | (514.6 | ) | ||||
Cash Flows from Financing Activities: | ||||||||
Distributions to Windstream Holdings, Inc. | (1.0 | ) | (35.3 | ) | ||||
Contribution from Windstream Holdings, Inc. | 11.1 | 9.6 | ||||||
Repayments of debt and swaps | (413.1 | ) | (1,282.2 | ) | ||||
Proceeds from debt issuance | 450.0 | 1,535.6 | ||||||
Debt issuance costs | (11.6 | ) | (7.3 | ) | ||||
Payments under long-term lease obligations | (91.4 | ) | (82.2 | ) | ||||
Payments under capital lease obligations | (27.7 | ) | (22.0 | ) | ||||
Other, net | (2.4 | ) | (10.6 | ) | ||||
Net cash (used in) provided from financing activities | (86.1 | ) | 105.6 | |||||
Increase (decrease) in cash and cash equivalents | 1.9 | (34.4 | ) | |||||
Cash and Cash Equivalents: | ||||||||
Beginning of period | 43.4 | 59.1 | ||||||
End of period | $ | 45.3 | $ | 24.7 | ||||
Supplemental Cash Flow Disclosures: | ||||||||
Interest paid, net of interest capitalized | $ | 428.9 | $ | 417.7 | ||||
Income taxes (refunded) paid, net | $ | (15.1 | ) | $ | 1.3 | |||
See the accompanying notes to the unaudited interim consolidated financial statements.
10
WINDSTREAM SERVICES, LLC
CONSOLIDATED STATEMENT OF MEMBER DEFICIT (UNAUDITED)
(Millions) | Additional Paid-In Capital | Accumulated Other Comprehensive Income | Accumulated Deficit | Total | ||||||||||||
Balance at December 31, 2017 | $ | 1,187.1 | $ | 21.4 | $ | (2,507.4 | ) | $ | (1,298.9 | ) | ||||||
Cumulative effect adjustments, net of tax: | ||||||||||||||||
Adoption of ASU 2014-09 (See Note 1) | — | — | 35.3 | 35.3 | ||||||||||||
Adoption of ASU 2017-12 (See Note 1) | — | 1.7 | (1.7 | ) | — | |||||||||||
Net loss | — | — | (214.2 | ) | (214.2 | ) | ||||||||||
Other comprehensive income (loss), net of tax: | ||||||||||||||||
Change in postretirement and pension plans | — | 5.0 | — | 5.0 | ||||||||||||
Amortization of unrealized losses on de-designated interest rate swaps | — | 1.2 | — | 1.2 | ||||||||||||
Change in designated interest rate swaps | — | 14.7 | — | 14.7 | ||||||||||||
Comprehensive income (loss) | — | 20.9 | (214.2 | ) | (193.3 | ) | ||||||||||
Share-based compensation | 7.4 | — | — | 7.4 | ||||||||||||
Contributions from Windstream Holdings, Inc.: | ||||||||||||||||
Stock issued under equity distribution agreement | 11.1 | — | — | 11.1 | ||||||||||||
Stock issued for pension contribution | 5.8 | — | — | 5.8 | ||||||||||||
Stock contribution to employee savings plan | 28.3 | — | — | 28.3 | ||||||||||||
Taxes withheld on vested restricted stock and other | (1.3 | ) | — | — | (1.3 | ) | ||||||||||
Distributions payable to Windstream Holdings, Inc. | (0.9 | ) | — | — | (0.9 | ) | ||||||||||
Balance at June 30, 2018 | $ | 1,237.5 | $ | 44.0 | $ | (2,688.0 | ) | $ | (1,406.5 | ) | ||||||
See the accompanying notes to the unaudited interim consolidated financial statements.
11
NOTES TO UNAUDITED INTERIM CONSOLIDATED FINANCIAL STATEMENTS
1. Preparation of Interim Financial Statements:
In these consolidated financial statements, unless the context requires otherwise, the use of the terms “Windstream,” “we,” “us” or “our” shall refer to Windstream Holdings, Inc. and its subsidiaries, including Windstream Services, LLC, and the term “Windstream Services” shall refer to Windstream Services, LLC and its subsidiaries.
Organizational Structure – Windstream Holdings, Inc. (“Windstream Holdings”) is a publicly traded holding company incorporated in the state of Delaware on May 23, 2013, and the parent of Windstream Services, LLC (“Windstream Services”), a Delaware limited liability company organized on March 1, 2004. Windstream Holdings common stock trades on the NASDAQ Global Select Market (“NASDAQ”) under the ticker symbol “WIN”. Windstream Holdings owns a 100 percent interest in Windstream Services. Windstream Services and its guarantor subsidiaries are the sole obligors of all outstanding debt obligations and, as a result also file periodic reports with the Securities and Exchange Commission (“SEC”). Windstream Holdings is not a guarantor of nor subject to the restrictive covenants included in any of Windstream Services’ debt agreements. The Windstream Holdings board of directors and officers oversee both companies.
Description of Business – We are a leading provider of advanced network communications and technology solutions for businesses across the U.S. We also offer broadband, entertainment and security solutions to consumers and small businesses primarily in rural areas in 18 states. Additionally, we supply core transport solutions on a local and long-haul fiber network spanning approximately 150,000 miles.
Consumer service revenues are generated from the provisioning of high-speed Internet, voice and video services to consumers. Enterprise service revenues include revenues from integrated voice and data services, advanced data and traditional voice and long-distance services provided to enterprise, mid-market and small business customers. Wholesale revenues include revenues from other communications services providers for special access circuits and fiber connections, voice and data transport services, and revenues from the reselling of our services. Service revenues also include switched access revenues, federal and state Universal Service Fund (“USF”) revenues, amounts received from Connect America Fund - Phase II, USF surcharges and revenues from providing other miscellaneous services.
Basis of Presentation – The accompanying unaudited consolidated financial statements have been prepared based upon SEC rules that permit reduced disclosure for interim periods. Certain information and footnote disclosures have been condensed or omitted in accordance with those rules and regulations. The accompanying consolidated balance sheet as of December 31, 2017, was derived from audited financial statements, but does not include all disclosures required by accounting principles generally accepted in the United States. In our opinion, these financial statements reflect all adjustments that are necessary for a fair statement of results of operations and financial condition for the interim periods presented including normal recurring accruals and other items. The results for the interim periods are not necessarily indicative of results for the full year. For a more complete discussion of significant accounting policies and certain other information, this report should be read in conjunction with the consolidated financial statements and accompanying notes included in our Annual Report on Form 10-K for the year ended December 31, 2017, which was filed with the SEC on February 28, 2018.
On May 23, 2018, we amended our certificate of incorporation to decrease the number of authorized shares of our common and preferred stock from 375.0 million to 75.0 million and from 33.3 million to 6.7 million, respectively, and enacted a one-for-five reverse stock split with respect to all of our outstanding shares of common stock which became effective on May 25, 2018. All per share data of Windstream Holdings presented herein has been retrospectively adjusted to reflect the decrease in authorized shares and the reverse stock split, as appropriate.
Windstream Holdings and its domestic subsidiaries, including Windstream Services, file a consolidated federal income tax return. As such, Windstream Services and its subsidiaries are not separate taxable entities for federal and certain state income tax purposes. In instances when Windstream Services does not file a separate return, income taxes as presented within the accompanying consolidated financial statements attribute current and deferred income taxes of Windstream Holdings to Windstream Services and its subsidiaries in a manner that is systematic, rational and consistent with the asset and liability method. Income tax provisions presented for Windstream Services and its subsidiaries are prepared under the “separate return method.” The separate return method represents a hypothetical computation assuming that the reported revenue and expenses of Windstream Services and its subsidiaries were incurred by separate taxable entities.
12
NOTES TO UNAUDITED INTERIM CONSOLIDATED FINANCIAL STATEMENTS
____
1. Preparation of Interim Financial Statements, Continued:
The preparation of financial statements, in accordance with accounting principles generally accepted in the United States (“U.S. GAAP”), requires management to make estimates and assumptions that affect the reported amounts of assets, liabilities, revenues and expenses and disclosure of contingent assets and liabilities. The estimates and assumptions used in the accompanying consolidated financial statements are based upon management’s evaluation of the relevant facts and circumstances as of the date of the consolidated financial statements. Actual results may differ from the estimates and assumptions used in preparing the accompanying consolidated financial statements, and such differences could be material.
There are no significant differences between the consolidated results of operations, financial condition, and cash flows of Windstream Holdings and those of Windstream Services other than for certain expenses incurred directly by Windstream Holdings principally consisting of audit, legal and board of director fees, NASDAQ listing fees, other shareholder-related costs, income taxes, common stock activity, and payables from Windstream Services to Windstream Holdings. Earnings per share data has not been presented for Windstream Services, because that entity has not issued publicly held common stock as defined in accordance with U.S. GAAP. Unless otherwise indicated, the note disclosures included herein pertain to both Windstream Holdings and Windstream Services.
Certain prior year amounts have been reclassified to confirm to the current year financial statement presentation. These changes and reclassifications did not impact net loss or comprehensive loss.
Recently Adopted Accounting Standards
Revenue Recognition – In May 2014, the Financial Accounting Standards Board (“FASB”) issued Accounting Standards Update (“ASU”) No. 2014-09, Revenue from Contracts with Customers (Topic 606) as modified by subsequently issued ASU Nos. 2015-14, 2016-08, 2016-10, 2016-11, 2016-12 and 2016-20 (collectively “ASU 2014-09”). The core principle of the revenue model is that an entity should recognize revenue for the transfer of promised goods or services to customers in an amount that reflects the consideration to which the entity expects to be entitled to receive for those goods or services. ASU 2014-09 also provided new accounting principles related to the deferral and amortization of contract acquisition and fulfillment costs.
On January 1, 2018, we adopted ASU 2014-09 using the modified retrospective transition method applied to those contracts which were not complete as of January 1, 2018. Under the modified retrospective transition method, we recognized the cumulative effect of initial adoption as an adjustment to our opening accumulated deficit balance. Comparative information for prior periods has not been restated and continues to be reported under the accounting standards in effect for those periods.
Under the new revenue recognition guidance, a substantial portion of our service revenues continue to be recognized when services are provided. Changes to the timing of recognition of certain installation services, discounts and promotional credits given to customers under the new guidance resulted in the recognition of incremental contract assets and liabilities in our consolidated balance sheet at the date of adoption. In addition, the new requirement to defer incremental contract acquisition and fulfillment costs, including sales commissions and installation costs, and recognize such costs over the period where control of goods and services are transferred resulted in the recognition of additional deferred contract costs in our consolidated balance sheet at the date of adoption. We evaluated the effect of the time value of money and determined it to be immaterial.
The following table presents the cumulative effect of the changes made to our consolidated balance sheet at December 31, 2017:
(Millions) | December 31, 2017 | ASU 2014-09 Adjustments | January 1, 2018 | |||||||||
Assets | ||||||||||||
Accounts receivable | $ | 643.0 | $ | — | $ | 643.0 | ||||||
Prepaid expenses and other | $ | 154.3 | $ | 26.0 | $ | 180.3 | ||||||
Other assets | $ | 91.2 | $ | 20.9 | $ | 112.1 | ||||||
Deferred income taxes | $ | 370.8 | $ | (12.0 | ) | $ | 358.8 | |||||
Liabilities | ||||||||||||
Advance payments and customer deposits | $ | 207.3 | $ | (0.5 | ) | $ | 206.8 | |||||
Other current liabilities | $ | 342.1 | $ | (0.3 | ) | $ | 341.8 | |||||
Other liabilities | $ | 521.9 | $ | 0.4 | $ | 522.3 | ||||||
Accumulated deficit | $ | (2,512.2 | ) | $ | 35.3 | $ | (2,476.9 | ) | ||||
13
NOTES TO UNAUDITED INTERIM CONSOLIDATED FINANCIAL STATEMENTS
____
1. Preparation of Interim Financial Statements, Continued:
The impact of adoption of ASU 2014-09 on our 2018 consolidated statements of operations and consolidated balance sheet are as follows:
Three Months Ended June 30, 2018 | |||||||||||
(Millions) | Under ASC 605 | Effect of Adoption of ASU 2014-09 | As reported | ||||||||
Revenue and sales | |||||||||||
Service revenues | $ | 1,424.5 | $ | 0.1 | $ | 1,424.6 | |||||
Product sales | $ | 19.8 | $ | — | $ | 19.8 | |||||
Costs and expenses | |||||||||||
Cost of services | $ | 722.9 | $ | (0.1 | ) | $ | 722.8 | ||||
Selling, general and administrative | $ | 225.5 | $ | (1.0 | ) | $ | 224.5 | ||||
Income tax benefit | $ | (30.7 | ) | $ | 0.3 | $ | (30.4 | ) | |||
Net loss | $ | (94.6 | ) | $ | 0.9 | $ | (93.7 | ) | |||
Six Months Ended June 30, 2018 | |||||||||||
(Millions) | Under ASC 605 | Effect of Adoption of ASU 2014-09 | As reported | ||||||||
Revenue and sales | |||||||||||
Service revenues | $ | 2,858.9 | $ | 1.1 | $ | 2,860.0 | |||||
Product sales | $ | 38.7 | $ | — | $ | 38.7 | |||||
Costs and expenses | |||||||||||
Cost of services | $ | 1,459.3 | $ | 0.4 | $ | 1,459.7 | |||||
Selling, general and administrative | $ | 453.7 | $ | (0.4 | ) | $ | 453.3 | ||||
Income tax benefit | $ | (65.7 | ) | $ | 0.3 | $ | (65.4 | ) | |||
Net loss | $ | (215.9 | ) | $ | 0.8 | $ | (215.1 | ) | |||
June 30, 2018 | |||||||||||
(Millions) | Under ASC 605 | Effect of Adoption of ASU 2014-09 | As reported | ||||||||
Assets | |||||||||||
Accounts receivable | $ | 623.9 | $ | — | $ | 623.9 | |||||
Prepaid expenses and other | $ | 149.4 | $ | 31.6 | $ | 181.0 | |||||
Other assets | $ | 92.3 | $ | 16.2 | $ | 108.5 | |||||
Deferred income taxes | $ | 428.5 | $ | (12.3 | ) | $ | 416.2 | ||||
Liabilities | |||||||||||
Advance payments and customer deposits | $ | 200.3 | $ | (0.6 | ) | $ | 199.7 | ||||
Other current liabilities | $ | 278.8 | $ | 0.1 | $ | 278.9 | |||||
Other liabilities | $ | 496.5 | $ | (0.1 | ) | $ | 496.4 | ||||
Accumulated deficit | $ | (2,729.8 | ) | $ | 36.1 | $ | (2,693.7 | ) | |||
The new revenue recognition standard also requires additional disclosures related to performance obligations; contract asset and liability balances; deferred commissions and costs to fulfill; disaggregation of revenue and use of practical expedients in applying the new guidance. See Note 2 for these additional disclosures.
14
NOTES TO UNAUDITED INTERIM CONSOLIDATED FINANCIAL STATEMENTS
____
1. Preparation of Interim Financial Statements, Continued:
Statement of Cash Flows – In August 2016, the FASB issued ASU No. 2016-15, Statement of Cash Flows (Topic 230): Classification of Certain Cash Receipts and Cash Payments (“ASU 2016-15”). This standard provides guidance on how certain cash receipts and cash payments should be presented and classified in the statement of cash flows, including among others, debt prepayment and extinguishment costs, contingent consideration payments made after a business combination, proceeds from the settlement of insurance claims and distributions received from equity method investees. The standard also clarifies that when cash receipts and cash payments have aspects of more than one class of cash flows and cannot be separated, classification will depend on the predominant source or use of the underlying cash flows. ASU 2016-15 is effective for annual and interim reporting periods beginning after December 15, 2017, with early adoption permitted. We adopted this standard effective January 1, 2018. The effect of the retrospective adoption of this standard was to change previously reported amounts within the accompanying consolidated statement of cash flows for the six-month period ended June 30, 2017 due to reclassifying $21.2 million of debt prepayment penalties and fees paid to lenders in conjunction with the early termination of long-term debt obligations from operating activities to financing activities. Other than this change in classification of debt prepayment penalties and fees, adoption of this standard did not have an impact on our consolidated statement of cash flows.
The following table presents the effect of the changes made to our consolidated statement of cash flows for the six-month period ended June 30, 2017:
(Millions) | As Previously Reported | Reclassification Adjustments | As Revised | |||||||||
Cash Flows from Operating Activities: | ||||||||||||
Adjustments to reconcile net loss to net cash provided from operations: | ||||||||||||
Noncash portion of net (gain) loss on early extinguishment of debt | $ | (15.1 | ) | $ | 15.1 | $ | — | |||||
Net loss on early extinguishment of debt | $ | — | $ | 3.2 | $ | 3.2 | ||||||
Changes in operating assets and liabilities, net: | ||||||||||||
Other, net | $ | (31.9 | ) | $ | 2.9 | $ | (29.0 | ) | ||||
Net cash provided from operating activities | $ | 353.7 | $ | 21.2 | $ | 374.9 | ||||||
Cash Flows from Financing Activities: | ||||||||||||
Repayments of debt and swaps | $ | (1,261.0 | ) | $ | (21.2 | ) | $ | (1,282.2 | ) | |||
Net cash provided from financing activities | $ | 126.5 | $ | (21.2 | ) | $ | 105.3 | |||||
Definition of a Business – In January 2017, the FASB issued ASU No. 2017-01, Business Combinations (Topic 805), Clarifying the Definition of a Business (“ASU 2017-01”). The standard clarifies the definition of a business when evaluating whether transactions should be accounted for as acquisitions or disposals of assets or businesses. Under the new guidance an integrated set of activities must include, at a minimum, an input and a substantive process that together significantly contribute to the ability to create output to be considered a business. ASU 2017-01 provides a framework to assist entities in evaluating whether both an input and a substantive process are present and removes the evaluation of whether a market participant could replace missing elements. Although outputs are not required for an integrated set of activities to be a business, outputs generally are a key element of a business; therefore, the new guidance provides more stringent criteria for an integrated sets of activities without outputs. Furthermore, ASU 2017-01 narrows the definition of the term output so that it is consistent with how outputs are described in Topic 606. ASU 2017-01 is effective for annual periods beginning after December 15, 2017, including interim periods within those annual reporting periods. We adopted this standard effective January 1, 2018. Following adoption, we expect fewer transactions will be accounted for as acquisitions or disposals of businesses.
15
NOTES TO UNAUDITED INTERIM CONSOLIDATED FINANCIAL STATEMENTS
____
1. Preparation of Interim Financial Statements, Continued:
Presentation of Defined Benefit Retirement Costs – In March 2017, the FASB issued ASU 2017-07, Compensation-Retirement Benefits (Topic 715) Improving the Presentation of Net Periodic Pension Cost and Net Periodic Postretirement Benefit Cost (“ASU 2017-07”). This standard changes the income statement presentation of defined benefit plan expense by requiring separation between operating expense (service cost component) and non-operating expense (all other components, including interest cost, amortization of prior service cost, actuarial gains and losses, curtailments and settlements). The operating expense component will be reported in the same income statement line item(s) as other employee compensation costs arising from services rendered during the period while the non-operating components will be reported in other income and expense. In addition, only the service cost component will be eligible for capitalization as part of an asset such as inventory or property, plant and equipment. Retrospective application of the change in income statement presentation is required, while the change in capitalized benefit cost is to be applied prospectively. The ASU is effective for fiscal years beginning after December 15, 2017. We adopted this standard effective January 1, 2018. The effect of the retrospective adoption of this standard was to change previously reported amounts within the accompanying consolidated statement of operations for the three and six month periods ended June 30, 2017, respectively, for operating income and other income, net, resulting in decreases in operating income from $106.8 million to $102.5 million and from $152.8 million to $146.6 million, respectively, with corresponding increases to other (expense) income, net from $(0.1) million to $4.2 million and $0.6 million to $6.8 million, respectively. There was no change to our reported net loss for the three and six month periods ended June 30, 2017. The impact of only capitalizing service cost on a prospective basis was immaterial to our consolidated financial statements as of and for the three and six month periods ended June 30, 2018.
Hedging Activities – In August 2017, the FASB issued ASU 2017-12, Derivatives and Hedging (Topic 815) Targeted Improvements to Accounting for Hedging Activities. This standard modifies hedge accounting to allow more hedging strategies to qualify for hedge accounting, amends presentation and disclosure requirements, and changes how entities assess effectiveness of their hedging transactions. ASU 2017-12 is effective for fiscal years beginning after December 15, 2018, including interim periods within those fiscal years. Early adoption is permitted. As permitted, we early adopted this standard effective January 1, 2018. Upon adoption, we recognized a cumulative effect adjustment of $(1.7) million, net of tax, to the opening balance of our accumulated deficit with an offsetting increase to accumulated comprehensive income. Comparative prior-period information has not been restated. See Note 6 for additional information regarding our hedging activities and derivative financial instruments.
Recently Issued Authoritative Guidance
Leases – In February 2016, the FASB issued ASU 2016-02, Leases (Topic 842), which will require that virtually all lease arrangements that do not meet the criteria of a short-term lease be presented on the lessee’s balance sheet by recording a right-of-use asset and a lease liability equal to the present value of the related future lease payments. The income statement impacts of the leases will depend on the nature of the leasing arrangement and will be similar to existing accounting for operating and capital leases. The new standard does not substantially change the accounting for lessors. The new standard will also require additional disclosures regarding an entity’s leasing arrangements and will be effective for the first interim reporting period within annual periods beginning after December 15, 2018, although early adoption is permitted. Lessees and lessors will be required to apply the new standard at the beginning of the earliest period presented in the financial statements in which they first apply the new guidance, using a modified retrospective transition method. We will adopt ASU 2016-02 effective January 1, 2019. Our existing operating lease portfolio primarily consists of network, real estate and equipment leases. Upon adoption of this standard, we expect to record in our consolidated balance sheet a right-of-use asset and liability related to substantially all of our operating lease arrangements. We have established a cross-functional team to determine the scope of arrangements subject to this standard as well as to assess the impact to our systems, processes and internal controls that will be necessary to meet the standard’s reporting and disclosure requirements.
Financial Instruments - Credit Losses – In June 2016, the FASB issued ASU No. 2016-13, Financial Instruments - Credit Losses (Topic 326): Measurement of Credit Losses on Financial Instruments (“ASU 2016-13”). This standard introduces a new forward-looking approach, based on expected losses, to estimate credit losses on certain types of financial instruments, including trade receivables. The estimate of expected credit losses will require entities to incorporate considerations of historical information, current information and reasonable and supportable forecasts. This new standard also expands the disclosure requirements to enable users of financial statements to understand the entity’s assumptions, models and methods for estimating expected credit losses. ASU 2016-13 is effective for annual and interim reporting periods beginning after December 15, 2019, and the guidance is to be applied using a modified retrospective transition approach. Early adoption is permitted for annual and interim reporting periods beginning after December 15, 2018. We intend to adopt this standard update in the first quarter of 2020. We are currently assessing the impact the new standard will have on our consolidated financial statements.
16
NOTES TO UNAUDITED INTERIM CONSOLIDATED FINANCIAL STATEMENTS
____
2. Revenues:
As previously discussed in Note 1, we adopted ASU 2014-09 effective January 1, 2018 using the modified retrospective transition method. The majority of our revenue is derived from providing access to or usage of our networks and facilities we operate.
Performance Obligations – A performance obligation is a promise in a contract to transfer a distinct good or service to the customer, and represents the unit of account in applying the new revenue recognition guidance. A contract’s transaction price, considering discounts given for bundled purchases and promotional credits, is allocated to each distinct performance obligation and recognized as revenue when, or as, the performance obligation is satisfied. The majority of our contracts have multiple performance obligations. While many contracts include one or more performance obligations, the revenue recognition pattern is generally not impacted by the allocation since the performance obligations are generally satisfied over the same period of time. For contracts with multiple performance obligations, we allocate the contract’s transaction price to each performance obligation based on the relative standalone selling price of each performance obligation in the contract. The standalone selling price is the estimated price we would charge for the good or service in a separate transaction with similar customers in similar circumstances. Identifying distinct performance obligations and determining the standalone selling price for each performance obligation within a contract with multiple performance obligations requires significant management judgment.
Our performance obligations are satisfied over time as services are rendered or at a point in time depending on our evaluation of when the customer obtains control of the promised goods. Revenue is recognized when obligations under the terms of a contract with our customer are satisfied; generally, this occurs when services are rendered or control of our communication products is transferred. Service revenues are recognized over the period that the corresponding services are rendered to customers. Revenues that are billed in advance include monthly recurring network access and data services, special access and monthly recurring voice, Internet and other related charges. Revenues derived from other telecommunications services, including interconnection, long-distance and enhanced service revenues are recognized monthly as services are provided. Telecommunications network maintenance revenue from indefeasible rights to use fiber optic network facility arrangements (“IRUs”) are generally recognized over the term of the related contract. Sales of communications products including customer premise equipment and modems are recognized when products are delivered to and accepted by customers.
In determining whether installation is a separate performance obligation, we evaluate, among other factors, whether other performance obligations are highly dependent upon installation requiring significant integration or customization or whether a customer can benefit from the installation with other readily available resources. In circumstances where customers can benefit from the installation with other readily available resources, installation is a separate performance obligation. We recognize installation revenue when the installation is complete. In circumstances where other telecommunication service performance obligations are highly dependent upon installation, installation is not a separate purchase obligation, and accordingly, we include the installation fees in the transaction price allocated to and recognized with other telecommunication service performance obligations.
Fees assessed to customers for service activation are considered a material right in a month-to-month contract. These service activation fees are deferred and recognized as service revenue on a straight-line basis over the estimated life of the customer.
As a practical expedient, we group similar contracts or performance obligations together into portfolios of contracts or performance obligations for the following: service activations, installation services, certain promotional credits, commissions and other costs to fulfill a contract. Portfolios are recognized over the estimated life of the customer. Determining the estimated life of the customer requires significant management judgment.
The estimated life of our customer relationships varies by business segment. Wholesale customer lives are estimated based on the average number of months each individual circuit was active. Enterprise and small business customer lives are based on average contract terms. Consumer lives are estimated based on average customer tenure.
17
NOTES TO UNAUDITED INTERIM CONSOLIDATED FINANCIAL STATEMENTS
____
2. Revenues, Continued:
Our contracts include discounts and promotional credits given to customers. We include discounts and promotional credits in the transaction price. These estimates are based on historical experience and anticipated performance.
In determining whether to include in revenues and expenses, the taxes and surcharges assessed and collected from customers and remitted to government authorities, including USF charges, sales, use, value added and excise taxes, we evaluate, among other factors, whether we are the primary obligor or principal tax payer for the fees and taxes assessed in each jurisdiction in which we operate. In those jurisdictions for which we are the primary obligor, we record the taxes and surcharges on a gross basis and include in revenues and costs of services and products. In jurisdictions in which we function as a collection agent for the government authority, we record the taxes on a net basis and exclude the amounts from our revenues and costs of services and products.
We offer third-party video services to our customers. The third-party service provider retains control of the service and is the primary obligor. We record commissions received on a net basis.
Accounts Receivable – Accounts receivable, principally consist of amounts billed and currently due from customers and are generally unsecured and due within 30 days. The amounts due are stated at their net estimated realizable value. We maintain an allowance for doubtful accounts to provide for the estimated amount of receivables that will not be collected. The allowance is based upon an assessment of historical collection experience, age of outstanding receivables, current economic conditions and a specific customer’s ability to meet its financial obligations. Concentration of credit risk with respect to accounts receivable is limited because a large number of geographically diverse customers make up our customer base. Due to varying customer monthly billing cycle cut-off, we must estimate service revenues earned but not yet billed at the end of each reporting period. Included in accounts receivable are unbilled revenues related to communication services and product sales of $23.7 million and $23.8 million at June 30, 2018 and December 31, 2017, respectively.
Contract Balances – Contract assets include unbilled amounts resulting when revenue recognized exceeds the amount billed to the customer, and right to payment is not just subject to the passage of time. Contract assets principally consist of discounts and promotional credits given to customers. The current and noncurrent portion of contract assets is included in prepaid expenses and other and other assets, respectively in the accompanying consolidated balance sheets.
Our contract liabilities consist of services billed in excess of revenue recognized. Our contract assets and liabilities are reported in a net position on a contract-by-contract basis at the end of each reporting period. We classify these amounts as current or noncurrent based on the timing of when we expect to recognize revenue.
The following table provides a rollforward of contract assets and liabilities from contracts with customers:
(Millions) | Contract Assets | Contract Liabilities | |||||||
Balance at January 1, 2018 | $ | 13.1 | (a) | $ | (209.3 | ) | (b) | ||
Revenue recognized included in opening contract balance | (4.8 | ) | 183.8 | ||||||
Cash received, excluding amounts recognized as revenue | — | (177.1 | ) | ||||||
Credits granted, excluding amounts recognized as revenue | 4.6 | — | |||||||
Balance at June 30, 2018 | $ | 12.9 | (a) | $ | (202.6 | ) | (b) | ||
(a) | Includes $8.5 million and $3.6 million in prepaid expense and other and $4.4 million and $9.5 million in other assets as of June 30, 2018 and January 1, 2018, respectively. |
(b) | Includes $190.0 million and $198.3 million in advance payments and customer deposits and $12.6 million and $11.0 million in other liabilities as of June 30, 2018 and January 1, 2018, respectively. |
18
NOTES TO UNAUDITED INTERIM CONSOLIDATED FINANCIAL STATEMENTS
____
2. Revenues, Continued:
Remaining Performance Obligations – Our remaining performance obligations represent services we are required to provide to customers under bundled or discounted arrangements, which are satisfied as services are provided over the contract term. Certain contracts provide customers the option to purchase additional services or usage based services. The fees related to the additional services or usage based services are recognized when the customer exercises the option, typically on a month-to-month basis. In determining the transaction price allocated, we do not include these non-recurring fees and estimates for usage, nor do we consider arrangements with an original expected duration of less than one year.
Remaining performance obligations reflect recurring charges billed, adjusted for discounts and promotional credits and revenue adjustments. At June 30, 2018, the aggregate amount of the transaction price allocated to remaining performance obligations was approximately $3.5 billion for contracts with original expected durations of more than one year remaining. We expect to recognize approximately 23.1 percent, 38.3 percent and 24.7 percent of our remaining performance obligations as revenue during the remainder of 2018, 2019 and 2020, with the remaining balance thereafter.
Revenue by Category – We disaggregate our revenue from contracts with customers by product type for each of our segments, as we believe it best depicts the nature, amount and timing of our revenue. Revenues recognized from contracts with customers by customer and product type for the three-month period ended June 30, 2018 was as follows:
(Millions) | Consumer & Small Business | Enterprise | Wholesale | Consumer CLEC | Total | |||||||||||||||
Revenue from contracts with customers: | ||||||||||||||||||||
Type of service: | ||||||||||||||||||||
High-speed Internet bundles | $ | 242.4 | $ | — | $ | — | $ | 23.2 | $ | 265.6 | ||||||||||
Voice and long-distance | 30.7 | 240.2 | — | — | 270.9 | |||||||||||||||
Video and miscellaneous | 11.3 | — | — | — | 11.3 | |||||||||||||||
Dial-up, e-mail and miscellaneous | — | — | — | 22.5 | 22.5 | |||||||||||||||
Data and integrated services | — | 388.4 | — | — | 388.4 | |||||||||||||||
Small business services | 75.9 | — | — | — | 75.9 | |||||||||||||||
Core wholesale (a) | — | — | 139.1 | — | 139.1 | |||||||||||||||
Resale (b) | — | — | 20.1 | — | 20.1 | |||||||||||||||
Wireless TDM (c) | — | — | 2.4 | — | 2.4 | |||||||||||||||
Switched access | 7.0 | — | 9.4 | — | 16.4 | |||||||||||||||
Miscellaneous | — | 38.8 | — | — | 38.8 | |||||||||||||||
Service revenues from contracts with customers | 367.3 | 667.4 | 171.0 | 45.7 | 1,251.4 | |||||||||||||||
Product sales | 6.6 | 13.0 | 0.1 | 0.1 | 19.8 | |||||||||||||||
Total revenue from contracts with customers | 373.9 | 680.4 | 171.1 | 45.8 | 1,271.2 | |||||||||||||||
Other service revenues (d) | 98.6 | 62.7 | 11.3 | 0.6 | 173.2 | |||||||||||||||
Total revenues and sales | $ | 472.5 | $ | 743.1 | $ | 182.4 | $ | 46.4 | $ | 1,444.4 | ||||||||||
19
NOTES TO UNAUDITED INTERIM CONSOLIDATED FINANCIAL STATEMENTS
____
2. Revenues, Continued:
Revenues recognized from contracts with customers by customer and product type for the six-month period ended June 30, 2018 was as follows:
(Millions) | Consumer & Small Business | Enterprise | Wholesale | Consumer CLEC | Total | |||||||||||||||
Revenue from contracts with customers: | ||||||||||||||||||||
Type of service: | ||||||||||||||||||||
High-speed Internet bundles | $ | 486.0 | $ | — | $ | — | $ | 47.6 | $ | 533.6 | ||||||||||
Voice and long-distance | 62.1 | 483.0 | — | — | 545.1 | |||||||||||||||
Video and miscellaneous | 22.7 | — | — | — | 22.7 | |||||||||||||||
Dial-up, e-mail and miscellaneous | — | — | — | 45.3 | 45.3 | |||||||||||||||
Data and integrated services | — | 776.1 | — | — | 776.1 | |||||||||||||||
Small business services | 154.0 | — | — | — | 154.0 | |||||||||||||||
Core wholesale (a) | — | — | 278.6 | — | 278.6 | |||||||||||||||
Resale (b) | — | — | 41.4 | — | 41.4 | |||||||||||||||
Wireless TDM (c) | — | — | 5.1 | — | 5.1 | |||||||||||||||
Switched access | 15.1 | — | 18.8 | — | 33.9 | |||||||||||||||
Miscellaneous | — | 77.7 | — | — | 77.7 | |||||||||||||||
Service revenues from contracts with customers | 739.9 | 1,336.8 | 343.9 | 92.9 | 2,513.5 | |||||||||||||||
Product sales | 12.1 | 26.2 | 0.2 | 0.2 | 38.7 | |||||||||||||||
Total revenue from contracts with customers | 752.0 | 1,363.0 | 344.1 | 93.1 | 2,552.2 | |||||||||||||||
Other service revenues (d) | 197.0 | 126.2 | 22.1 | 1.2 | 346.5 | |||||||||||||||
Total revenues and sales | $ | 949.0 | $ | 1,489.2 | $ | 366.2 | $ | 94.3 | $ | 2,898.7 | ||||||||||
(a) | Core wholesale revenues primarily include revenues from providing special access circuits, fiber connections, data transport and wireless backhaul services. |
(b) | Revenues represent voice and data services sold to other communications services providers on a resale basis. |
(c) | Revenues represent Time Division Multiplexing (“TDM”) private line transport services. |
(d) | Other service revenues primarily include end user surcharges, Connect America Fund Phase II funding, state USF and access recovery mechanism (“ARM”) support and lease revenue. |
Deferred Commissions and Other Costs to Fulfill a Contract – Our direct incremental costs of obtaining a contract, consisting of sales commissions, and certain costs associated with activating services, including costs to develop customized solutions and provision services, are deferred and recognized as an operating expense using a portfolio approach over the estimated life of the customer, which ranges from 18 to 36 months.
Determining the amount of costs to fulfill requires judgment. In determining costs to fulfill consideration is given to periodic time studies, management estimates and statistics from internal information systems.
Collectively, deferred commissions and other costs to fulfill a contract are referred to as deferred contract costs. We classify deferred contract costs as current or noncurrent based on the timing of when we expect to recognize the expense. The current and noncurrent portions of deferred contract costs are included in prepaid expenses and other and other assets in our consolidated balance sheets. Deferred contract costs totaled $44.7 million at June 30, 2018, of which $30.6 million and $14.1 million was included in prepaid expenses and other and other assets, respectively. At January 1, 2018, deferred contract costs were $44.6 million, of which $30.3 million and $14.3 million was included in prepaid expenses and other and other assets, respectively. Amortization of deferred contract costs was $21.3 million for the six-month period ended June 30, 2018. There was no impairment loss recognized for the six-month period ended June 30, 2018, related to deferred contract cost.
20
NOTES TO UNAUDITED INTERIM CONSOLIDATED FINANCIAL STATEMENTS
____
3. Acquisitions:
MASS Communications
On March 27, 2018, Windstream Holdings acquired MASS Communications (“MASS”), a privately held telecommunications network management company focused on providing custom engineered voice, data and networking solutions to small and mid-sized global enterprises in the financial, legal, healthcare, technology, education and government sectors for initial cash consideration of approximately $37.6 million, including $2.5 million of expected earn-out payments, which have been funded into an escrow account. The acquisition was accounted using the acquisition method and accordingly, the cost of the acquisition was allocated to the assets acquired and liabilities assumed based on their estimated fair values as of the acquisition date. In allocating the purchase price, we recorded approximately $2.0 million of tangible assets, consisting primarily of accounts receivable, $10.0 million associated with a customer list intangible asset, $4.1 million of trade accounts payable and other current liabilities, $2.5 million of deferred income tax liabilities, and $32.2 million of goodwill. The purchase price allocation is preliminary and subject to change based on receipt of information currently not available to us, including the tax basis of the assets acquired. Any changes to the initial estimates of the fair value of the acquired assets and liabilities assumed will be recorded as adjustments to those asset and liabilities with the offset charged to goodwill. Goodwill associated with this acquisition was primarily attributable to the MASS workforce and expected synergies. None of the goodwill recorded in this acquisition is expected to be deductible for income tax purposes. The results of MASS’ operations were not material to our consolidated results of operations, and accordingly, no pro forma financial information has been presented.
Broadview Network Holdings, Inc.
On July 28, 2017, Windstream Holdings completed its merger with Broadview Networks Holdings, Inc. (“Broadview”), pursuant to the terms of the Agreement and Plan of Merger (the “Broadview Merger Agreement”) dated April 12, 2017, whereby Broadview merged into Beethoven Merger Subsidiary, Inc., with Broadview surviving as an indirect wholly owned subsidiary of Windstream Holdings, and changing its name to Windstream BV Holdings, Inc. Broadview is a leading provider of cloud-based unified communications solutions to small and medium-sized businesses and offers a broad suite of cloud-based services, which will improve our competitiveness and ability to provide enhanced services to business customers. Upon completion of the merger, Windstream added approximately 20,000 small and medium-sized business customers and approximately 3,000 incremental route fiber miles. Pursuant to the terms of the Broadview Merger Agreement, each share of Broadview’s common stock, par value $.01 per share that was issued and outstanding immediately prior to the effective time of the merger was automatically converted into the right to receive cash consideration of $6.98 per share. In completing the merger, Windstream Services paid $69.8 million in cash to Broadview shareholders and assumed $160.2 million of Broadview’s short-term debt obligations, which Windstream Services subsequently repaid using amounts available under its senior secured revolving credit facility. The transaction is valued at approximately $230.0 million.
We accounted for the merger using the acquisition method of accounting and accordingly, the cost of the acquisition was allocated to the assets acquired and liabilities assumed based on their estimated fair values as of the merger date. During 2018, we finalized our preliminary purchase price allocation for changes in the estimated fair value of certain acquired assets, resulting from new information about facts and circumstances that existed at the time of acquisition. The adjustments primarily consisted of an increase of $4.2 million in property, plant and equipment, reflecting updates to replacement cost information applicable to the valuation of these assets. The impact of this change on depreciation expense was not material to our consolidated results of operations. We also adjusted deferred income tax assets based on receipt of the final tax basis of assets acquired and adjusted certain state gross receipts and sales tax liabilities based on additional information received subsequent to the acquisition date, resulting in increases in deferred income tax assets of $1.4 million and other current liabilities of $4.7 million. The adjustments to the estimated fair values of assets acquired and liabilities assumed resulted in an offsetting decrease to goodwill of $0.7 million.
Goodwill associated with this acquisition was primarily attributable to the Broadview workforce and expected synergies. As a result of past acquisitions completed by Broadview, approximately $10.8 million of goodwill recorded in the merger is expected to be deductible for income tax purposes.
21
NOTES TO UNAUDITED INTERIM CONSOLIDATED FINANCIAL STATEMENTS
____
3. Acquisitions, Continued:
The following table summarizes the preliminary fair values of the assets acquired and liabilities assumed for Broadview.
(Millions) | Allocation as of December 31, 2017 | Adjustments | Final Allocation | |||||||||
Fair value of assets acquired: | ||||||||||||
Accounts receivable | $ | 17.4 | $ | 0.2 | $ | 17.6 | ||||||
Other current assets | 7.1 | (0.3 | ) | 6.8 | ||||||||
Property, plant and equipment | 37.1 | 4.2 | 41.3 | |||||||||
Goodwill | 121.3 | (0.7 | ) | 120.6 | ||||||||
Customer lists (a) | 45.0 | — | 45.0 | |||||||||
Trade names (b) | 21.0 | — | 21.0 | |||||||||
Developed technology (c) | 10.0 | — | 10.0 | |||||||||
Deferred income taxes | 9.7 | 1.4 | 11.1 | |||||||||
Other assets | 2.6 | (0.1 | ) | 2.5 | ||||||||
Total assets acquired | 271.2 | 4.7 | 275.9 | |||||||||
Fair value of liabilities assumed: | ||||||||||||
Short-term debt obligations | 160.2 | — | 160.2 | |||||||||
Other current liabilities | 46.9 | 4.7 | 51.6 | |||||||||
Other liabilities | 0.8 | — | 0.8 | |||||||||
Total liabilities assumed | 207.9 | 4.7 | 212.6 | |||||||||
Cash paid, net of cash acquired | $ | 63.3 | $ | — | $ | 63.3 | ||||||
(a) | Customer lists are amortized using the sum-of-years digits methodology over a weighted average life of 10 years. |
(b) | Trade names are amortized on a straight-line basis over an estimated useful life of 1 and 10 years. |
(c) | Internally developed technology is amortized on a straight-line basis over an estimated useful life of 5 years. |
The fair values of the assets acquired and liabilities assumed were determined utilizing income, cost and market approaches with the assistance of a third-party valuation firm. The customer list was valued based on the present value of future cash flows and the trade names and developed technology were valued using the relief-from-royalty method, both of which are income approaches. Significant assumptions utilized in these income approaches were based on our specific information and projections, which are not observable in the market and are thus considered Level 3 measurements as defined by authoritative guidance. The cost approach, which estimates value by determining the current cost of replacing an asset with another of equivalent economic utility, was used as appropriate for valuing property, plant and equipment. The cost to replace a given asset reflects the estimated reproduction or replacement cost for the asset, less an allowance for loss in value due to depreciation. The fair value of Broadview’s short-term debt obligations, consisting of a revolving credit facility and 10.5 percent senior notes due November 15, 2017 (“Broadview 2017 Notes”), were based on redemption cost and quoted market prices, respectively.
The results of Broadview’s operations are included in our consolidated results of operations beginning on July 28, 2017. For the three and six month periods ended June 30, 2018 our consolidated results of operations include revenues and sales of $69.4 million and $138.8 million and operating income of $18.7 million and $29.4 million attributable to Broadview. We incurred $1.5 million and $3.4 million of merger and integration expenses during the three and six month periods ended June 30, 2018 related to the completion of this acquisition (see Note 10). Pro forma financial information for Broadview has not been presented because the effects of this acquisition were not material to our consolidated results of operations.
22
NOTES TO UNAUDITED INTERIM CONSOLIDATED FINANCIAL STATEMENTS
____
3. Acquisitions, Continued:
EarthLink Holdings Corp.
On February 27, 2017, Windstream Holdings completed its merger with EarthLink Holdings Corp. (“EarthLink”), pursuant to the terms of the Agreement and Plan of Merger (the “Merger Agreement”) dated November 5, 2016, whereby EarthLink merged into Europa Merger Sub, Inc., an wholly-owned subsidiary of Windstream Services, LLC, and survived, and immediately following, merged with Europa Merger Sub, LLC, a wholly-owned subsidiary of Windstream Services, LLC, with Merger Sub surviving and changing its name to EarthLink Holdings, LLC (the “Merger”). EarthLink Holdings, LLC is a direct, wholly-owned subsidiary of Windstream Services and provides data, voice and managed network services to retail and wholesale business customers and nationwide Internet access and related value-added services to residential customers. In the Merger, we added approximately 700,000 customers and approximately 16,000 incremental route fiber miles, which expanded our national footprint to approximately 150,000 fiber route miles and enhanced our ability to offer customers expanded products, services and enhanced enterprise solutions. We also expect to achieve operating expense and capital expenditure synergies in integrating the acquired operations. Pursuant to the terms of the Merger Agreement, each share of EarthLink common stock was exchanged, on a post-reverse stock split basis, for .1636 of Windstream Holdings common stock. No fractional shares were issued in the Merger, with a cash payment being made in lieu of fractional shares. Employee restricted stock units issued by EarthLink that were outstanding as of the merger date were exchanged for an equivalent number of Windstream Holdings restricted stock units based on the same exchange ratio of EarthLink common stock to Windstream Holdings common stock. The replacement restricted stock units remain subject to the vesting and other terms and conditions prescribed by the EarthLink equity plans that were assumed by us in the Merger. In the aggregate, on a post-reverse stock split basis,Windstream Holdings issued 17.6 million shares of its common stock and 1.0 million of replacement equity awards. Windstream also assumed $435.3 million aggregate principal amount of EarthLink’s long-term debt, which we refinanced, as further discussed in Note 5. The Merger qualifies as a tax-free reorganization for U.S. federal income tax purposes and is valued at approximately $1.1 billion.
The results of EarthLink’s operations are included in our consolidated results of operations beginning on February 27, 2017. For the three and six month periods ended June 30, 2017, our consolidated results of operations include revenues and sales of $225.0 million and $307.1 million and operating income of $6.8 million and $4.0 million attributable to EarthLink. We incurred $6.6 million and $11.0 million of merger and integration expenses during the three and six month periods ended June 30, 2018, respectively, as compared to $13.4 million and $66.5 million for the same period in 2017 related to the completion of the Merger (see Note 10).
The following unaudited pro forma consolidated results of operations of Windstream for the three and six month periods ended June 30, 2017 assume that the Merger occurred as of January 1, 2016:
(Millions) | Three Months Ended June 30, 2017 | Six Months Ended June 30, 2017 | ||||||||||
Revenues and sales | $ | 1,491.6 | $ | 3,006.8 | ||||||||
Operating income | $ | 104.3 | $ | 168.5 | ||||||||
Net loss | $ | (70.4 | ) | $ | (168.1 | ) | ||||||
Loss per share | ($1.89 | ) | ($4.57 | ) | ||||||||
The pro forma information presents our historical results of operations adjusted to include EarthLink, with the results prior to the merger closing date adjusted to include the pro forma effect of the elimination of transactions between Windstream and EarthLink, the adjustment to revenues and sales to change EarthLink’s reporting of USF fees billed to customers and the related payments from a net basis to a gross basis to conform to Windstream’s reporting of such customer billings, the adjustment to depreciation and amortization expense associated with the estimated acquired fair value of property, plant and equipment and intangible assets, the adjustment to interest expense to reflect the refinancing of EarthLink’s long-term debt obligations, the impact of merger expenses related to the acquisition and the related income tax effects of the pro forma adjustments.
The pro forma results are presented for illustrative purposes only and do not reflect either the realization of potential cost savings or any additional integration costs. These pro forma results do not purport to be indicative of the results that would have been obtained if the Merger had occurred as of the date indicated, nor do the pro forma results intend to be a projection of results that may be obtained in the future.
23
NOTES TO UNAUDITED INTERIM CONSOLIDATED FINANCIAL STATEMENTS
____
4. Goodwill and Other Intangible Assets:
Goodwill represents the excess of cost over the fair value of net identifiable tangible and intangible assets acquired through various business combinations. The cost of acquired entities at the date of the acquisition is allocated to identifiable assets and liabilities, and the excess of the total purchase price over the amounts assigned to net identifiable assets has been recorded as goodwill.
Changes in the carrying amount of goodwill were as follows:
(Millions) | |||
Balance at December 31, 2017: | |||
Goodwill | $ | 4,683.2 | |
Accumulated impairment loss | (1,840.8 | ) | |
Balance at December 31, 2017, net | 2,842.4 | ||
Changes during the period: | |||
Broadview measurement period adjustments | (0.7 | ) | |
MASS acquisition | 32.2 | ||
Balance at June 30, 2018: | |||
Goodwill | 4,714.7 | ||
Accumulated impairment loss | (1,840.8 | ) | |
Balance at June 30, 2018, net | $ | 2,873.9 | |
Goodwill assigned to our operating segments and changes in the carrying amount of goodwill by reportable segment were as follows:
(Millions) | Consumer & Small Business | Enterprise | Wholesale | Consumer CLEC | Total | |||||||||||||||
Balance at December 31, 2017: | ||||||||||||||||||||
Goodwill | $ | 2,321.2 | $ | 961.8 | $ | 1,297.1 | $ | 103.1 | $ | 4,683.2 | ||||||||||
Accumulated impairment loss | (1,417.8 | ) | — | (423.0 | ) | — | (1,840.8 | ) | ||||||||||||
Balance at December 31, 2017, net | 903.4 | 961.8 | 874.1 | 103.1 | 2,842.4 | |||||||||||||||
Changes during the period: | ||||||||||||||||||||
Broadview measurement period adjustments | — | (0.7 | ) | — | — | (0.7 | ) | |||||||||||||
MASS acquisition | — | 32.2 | — | — | 32.2 | |||||||||||||||
Balance at June 30, 2018: | ||||||||||||||||||||
Goodwill | 2,321.2 | 993.3 | 1,297.1 | 103.1 | 4,714.7 | |||||||||||||||
Accumulated impairment loss | (1,417.8 | ) | — | (423.0 | ) | — | (1,840.8 | ) | ||||||||||||
Balance at June 30, 2018, net | $ | 903.4 | $ | 993.3 | $ | 874.1 | $ | 103.1 | $ | 2,873.9 | ||||||||||
24
NOTES TO UNAUDITED INTERIM CONSOLIDATED FINANCIAL STATEMENTS
____
4. Goodwill and Other Intangible Assets, Continued:
Intangible assets were as follows at:
June 30, 2018 | December 31, 2017 | |||||||||||||||||||||||
(Millions) | Gross Cost | Accumulated Amortization | Net Carrying Value | Gross Cost | Accumulated Amortization | Net Carrying Value | ||||||||||||||||||
Franchise rights | $ | 1,285.1 | $ | (393.2 | ) | $ | 891.9 | $ | 1,285.1 | $ | (371.8 | ) | $ | 913.3 | ||||||||||
Customer lists | 2,114.6 | (1,711.5 | ) | 403.1 | 2,104.6 | (1,626.6 | ) | 478.0 | ||||||||||||||||
Cable franchise rights | 17.3 | (9.7 | ) | 7.6 | 17.3 | (9.1 | ) | 8.2 | ||||||||||||||||
Trade names | 29.0 | (4.3 | ) | 24.7 | 29.0 | (2.2 | ) | 26.8 | ||||||||||||||||
Developed technology and software | 33.0 | (12.0 | ) | 21.0 | 33.0 | (7.1 | ) | 25.9 | ||||||||||||||||
Patents | 10.7 | (9.6 | ) | 1.1 | 10.6 | (8.4 | ) | 2.2 | ||||||||||||||||
Balance | $ | 3,489.7 | $ | (2,140.3 | ) | $ | 1,349.4 | $ | 3,479.6 | $ | (2,025.2 | ) | $ | 1,454.4 | ||||||||||
Intangible asset amortization methodology and useful lives were as follows as of June 30, 2018:
Intangible Assets | Amortization Methodology | Estimated Useful Life | ||
Franchise rights | straight-line | 30 years | ||
Customer lists | sum of years digits | 5.5 - 15 years | ||
Cable franchise rights | straight-line | 15 years | ||
Trade names | straight-line | 1-10 years | ||
Developed technology and software | straight-line | 3-5 years | ||
Patents | straight-line | 3 years | ||
Amortization expense for intangible assets subject to amortization was $56.6 million and $115.1 million for the three and six month periods ended June 30, 2018, respectively, as compared to $63.9 million and $112.7 million for the same periods in 2017. Amortization expense for intangible assets subject to amortization was estimated to be as follows for each of the five years ended December 31:
Year | (Millions) | ||
2018 | $ | 225.1 | |
2019 | $ | 181.8 | |
2020 | $ | 140.6 | |
2021 | $ | 105.0 | |
2022 | $ | 73.2 | |
25
NOTES TO UNAUDITED INTERIM CONSOLIDATED FINANCIAL STATEMENTS
____
5. Long-term Debt:
Windstream Holdings has no debt obligations. All debt, including the senior secured credit facility described below, have been incurred by Windstream Services and its subsidiaries. Windstream Holdings is neither a guarantor of nor subject to the restrictive covenants imposed by such debt.
Long-term debt was as follows at:
(Millions) | June 30, 2018 | December 31, 2017 | ||||||
Issued by Windstream Services: | ||||||||
Senior secured credit facility, Tranche B6 – variable rates, due March 29, 2021 (a) | $ | 1,186.6 | $ | 1,192.6 | ||||
Senior secured credit facility, Tranche B7 – variable rates, due February 17, 2024 | 571.3 | 574.2 | ||||||
Senior secured credit facility, Revolving line of credit – variable rates, due April 24, 2020 | 975.0 | 775.0 | ||||||
Senior First Lien Notes – 8.625%, due October 31, 2025 (b) (d) | 600.0 | 600.0 | ||||||
Debentures and notes, without collateral: | ||||||||
2020 Notes – 7.750%, due October 15, 2020 (d) | 492.9 | 492.9 | ||||||
2021 Notes – 7.750%, due October 1, 2021 (d) | 88.9 | 88.9 | ||||||
2022 Notes – 7.500%, due June 1, 2022 (d) | 41.6 | 41.6 | ||||||
2023 Notes – 7.500%, due April 1, 2023 (d) | 120.4 | 120.4 | ||||||
2023 Notes – 6.375%, due August 1, 2023 (d) | 1,147.6 | 1,147.6 | ||||||
2024 Notes – 8.750%, due December 15, 2024 (d) | 684.3 | 834.3 | ||||||
Issued by subsidiaries of Windstream Services: | ||||||||
Windstream Holdings of the Midwest, Inc. – 6.75%, due April 1, 2028 (c) (d) | 100.0 | 100.0 | ||||||
Net discount on long-term debt (e) | (57.5 | ) | (61.6 | ) | ||||
Unamortized debt issuance costs (e) | (65.3 | ) | (62.0 | ) | ||||
5,885.8 | 5,843.9 | |||||||
Less current maturities | (17.9 | ) | (169.3 | ) | ||||
Total long-term debt | $ | 5,867.9 | $ | 5,674.6 | ||||
(a) | If the maturity of the revolving line of credit is not extended prior to April 24, 2020, the maturity date of the Tranche B6 term loan will be April 24, 2020; provided further, if the 2020 Notes have not been repaid or refinanced prior to July 15, 2020 with indebtedness having a maturity date no earlier than March 29, 2021, the maturity date of the Tranche B6 term loan will be July 15, 2020. |
(b) | The notes are guaranteed by each of our domestic subsidiaries that guarantees debt under Windstream Services’ senior secured credit facility. The notes and the guarantees are secured by a first priority lien on Windstream Services’ and the guarantors’ assets that secure the obligations under the senior secured credit facility. |
(c) | These bonds are secured equally with the senior secured credit facility with respect to the assets of Windstream Holdings of the Midwest, Inc. |
(d) | Windstream Services may call the remaining aggregate principal amounts of these debentures and notes at various premiums upon early redemption. |
(e) | The net discount balance and unamortized debt issuance costs are amortized using the interest method over the life of the related debt instrument. |
26
NOTES TO UNAUDITED INTERIM CONSOLIDATED FINANCIAL STATEMENTS
____
5. Long-term Debt, Continued:
Senior Secured Credit Facility - The amended credit facility provides that Windstream Services may seek to obtain incremental revolving or term loans in an unlimited amount subject to maintaining a maximum secured leverage ratio and other customary conditions, including obtaining commitments and pro forma compliance with financial maintenance covenants consisting of a maximum debt to consolidated earnings before interest, taxes, depreciation and amortization (“EBITDA”) ratio and a minimum interest coverage ratio. In addition, Windstream Services may request extensions of the maturity date under any of its existing revolving or term loan facilities. On February 17, 2017, Windstream Services issued an aggregate principal amount of $580.0 million in borrowings under Tranche B7 of its senior secured credit facility, the proceeds of which were used to pay down amounts outstanding under Tranche B5, including accrued interest, and to pay related fees and expenses. The incremental Tranche B7 term loan matures on February 17, 2024 and was issued at a price of 99.5 percent of the principal amount of the loan.
Interest rates applicable to the Tranche B7 term loan are, at Windstream Services’ option, equal to either a base rate plus a margin of 2.25 percent per annum or LIBOR plus a margin of 3.25 percent per annum. LIBOR for the Tranche B7 term loan shall at no time be less than 0.75 percent. The Tranche B7 term loan is subject to quarterly amortization payments in an aggregate amount equal to 0.25 percent of the initial principal amount of such term loans, with the remaining balance payable at maturity. At the time of repayment, unamortized debt issuance and discount related to Tranche B5 totaled $6.3 million, of which $1.2 million were included in the loss on debt extinguishment, while the remaining $5.1 million continue to be deferred and amortized to interest expense over the remaining life of Tranche B7 in accordance with debt modification accounting. On the date of closing of the merger with EarthLink, Windstream Services amended its existing senior secured credit agreement to provide for the issuance of an aggregate principal amount of $450.0 million in incremental borrowings under Tranche B6, the proceeds of which were used to repay amounts outstanding under EarthLink’s credit facility and to redeem EarthLink’s outstanding 8.875 percent Senior Notes due 2019 and 7.375 percent Senior Secured Notes due 2020. The incremental loans were issued at a price of 99.0 percent of the principal amount of the loan. The incremental loans are repayable at any time.
Revolving line of credit - Under the amended senior secured credit facility, Windstream Services may obtain revolving loans and may issue up to $50.0 million of letters of credit, which upon issuance reduce the amount available for other extensions of credit. Accordingly, the total amount outstanding under the letters of credit and the indebtedness incurred under the revolving line of credit may not exceed $1,250.0 million. Borrowings under the revolving line of credit may be used for permitted acquisitions, working capital and other general corporate purposes of Windstream Services and its subsidiaries. Windstream Services will pay a commitment fee on the unused portion of the commitments under the revolving credit facility that will range from 0.40 percent to 0.50 percent per annum, depending on the debt to consolidated EBITDA ratio of Windstream Services and its subsidiaries. Revolving loans made under the credit facility are not subject to interim amortization and such loans are not required to be repaid prior to April 24, 2020, other than to the extent the outstanding borrowings exceed the aggregate commitments under the revolving credit facility. Interest rates applicable to loans under the revolving line of credit are, at Windstream Services’ option, equal to either a base rate plus a margin ranging from 0.25 percent to 1.00 percent per annum or LIBOR plus a margin ranging from 1.25 percent to 2.00 percent per annum, based on the debt to consolidated EBITDA ratio of Windstream Services and its subsidiaries.
During the first six months of 2018, Windstream Services borrowed $450.0 million under the revolving line of credit in its senior secured credit facility and retired $250.0 million of these borrowings through June 30, 2018. Borrowings under the revolving line of credit include $150.0 million for the one-time mandatory redemption payment applicable to the 2024 Notes paid on February 26, 2018. Considering letters of credit of $23.4 million, the amount available for borrowing under the revolving line of credit was $251.6 million at June 30, 2018.
During the first six months of 2018, the variable interest rate on the revolving line of credit ranged from 3.70 percent to 6.00 percent, and the weighted average rate on amounts outstanding was 3.94 percent during the period. Comparatively, the variable interest rate ranged from 2.65 percent to 5.25 percent during the first six months of 2017, with a weighted average rate on amounts outstanding during the period of 2.95 percent.
27
NOTES TO UNAUDITED INTERIM CONSOLIDATED FINANCIAL STATEMENTS
____
5. Long-term Debt, Continued:
Consent Solicitation and Amendments to 2025 Notes and Senior Secured Credit Facility
During the second quarter of 2018, Windstream Services and Windstream Finance Corp. (together the “issuers”) received the requisite consents to amend the indenture governing the 8.625 percent senior first lien notes due October 31, 2025 (“2025 Notes”). Holders of the 2025 Notes who validly delivered (and did not validly revoke) consents to the amendments to the indenture received a one-time consent payment equal to $2.50 per $1,000 principal amount of 2025 Notes provided that such consent was received prior to the expiration of the consent solicitation on June 6, 2018. The purpose of the consent solicitation was (i) to permit the issuers and guarantors under the indenture to issue or incur indebtedness on a junior lien basis (which indebtedness is currently permitted by the indenture to be incurred on a first-priority lien basis) and (ii) to authorize the collateral agent under the indenture to enter into a junior lien intercreditor agreement upon the issuance or incurrence of junior lien secured indebtedness by the issuers and the guarantors under the indenture. In conjunction with receiving the requisite consents, the amendments to the indenture became effective and operative. All holders of the 2025 Notes are bound by the terms thereof, even if they did not deliver consents to the amendments. Except for the amendments, all existing terms of the 2025 Notes and the Indenture remain unchanged.
Concurrent with the consent solicitation, Windstream Services also sought and obtained an amendment to its senior secured credit facility to, among other things, (i) permit the issuance or incurrence of second-priority lien secured indebtedness, (ii) allow Windstream Services to use the proceeds from the issuance or incurrence of such second-priority lien secured indebtedness and other secured indebtedness to repay certain of its outstanding secured and unsecured indebtedness, (iii) permit the execution of a first-lien/second-lien intercreditor agreement, (iv) allow for the incurrence of first-priority lien secured indebtedness if the proceeds of such indebtedness are used to prepay or repay revolving loans or term loans under the senior secured credit facility (and, for revolving loans, permanently reduce the commitments), even if Windstream Services does not meet the typical test of having a pro forma first lien leverage ratio of not more than 2.25 to 1.0, and (v) limit the ability of Windstream Services to declare and pay dividends in some respects.
In completing the consent solicitation and amendments, Windstream Services incurred $11.5 million in fees, consisting of $8.8 million in consent fees payable to lenders and $2.7 million in arrangement, legal and other third-party fees. In accordance with debt modification accounting, the $2.7 million in arrangement, legal and other third-party fees were expensed as additional interest expense and the $8.8 million in consent fees were capitalized as debt issuance costs and amortized over the respective terms of the 2025 Notes and senior secured credit facility.
Net Loss on Early Extinguishment of Debt
The net loss on early extinguishment of debt was as follows for the six months ended June 30, 2017:
(Millions) | ||||||||||
EarthLink 2019 and 2020 Notes: | ||||||||||
Premium on early redemption | $ | (18.3 | ) | |||||||
Unamortized premium recorded in the Merger | 16.3 | |||||||||
Loss on early extinguishment of EarthLink 2019 and 2020 Notes | (2.0 | ) | ||||||||
Senior secured credit facility: | ||||||||||
Unamortized discount on original issuance | (0.3 | ) | ||||||||
Unamortized debt issuance costs on original issuance | (0.9 | ) | ||||||||
Loss on early extinguishment of senior secured credit facility | (1.2 | ) | ||||||||
Net loss on early extinguishment of debt | $ | (3.2 | ) | |||||||
28
NOTES TO UNAUDITED INTERIM CONSOLIDATED FINANCIAL STATEMENTS
____
5. Long-term Debt, Continued:
Maturities for long-term debt outstanding as of June 30, 2018, excluding $57.5 million of unamortized net discount and $65.3 million of unamortized debt issuance costs, were as follows:
Twelve-month period ended: | (Millions) | ||
June 30, 2019 | $ | 17.9 | |
June 30, 2020 | 992.9 | ||
June 30, 2021 | 1,661.2 | ||
June 30, 2022 | 136.3 | ||
June 30, 2023 | 126.1 | ||
Thereafter | 3,074.2 | ||
Total | $ | 6,008.6 | |
Interest Expense
Interest expense was as follows:
Three Months Ended June 30, | Six Months Ended June 30, | ||||||||||||||||
(Millions) | 2018 | 2017 | 2018 | 2017 | |||||||||||||
Interest expense - long-term debt | $ | 105.7 | $ | 88.4 | $ | 207.6 | $ | 174.3 | |||||||||
Interest expense - long-term lease obligations: | |||||||||||||||||
Telecommunications network assets | 117.4 | 121.7 | 235.9 | 244.5 | |||||||||||||
Real estate contributed to pension plan | 1.6 | 1.6 | 3.1 | 3.1 | |||||||||||||
Impact of interest rate swaps | (0.6 | ) | 3.2 | — | 6.0 | ||||||||||||
Interest on capital leases and other | 1.0 | 1.3 | 2.5 | 2.4 | |||||||||||||
Less capitalized interest expense | (0.7 | ) | (1.8 | ) | (1.6 | ) | (4.1 | ) | |||||||||
Total interest expense | $ | 224.4 | $ | 214.4 | $ | 447.5 | $ | 426.2 | |||||||||
Debt Compliance
The terms of Windstream Services’ credit facility and indentures include customary covenants that, among other things, require maintenance of certain financial ratios and restrict Windstream Services’ ability to incur additional indebtedness. These financial ratios include a maximum leverage ratio of 4.5 to 1.0 and a minimum interest coverage ratio of 2.75 to 1.0. In addition, the covenants include restrictions on dividend and certain other types of payments, including restricted payments to Windstream Holdings by Windstream Services. As of June 30, 2018, Windstream Services was in compliance with all of these covenants.
In addition, certain of Windstream Services’ debt agreements contain various covenants and restrictions specific to the subsidiary that is the legal counterparty to the agreement. The 2024 Notes include certain provisions that prohibit Windstream Services’ ability to issue restricted payments to Windstream Holdings, if its consolidated leverage ratio, as defined in the 2024 Notes, exceeds 3.50 to 1.0, except for purposes of allowing restricted payments to Windstream Holdings for the purposes of making rent payments under the master lease with Uniti and to pay certain administrative expenses. Under Windstream Services’ long-term debt agreements, acceleration of principal payments would occur upon payment default, violation of debt covenants not cured within 30 days, a change in control including a person or group obtaining 50 percent or more ownership interest in Windstream Services subject to meeting additional conditions, or breach of certain other conditions set forth in the borrowing agreements. Windstream Services and its subsidiaries were in compliance with these covenants as of June 30, 2018.
29
NOTES TO UNAUDITED INTERIM CONSOLIDATED FINANCIAL STATEMENTS
____
5. Long-term Debt, Continued:
As further discussed in Note 15, on September 22, 2017, Windstream Services received a purported notice of default dated September 21, 2017 (the “Original Notice”) from a noteholder that claims to hold greater than 25 percent in aggregate principal amount of the 6.375 percent 2023 Notes issued under the indenture dated January 23, 2013 (as amended and supplemented, the “2013 Indenture”), between Windstream Services, as issuer, Windstream Finance Corp., as co-issuer, the guarantors party thereto and U.S. Bank National Association, as trustee (the “Trustee”). The Original Notice alleged that the transfer of certain assets and the subsequent lease of those assets in connection with the spin-off of Uniti in April 2015 constituted a “sale and leaseback transaction” (as defined in the 2013 Indenture) which did not comply with the Sale and Leaseback covenant under the 2013 Indenture. The Original Notice further alleged that Windstream Services violated the restricted payment covenant under the 2013 Indenture by not delivering an officers’ certificate as required by the 2013 Indenture and that it made a restricted payment in reliance on the restricted payment builder basket during the pendency of an alleged default which is prohibited by the 2013 Indenture.
On November 6, 2017, Windstream Services completed an exchange of certain of its existing senior notes for additional 6.375 percent 2023 Notes and received consents from holders representing a majority of the outstanding aggregate principal amount of the 6.375 percent 2023 Notes to certain waivers and amendments relating to the defaults alleged in the Original Notice (the “Exchange and Consent Transactions”). On November 6, 2017, Windstream Services, the co-issuer, the guarantors party thereto and the Trustee executed a supplemental indenture to the 2013 Indenture giving effect to such waivers and amendments.
Additionally during the fourth quarter of 2017, Windstream Services completed consent solicitations with respect to its 2020 Notes, 2021 Notes, 2022 Notes, April 2023 Notes and the existing 6.375 percent 2023 Notes (collectively “the Windstream Services Notes”), pursuant to which noteholders agreed to waive alleged defaults with respect to the transactions related to the spin-off of Uniti and amend the indentures governing the Windstream Services Notes to give effect to such waivers and amendments. Windstream Services received such consents from the holders representing a majority of the outstanding aggregate principal amount of the Windstream Services Notes. Windstream Services, the trustee under the indentures governing the Windstream Services Notes and the other parties to such indentures executed supplemental indentures giving effect to the waivers and amendments pursuant to the consent solicitation. The waivers and amendments are now effective and operative and, as such, are binding on all holders of the Windstream Services Notes. Consent delivered pursuant to the consent solicitations may not be revoked. As a result of the debt exchanges and the consent transactions, Windstream Services has been, and remains, in compliance with all of the covenants under the 2013 Indenture.
6. Derivatives:
Windstream Services enters into interest rate swap agreements to mitigate the interest rate risk inherent in its variable rate senior secured credit facility. Derivative instruments are accounted for in accordance with authoritative guidance for recognition, measurement and disclosures about derivative instruments and hedging activities, including when a derivative or other financial instrument can be designated as a hedge. This guidance requires recognition of all derivative instruments at fair value, and accounting for the changes in fair value depends on whether the derivative has been designated as, qualifies as and is effective as a hedge.
Windstream Services does not use derivatives for trading or speculative purposes and currently does not have any derivatives that are not designated as hedges. For our derivatives which have been designated and qualify as cash flow hedges of interest rate risk, the gain or loss on the derivative is recorded in accumulated other comprehensive income and subsequently reclassified into interest expense in the same periods during which the hedged transaction affects earnings. Amounts reported in accumulated other comprehensive income related to derivatives will be reclassified to interest expense as interest payments are made on Windstream Services’ variable-rate debt.
Windstream Services is party to six pay fixed, receive variable interest rate swap agreements. Windstream Services has designated each of the six swaps as cash flow hedges of the interest rate risk inherent in borrowings outstanding under its senior secured credit facility due to changes in the LIBOR benchmark interest rate. The variable rate received on the six swaps is based on one-month LIBOR and resets on the seventeenth day of each month. All of the interest rate swap agreements mature on October 17, 2021. Three of the interest rate swaps are off-market swaps, meaning they contain an embedded financing element, which the swap counterparties recover through an incremental charge in the fixed rate over what would be charged for an at-market swap. As such, a portion of the cash payment on the swaps represents the rate that Windstream Services would pay on a hypothetical at-market interest rate swap and is recognized in interest expense. The remaining portion represents the repayment of the embedded financing element and reduces the initial swap liability. These three swaps have a total notional value of $675.0 million and the average fixed interest rate paid is 2.984 percent. The fourth interest rate swap agreement has a notional value of $200.0 million and the fixed interest rate paid is 1.1275 percent. The remaining two interest rate swap agreements have a total notional value of $500.0 million and the fixed interest rate paid is 1.8812 percent.
30
NOTES TO UNAUDITED INTERIM CONSOLIDATED FINANCIAL STATEMENTS
____
6. Derivatives, Continued:
All of the swaps are hedging probable variable cash flows which extend up to one year beyond the maturity of certain components of Windstream Services’ variable rate debt. Consistent with past practice, Windstream Services expects to extend or otherwise replace these components of its debt with variable rate debt.
As a result of previous refinancing transactions, Windstream Services de-designated certain interest rate swaps and froze the accumulated net gains and losses in accumulated other comprehensive income related to those swaps. The frozen balance is amortized from accumulated other comprehensive income to interest expense over the remaining life of the original swaps.
All derivative instruments are recognized at fair value in the accompanying consolidated balance sheets as either assets or liabilities, depending on the rights or obligations under the related contracts.
Set forth below is information related to interest rate swap agreements:
(Millions, except for percentages) | June 30, 2018 | December 31, 2017 | ||||||
Designated portion, measured at fair value: | ||||||||
Other current assets | $ | 4.8 | $ | 1.2 | ||||
Other assets | $ | 19.3 | $ | 10.6 | ||||
Other current liabilities | $ | 3.7 | $ | 7.8 | ||||
Other non-current liabilities | $ | 1.6 | $ | 10.5 | ||||
Accumulated other comprehensive income | $ | 55.6 | $ | 33.7 | ||||
De-designated portion, unamortized value: | ||||||||
Accumulated other comprehensive income | $ | (3.7 | ) | $ | (5.4 | ) | ||
Weighted average fixed rate paid | 0.23 | % | 0.82 | % | ||||
Variable rate received | 2.09 | % | 1.49 | % | ||||
Prior to the adoption of ASU 2017-12, effective as of January 1, 2018, derivatives were assessed for effectiveness each quarter and any ineffectiveness was recognized in other income, net in our consolidated statements of operations. There was $(0.1) million ineffectiveness recognized on the cash flow hedges for both the three and six month periods ended June 30, 2017.
All or a portion of the change in fair value of Windstream Services’ interest rate swap agreements recorded in accumulated other comprehensive income may be recognized in earnings in certain situations. If Windstream Services extinguishes all of its variable rate debt, or a portion of its variable rate debt such that the variable rate interest received on the swaps exceeds the variable rate interest paid on its debt, all or a portion of the change in fair value of the swaps may be recognized in earnings. In addition, the change in fair value of the swaps may be recognized in earnings if Windstream Services determines it is no longer probable that it will have future variable rate cash flows to hedge against or if a swap agreement is terminated prior to maturity. Windstream Services has assessed the counterparty risk and determined that no substantial risk of default exists as of June 30, 2018. Each counterparty is a bank with a current credit rating at or above A, as determined by Moody’s Investors Service, Standard & Poor’s Corporation and Fitch Ratings.
Windstream Services expects to recognize net gains of $7.7 million, net of taxes, in interest expense in the next twelve months related to the unamortized value of the de-designated portion of interest rate swap agreements and the interest settlements for its six interest swap agreements at June 30, 2018. Payments on the swaps are presented in the financing activities section of the accompanying consolidated statements of cash flows due to the embedded financing element discussed above.
Changes in derivative instruments were as follows for the six month periods ended June 30:
(Millions) | 2018 | 2017 | ||||||
Changes in fair value, net of tax (a) | $ | 14.7 | $ | (1.2 | ) | |||
Amortization of net unrealized losses on de-designated interest rate swaps, net of tax (a) | $ | 1.2 | $ | 1.8 | ||||
(a) | Included as a component of other comprehensive income (loss) and will be reclassified into earnings as the hedged transaction affects earnings. For 2017, this amount reflects only the effective portion of the change in fair value of the cash flow hedges. |
31
NOTES TO UNAUDITED INTERIM CONSOLIDATED FINANCIAL STATEMENTS
____
6. Derivatives, Continued:
The agreements with each of the derivative counterparties contain cross-default provisions, whereby if Windstream Services were to default on certain indebtedness, it could also be declared in default on its derivative obligations and may be required to net settle any outstanding derivative liability positions with its counterparties at the swap termination value of $6.0 million including accrued interest and excluding the credit valuation adjustment to measure non-performance risk. In addition, certain of the agreements with the counterparties contain provisions where if a specified event or condition, such as a merger, occurs that materially changes Windstream Services’ creditworthiness in an adverse manner, Windstream Services may be required to fully collateralize its derivative obligations. At June 30, 2018, Windstream Services had not posted any collateral related to its interest rate swap agreements.
Balance Sheet Offsetting
Windstream Services is party to master netting arrangements, which are designed to reduce credit risk by permitting net settlement of transactions with counterparties. For financial statement presentation purposes, Windstream Services does not offset assets and liabilities under these arrangements.
The following tables presents the assets and liabilities subject to an enforceable master netting arrangement as of June 30, 2018 and December 31, 2017. Information pertaining to derivative assets was as follows:
Gross Amounts Not Offset in the Consolidated Balance Sheets | |||||||||||||||||||
(Millions) | Gross Amount of Recognized Assets | Net Amount of Assets presented in the Consolidated Balance Sheets | Financial Instruments | Cash Collateral Received | Net Amount | ||||||||||||||
June 30, 2018: | |||||||||||||||||||
Interest rate swaps | $ | 24.1 | $ | 24.1 | $ | (3.4 | ) | $ | — | $ | 20.7 | ||||||||
December 31, 2017: | |||||||||||||||||||
Interest rate swaps | $ | 11.8 | $ | 11.8 | $ | (2.9 | ) | $ | — | $ | 8.9 | ||||||||
Information pertaining to derivative liabilities was as follows:
Gross Amounts Not Offset in the Consolidated Balance Sheets | |||||||||||||||||||
(Millions) | Gross Amount of Recognized Liabilities | Net Amount of Liabilities Presented in the Consolidated Balance Sheets | Financial Instruments | Cash Collateral Received | Net Amount | ||||||||||||||
June 30, 2018: | |||||||||||||||||||
Interest rate swaps | $ | 5.3 | $ | 5.3 | $ | (3.4 | ) | $ | — | $ | 1.9 | ||||||||
December 31, 2017: | |||||||||||||||||||
Interest rate swaps | $ | 18.3 | $ | 18.3 | $ | (2.9 | ) | $ | — | $ | 15.4 | ||||||||
32
NOTES TO UNAUDITED INTERIM CONSOLIDATED FINANCIAL STATEMENTS
____
7. Fair Value Measurements:
Fair value of financial and non-financial assets and liabilities is defined as an exit price, representing the amount that would be received to sell an asset or transfer a liability in an orderly transaction between market participants. Authoritative guidance defines the following three tier hierarchy for assessing the inputs used in fair value measurements:
Level 1 – Quoted prices in active markets for identical assets or liabilities
Level 2 – Observable inputs other than quoted prices in active markets for identical assets or liabilities
Level 3 – Unobservable inputs
The highest priority is given to unadjusted quoted prices in active markets for identical assets or liabilities (level 1 measurement) and the lowest priority is given to unobservable inputs (level 3 measurement). Assets and liabilities are classified in their entirety based on the lowest level of input that is significant to the fair value measurement. Our assessment of the significance of a particular input to the fair value measurement requires judgment and may affect the determination of fair value of assets and liabilities and their placement within the fair value hierarchy levels.
Our non-financial assets and liabilities, including property, plant and equipment, goodwill, intangible assets and asset retirement obligations, are measured at fair value on a non-recurring basis. No event occurred during the six-month period ended June 30, 2018 requiring our non-financial assets and liabilities to be subsequently recognized at fair value. Our financial instruments consist primarily of cash and cash equivalents, accounts receivable, accounts payable, long-term debt and interest rate swaps. The carrying amount of cash, accounts receivable and accounts payable was estimated by management to approximate fair value due to the relatively short period of time to maturity for those instruments. Cash equivalents, long-term debt and interest rate swaps are measured at fair value on a recurring basis. Cash equivalents were not significant as of June 30, 2018 or December 31, 2017.
The fair values of interest rate swaps and long-term debt were determined using the following inputs at:
(Millions) | June 30, 2018 | December 31, 2017 | ||||||
Recorded at Fair Value in the Financial Statements: | ||||||||
Derivatives - Interest rate swap assets - Level 2 | $ | 24.1 | $ | 11.8 | ||||
Derivatives - Interest rate swap liabilities - Level 2 | $ | 5.3 | $ | 18.3 | ||||
Not Recorded at Fair Value in the Financial Statements: (a) | ||||||||
Long-term debt, including current maturities - Level 2 | $ | 4,908.2 | $ | 4,824.2 | ||||
(a) | Recognized at carrying value of $5,951.1 million and $5,905.9 million in long-term debt, including current maturities, and excluding unamortized debt issuance costs, in the accompanying consolidated balance sheets as of June 30, 2018 and December 31, 2017, respectively. |
The fair values of interest rate swaps are determined based on the present value of expected future cash flows using observable, quoted LIBOR swap rates for the full term of the swaps and also incorporate credit valuation adjustments to appropriately reflect both Windstream Services’ own non-performance risk and non-performance risk of the respective counterparties. As of June 30, 2018 and December 31, 2017, the fair values of the interest rate swaps were reduced by $0.9 million and $4.8 million, respectively, to reflect non-performance risk.
In calculating the fair value of Windstream Services’ long-term debt, the fair value of the debentures and notes was calculated based on quoted market prices of the specific issuances in an active market when available. The fair value of the other debt obligations was estimated based on appropriate market interest rates applied to the debt instruments. In calculating the fair value of the Windstream Holdings of the Midwest, Inc. notes, an appropriate market price of similar instruments in an active market considering credit quality, nonperformance risk and maturity of the instrument was used.
We do not have any assets or liabilities measured for purposes of the fair value hierarchy at fair value using significant unobservable inputs (Level 3). We recognize transfers between levels of the fair value hierarchy as of the end of the reporting period. There were no transfers within the fair value hierarchy during the six-month period ended June 30, 2018.
33
NOTES TO UNAUDITED INTERIM CONSOLIDATED FINANCIAL STATEMENTS
____
8. Employee Benefit Plans and Postretirement Benefits:
We maintain a non-contributory qualified defined benefit pension plan. Future benefit accruals for all eligible nonbargaining employees covered by the pension plan have ceased. We also maintain supplemental executive retirement plans that provide unfunded, non-qualified supplemental retirement benefits to a select group of management employees. Additionally, we provide postretirement healthcare and life insurance benefits for eligible employees. Employees share in, and we fund, the costs of these plans as benefits are paid.
The components of pension benefit (income) expense, including provision for executive retirement agreements, were as follows:
Three Months Ended June 30, | Six Months Ended June 30, | |||||||||||||||
(Millions) | 2018 | 2017 | 2018 | 2017 | ||||||||||||
Benefits earned during the period (a) | $ | 1.0 | $ | 2.0 | $ | 1.9 | $ | 4.1 | ||||||||
Interest cost on benefit obligation (b) | 10.4 | 11.5 | 20.6 | 23.1 | ||||||||||||
Net actuarial gain | (5.6 | ) | (2.3 | ) | (5.6 | ) | (2.3 | ) | ||||||||
Amortization of prior service credit (b) | (1.2 | ) | (0.1 | ) | (2.4 | ) | (0.2 | ) | ||||||||
Expected return on plan assets (b) | (14.0 | ) | (13.6 | ) | (28.3 | ) | (27.2 | ) | ||||||||
Curtailment gain (b) | (2.7 | ) | — | (2.7 | ) | — | ||||||||||
Net periodic benefit income | $ | (12.1 | ) | $ | (2.5 | ) | $ | (16.5 | ) | $ | (2.5 | ) | ||||
(a) | Included in cost of services and selling, general and administrative expense. |
(b) | Included in other income, net. |
During the second quarter of 2018, we amended the qualified defined benefit pension plan for certain eligible bargaining participants, the effects of which (i) froze benefit accruals upon reaching 30 years of service, (ii) provided for an unreduced early retirement benefit for participants with 30 years of service and (iii) added a lump-sum payment option. Changes to these benefit provisions required re-measurement of the pension plan’s funded status as of June 30, 2018 based on updated census data and actuarial assumptions, including the discount rate, which increased from 3.68 percent to 4.31 percent, and fair value of plan assets. As a result of the remeasurement, we recognized a curtailment gain of $2.7 million, prior service credits of $2.7 million and a net actuarial gain of $5.6 million.
For 2018, the expected employer contributions for pension benefits consists of $17.7 million to the qualified pension plan to satisfy our remaining 2017 and 2018 funding requirements and $0.9 million necessary to fund the expected benefit payments of our unfunded supplemental executive retirement pension plans to avoid certain benefit restrictions. On January 12, 2018, we made our required quarterly employer contribution of $5.2 million in cash to the qualified pension plan. On February 27, 2018, we contributed 0.8 million shares of our common stock with a value of approximately $5.8 million to the qualified pension plan. We intend to fund the remaining 2018 contributions using our common stock, cash, or a combination thereof.
The components of postretirement benefits expense were as follows:
Three Months Ended June 30, | Six Months Ended June 30, | |||||||||||||||
(Millions) | 2018 | 2017 | 2018 | 2017 | ||||||||||||
Interest cost on benefit obligation (a) | $ | 0.2 | $ | 0.2 | $ | 0.4 | $ | 0.5 | ||||||||
Amortization of net actuarial loss (a) | — | 0.1 | 0.1 | 0.1 | ||||||||||||
Amortization of prior service credit (a) | (0.1 | ) | (0.1 | ) | (0.2 | ) | (0.2 | ) | ||||||||
Net periodic benefit expense | $ | 0.1 | $ | 0.2 | $ | 0.3 | $ | 0.4 | ||||||||
(a)Included in other income, net.
We contributed $0.7 million to the postretirement plan during the six-month period ended June 30, 2018, excluding amounts that were funded by participant contributions to the plan.
34
NOTES TO UNAUDITED INTERIM CONSOLIDATED FINANCIAL STATEMENTS
____
8. Employee Benefit Plans and Postretirement Benefits, Continued:
We also sponsor an employee savings plan under section 401(k) of the Internal Revenue Code, which covers substantially all salaried employees and certain bargaining unit employees. Windstream matches on an annual basis up to a maximum of 4.0 percent of employee pre-tax contributions to the plan for employees contributing up to 5.0 percent of their eligible pre-tax compensation. We recorded expenses of $5.8 million and $12.1 million in the three and six month periods ended June 30, 2018, respectively, as compared to $4.7 million and $11.5 million for the same periods in 2017 related to our matching contribution under the employee savings plan, which was included in cost of services and selling, general and administrative expenses in our consolidated statements of operations. Expense related to our 2018 and 2017 matching contribution expected to be made in Windstream Holdings common stock is included in share-based compensation expense in the accompanying consolidated statements of cash flow. In March 2018, we contributed 3.4 million shares of our common stock with a fair value of $26.9 million to the plan for the 2017 annual matching contribution.
9. Share-Based Compensation Plans:
All share-based compensation award information presented has been retrospectively adjusted to reflect the effects of the one-for-five reverse stock split, which became effective on May 25, 2018 (see Note 1).
In May 2018, our stockholders approved amendments to our Amended and Restated 2006 Equity Incentive Plan (the “Incentive Plan”) which (i) extended the term of the Incentive Plan through February 6, 2023 and (ii) increased the maximum number of shares authorized for issuance or delivery under the Incentive Plan on a post-reverse stock split basis from 4.9 million to 6.8 million. Under the Incentive Plan, we may issue equity stock awards in the form of restricted stock, restricted stock units, stock appreciation rights or stock options. As of June 30, 2018, the Incentive Plan had remaining capacity of approximately 2.2 million awards.
Stock Options – At December 31, 2017, we had fewer than 0.1 million of vested stock option awards outstanding, all of which had been issued in conjunction with past acquisitions as replacement awards to former employees of the acquired companies. Substantially all of these options have exercise prices that are significantly higher than the current market price of our common stock and therefore are not likely to be exercised during the next twelve months. Prior to 2018, no other stock options had been granted by us. In February 2018, our Board of Directors granted 1.1 million stock options to certain officers, executives and other key management employees. Under terms of the grant award, the stock options vest ratably over a three-year period from the date of grant and the exercise price of the option equals the market value of our common stock on the date of grant. The maximum term for each option granted is 10 years. Our practice is to issue new shares of common stock upon the exercise of stock options. We measure the cost of employee stock options based on the grant-date fair value and recognize that cost on a straight-line basis over the period in which a recipient is required to provide services in exchange for the options, which is equal to the vesting period.
The weighted average fair value of stock options granted during the six-month period ended June 30, 2018 was $4.25 per share using the Black-Scholes option-pricing model and the following weighted average assumptions:
Expected life | 6.1 years | |||
Expected volatility | 58.7 | % | ||
Dividend yield | — | |||
Risk-free interest rate | 2.6 | % | ||
Because we do not have historical exercise experience for non-replacement stock options to reasonably estimate future exercise patterns, we used the simplified method available under current SEC rules to derive the expected life assumption, which was computed based on the average of the vesting and contractual terms of the stock options. Expected volatility was based on the historical volatility of our common stock using the weighted average of historical daily price changes of our common stock including the most recent period equal to the expected life of the stock option on the date of grant. The expected dividend yield reflects the elimination of our quarterly common stock dividend in the third quarter of 2017. The risk-free interest rate was determined using the implied yield currently available for zero-coupon U.S. government issues with a remaining term equal to the expected life of the stock options.
35
NOTES TO UNAUDITED INTERIM CONSOLIDATED FINANCIAL STATEMENTS
____
9. Share-Based Compensation Plans, Continued:
The following table summarizes stock option activity as of June 30, 2018:
(Thousands) Number of Shares Underlying Options | Weighted Average Exercise Price | (Years) Weighted Average Remaining Contractual Life | (Millions) Aggregate Intrinsic Value | |||||||||
Outstanding at December 31, 2017 | 34.2 | $ | 68.20 | |||||||||
Granted | 1,079.3 | $ | 7.50 | |||||||||
Exercised | — | $ | — | |||||||||
Canceled and forfeited | (13.7 | ) | $ | 85.04 | ||||||||
Outstanding at June 30, 2018 | 1,099.8 | $ | 8.43 | 9.5 | $ | — | ||||||
Vested or expected to vest at June 30, 2018 | 1,002.7 | $ | 8.52 | 9.5 | $ | — | ||||||
Exercisable at June 30, 2018 | 20.5 | $ | 57.02 | 1.9 | $ | — | ||||||
The following table summarizes stock option information as of June 30, 2018:
Options Outstanding | Options Exercisable | ||||||||||||
Range of Exercise Prices | (Thousands) Number of Options | Weighted Average Exercise Price | (Thousands) Number of Options | Weighted Average Exercise Price | |||||||||
$7.50 - $7.60 | 1,079.3 | $ | 7.50 | — | $ | — | |||||||
$14.70 - $35.05 | 1.4 | $ | 22.58 | 1.4 | $ | 22.58 | |||||||
$47.10 - $95.90 | 19.1 | $ | 59.61 | 19.1 | $ | 59.61 | |||||||
1,099.8 | $ | 8.43 | 20.5 | $ | 59.61 | ||||||||
At June 30, 2018, total unamortized compensation cost for non-vested stock option awards amounted to $3.5 million and is expected to be recognized over a weighted average period of 2.7 years.
Restricted Stock and Restricted Stock Units – Our board of directors may approve grants of restricted stock and restricted stock units to officers, executives, non-employee directors and certain management employees. Grants may include time-based and performance-based awards. Time-based awards granted to employees generally vest over a service period of two or three years. Performance-based restricted stock units may vest in a number of shares from zero to 150.0 percent of their award based on attainment of specified targets over a three-year period.
The vesting periods and grant date fair value for restricted stock and restricted stock units issued were as follows for the six-month period ended June 30, 2018:
(Number of shares in thousands) | ||||
Service-based restricted stock and restricted units: | ||||
Vest one year from date of grant, service based - granted to non-employee directors | 109.6 | |||
Vest immediately on date of grant, service based - granted to non-employee directors | 41.1 | |||
Total granted | 150.7 | |||
Grant date fair value (Dollars in millions) | $ | 1.1 | ||
36
NOTES TO UNAUDITED INTERIM CONSOLIDATED FINANCIAL STATEMENTS
____
9. Share-Based Compensation Plans, Continued:
Service-based restricted stock and restricted unit activity for the six-month period ended June 30, 2018 was as follows:
(Thousands) Underlying Number of Shares | Per Share Weighted Average Fair Value | ||||||
Non-vested at December 31, 2017 | 1,022.8 | $ | 31.45 | ||||
Granted | 150.7 | $ | 7.30 | ||||
Vested | (564.3 | ) | $ | 32.82 | |||
Forfeited | (45.6 | ) | $ | 31.83 | |||
Non-vested at June 30, 2018 | 563.6 | $ | 23.58 | ||||
Performance restricted stock unit activity for the six-month period ended June 30, 2018 was as follows:
(Thousands) Underlying Number of Shares | Per Share Weighted Average Fair Value | ||||||
Non-vested at December 31, 2017 | 520.7 | $ | 32.90 | ||||
Granted | — | $ | — | ||||
Vested | (103.7 | ) | $ | 36.09 | |||
Forfeited | (69.4 | ) | $ | 27.55 | |||
Non-vested at June 30, 2018 | 347.6 | $ | 28.34 | ||||
At June 30, 2018, unrecognized compensation expense for restricted stock and restricted stock units totaled $13.1 million and is expected to be recognized over the weighted average vesting period of 1.3 years. The total fair value of shares vested was $22.3 million for the six-month period ended June 30, 2018, as compared to $34.2 million for the same period in 2017. Share-based compensation expense for restricted stock and restricted stock units was $2.7 million and $6.3 million for the three and six month periods ended June 30, 2018, respectively, as compared to $10.9 million and $20.9 million for the same periods in 2017.
In addition to including amounts related to restricted stock and restricted units, share-based compensation expense presented in the accompanying consolidated statements of cash flow also includes amounts related to the matching contribution to the employee savings plan for which payments to eligible participants are expected to be made in Windstream Holdings common stock.
A summary of share-based compensation expense was as follows:
Three Months Ended June 30, | Six Months Ended June 30, | |||||||||||||||
(Millions) | 2018 | 2017 | 2018 | 2017 | ||||||||||||
Restricted stock, restricted units and stock options | $ | 2.7 | $ | 10.9 | $ | 6.3 | $ | 20.9 | ||||||||
Employee savings plan (See Note 8) | 5.8 | 4.7 | 12.1 | 11.5 | ||||||||||||
Share-based compensation expense | $ | 8.5 | $ | 15.6 | $ | 18.4 | $ | 32.4 | ||||||||
37
NOTES TO UNAUDITED INTERIM CONSOLIDATED FINANCIAL STATEMENTS
____
10. Merger, Integration and Other Costs and Restructuring Charges:
We incur costs to complete a merger or acquisition and integrate its operations into our business, which are presented as merger and integration expense in our consolidated results of operations. These costs include transaction costs, such as accounting, legal, consulting and broker fees; severance and related costs; IT and network conversion; rebranding and marketing; and contract termination fees. During 2017, we incurred investment banking fees, legal, accounting and other consulting fees, severance and employee benefit costs, contract and lease termination costs, and other integration expenses related to the merger with EarthLink. During the fourth quarter of 2017, we completed a network optimization project designed to consolidate traffic onto network facilities operated by us and reduce the usage of other carriers’ networks in our acquired CLEC markets. In undertaking this initiative, we incurred in the first half of 2017, exit costs to migrate traffic to existing lower cost circuits and to terminate existing contracts prior to their expiration.
Restructuring charges are primarily incurred as a result of evaluations of our operating structure. Among other things, these evaluations explore opportunities to provide greater flexibility in managing and financing existing and future strategic operations, for task automation and the balancing of our workforce based on the current needs of our customers. Severance, lease exit costs and other related charges are included in restructuring charges.
During the first half of 2018, we completed restructurings of our workforce to improve our overall cost structure and gain operational efficiencies. In undertaking these efforts, we eliminated approximately 550 employees and incurred a restructuring charge of $18.9 million, consisting of severance and employee benefit costs. During the first half of 2017, we completed reductions in our workforce eliminating approximately 375 positions in our ILEC small business and enterprise segments as well as in our engineering, finance and information technology workgroups to more efficiently manage our operations. In completing these workforce reductions, we incurred severance and other employee benefit costs of $10.5 million.
A summary of the merger, integration and other costs and restructuring charges recorded was as follows:
Three Months Ended June 30, | Six Months Ended June 30, | |||||||||||||||
(Millions) | 2018 | 2017 | 2018 | 2017 | ||||||||||||
Merger, integration and other costs: | ||||||||||||||||
Information technology conversion costs | $ | 0.2 | $ | 0.6 | $ | 0.6 | $ | 1.5 | ||||||||
Costs related to merger with EarthLink (a) | 6.6 | 13.4 | 11.0 | 66.5 | ||||||||||||
Costs related to merger with Broadview (b) | 1.5 | — | 3.4 | — | ||||||||||||
Costs related to acquisition of MASS | 0.6 | — | 1.2 | — | ||||||||||||
Network optimization and contract termination costs | — | 1.6 | — | 4.9 | ||||||||||||
Legal fees related to REIT spin-off litigation (see Note 15) | 4.8 | 0.5 | 4.8 | 0.5 | ||||||||||||
Other costs | 0.4 | 0.3 | 0.4 | 0.3 | ||||||||||||
Total merger, integration and other costs | 14.1 | 16.4 | 21.4 | 73.7 | ||||||||||||
Restructuring charges | 5.8 | 3.5 | 19.5 | 10.9 | ||||||||||||
Total merger, integration and other costs and restructuring charges | $ | 19.9 | $ | 19.9 | $ | 40.9 | $ | 84.6 | ||||||||
(a) | For the three and six month periods ended June 30, 2018, these amounts include severance and employee benefit costs for EarthLink employees terminated after the Merger of $1.8 million and $4.8 million, respectively, contract and lease termination costs of $4.0 million and $4.8 million, respectively, as a result of vacating certain facilities related to the acquired operations of EarthLink, and other miscellaneous expenses of $0.8 million and $1.4 million, respectively. |
Comparatively, during the three and six month periods ended June 30, 2017, severance and employee benefit costs for employees terminated after the Merger were $5.0 million and $29.5 million, respectively. Share-based compensation expense of $5.4 million and $9.8 million attributable to the accelerated vesting of replacement equity awards for terminated EarthLink employees and other miscellaneous expenses were $3.0 million and $4.4 million, respectively. For the six month period of 2017, we also incurred investment banking, legal, accounting and other consulting fees of $22.8 million,
(b) | Includes severance and employee benefit costs for Broadview employees terminated after the acquisition of $1.9 million and other miscellaneous expenses of $1.5 million. |
38
NOTES TO UNAUDITED INTERIM CONSOLIDATED FINANCIAL STATEMENTS
____
10. Merger, Integration and Other Costs and Restructuring Charges, Continued:
After giving consideration to tax benefits on deductible items, merger, integration and other costs and restructuring charges increased our reported net loss $14.8 million and $30.5 million for the three and six month periods ended June 30, 2018, respectively, as compared to $13.1 million and $58.0 million for the same periods in 2017.
The following is a summary of the activity related to the liabilities associated with merger, integration and other costs and restructuring charges at June 30:
Restructuring Charges | |||||||||||||||
(Millions) | Merger, Integration and Other Charges | Severance and Benefit Costs | Other Exit Costs | Total | |||||||||||
Balance at December 31, 2017 | $ | 10.3 | $ | 5.0 | $ | 4.2 | $ | 19.5 | |||||||
Expenses incurred in period | 21.4 | 19.5 | — | 40.9 | |||||||||||
Cash outlays during the period | (16.7 | ) | (21.7 | ) | (1.3 | ) | (39.7 | ) | |||||||
Balance at June 30, 2018 | $ | 15.0 | $ | 2.8 | $ | 2.9 | $ | 20.7 | |||||||
Payments of these liabilities will be funded through operating cash flows.
11. Accumulated Other Comprehensive Income:
Accumulated other comprehensive income balances, net of tax, were as follows:
(Millions) | June 30, 2018 | December 31, 2017 | ||||||
Pension and postretirement plans | $ | 9.0 | $ | 4.0 | ||||
Unrealized net gains on interest rate swaps: | ||||||||
Designated portion | 37.1 | 20.7 | ||||||
De-designated portion | (2.1 | ) | (3.3 | ) | ||||
Accumulated other comprehensive income | $ | 44.0 | $ | 21.4 | ||||
Changes in accumulated other comprehensive income balances, net of tax, were as follows:
(Millions) | Net Gains on Interest Rate Swaps | Pension and Postretirement Plans | Total | |||||||||
Balance at December 31, 2017 | $ | 17.4 | $ | 4.0 | $ | 21.4 | ||||||
Cumulative effect of adoption of ASU 2017-12 | 1.7 | — | 1.7 | |||||||||
Prior service credit arising during the period | — | 2.7 | 2.7 | |||||||||
Other comprehensive income before reclassifications | 14.7 | 4.0 | 18.7 | |||||||||
Amounts reclassified from other accumulated comprehensive income (a) | 1.2 | (1.7 | ) | (0.5 | ) | |||||||
Balance at June 30, 2018 | $ | 35.0 | $ | 9.0 | $ | 44.0 | ||||||
(a) | See separate table below for details about these reclassifications. |
39
NOTES TO UNAUDITED INTERIM CONSOLIDATED FINANCIAL STATEMENTS
____
11. Accumulated Other Comprehensive Income, Continued:
Reclassifications out of accumulated other comprehensive income were as follows:
(Millions) Amount Reclassified from Accumulated Other Comprehensive Income | ||||||||||||||||||
Details about Accumulated Other Comprehensive Income Components | Three Months Ended June 30, | Six Months Ended June 30, | Affected Line Item in the Consolidated Statements of Operations | |||||||||||||||
2018 | 2017 | 2018 | 2017 | |||||||||||||||
Interest rate swaps: | ||||||||||||||||||
Amortization of net unrealized losses on de-designated interest rate swaps | $ | 0.8 | $ | 1.4 | $ | 1.7 | $ | 2.9 | Interest expense | |||||||||
0.8 | 1.4 | 1.7 | 2.9 | Loss before income taxes | ||||||||||||||
(0.3 | ) | (0.5 | ) | (0.5 | ) | (1.1 | ) | Income tax benefit | ||||||||||
0.5 | 0.9 | 1.2 | 1.8 | Net loss | ||||||||||||||
Pension and postretirement plans: | ||||||||||||||||||
Amortization of net actuarial loss | — | 0.1 | 0.1 | 0.1 | (a) | |||||||||||||
Amortization of prior service credits | (1.3 | ) | (0.2 | ) | (2.6 | ) | (0.4 | ) | (a) | |||||||||
(1.3 | ) | (0.1 | ) | (2.5 | ) | (0.3 | ) | Loss before income taxes | ||||||||||
0.5 | — | 0.8 | 0.1 | Income tax benefit | ||||||||||||||
(0.8 | ) | (0.1 | ) | (1.7 | ) | (0.2 | ) | Net loss | ||||||||||
Total reclassifications for the period, net of tax | $ | (0.3 | ) | $ | 0.8 | $ | (0.5 | ) | $ | 1.6 | Net loss | |||||||
(a) | These accumulated other comprehensive income components are included in the computation of net periodic benefit expense (see Note 8). |
12. Loss per Share:
All per share information presented has been retrospectively adjusted to reflect the effects of the one-for-five reverse stock split, which became effective on May 25, 2018 (see Note 1).
We compute basic loss per share by dividing net loss applicable to common shares by the weighted average number of common shares outstanding during each period. Our non-vested restricted shares containing a non-forfeitable right to receive dividends on a one-to-one per share ratio to common shares are considered participating securities, and the impact is included in the computation of loss per share pursuant to the two-class method. Calculations of loss per share under the two-class method exclude from the numerator any dividends paid or owed on participating securities and any undistributed earnings considered to be attributable to participating securities. The related participating securities are similarly excluded from the denominator. Commencing in the third quarter of 2017, we eliminated our quarterly common stock dividend. Dividends declared were $.75 per share in each of the first two quarters of 2017, for a total of $1.50 per share.
Diluted loss per share is computed by dividing net loss applicable to common shares by the weighted average number of common shares adjusted to include the effect of potentially dilutive securities. Potentially dilutive securities include incremental shares issuable upon vesting of restricted stock units and from exercise of outstanding stock options and warrants. Diluted loss per share excludes all potentially dilutive securities because their effect is anti-dilutive.
We also issue performance-based restricted stock units as part of our share-based compensation plan. Certain of these restricted stock units contain a forfeitable right to receive dividends. Because dividends attributable to these shares are forfeited if the vesting provisions are not met, they are considered non-participating restricted shares and are not dilutive under the two-class method until the performance conditions have been satisfied. As of June 30, 2018, the performance conditions for the outstanding restricted stock units have not yet been satisfied. Restricted stock units, stock options and warrants are included in the computation of dilutive earnings (loss) per share using the treasury stock method.
40
NOTES TO UNAUDITED INTERIM CONSOLIDATED FINANCIAL STATEMENTS
____
12. Loss per Share, Continued:
A reconciliation of net loss and number of shares used in computing basic and diluted loss per share was as follows:
Three Months Ended June 30, | Six Months Ended June 30, | |||||||||||||||
(Millions, except per share amounts) | 2018 | 2017 | 2018 | 2017 | ||||||||||||
Basic and diluted loss per share: | ||||||||||||||||
Numerator: | ||||||||||||||||
Net loss | $ | (93.7 | ) | $ | (68.1 | ) | $ | (215.1 | ) | $ | (179.4 | ) | ||||
Income allocable to participating securities | — | (0.7 | ) | — | (1.3 | ) | ||||||||||
Net loss attributable to common shares | $ | (93.7 | ) | $ | (68.8 | ) | $ | (215.1 | ) | $ | (180.7 | ) | ||||
Denominator: | ||||||||||||||||
Basic and diluted shares outstanding | ||||||||||||||||
Weighted average shares outstanding | 40.7 | 38.1 | 39.0 | 32.1 | ||||||||||||
Weighted average participating securities | — | (0.6 | ) | — | (0.7 | ) | ||||||||||
Weighted average basic and diluted shares outstanding | 40.7 | 37.5 | 39.0 | 31.4 | ||||||||||||
Basic and diluted loss per share: | ||||||||||||||||
Net loss | ($2.30 | ) | ($1.83 | ) | ($5.51 | ) | ($5.75 | ) | ||||||||
We have excluded from the computation of diluted shares the effect of restricted stock units and options to purchase shares of our common stock because their inclusion would have an anti-dilutive effect due to our reported net losses for the three and six month periods ended June 30, 2018 and 2017. We had 0.9 million restricted stock units and 1.1 million stock options outstanding as of June 30, 2018, compared to 0.9 million restricted stock units and fewer than 0.1 million stock options outstanding at June 30, 2017.
13. Segment Information:
Effective November 1, 2017, we reorganized our business operations and changed the composition of our business segments. Prior period segment information has been revised to reflect these changes, which had no impact on our consolidated results of operations. We disaggregate our operations between customers located in service areas in which we are the incumbent local exchange carrier (“ILEC”) and provide services over network facilities operated by us and those customers located in service areas in which we are a competitive local exchange carrier (“CLEC”) and provide services over network facilities primarily leased from other carriers. We have further disaggregated our CLEC operations between enterprise, wholesale and consumer customers. Following our reorganization, we now operate and report the following four segments:
• | Consumer & Small Business – We manage as one business our residential and small business operations in those markets in which we are the ILEC due to the similarities with respect to service offerings, marketing strategies and customer service delivery. Products and services offered to customers include traditional local and long-distance voice services, high-speed Internet services, and value-added services such as security and online back-up, which are delivered primarily over network facilities operated by us. We offer consumer video services through relationships with DirecTV and Dish Network LLC and we also own and operate cable television franchises in some of our service areas. We offer Kinetic, a premium broadband and video entertainment offering in several of our markets. |
Residential customers can bundle voice, high-speed Internet and video services, to provide one convenient billing solution and receive bundle discounts. Small Business services offer a wide range of advanced Internet, voice, and web conferencing products. These services are equipped to deliver high-speed Internet with competitive speeds, value added services to enhance business productivity and options to bundle services for a global business solution to meet our small business customer needs.
41
NOTES TO UNAUDITED INTERIM CONSOLIDATED FINANCIAL STATEMENTS
____
13. Segment Information, Continued:
• | Enterprise – Products and services offered to our business customers include integrated voice and data services, which deliver voice and broadband services over a single Internet connection, data transport services, multi-site networking services which provide a fast and private connection between business locations, Software Defined Wide Area Network (“SD-WAN”), which optimizes application performance, Unified Communications as a Service (“UCaaS”), a next generation voice solution, as well as a variety of other data services, including cloud computing and collocation and managed services as an alternative to traditional information technology infrastructure. |
• | Wholesale – Our wholesale operations are focused on providing network bandwidth to other telecommunications carriers, network operators, and content providers. These services include special access services, which provide access and network transport services to end users, Ethernet and Wave transport up to 100 Gbps, and dark fiber and colocation services. Wholesale services also include fiber-to-the-tower connections to support the wireless backhaul market. In addition, we offer voice and data carrier services to other communications providers and to larger-scale purchasers of network capacity. We also offer traditional services including special access services and Time Division Multiplexing (“TDM”) private line transport. The combination of these services allow wholesale customers to provide voice and data services to their customers through the use of our network or in combination with their own networks. |
• | Consumer CLEC – Products and services offered to customers include traditional voice and long-distance services, nationwide Internet access services, both dial-up and high-speed, as well as value added services including online backup and various e-mail services. |
We evaluate performance of the segments based on contribution margin or segment income, which is computed as segment revenues and sales less segment operating expenses. Segment revenues are based upon each customer’s classification to an individual segment and include all services provided to that customer. Segment revenues also include revenue from federal and state universal service funds, CAF Phase II support, funds received from federal access recovery mechanisms, revenues from providing switched access services, including usage-based revenues from long-distance companies and other carriers for access to our network to complete long-distance calls, reciprocal compensation received from wireless and other local connecting carriers for the use of network facilities, certain surcharges assessed to our customers, including billings for our required contributions to federal and state USF programs, and product sales to contractors. There are no differences between total segment revenues and sales and total consolidated revenues and sales.
Segment expenses include specific expenses incurred as a direct result of providing services and products to segment customers; selling, general and administrative expenses that are directly associated with specific segment customers or activities; and certain allocated expenses which include network expenses, facilities expenses and other expenses, such as vehicle and real estate-related expenses. Operating expenses associated with regulatory and other revenues have also been assigned to our segments. We do not assign depreciation and amortization expense, goodwill impairment, merger, integration and other costs, restructuring charges, share-based compensation, pension expense, business transformation expenses and costs related to network optimization projects to our segments, because these expenses are centrally managed and are not monitored by or reported to the chief operating decision maker (“CODM”) by segment. Similarly, certain costs related to centrally-managed administrative functions, such as accounting and finance, information technology, network management, legal and human resources, are not assigned to our segments. Interest expense and net loss on early extinguishment of debt have also been excluded from segment operating results because we manage our financing activities on a total company basis and have not assigned any long-term debt obligations to the segments. Other income, net, and income tax benefit are not monitored as a part of our segment operations and, therefore, these items also have been excluded from our segment operating results.
Asset information by segment is not monitored or reported to the CODM and therefore has not been presented. All of our customers are located in the United States and we do not have any single customer that provides more than 10 percent of our total consolidated revenues and sales.
42
NOTES TO UNAUDITED INTERIM CONSOLIDATED FINANCIAL STATEMENTS
____
13. Segment Information, Continued:
The following table summarizes our segment results:
Three Months Ended June 30, | Six Months Ended June 30, | |||||||||||||||
(Millions) | 2018 | 2017 | 2018 | 2017 | ||||||||||||
Consumer & Small Business: | ||||||||||||||||
Revenues and sales | $ | 472.5 | $ | 504.9 | $ | 949.0 | $ | 1,009.3 | ||||||||
Costs and expenses | 198.9 | 215.9 | 393.5 | 431.3 | ||||||||||||
Segment income | $ | 273.6 | $ | 289.0 | $ | 555.5 | $ | 578.0 | ||||||||
Enterprise: | ||||||||||||||||
Revenues and sales | $ | 743.1 | $ | 738.4 | $ | 1,489.2 | $ | 1,400.2 | ||||||||
Cost and expenses | 581.9 | 596.7 | 1,182.2 | 1,134.5 | ||||||||||||
Segment income | $ | 161.2 | $ | 141.7 | $ | 307.0 | $ | 265.7 | ||||||||
Wholesale: | ||||||||||||||||
Revenues and sales | $ | 182.4 | $ | 196.6 | $ | 366.2 | $ | 375.4 | ||||||||
Costs and expenses | 53.6 | 61.6 | 109.1 | 113.3 | ||||||||||||
Segment income | $ | 128.8 | $ | 135.0 | $ | 257.1 | $ | 262.1 | ||||||||
Consumer CLEC: | ||||||||||||||||
Revenues and sales | $ | 46.4 | $ | 51.7 | $ | 94.3 | $ | 72.4 | ||||||||
Costs and expenses | 19.9 | 25.7 | 40.5 | 35.7 | ||||||||||||
Segment income | $ | 26.5 | $ | 26.0 | $ | 53.8 | $ | 36.7 | ||||||||
Total segment revenues and sales | $ | 1,444.4 | $ | 1,491.6 | $ | 2,898.7 | $ | 2,857.3 | ||||||||
Total segment costs and expenses | 854.3 | 899.9 | 1,725.3 | 1,714.8 | ||||||||||||
Total segment income | $ | 590.1 | $ | 591.7 | $ | 1,173.4 | $ | 1,142.5 | ||||||||
The following table reconciles segment income to consolidated net loss:
Three Months Ended June 30, | Six Months Ended June 30, | |||||||||||||||
(Millions) | 2018 | 2017 | 2018 | 2017 | ||||||||||||
Total segment income | $ | 590.1 | $ | 591.7 | $ | 1,173.4 | $ | 1,142.5 | ||||||||
Depreciation and amortization | (370.7 | ) | (362.4 | ) | (752.5 | ) | (700.9 | ) | ||||||||
Other unassigned operating expenses | (131.1 | ) | (126.8 | ) | (263.6 | ) | (295.0 | ) | ||||||||
Other income, net | 12.0 | 4.2 | 9.7 | 6.8 | ||||||||||||
Net loss on early extinguishment of debt | — | — | — | (3.2 | ) | |||||||||||
Interest expense | (224.4 | ) | (214.4 | ) | (447.5 | ) | (426.2 | ) | ||||||||
Income tax benefit | 30.4 | 39.6 | 65.4 | 96.6 | ||||||||||||
Net loss | $ | (93.7 | ) | $ | (68.1 | ) | $ | (215.1 | ) | $ | (179.4 | ) | ||||
43
NOTES TO UNAUDITED INTERIM CONSOLIDATED FINANCIAL STATEMENTS
____
14. Supplemental Guarantor Information:
Debentures and notes, without collateral, issued by Windstream Services, LLC
In connection with the issuance of the 7.750 percent senior notes due October 15, 2020, the 7.750 percent senior notes due October 1, 2021, the 7.500 percent senior notes due June 1, 2022, the 7.500 percent senior notes due April 1, 2023, the 6.375 percent senior notes due August 1, 2023, 8.750 percent senior notes due December 15, 2024, and the 8.625 percent senior first lien notes due October 31, 2025 (“the guaranteed notes”), certain of Windstream Services’ wholly-owned subsidiaries (the “Guarantors”), provide guarantees of those debentures. These guarantees are full and unconditional, subject to certain customary release provisions, as well as joint and several. All personal property assets and related operations of the Guarantors are pledged as collateral on the senior secured credit facility of Windstream Services. Certain Guarantors may be subject to restrictions on their ability to distribute earnings to Windstream Services. The remaining subsidiaries of Windstream Services (the “Non-Guarantors”) are not guarantors of the guaranteed notes. Windstream Holdings is not a guarantor of any Windstream Services debt instruments.
Following the acquisitions, the acquired legal entities of EarthLink, Broadview and MASS have been designated as either Guarantors or Non-Guarantors. Accordingly, the financial information presented herein includes the acquired EarthLink operations beginning on February 27, 2017, the acquired Broadview operations beginning on July 28, 2017, and the acquired MASS operations as of March 27, 2018.
The following information presents condensed consolidating and combined statements of comprehensive income (loss) for the three and six month periods ended June 30, 2018 and 2017, condensed consolidating and combined balance sheets as of June 30, 2018 and December 31, 2017, and condensed consolidating and combined statements of cash flows for the three and six month periods ended June 30, 2018 and 2017 of Windstream Services, the Guarantors and the Non-Guarantors. Investments consist of investments in net assets of subsidiaries held by Windstream Services and other subsidiaries, and have been presented using the equity method of accounting.
Condensed Consolidating Statement of Comprehensive Income (Loss) (Unaudited) | ||||||||||||||||||||
Three Months Ended June 30, 2018 | ||||||||||||||||||||
(Millions) | Windstream Services | Guarantors | Non- Guarantors | Eliminations | Consolidated | |||||||||||||||
Revenues and sales: | ||||||||||||||||||||
Service revenues | $ | — | $ | 292.0 | $ | 1,160.3 | $ | (27.7 | ) | $ | 1,424.6 | |||||||||
Product sales | — | 18.4 | 1.4 | — | 19.8 | |||||||||||||||
Total revenues and sales | — | 310.4 | 1,161.7 | (27.7 | ) | 1,444.4 | ||||||||||||||
Costs and expenses: | ||||||||||||||||||||
Cost of services | — | 138.0 | 611.8 | (27.0 | ) | 722.8 | ||||||||||||||
Cost of products sold | — | 15.8 | 2.4 | — | 18.2 | |||||||||||||||
Selling, general and administrative | — | 47.5 | 177.0 | (0.7 | ) | 223.8 | ||||||||||||||
Depreciation and amortization | 1.1 | 124.1 | 245.5 | — | 370.7 | |||||||||||||||
Merger, integration and other costs | — | — | 14.1 | — | 14.1 | |||||||||||||||
Restructuring charges | — | 1.6 | 4.2 | — | 5.8 | |||||||||||||||
Total costs and expenses | 1.1 | 327.0 | 1,055.0 | (27.7 | ) | 1,355.4 | ||||||||||||||
Operating (loss) income | (1.1 | ) | (16.6 | ) | 106.7 | — | 89.0 | |||||||||||||
(Losses) earnings from consolidated subsidiaries | (25.4 | ) | 67.0 | 19.6 | (61.2 | ) | — | |||||||||||||
Other (expense) income, net | (0.1 | ) | (0.2 | ) | 12.3 | — | 12.0 | |||||||||||||
Intercompany interest income (expense) | 13.8 | (10.3 | ) | (3.5 | ) | — | — | |||||||||||||
Interest expense | (103.5 | ) | (35.8 | ) | (85.1 | ) | — | (224.4 | ) | |||||||||||
(Loss) income before income taxes | (116.3 | ) | 4.1 | 50.0 | (61.2 | ) | (123.4 | ) | ||||||||||||
Income tax (benefit) expense | (23.1 | ) | (15.0 | ) | 7.9 | — | (30.2 | ) | ||||||||||||
Net (loss) income | $ | (93.2 | ) | $ | 19.1 | $ | 42.1 | $ | (61.2 | ) | $ | (93.2 | ) | |||||||
Comprehensive (loss) income | $ | (83.1 | ) | $ | 19.1 | $ | 42.1 | $ | (61.2 | ) | $ | (83.1 | ) | |||||||
44
NOTES TO UNAUDITED INTERIM CONSOLIDATED FINANCIAL STATEMENTS
____
14. Supplemental Guarantor Information, Continued:
Condensed Consolidating Statement of Comprehensive Income (Loss) (Unaudited) | ||||||||||||||||||||
Three Months Ended June 30, 2017 | ||||||||||||||||||||
(Millions) | Windstream Services | Guarantors | Non- Guarantors | Eliminations | Consolidated | |||||||||||||||
Revenues and sales: | ||||||||||||||||||||
Service revenues | $ | — | $ | 311.8 | $ | 1,179.0 | $ | (25.2 | ) | $ | 1,465.6 | |||||||||
Product sales | — | 23.3 | 2.7 | — | 26.0 | |||||||||||||||
Total revenues and sales | — | 335.1 | 1,181.7 | (25.2 | ) | 1,491.6 | ||||||||||||||
Costs and expenses: | ||||||||||||||||||||
Cost of services | — | 144.1 | 630.9 | (24.3 | ) | 750.7 | ||||||||||||||
Cost of products sold | — | 22.5 | 7.2 | — | 29.7 | |||||||||||||||
Selling, general and administrative | — | 44.7 | 181.8 | (0.9 | ) | 225.6 | ||||||||||||||
Depreciation and amortization | 2.2 | 119.1 | 241.1 | — | 362.4 | |||||||||||||||
Merger, integration and other costs | — | (1.8 | ) | 18.2 | — | 16.4 | ||||||||||||||
Restructuring charges | — | 3.7 | (0.2 | ) | — | 3.5 | ||||||||||||||
Total costs and expenses | 2.2 | 332.3 | 1,079.0 | (25.2 | ) | 1,388.3 | ||||||||||||||
Operating (loss) income | (2.2 | ) | 2.8 | 102.7 | — | 103.3 | ||||||||||||||
(Losses) earnings from consolidated subsidiaries | (24.1 | ) | 15.2 | 39.5 | (30.6 | ) | — | |||||||||||||
Other (expense) income, net | (0.2 | ) | 0.9 | 3.5 | — | 4.2 | ||||||||||||||
Intercompany interest income (expense) | 21.8 | (10.4 | ) | (11.4 | ) | — | — | |||||||||||||
Interest expense | (89.8 | ) | (36.8 | ) | (87.8 | ) | — | (214.4 | ) | |||||||||||
(Loss) income before income taxes | (94.5 | ) | (28.3 | ) | 46.5 | (30.6 | ) | (106.9 | ) | |||||||||||
Income tax (benefit) expense | (26.9 | ) | (16.1 | ) | 3.7 | — | (39.3 | ) | ||||||||||||
Net (loss) income | $ | (67.6 | ) | $ | (12.2 | ) | $ | 42.8 | $ | (30.6 | ) | $ | (67.6 | ) | ||||||
Comprehensive (loss) income | $ | (69.2 | ) | $ | (12.2 | ) | $ | 42.8 | $ | (30.6 | ) | $ | (69.2 | ) | ||||||
45
NOTES TO UNAUDITED INTERIM CONSOLIDATED FINANCIAL STATEMENTS
____
14. Supplemental Guarantor Information, Continued:
Condensed Consolidating Statement of Comprehensive Income (Loss) (Unaudited) | ||||||||||||||||||||
Six Months Ended June 30, 2018 | ||||||||||||||||||||
(Millions) | Windstream Services | Guarantors | Non- Guarantors | Eliminations | Consolidated | |||||||||||||||
Revenues and sales: | ||||||||||||||||||||
Service revenues | $ | — | $ | 586.7 | $ | 2,329.1 | $ | (55.8 | ) | $ | 2,860.0 | |||||||||
Product sales | — | 36.1 | 2.6 | — | 38.7 | |||||||||||||||
Total revenues and sales | — | 622.8 | 2,331.7 | (55.8 | ) | 2,898.7 | ||||||||||||||
Costs and expenses: | ||||||||||||||||||||
Cost of services | — | 265.7 | 1,248.7 | (54.7 | ) | 1,459.7 | ||||||||||||||
Cost of products sold | — | 31.0 | 4.0 | — | 35.0 | |||||||||||||||
Selling, general and administrative | — | 86.3 | 366.9 | (1.1 | ) | 452.1 | ||||||||||||||
Depreciation and amortization | 2.7 | 247.7 | 502.1 | — | 752.5 | |||||||||||||||
Merger, integration and other costs | — | — | 21.4 | — | 21.4 | |||||||||||||||
Restructuring charges | — | 3.1 | 16.4 | — | 19.5 | |||||||||||||||
Total costs and expenses | 2.7 | 633.8 | 2,159.5 | (55.8 | ) | 2,740.2 | ||||||||||||||
Operating (loss) income | (2.7 | ) | (11.0 | ) | 172.2 | — | 158.5 | |||||||||||||
(Losses) earnings from consolidated subsidiaries | (79.3 | ) | 70.7 | 38.6 | (30.0 | ) | — | |||||||||||||
Other income (expense), net | 0.4 | (0.5 | ) | 9.8 | — | 9.7 | ||||||||||||||
Intercompany interest income (expense) | 30.6 | (20.8 | ) | (9.8 | ) | — | — | |||||||||||||
Interest expense | (204.3 | ) | (71.9 | ) | (171.3 | ) | — | (447.5 | ) | |||||||||||
(Loss) income before income taxes | (255.3 | ) | (33.5 | ) | 39.5 | (30.0 | ) | (279.3 | ) | |||||||||||
Income tax (benefit) expense | (41.1 | ) | (24.8 | ) | 0.8 | — | (65.1 | ) | ||||||||||||
Net (loss) income | $ | (214.2 | ) | $ | (8.7 | ) | $ | 38.7 | $ | (30.0 | ) | $ | (214.2 | ) | ||||||
Comprehensive (loss) income | $ | (193.3 | ) | $ | (8.7 | ) | $ | 38.7 | $ | (30.0 | ) | $ | (193.3 | ) | ||||||
46
NOTES TO UNAUDITED INTERIM CONSOLIDATED FINANCIAL STATEMENTS
____
14. Supplemental Guarantor Information, Continued:
Condensed Consolidating Statement of Comprehensive Income (Loss) (Unaudited) | ||||||||||||||||||||
Six Months Ended June 30, 2017 | ||||||||||||||||||||
(Millions) | Windstream Services | Guarantors | Non- Guarantors | Eliminations | Consolidated | |||||||||||||||
Revenues and sales: | ||||||||||||||||||||
Service revenues | $ | — | $ | 578.7 | $ | 2,275.3 | $ | (44.0 | ) | $ | 2,810.0 | |||||||||
Product sales | — | 42.9 | 4.4 | — | 47.3 | |||||||||||||||
Total revenues and sales | — | 621.6 | 2,279.7 | (44.0 | ) | 2,857.3 | ||||||||||||||
Costs and expenses: | ||||||||||||||||||||
Cost of services | — | 261.6 | 1,215.4 | (42.5 | ) | 1,434.5 | ||||||||||||||
Cost of products sold | — | 41.2 | 9.3 | — | 50.5 | |||||||||||||||
Selling, general and administrative | — | 83.1 | 357.5 | (1.5 | ) | 439.1 | ||||||||||||||
Depreciation and amortization | 4.9 | 209.9 | 486.1 | — | 700.9 | |||||||||||||||
Merger, integration and other costs | — | 1.0 | 72.7 | — | 73.7 | |||||||||||||||
Restructuring charges | — | 5.0 | 5.9 | — | 10.9 | |||||||||||||||
Total costs and expenses | 4.9 | 601.8 | 2,146.9 | (44.0 | ) | 2,709.6 | ||||||||||||||
Operating (loss) income | (4.9 | ) | 19.8 | 132.8 | — | 147.7 | ||||||||||||||
(Losses) earnings from consolidated subsidiaries | (94.9 | ) | (0.7 | ) | 32.3 | 63.3 | — | |||||||||||||
Other income, net | — | 1.1 | 5.7 | — | 6.8 | |||||||||||||||
Net loss on early extinguishment of debt | (1.2 | ) | (2.0 | ) | — | — | (3.2 | ) | ||||||||||||
Intercompany interest income (expense) | 48.0 | (22.1 | ) | (25.9 | ) | — | — | |||||||||||||
Interest expense | (174.6 | ) | (76.3 | ) | (175.3 | ) | — | (426.2 | ) | |||||||||||
Loss before income taxes | (227.6 | ) | (80.2 | ) | (30.4 | ) | 63.3 | (274.9 | ) | |||||||||||
Income tax benefit | (48.9 | ) | (29.9 | ) | (17.4 | ) | — | (96.2 | ) | |||||||||||
Net loss | $ | (178.7 | ) | $ | (50.3 | ) | $ | (13.0 | ) | $ | 63.3 | $ | (178.7 | ) | ||||||
Comprehensive loss | $ | (177.4 | ) | $ | (50.3 | ) | $ | (13.0 | ) | $ | 63.3 | $ | (177.4 | ) | ||||||
47
NOTES TO UNAUDITED INTERIM CONSOLIDATED FINANCIAL STATEMENTS
____
14. Supplemental Guarantor Information, Continued:
Condensed Consolidating Balance Sheet (Unaudited) | ||||||||||||||||||||
As of June 30, 2018 | ||||||||||||||||||||
(Millions) | Windstream Services | Guarantors | Non- Guarantors | Eliminations | Consolidated | |||||||||||||||
Assets | ||||||||||||||||||||
Current Assets: | ||||||||||||||||||||
Cash and cash equivalents | $ | — | $ | 0.6 | $ | 44.7 | $ | — | $ | 45.3 | ||||||||||
Accounts receivable, net | — | 176.7 | 450.5 | (3.3 | ) | 623.9 | ||||||||||||||
Notes receivable - affiliate | — | 5.0 | — | (5.0 | ) | — | ||||||||||||||
Affiliates receivable, net | — | 54.9 | 1,880.2 | (1,935.1 | ) | — | ||||||||||||||
Inventories | — | 68.3 | 16.7 | — | 85.0 | |||||||||||||||
Prepaid expenses and other | 22.5 | 46.0 | 112.5 | — | 181.0 | |||||||||||||||
Total current assets | 22.5 | 351.5 | 2,504.6 | (1,943.4 | ) | 935.2 | ||||||||||||||
Investments in consolidated subsidiaries | 5,456.6 | 678.1 | 578.5 | (6,713.2 | ) | — | ||||||||||||||
Notes receivable - affiliate | — | 305.1 | — | (305.1 | ) | — | ||||||||||||||
Goodwill | 657.2 | 1,712.7 | 504.0 | — | 2,873.9 | |||||||||||||||
Other intangibles, net | 464.6 | 413.2 | 471.6 | — | 1,349.4 | |||||||||||||||
Net property, plant and equipment | 5.2 | 1,300.9 | 3,850.5 | — | 5,156.6 | |||||||||||||||
Deferred income taxes | — | 477.2 | 186.2 | (247.2 | ) | 416.2 | ||||||||||||||
Other assets | 32.6 | 17.7 | 58.2 | — | 108.5 | |||||||||||||||
Total Assets | $ | 6,638.7 | $ | 5,256.4 | $ | 8,153.6 | $ | (9,208.9 | ) | $ | 10,839.8 | |||||||||
Liabilities and Equity (Deficit) | ||||||||||||||||||||
Current Liabilities: | ||||||||||||||||||||
Current maturities of long-term debt | $ | 17.9 | $ | — | $ | — | $ | — | $ | 17.9 | ||||||||||
Current portion of long-term lease obligations | — | 58.6 | 141.5 | — | 200.1 | |||||||||||||||
Accounts payable | — | 248.8 | 246.4 | — | 495.2 | |||||||||||||||
Affiliates payable, net | 1,935.1 | — | — | (1,935.1 | ) | — | ||||||||||||||
Notes payable - affiliate | — | — | 5.0 | (5.0 | ) | — | ||||||||||||||
Advance payments and customer deposits | — | 39.2 | 163.8 | (3.3 | ) | 199.7 | ||||||||||||||
Accrued taxes | 0.2 | 18.5 | 68.8 | — | 87.5 | |||||||||||||||
Accrued interest | 60.0 | 1.7 | 0.5 | — | 62.2 | |||||||||||||||
Other current liabilities | 4.3 | 84.7 | 189.9 | — | 278.9 | |||||||||||||||
Total current liabilities | 2,017.5 | 451.5 | 815.9 | (1,943.4 | ) | 1,341.5 | ||||||||||||||
Long-term debt | 5,768.3 | 99.6 | — | — | 5,867.9 | |||||||||||||||
Long-term lease obligations | — | 1,320.0 | 3,220.5 | — | 4,540.5 | |||||||||||||||
Notes payable - affiliate | — | — | 305.1 | (305.1 | ) | — | ||||||||||||||
Deferred income taxes | 247.2 | — | — | (247.2 | ) | — | ||||||||||||||
Other liabilities | 12.2 | 54.3 | 429.9 | — | 496.4 | |||||||||||||||
Total liabilities | 8,045.2 | 1,925.4 | 4,771.4 | (2,495.7 | ) | 12,246.3 | ||||||||||||||
Commitments and Contingencies (See Note 15) | ||||||||||||||||||||
Equity (Deficit): | ||||||||||||||||||||
Common stock | — | 39.4 | 81.9 | (121.3 | ) | — | ||||||||||||||
Additional paid-in capital | 1,237.5 | 3,958.6 | 1,395.2 | (5,353.8 | ) | 1,237.5 | ||||||||||||||
Accumulated other comprehensive income | 44.0 | — | 9.0 | (9.0 | ) | 44.0 | ||||||||||||||
(Accumulated deficit) retained earnings | (2,688.0 | ) | (667.0 | ) | 1,896.1 | (1,229.1 | ) | (2,688.0 | ) | |||||||||||
Total equity (deficit) | (1,406.5 | ) | 3,331.0 | 3,382.2 | (6,713.2 | ) | (1,406.5 | ) | ||||||||||||
Total Liabilities and Equity (Deficit) | $ | 6,638.7 | $ | 5,256.4 | $ | 8,153.6 | $ | (9,208.9 | ) | $ | 10,839.8 | |||||||||
48
NOTES TO UNAUDITED INTERIM CONSOLIDATED FINANCIAL STATEMENTS
____
14. Supplemental Guarantor Information, Continued:
Condensed Consolidating Balance Sheet (Unaudited) | ||||||||||||||||||||
As of December 31, 2017 | ||||||||||||||||||||
(Millions) | Windstream Services | Guarantors | Non- Guarantors | Eliminations | Consolidated | |||||||||||||||
Assets | ||||||||||||||||||||
Current Assets: | ||||||||||||||||||||
Cash and cash equivalents | $ | — | $ | 2.5 | $ | 40.9 | $ | — | $ | 43.4 | ||||||||||
Accounts receivable, net | — | 185.2 | 461.1 | (3.3 | ) | 643.0 | ||||||||||||||
Notes receivable - affiliate | — | 5.0 | — | (5.0 | ) | — | ||||||||||||||
Affiliates receivable, net | — | 18.3 | 1,949.8 | (1,968.1 | ) | — | ||||||||||||||
Inventories | — | 76.9 | 16.1 | — | 93.0 | |||||||||||||||
Prepaid expenses and other | 26.8 | 44.3 | 83.2 | — | 154.3 | |||||||||||||||
Total current assets | 26.8 | 332.2 | 2,551.1 | (1,976.4 | ) | 933.7 | ||||||||||||||
Investments in consolidated subsidiaries | 5,603.7 | 575.9 | 401.0 | (6,580.6 | ) | — | ||||||||||||||
Notes receivable - affiliate | — | 306.9 | — | (306.9 | ) | — | ||||||||||||||
Goodwill | 657.2 | 1,712.8 | 472.4 | — | 2,842.4 | |||||||||||||||
Other intangibles, net | 479.8 | 461.7 | 512.9 | — | 1,454.4 | |||||||||||||||
Net property, plant and equipment | 5.8 | 1,318.3 | 4,067.7 | — | 5,391.8 | |||||||||||||||
Deferred income taxes | — | 460.7 | 205.2 | (295.1 | ) | 370.8 | ||||||||||||||
Other assets | 24.5 | 15.5 | 51.2 | — | 91.2 | |||||||||||||||
Total Assets | $ | 6,797.8 | $ | 5,184.0 | $ | 8,261.5 | $ | (9,159.0 | ) | $ | 11,084.3 | |||||||||
Liabilities and Equity (Deficit) | ||||||||||||||||||||
Current Liabilities: | ||||||||||||||||||||
Current maturities of long-term debt | $ | 169.3 | $ | — | $ | — | $ | — | $ | 169.3 | ||||||||||
Current portion of long-term lease obligations | — | 55.2 | 133.4 | — | 188.6 | |||||||||||||||
Accounts payable | — | 123.4 | 370.6 | — | 494.0 | |||||||||||||||
Affiliates payable, net | 1,968.1 | — | — | (1,968.1 | ) | — | ||||||||||||||
Notes payable - affiliate | — | — | 5.0 | (5.0 | ) | — | ||||||||||||||
Advance payments and customer deposits | — | 40.7 | 169.9 | (3.3 | ) | 207.3 | ||||||||||||||
Accrued taxes | — | 23.8 | 65.7 | — | 89.5 | |||||||||||||||
Accrued interest | 50.2 | 1.8 | 0.6 | — | 52.6 | |||||||||||||||
Other current liabilities | 15.6 | 102.7 | 223.8 | — | 342.1 | |||||||||||||||
Total current liabilities | 2,203.2 | 347.6 | 969.0 | (1,976.4 | ) | 1,543.4 | ||||||||||||||
Long-term debt | 5,575.0 | 99.6 | — | — | 5,674.6 | |||||||||||||||
Long-term lease obligations | — | 1,350.1 | 3,293.2 | — | 4,643.3 | |||||||||||||||
Notes payable - affiliate | — | — | 306.9 | (306.9 | ) | — | ||||||||||||||
Deferred income taxes | 295.1 | — | — | (295.1 | ) | — | ||||||||||||||
Other liabilities | 23.4 | 77.1 | 421.4 | — | 521.9 | |||||||||||||||
Total liabilities | 8,096.7 | 1,874.4 | 4,990.5 | (2,578.4 | ) | 12,383.2 | ||||||||||||||
Commitments and Contingencies (See Note 15) | ||||||||||||||||||||
Equity (Deficit): | ||||||||||||||||||||
Common stock | — | 39.4 | 81.9 | (121.3 | ) | — | ||||||||||||||
Additional paid-in capital | 1,187.1 | 3,958.6 | 1,358.1 | (5,316.7 | ) | 1,187.1 | ||||||||||||||
Accumulated other comprehensive income | 21.4 | — | 4.0 | (4.0 | ) | 21.4 | ||||||||||||||
(Accumulated deficit) retained earnings | (2,507.4 | ) | (688.4 | ) | 1,827.0 | (1,138.6 | ) | (2,507.4 | ) | |||||||||||
Total equity (deficit) | (1,298.9 | ) | 3,309.6 | 3,271.0 | (6,580.6 | ) | (1,298.9 | ) | ||||||||||||
Total Liabilities and Equity (Deficit) | $ | 6,797.8 | $ | 5,184.0 | $ | 8,261.5 | $ | (9,159.0 | ) | $ | 11,084.3 | |||||||||
49
NOTES TO UNAUDITED INTERIM CONSOLIDATED FINANCIAL STATEMENTS
____
14. Supplemental Guarantor Information, Continued:
Condensed Consolidating Statement of Cash Flows (Unaudited) | ||||||||||||||||||||
Six Months Ended June 30, 2018 | ||||||||||||||||||||
(Millions) | Windstream Services | Guarantors | Non- Guarantors | Eliminations | Consolidated | |||||||||||||||
Cash Flows from Operating Activities: | ||||||||||||||||||||
Net cash (used in) provided from operating activities | $ | (164.8 | ) | $ | 294.8 | $ | 410.7 | $ | — | $ | 540.7 | |||||||||
Cash Flows from Investing Activities: | ||||||||||||||||||||
Additions to property, plant and equipment | (0.1 | ) | (92.2 | ) | (314.0 | ) | — | (406.3 | ) | |||||||||||
Acquisition of MASS | (37.6 | ) | — | — | — | (37.6 | ) | |||||||||||||
Other, net | — | 0.5 | (9.3 | ) | — | (8.8 | ) | |||||||||||||
Net cash used in investing activities | (37.7 | ) | (91.7 | ) | (323.3 | ) | — | (452.7 | ) | |||||||||||
Cash Flows from Financing Activities: | ||||||||||||||||||||
Distributions to Windstream Holdings, Inc. | (1.0 | ) | — | — | — | (1.0 | ) | |||||||||||||
Contributions from Windstream Holdings, Inc. | 11.1 | — | — | — | 11.1 | |||||||||||||||
Repayments of debt and swaps | (413.1 | ) | — | — | — | (413.1 | ) | |||||||||||||
Proceeds from debt issuance | 450.0 | — | — | — | 450.0 | |||||||||||||||
Debt issuance costs | (11.6 | ) | — | — | — | (11.6 | ) | |||||||||||||
Intercompany transactions, net | 169.2 | (155.0 | ) | (14.2 | ) | — | — | |||||||||||||
Payments under long-term lease obligations | — | (26.8 | ) | (64.6 | ) | — | (91.4 | ) | ||||||||||||
Payments under capital lease obligations | — | (24.7 | ) | (3.0 | ) | — | (27.7 | ) | ||||||||||||
Other, net | (2.1 | ) | 1.5 | (1.8 | ) | — | (2.4 | ) | ||||||||||||
Net cash provided from (used in) financing activities | 202.5 | (205.0 | ) | (83.6 | ) | — | (86.1 | ) | ||||||||||||
(Decrease) increase in cash and cash equivalents | — | (1.9 | ) | 3.8 | — | 1.9 | ||||||||||||||
Cash and Cash Equivalents: | ||||||||||||||||||||
Beginning of period | — | 2.5 | 40.9 | — | 43.4 | |||||||||||||||
End of period | $ | — | $ | 0.6 | $ | 44.7 | $ | — | $ | 45.3 | ||||||||||
50
NOTES TO UNAUDITED INTERIM CONSOLIDATED FINANCIAL STATEMENTS
____
14. Supplemental Guarantor Information, Continued:
Condensed Consolidating Statement of Cash Flows (Unaudited) | ||||||||||||||||||||
Six Months Ended June 30, 2017 | ||||||||||||||||||||
(Millions) | Windstream Services | Guarantors | Non- Guarantors | Eliminations | Consolidated | |||||||||||||||
Cash Flows from Operating Activities: | ||||||||||||||||||||
Net cash (used in) provided from operating activities | $ | (119.9 | ) | $ | 144.1 | $ | 350.4 | $ | — | $ | 374.6 | |||||||||
Cash Flows from Investing Activities: | ||||||||||||||||||||
Additions to property, plant and equipment | (0.2 | ) | (58.5 | ) | (449.1 | ) | — | (507.8 | ) | |||||||||||
Cash acquired from EarthLink | — | 0.7 | 4.3 | — | 5.0 | |||||||||||||||
Other, net | — | — | (11.8 | ) | — | (11.8 | ) | |||||||||||||
Net cash used in investing activities | (0.2 | ) | (57.8 | ) | (456.6 | ) | — | (514.6 | ) | |||||||||||
Cash Flows from Financing Activities: | ||||||||||||||||||||
Distributions to Windstream Holdings, Inc. | (35.3 | ) | — | — | — | (35.3 | ) | |||||||||||||
Contributions from Windstream Holdings, Inc. | 9.6 | — | — | — | 9.6 | |||||||||||||||
Repayments of debt and swaps | (828.6 | ) | (453.6 | ) | — | — | (1,282.2 | ) | ||||||||||||
Proceeds of debt issuance | 1,535.6 | — | — | — | 1,535.6 | |||||||||||||||
Debt issuance costs | (7.3 | ) | — | — | — | (7.3 | ) | |||||||||||||
Intercompany transactions, net | (543.3 | ) | 405.7 | 137.6 | — | — | ||||||||||||||
Payments under long-term lease obligations | — | (24.1 | ) | (58.1 | ) | — | (82.2 | ) | ||||||||||||
Payments under capital lease obligations | — | (18.3 | ) | (3.7 | ) | — | (22.0 | ) | ||||||||||||
Other, net | (10.6 | ) | 1.8 | (1.8 | ) | — | (10.6 | ) | ||||||||||||
Net cash provided from (used in) financing activities | 120.1 | (88.5 | ) | 74.0 | — | 105.6 | ||||||||||||||
Decrease in cash and cash equivalents | — | (2.2 | ) | (32.2 | ) | — | (34.4 | ) | ||||||||||||
Cash and Cash Equivalents: | ||||||||||||||||||||
Beginning of period | — | 2.2 | 56.9 | — | 59.1 | |||||||||||||||
End of period | $ | — | $ | — | $ | 24.7 | $ | — | $ | 24.7 | ||||||||||
51
NOTES TO UNAUDITED INTERIM CONSOLIDATED FINANCIAL STATEMENTS
____
15. Commitments and Contingencies:
Litigation
On February 9, 2015, a putative stockholder filed a Shareholder Class Action Complaint in the Delaware Court of Chancery (the “Court”), captioned Doppelt v. Windstream Holdings, Inc., et al., C.A. No. 10629-VCN, against the Company and its board of directors. This complaint was accompanied by a motion for a preliminary injunction seeking to enjoin the spin-off. The Court, ruling from the bench on February 19, 2015 - the day before a special meeting of stockholders was scheduled to vote on a reverse stock split and amended governing documents (the “Proposals”) - denied plaintiff’s motion for a preliminary injunction, reasoning that much of the information sought by plaintiff had been disclosed in public filings available on the United States Securities and Exchange Commission’s website, the Windstream Holdings’ board of directors was in no way conflicted, and while approval of the Proposals would facilitate the spin-off, approval was not necessary to effect the spin-off. On March 16, 2015, plaintiff, joined by a second putative Windstream stockholder, filed an Amended Shareholder Class Action Complaint alleging breaches of fiduciary duty by the Company and its Board concerning Windstream’s disclosures and seeking to rescind the spin-off and unspecified monetary damages. On February 5, 2016, the Court dismissed Windstream as a named party and also dismissed the plaintiffs’ demand to rescind the spin-off, but otherwise denied Windstream’s motion to dismiss plaintiffs’ claims. On or about January 27, 2017, the plaintiffs filed a motion seeking class certification which the Court granted on April 17, 2017. The parties reached a settlement of all claims that was approved by the court at a hearing on June 20, 2018, and the case was dismissed.
In a notice letter received September 22, 2017 (the “Original Notice”), Aurelius Capital Master, Ltd. ("Aurelius") asserted an alleged default of certain senior unsecured notes, the 6.375 percent Senior Notes due 2023 of Windstream Services, based on alleged violations of the associated indenture (the "2013 Indenture"). Aurelius primarily alleged that Windstream Services violated the 2013 Indenture by executing the REIT Spin-Off in April 2015 that, according to Aurelius, constituted a Sale and Leaseback Transaction that was prohibited under Section 4.19 of the Indenture and that violated Section 4.07 of the 2013 Indenture by not delivering certain required Officers' Certificates associated with alleged Restricted Payments. The Original Notice purported to constitute a written notice of default, which would trigger a 60-day grace or cure period after which the Indenture trustee or holders of at least 25 percent in aggregate principal amount of outstanding Notes could declare the principal amount of all outstanding 6.375 percent Notes to be immediately due and payable. If an “Event of Default” is found to have occurred under the 2013 Indenture, then such “Event of Default” could also constitute an “Event of Default” under the Windstream Services’ Credit Agreement. In addition, if an “Event of Default” is deemed to have occurred under the 2013 Indenture and Windstream Services’ obligations under the 2013 Indenture and the 6.375 percent 2023 Notes are accelerated, this could also constitute an “Event of Default” under the indentures governing the Windstream Services’ other senior notes.
In light of the allegations in the Original Notice, Windstream Services filed suit against U.S. Bank N.A., the Indenture Trustee (the “Trustee”), in Delaware Chancery Court seeking a declaration that it had not violated any provision of the 2013 Indenture and injunctive relief. On October 12, 2017, the Trustee filed suit in the Southern District of New York seeking a declaration that defaults had occurred. Windstream Services filed an answer and affirmative defenses in response to the Trustee’s complaint the following day, as well as counterclaims against the Trustee and Aurelius for declaratory relief. The Delaware action was subsequently dismissed.
Additionally, as outlined in Note 5, on October 18, 2017, Windstream Services launched debt exchange offers with respect to its senior notes, including the Notes, and on October 31, 2017, learned that based on tenders of notes in the exchange offers and consents delivered in the consent solicitation, upon early settlement of the exchange offers, holders representing the requisite percentage of the Notes needed to waive the defaults alleged in the Original Notice would be received. On November 6, 2017, Windstream Services and the Trustee executed a supplemental indenture, and new 6.375 percent Notes were issued, which gave effect to the waivers and consents for the Notes, is binding on all noteholders, and negates assertions made by Aurelius and the Indenture Trustee. During the fourth quarter of 2017, Windstream Services also completed consent solicitations with respect to each of its series of outstanding Notes, pursuant to which noteholders agreed to waive alleged defaults with respect to the transactions related to the spin-off of Uniti and amend the indentures governing the Notes to give effect to such waivers and amendments. Windstream Services received such consents from the holders representing a majority of the outstanding aggregate principal amount of the Notes. Windstream Services, the trustee under the indentures governing the Notes and the other parties to such indentures executed supplemental indentures giving effect to the waivers and amendments pursuant to the consent solicitation.
52
NOTES TO UNAUDITED INTERIM CONSOLIDATED FINANCIAL STATEMENTS
____
15. Commitments and Contingencies, Continued:
On November 22, 2017, Windstream Services filed a motion for judgment on the pleadings seeking dismissal of the Trustee’s complaint, which motion was denied without prejudice. On the same date, Aurelius filed counterclaims seeking a declaration that the new 6.375 percent Notes were improperly issued and that the debt exchange offers and consent solicitation were void. Windstream Services asserted that such counterclaims should be dismissed pursuant to Section 6.06 of the Indenture, which contains a "no-action" clause. Aurelius amended its counterclaims, and on February 2, 2018, Windstream Services filed an answer and affirmative defenses in response to the amended counterclaims. On November 27, 2017, Windstream Services received a second purported notice of default dated November 27, 2017 (the “Second Notice”) from Aurelius which alleged that certain of the Exchange and Consent Transactions violated the terms of the Indenture. Aurelius withdrew the Second Notice on December 6, 2017, and served an alleged notice of an Event of Default and acceleration on December 7, 2017 (“Notice of Acceleration”). The Notice of Acceleration claimed that the principal amount, and all accrued interest, owed under the note associated with the 2013 Indenture was now due and payable as result of Windstream Services allegedly not curing the alleged defaults set forth in the Original Notice within the sixty-day cure period. Windstream Services disputes that any amounts are due and owing and has denied all allegations made in the Original Notice, the Second Notice (now withdrawn) and the Notice of Acceleration, and asserted the allegations are without merit in the pending litigation. Windstream Services maintains that claims asserted by Aurelius and the Trustee are mooted in light of the debt exchanges and consent transactions discussed herein and that Windstream Services has been, and remains, in compliance with all of the covenants under the 2013 Indenture. However, there is no guarantee of success in the litigation and any adverse ruling could have a material adverse effect on our future consolidated results of operations, cash flows or financial condition.
Trial in this matter occurred July 23-25, 2018, and the court heard final arguments on July 31, 2018. At this time, the court has not yet issued a ruling in the matter.
We are party to various legal proceedings and the ultimate resolution of these legal proceedings cannot be determined at this time. However, based on current circumstances, management does not believe such proceedings, individually or in the aggregate, will have a material adverse effect on our future consolidated results of operations, cash flows or financial condition.
Finally, management is currently not aware of any environmental matters, individually or in the aggregate, that would have a material adverse effect on our consolidated financial condition or results of our operations.
Other Matters
Windstream and one of its business customers had an agreement pursuant to which Windstream provided communication services to several of the customer’s locations. The majority of funding for the services is administered by the Universal Service Administrative Company (“USAC”) pursuant to the Universal Service Rural Health Care Telecommunications Program that offers reduced rates for broadband and telecommunications services to rural health care facilities. In March 2017, USAC issued a funding denial to the customer on the basis that certain rules of the FCC were violated with the selection of Windstream as the service provider. Due to an alleged conflict of interest created by a third-party Windstream channel partner that acted as a consultant for the customer regarding the agreement, USAC asserted that Windstream’s selection was not based upon a fair and open competitive bidding process. USAC’s denial addressed accrued funding of approximately $16.6 million, as well as funding of approximately $6.0 million previously remitted to us. Windstream, along with the customer, has appealed the denial; USAC rejected the appeal on June 29, 2018, upholding its previous denial of funding. Windstream plans to appeal the denial with the FCC and will do so prior to August 28, 2018, the deadline to file the appeal. While the ultimate resolution is not currently predictable, if there is a future adverse legal ruling against Windstream, the ruling could constitute a material adverse outcome on our future consolidated results of operations, cash flows or financial condition.
53
NOTES TO UNAUDITED INTERIM CONSOLIDATED FINANCIAL STATEMENTS
____
16. Subsequent Events:
Completion of Debt Exchanges
On August 2, 2018, Windstream Services completed the settlement of exchange offers, which expired on July 31, 2018, for (1) its 7.75 percent senior notes due October 15, 2020 (“2020 Notes”) for new 10.500 percent senior second lien notes due June 30, 2024 (the “New 2024 Notes”) and (2) its 7.75 percent senior notes due October 1, 2021 (“2021 Notes”), 7.50 percent senior notes due June 1, 2022 (“2022 Notes”), 7.50 percent senior notes due April 1, 2023 (“2023 Notes”), 6.375 percent senior notes due August 1, 2023 (“August 2023 Notes”) and 8.75 percent senior notes due December 15, 2024 (“2024 Notes”) for new 9.00 percent senior second lien notes due June 30, 2025 (the “New 2025 Notes”) as follows:
• | accepted for exchange $414.9 million aggregate principal amount of 2020 Notes in exchange for $414.9 million aggregate principal amount of New 2024 Notes. |
• | accepted for exchange $18.8 million aggregate principal amount of 2021 Notes, $5.3 million aggregate principal amount of 2022 Notes, $86.0 million aggregate principal amount of 2023 Notes, $340.7 million aggregate principal amount of August 2023 Notes, and $578.6 million aggregate principal amount of 2024 Notes, in exchange for $802.0 million aggregate principal amount of New 2025 Notes. |
The New 2024 Notes and New 2025 Notes will not be registered under the Securities Act of 1933, as amended (the “Securities Act”) or any state securities laws. As such, these notes may not be offered or sold in the United States absent registration or an applicable exemption from the registration requirements of the Securities Act and any applicable state securities laws.
At this time, we have not quantified the impact of the debt exchanges on our consolidated results of operations for the quarterly and year-to-date periods ending September 30, 2018.
54
WINDSTREAM HOLDINGS, INC.
WINDSTREAM SERVICES, LLC
FORM 10-Q
PART I - FINANCIAL INFORMATION
Item 2. Management’s Discussion and Analysis of Financial Condition and Results of Operations
Unless the context indicates otherwise, the terms “Windstream,” “we,” “us” or “our” refer to Windstream Holdings, Inc. and its subsidiaries, including Windstream Services, LLC, and the term “Windstream Services” refers to Windstream Services, LLC and its subsidiaries.
The following sections provide an overview of our results of operations and highlight key trends and uncertainties in our business. Certain statements constitute forward-looking statements. See “Forward-Looking Statements” at the end of this discussion for additional factors relating to such statements, and see “Risk Factors” in Item 1A of Part I of our Annual Report on Form 10-K for the year ended December 31, 2017, filed with the Securities and Exchange Commission (“SEC”) on February 28, 2018, for a discussion of certain risk factors applicable to our business, financial condition and results of operations.
ORGANIZATIONAL STRUCTURE
Windstream Holdings, Inc. (“Windstream Holdings”) is a publicly traded holding company and the parent of Windstream Services, LLC (“Windstream Services”). Windstream Holdings common stock trades on the NASDAQ Global Select Market (“NASDAQ”) under the ticker symbol “WIN”. Windstream Holdings owns a 100 percent interest in Windstream Services. Windstream Services and its guarantor subsidiaries are the sole obligors of all outstanding debt obligations and, as a result, also file periodic reports with the SEC. Windstream Holdings is not a guarantor of nor subject to the restrictive covenants included in any of Windstream Services’ debt agreements. The Windstream Holdings board of directors and officers oversee both companies.
There are no significant differences between the consolidated results of operations, financial condition, and cash flows of Windstream Holdings and those of Windstream Services other than for certain expenses directly incurred by Windstream Holdings principally consisting of audit, legal and board of director fees, NASDAQ listing fees, other shareholder-related costs, income taxes, common stock activity, and payables from Windstream Services to Windstream Holdings. For the three and six month periods ended June 30, 2018, the amount of pretax expenses directly incurred by Windstream Holdings were approximately $0.7 million and $1.2 million, respectively. compared to $0.8 million and $1.1 million for the same period in 2017. On an after-tax basis, expenses incurred directly by Windstream Holdings were approximately $0.5 million and $0.9 million for the three and six month periods ended June 30, 2018 compared to $0.5 million and $0.7 million in 2017. Unless otherwise indicated, the following discussion of our business strategy, trends and results of operations pertain to both Windstream Holdings and Windstream Services.
ACQUISITIONS COMPLETED IN 2017 AND 2018
On March 27, 2018, Windstream Holdings acquired MASS Communications (“MASS”), a privately held telecommunications network management company focused on providing custom engineered voice, data and networking solutions to small and mid-sized global enterprises in the financial, legal, healthcare, technology, education and government sectors, for $37.6 million in cash.
On July 28, 2017, Windstream Holdings completed its merger with Broadview Networks Holdings, Inc. (“Broadview”), a leading provider of cloud-based unified communications solutions to small and medium-sized businesses and offers a broad suite of cloud-based services. Broadview’s proprietary OfficeSuite® and unified communications platforms are complementary to our existing Software Defined Wide Area Networking (“SD-WAN”) product offering. In addition, Broadview has an experienced sales force and strong channel partner program, which we will leverage to sell unified communications services across our small business and mid-market enterprise customer bases. In the merger, Windstream added approximately 20,000 small and medium-sized business customers and approximately 3,000 incremental route fiber miles. Windstream Services paid $69.8 million in cash to Broadview shareholders and assumed $160.2 million of Broadview’s short-term debt obligations, which Windstream Services subsequently repaid using amounts available under its senior secured revolving credit facility. The transaction was valued at approximately $230.0 million.
55
On February 27, 2017, Windstream Holdings completed its merger with EarthLink Holdings Corp. (“EarthLink”), a leading provider of data, voice and managed network services to retail and wholesale business customers and nationwide Internet access and related value-added services to residential customers. In the merger, Windstream added approximately 700,000 customers and approximately 16,000 incremental route fiber miles. In effecting the merger, each share of EarthLink common stock was exchanged for .1636 shares of Windstream Holdings common stock, on a post-reverse stock split basis. In the aggregate, Windstream Holdings issued approximately 18.6 million shares of its common stock and assumed approximately $435.3 million of EarthLink’s long-term debt, which we subsequently refinanced, in a transaction valued at approximately $1.1 billion.
In completing these acquisitions, we have increased our operating scale and scope giving us the ability to offer customers expanded products, services and enhanced enterprise solutions over an extensive national footprint now spanning approximately 150,000 fiber route miles. We also expect to achieve operating and capital expense synergies in integrating the operations of MASS, Broadview and EarthLink.
For additional information regarding these acquisitions, including our repayment of Broadview’s short-term debt and refinancing of EarthLink’s long-term debt obligations, see Notes 3 and 5 to the consolidated financial statements.
OVERVIEW
We are a leading provider of advanced network communications and technology solutions for businesses across the U.S. We also offer broadband, entertainment and security solutions to consumers and small businesses primarily in rural areas in 18 states. Additionally, we supply core transport solutions on a local and long-haul fiber network spanning approximately 150,000 miles.
Our vision is to provide a best-in-class customer experience through our network, our applications and our people. Our “network first” strategy entails leveraging our existing infrastructure and investing in the latest technologies to create significant value for both our customers and our shareholders.
EXECUTIVE SUMMARY
We have a focused operational strategy with the overall objective to generate strong financial returns for our investors by leveraging our existing network and grow adjusted OIBDA, which is defined as operating income plus depreciation and amortization and goodwill impairment, adjusted to exclude the impact of the merger, integration and other costs, restructuring charges, pension expense, share-based compensation, business transformation expenses and costs related to network optimization projects. To advance our overall business strategy in 2018, our five key priorities are as follows:
• | Advance our industry-leading Windstream Enterprise & Wholesale product and service capabilities. Our sales strategy is focused on our SD-WAN and unified communications product offerings, including OfficeSuite®, which has broad application across our customer base. We continue to advance our security and on-net solutions, as well as our professional services portfolio. We believe our strategic product set and on-net capabilities has us well positioned in the marketplace. |
• | Launch next-generation broadband deployment technologies that are both faster and more cost-effective. We continue to deploy faster broadband speeds throughout our service territories. |
• | Simplify our business and transform customer-facing and internal user capabilities. We continue to integrate our information technology platforms to allow us to more efficiently manage our product catalog, price quoting and order management systems, as well as eliminate duplicative systems and generate meaningful cost savings. |
We remain on track to successfully complete the integration of the acquired EarthLink and Broadview operations to meet our goal of $180 million in annualized synergies by the end of 2019.
• | Drive revenue improvements through enhanced sales and improved customer retention in both our business units. Our Consumer & Small Business segment remains focused on improving our broadband market share while increasing speed and value-added service penetration for each broadband connection, while our Windstream Enterprise & Wholesale segment is focused on increasing strategic sales by leveraging our next generation products. In addition to our revenue objectives, we will continue to aggressively drive our on-going initiatives of network access reductions, automation of processes and enhanced organizational effectiveness, as we align our expenses to our revenue trajectory. |
• | Seek opportunities to optimize our balance sheet and improve our debt maturity profile. |
56
During the first six months of 2018, we achieved the following related to these initiatives:
• | Expanded our premium broadband availability to our Consumer & Small Business customers. Approximately 32 percent of our customer base now subscribe to rate plans offering 25 megabits per second (“Mbps”) speeds or faster compared to only 18 percent for the same period a year ago. This improvement in premium speed availability helped drive growth in net high-speed Internet customer additions, as we added 2,300 net high-speed Internet customers during the second quarter of 2018. Contribution margins in our Consumer & Small Business segment increased to 58.5 percent compared to 57.3 percent for the same period a year ago. |
• | Grew strategic sales in our Enterprise segment and increased our Enterprise contribution margin to 20.6 percent compared to 19.0 percent for the same period a year ago. |
• | During the second quarter of 2018, we grew contribution margins in our Wholesale and Consumer CLEC businesses through strong expense management. |
• | Executed on our initiative to transform our business operations and reduce operating costs including rebranding our Enterprise and Wholesale business unit, optimizing our network and aligning our workforce to improve productivity and reduce costs. In undertaking these initiatives, we incurred incremental rebranding and marketing expenses, network grooming costs associated with the relocation of traffic to existing lower-cost circuits and termination of existing contracts prior to their expiration and third-party consulting fees. We also completed restructurings of our workforce in January 2018 and during the second quarter of 2018 eliminating approximately 550 employees and an additional 90 positions that will drive cost savings of approximately $55 million in 2018. |
As further discussed in Note 16, on August 2, 2018, we completed various debt exchanges, which extended the maturities of $1.4 billion of our long-term debt obligations. In completing these refinancing transactions, we reduced our total long-term debt by $227.4 million and we now have no significant unsecured debt maturities until 2023.
Our consolidated operating results for the three and six month periods ended June 30, 2018 were favorably impacted by incremental revenues attributable to the acquisitions of MASS, Broadview and EarthLink. These increases were partially offset by reductions in consumer, small business and enterprise revenues primarily due to customer losses from competition and decreases in switched access revenues and federal USF surcharges due to the continuing adverse effects of inter-carrier compensation reform. When compared to the same period a year ago, operating results for the three and six month periods ended June 30, 2018 reflect higher depreciation and amortization expense of $8.3 million and $51.6 million, primarily attributable to the acquisitions, and additional interest costs of $10.0 million and $21.3 million, principally due to an increase in our long-term debt obligations in completing those acquisitions. Operating results for the three and six month periods ended June 30, 2017 included $13.4 million and $66.5 million of merger and integration expenses related to the acquisition of EarthLink compared to $6.6 million and $11.0 million for the three and six month periods ended June 30, 2018. Primarily due to the reduction in the statutory corporate tax rate from 35 percent to 21 percent effective January 1, 2018, the income tax benefit recorded on our pretax loss in the second quarter 2018 decreased $31.2 million compared to the income tax benefit recorded on our pretax loss in the same period a year ago.
57
CONSOLIDATED RESULTS OF OPERATIONS
The following table reflects the consolidated operating results of Windstream Holdings as of:
Three Months Ended June 30, | Increase (Decrease) | Six Months Ended June 30, | Increase (Decrease) | |||||||||||||||||||||||||||
(Millions) | 2018 | 2017 | Amount | % | 2018 | 2017 | Amount | % | ||||||||||||||||||||||
Revenues and sales: | ||||||||||||||||||||||||||||||
Service revenues | $ | 1,424.6 | $ | 1,465.6 | $ | (41.0 | ) | (3 | ) | $ | 2,860.0 | $ | 2,810.0 | $ | 50.0 | 2 | ||||||||||||||
Product sales | 19.8 | 26.0 | (6.2 | ) | (24 | ) | 38.7 | 47.3 | (8.6 | ) | (18 | ) | ||||||||||||||||||
Total revenues and sales | 1,444.4 | 1,491.6 | (47.2 | ) | (3 | ) | 2,898.7 | 2,857.3 | 41.4 | 1 | ||||||||||||||||||||
Costs and expenses: | ||||||||||||||||||||||||||||||
Cost of services (a) | 722.8 | 750.7 | (27.9 | ) | (4 | ) | 1,459.7 | 1,434.5 | 25.2 | 2 | ||||||||||||||||||||
Cost of products sold | 18.2 | 29.7 | (11.5 | ) | (39 | ) | 35.0 | 50.5 | (15.5 | ) | (31 | ) | ||||||||||||||||||
Selling, general and administrative | 224.5 | 226.4 | (1.9 | ) | (1 | ) | 453.3 | 440.2 | 13.1 | 3 | ||||||||||||||||||||
Depreciation and amortization | 370.7 | 362.4 | 8.3 | 2 | 752.5 | 700.9 | 51.6 | 7 | ||||||||||||||||||||||
Merger, integration and other costs | 14.1 | 16.4 | (2.3 | ) | (14 | ) | 21.4 | 73.7 | (52.3 | ) | (71 | ) | ||||||||||||||||||
Restructuring charges | 5.8 | 3.5 | 2.3 | 66 | 19.5 | 10.9 | 8.6 | 79 | ||||||||||||||||||||||
Total costs and expenses | 1,356.1 | 1,389.1 | (33.0 | ) | (2 | ) | 2,741.4 | 2,710.7 | 30.7 | 1 | ||||||||||||||||||||
Operating income | 88.3 | 102.5 | (14.2 | ) | (14 | ) | 157.3 | 146.6 | 10.7 | 7 | ||||||||||||||||||||
Other income, net | 12.0 | 4.2 | 7.8 | * | 9.7 | 6.8 | 2.9 | * | ||||||||||||||||||||||
Net loss on early extinguishment of debt | — | — | — | * | — | (3.2 | ) | 3.2 | 100 | |||||||||||||||||||||
Interest expense | (224.4 | ) | (214.4 | ) | 10.0 | 5 | (447.5 | ) | (426.2 | ) | 21.3 | 5 | ||||||||||||||||||
Loss before income taxes | (124.1 | ) | (107.7 | ) | 16.4 | 15 | (280.5 | ) | (276.0 | ) | 4.5 | 2 | ||||||||||||||||||
Income tax benefit | (30.4 | ) | (39.6 | ) | (9.2 | ) | (23 | ) | (65.4 | ) | (96.6 | ) | (31.2 | ) | (32 | ) | ||||||||||||||
Net loss | $ | (93.7 | ) | $ | (68.1 | ) | $ | 25.6 | 38 | $ | (215.1 | ) | $ | (179.4 | ) | $ | 35.7 | 20 | ||||||||||||
* Not meaningful
(a) | Excludes depreciation and amortization included below. |
A detailed discussion and analysis of our consolidated operating results is presented below.
58
Service Revenues
The following table reflects the primary drivers of the changes in service revenues compared to the same periods a year ago:
Three Months Ended June 30, 2018 | Six Months Ended June 30, 2018 | ||||||||||||
Increase (Decrease) | Increase (Decrease) | ||||||||||||
(Millions) | Amount | % | Amount | % | |||||||||
Increases attributable to acquisitions | $ | 60.4 | $ | 258.9 | |||||||||
Decreases in Consumer CLEC revenues (a) | (0.4 | ) | (1.1 | ) | |||||||||
Decreases in Wholesale revenues (b) | (17.3 | ) | (36.4 | ) | |||||||||
Decreases in Consumer & Small Business revenues (c) | (28.3 | ) | (53.0 | ) | |||||||||
Decreases in Enterprise revenues (d) | (55.4 | ) | (118.4 | ) | |||||||||
Net change in service revenues | $ | (41.0 | ) | (3 | ) | $ | 50.0 | 2 | |||||
(a) | Decreases were primarily due to reductions in traditional voice, long-distance and data and integrated services due to increased customer churn attributable to the effects of competition, as well as declines in long-distance usage. |
(b) | Decreases were primarily due to declining demand for dedicated copper-based circuits, as carriers continue to migrate traffic to fiber-based connections. |
(c) | Decreases were primarily from reductions in both Consumer & Small Business voice-only revenues attributable to a decline in customers due to the impacts of competition as well as reductions in switched access revenues and federal USF surcharges due to the impacts of inter-carrier compensation reform. |
(d) | Decreases were primarily due to reductions in voice, long-distance, and Internet service revenues attributable to a declining customer base, reflecting the effects of competition. |
See “Segment Operating Results” for a further discussion of changes in Consumer & Small Business, Enterprise, Wholesale and Consumer CLEC Business revenues.
Product Sales
Product sales consist of sales of various types of communications equipment to our customers. We also sell network equipment to contractors on a wholesale basis. Enterprise product sales includes high-end data and communications equipment which facilitate the delivery of advanced data and voice services to our enterprise customers. Consumer product sales include home networking equipment, computers and phones.
The following table reflects the primary drivers of the changes in product sales compared to the same periods a year ago:
Three Months Ended June 30, 2018 | Six Months Ended June 30, 2018 | |||||||||||||
Increase (Decrease) | Increase (Decrease) | |||||||||||||
(Millions) | Amount | % | Amount | % | ||||||||||
Increases attributable to acquisitions | $ | 0.4 | $ | 1.0 | ||||||||||
Decreases in Enterprise product sales (a) | (2.5 | ) | (2.3 | ) | ||||||||||
Decreases in Consumer & Small Business product sales (b) | (4.1 | ) | (7.3 | ) | ||||||||||
Net decreases in product sales | $ | (6.2 | ) | (24 | ) | $ | (8.6 | ) | (18 | ) | ||||
(a) | Decreases were primarily due to lower equipment installations. |
(b) | Decreases were primarily due to declines in sales of network equipment on a wholesale basis to contractors due to lower demand. |
59
Cost of Services
Cost of services expense primarily consists of charges incurred for network operations, interconnection, bad debt and business taxes. Network operations charges include salaries and wages, materials, contractor costs, IT support and costs to lease certain network facilities. Interconnection consists of charges incurred to access the public switched network and transport traffic to the Internet, including charges paid to other carriers for access points where we do not own the primary network infrastructure. Other expenses consist of third-party costs for ancillary voice and data services, business and financial services, bad debt and business taxes.
The following table reflects the primary drivers of the changes in cost of services compared to the same periods a year ago:
Three Months Ended June 30, 2018 | Six Months Ended June 30, 2018 | ||||||||||||
Increase (Decrease) | Increase (Decrease) | ||||||||||||
(Millions) | Amount | % | Amount | % | |||||||||
Increases attributable to acquisitions | $ | 31.2 | $ | 154.9 | |||||||||
Decreases in federal USF expense | (2.4 | ) | (1.9 | ) | |||||||||
Decreases in pension expense | (1.6 | ) | (2.8 | ) | |||||||||
Decreases in network operations (a) | (12.1 | ) | (25.2 | ) | |||||||||
Decreases in other expenses (b) | (11.6 | ) | (27.9 | ) | |||||||||
Decreases in interconnection expense (c) | (31.4 | ) | (71.9 | ) | |||||||||
Net change in cost of services | $ | (27.9 | ) | (4 | ) | $ | 25.2 | 2 | |||||
(a) | Decreases in network operations reflects reduced labor costs, primarily attributable to workforce reductions completed during 2017 and 2018, partially offset by higher leased network facilities costs attributable to expansion of our fiber transport network. |
(b) | Decreases reflect reduced labor costs, primarily attributable to workforce reductions completed during 2017 and 2018, partially offset by incremental network optimization costs of $6.2 million and $11.6 million for the three and six month periods ended June 30, 2018, respectively, incurred in migrating traffic to existing lower costs circuits and terminating contracts prior to their expiration. |
(c) | Decreases in interconnection expense were primarily attributable to rate reductions and cost improvements from the continuation of network efficiency projects, increased customer churn, and lower long distance usage, partially offset by an increase in higher capacity circuits to service existing customers and increase the transport capacity of our network. |
Cost of Products Sold
Cost of products sold represents the cost of equipment sales to customers. The changes in cost of products sold were generally consistent with the change in product sales.
The following table reflects the primary drivers of the changes in cost of products sold compared to the same periods a year ago:
Three Months Ended June 30, 2018 | Six Months Ended June 30, 2018 | |||||||||||||
Increase (Decrease) | Increase (Decrease) | |||||||||||||
(Millions) | Amount | % | Amount | % | ||||||||||
Decreases in product sales to Enterprise customers | $ | (6.4 | ) | $ | (7.3 | ) | ||||||||
Decreases in product sales to Consumer & Small Business customers | (5.1 | ) | (8.2 | ) | ||||||||||
Net decreases in cost of products sold | $ | (11.5 | ) | (39 | ) | $ | (15.5 | ) | (31 | ) | ||||
60
Selling, General and Administrative (“SG&A”)
SG&A expenses result from sales and marketing efforts, advertising, IT support, costs associated with corporate and other support functions and professional fees. These expenses include salaries, wages and employee benefits not directly associated with the provisioning of services to our customers.
The following table reflects the primary drivers of the changes in SG&A expenses compared to the same periods a year ago:
Three Months Ended June 30, 2018 | Six Months Ended June 30, 2018 | ||||||||||||
Increase (Decrease) | Increase (Decrease) | ||||||||||||
(Millions) | Amount | % | Amount | % | |||||||||
Increases attributable to acquisitions | $ | 15.6 | $ | 50.7 | |||||||||
Increases due to business transformation expenses (a) | 12.1 | 20.8 | |||||||||||
Decreases in sales and marketing expenses | (1.3 | ) | (0.6 | ) | |||||||||
Decreases in medical insurance | (2.5 | ) | (5.3 | ) | |||||||||
Decreases in share-based compensation | (3.2 | ) | (6.5 | ) | |||||||||
Decreases in other costs (b) | (10.8 | ) | (14.5 | ) | |||||||||
Decreases in salaries and other benefits (c) | (11.8 | ) | (31.5 | ) | |||||||||
Net change in SG&A | $ | (1.9 | ) | (1 | ) | $ | 13.1 | 3 | |||||
(a) | These expenses consist of third-party consulting fees. |
(b) | Decreases primarily due to reductions in corporate overhead expenses resulting from cost initiatives designed to reduce operating expenses. |
(c) | Decreases were primarily due to reduced labor costs, primarily attributable to workforce reductions completed during 2017 and 2018. |
Depreciation and Amortization Expense
Depreciation and amortization expense includes the depreciation of property, plant and equipment and the amortization of intangible assets. The following table reflects the primary drivers of the changes in depreciation and amortization expense compared to the same periods a year ago:
Three Months Ended June 30, 2018 | Six Months Ended June 30, 2018 | |||||||||||
Increase (Decrease) | Increase (Decrease) | |||||||||||
(Millions) | Amount | % | Amount | % | ||||||||
Increases attributable to acquisitions | $ | 3.0 | $ | 40.8 | ||||||||
Increases in depreciation expense (a) | 12.0 | 24.1 | ||||||||||
Decreases in amortization expense (b) | (6.7 | ) | (13.3 | ) | ||||||||
Net increases in depreciation and amortization expense | $ | 8.3 | 2 | $ | 51.6 | 7 | ||||||
(a) | Increases were primarily due to additions of property, plant and equipment. |
(b) | Decreases reflect the use of the sum-of-the-years-digits method for customer lists. The effect of using an accelerated amortization method results in an incremental decline in expense each period as the intangible assets amortize. |
61
Merger, Integration and Other Costs and Restructuring Charges
We incur costs to complete a merger or acquisition and integrate its operations into our business, which are presented as merger and integration expense in our consolidated results of operations. These costs include transaction costs, such as accounting, legal, consulting and broker fees; severance and related costs; IT and network conversion; rebranding and marketing; and contract termination fees. During 2017, we incurred investment banking fees, legal, accounting and other consulting fees, severance and employee benefit costs, contract and lease termination costs, and other integration expenses related to the merger with EarthLink. During the fourth quarter of 2017, we completed a network optimization project designed to consolidate traffic onto network facilities operated by us and reduce the usage of other carriers’ networks in our acquired CLEC markets. In undertaking this initiative, we incurred in the first half of 2017, exit costs to migrate traffic to existing lower cost circuits and to terminate existing contracts prior to their expiration.
Restructuring charges are primarily incurred as a result of evaluations of our operating structure. Among other things, these evaluations explore opportunities to provide greater flexibility in managing and financing existing and future strategic operations, for task automation and the balancing of our workforce based on the current needs of our customers. Severance, lease exit costs and other related charges are included in restructuring charges.
During the first half of 2018, we completed restructurings of our workforce to improve our overall cost structure and gain operational efficiencies. In undertaking these efforts, we eliminated approximately 550 employees and incurred a restructuring charge of $18.9 million, consisting of severance and employee benefit costs. During the first half of 2017, we completed reductions in our workforce eliminating approximately 375 positions in our ILEC small business and enterprise segments as well as in our engineering, finance and information technology workgroups to more efficiently manage our operations. In completing these workforce reductions, we incurred severance and other employee benefit costs of $10.5 million.
Set forth below is a summary of merger, integration and other costs and restructuring charges:
Three Months Ended June 30, | Six Months Ended June 30, | |||||||||||||||
(Millions) | 2018 | 2017 | 2018 | 2017 | ||||||||||||
Merger, integration and other costs: | ||||||||||||||||
Information technology conversion costs | $ | 0.2 | $ | 0.6 | $ | 0.6 | $ | 1.5 | ||||||||
Costs related to merger with EarthLink (a) | 6.6 | 13.4 | 11.0 | 66.5 | ||||||||||||
Costs related to merger with Broadview (b) | 1.5 | — | 3.4 | — | ||||||||||||
Costs related to acquisition of MASS | 0.6 | — | 1.2 | — | ||||||||||||
Network optimization and contract termination costs | — | 1.6 | — | 4.9 | ||||||||||||
Legal fees related to REIT spin-off litigation (see Note 15) | 4.8 | 0.5 | 4.8 | 0.5 | ||||||||||||
Other costs | 0.4 | 0.3 | 0.4 | 0.3 | ||||||||||||
Total merger, integration and other costs | 14.1 | 16.4 | 21.4 | 73.7 | ||||||||||||
Restructuring charges | 5.8 | 3.5 | 19.5 | 10.9 | ||||||||||||
Total merger, integration and other costs and restructuring charges | $ | 19.9 | $ | 19.9 | $ | 40.9 | $ | 84.6 | ||||||||
(a) | For the three and six month periods ended June 30, 2018, these amounts include severance and employee benefit costs for EarthLink employees terminated after the Merger of $1.8 million and $4.8 million, respectively, contract and lease termination costs of $4.0 million and $4.8 million, respectively, as a result of vacating certain facilities related to the acquired operations of EarthLink, and other miscellaneous expenses of $0.8 million and $1.4 million, respectively. |
Comparatively, during the three and six month periods ended June 30, 2017, severance and employee benefit costs for EarthLink employees terminated after the Merger were $5.0 million and $29.5 million, respectively. Share-based compensation expense of $5.4 million and $9.8 million attributable to the accelerated vesting of replacement equity awards for terminated EarthLink employees and other miscellaneous expenses of $3.0 million and $4.4 million, respectively. For the six month period of 2017, we also incurred investment banking, legal, accounting and other consulting fees of $22.8 million,
(b) | Includes severance and employee benefit costs for Broadview employees terminated after the acquisition of $1.9 million and other miscellaneous expenses of $1.5 million. |
62
Summary of Liability Activity Related to Both Merger, Integration and Other Costs and Restructuring Charges
As of June 30, 2018, we had unpaid merger, integration and other costs and restructuring liabilities totaling $20.7 million, which consisted of $5.7 million associated with restructuring initiatives and $15.0 million related to merger and integration activities, which are included in other current liabilities in the accompanying consolidated balance sheet. Payments of these liabilities will be funded through operating cash flows (see Note 10).
Operating Income
Operating income decreased $14.2 million, or 14 percent, and increased $10.7 million, or 7 percent, during the three and six month periods ended June 30, 2018, respectively, as compared to the same periods in 2017. The decrease in the three month period of 2018 primarily reflects reductions in consumer and enterprise revenues, wholesale services and switched access revenues due to customer losses from the effects of competition, declining demand for copper-based circuits to towers and the adverse effects of intercarrier compensation reform, respectively. Higher depreciation and amortization expense of $8.3 million primarily attributable to acquisitions, additional restructuring charges of $2.3 million incurred with workforce reductions and incremental business transformation expenses consisting of consulting fees of $12.1 million and $6.2 million of incremental network optimization costs incurred in migrating traffic to existing lower cost circuits and terminating contracts prior to their expiration also contributed to the decrease in operating income in the second quarter of 2018. The increase in the six-month period of 2018 was primarily due to a reduction in merger, integration and other costs of $52.3 million and incremental operating income, excluding depreciation and amortization of $40.8 million attributable to the acquisitions. The increase was partially offset by higher depreciation and amortization expense of $51.6 million primarily attributable to the acquisitions, additional restructuring charges of $8.6 million incurred with workforce reductions and incremental business transformation expenses consisting of consulting fees of $20.8 million, $3.1 million of incremental marketing and rebranding costs, and $11.6 million of incremental network optimization costs.
Other Income, Net
The components of other income, net were as follows:
Three Months Ended June 30, | Six Months Ended June 30, | |||||||||||||||
(Millions) | 2018 | 2017 | 2018 | 2017 | ||||||||||||
Loss on disposal of data center operations | $ | (0.6 | ) | $ | — | $ | (7.9 | ) | $ | — | ||||||
Non-operating pension income | 13.2 | 4.5 | 18.5 | 6.6 | ||||||||||||
Non-operating postretirement benefits expense | (0.1 | ) | (0.2 | ) | (0.3 | ) | (0.4 | ) | ||||||||
Other, net | (0.5 | ) | (0.1 | ) | (0.6 | ) | 0.6 | |||||||||
Other income, net | $ | 12.0 | $ | 4.2 | $ | 9.7 | $ | 6.8 | ||||||||
Net Loss on Early Extinguishment of Debt
During the first quarter of 2017, Windstream Services refinanced EarthLink’s long-term debt obligations that were assumed in the Merger. In repaying these debt obligations prior to their maturity, Windstream Services recognized a pre-tax loss of $(2.0) million. Windstream Services also repaid term loan Tranche B5 of its senior secured credit facility through the issuance of a new term loan under Tranche B7, which effectively extended the maturity of the term loan from 2019 to 2024. In completing this refinancing, Windstream recognized a pre-tax loss of $(1.2) million.
The net loss on early extinguishment of debt for the six months ended June 30, 2017 was as follows:
(Millions) | Six Months Ended June 30, 2017 | |||||||||
Loss on early extinguishment of EarthLink 2019 and 2020 Notes | $ | (2.0 | ) | |||||||
Loss on early extinguishment of senior secured credit facility | (1.2 | ) | ||||||||
Net loss on early extinguishment of debt | $ | (3.2 | ) | |||||||
63
Interest Expense
Set forth below is a summary of interest expense:
Three Months Ended June 30, | Six Months Ended June 30, | |||||||||||||||
(Millions) | 2018 | 2017 | 2018 | 2017 | ||||||||||||
Senior secured credit facility, Tranche B | $ | 28.3 | $ | 25.9 | $ | 53.9 | $ | 48.6 | ||||||||
Senior secured credit facility, revolving line of credit | 11.7 | 6.6 | 20.7 | 11.8 | ||||||||||||
Secured 2025 Notes | 14.0 | — | 27.8 | — | ||||||||||||
Senior unsecured notes | 50.0 | 54.1 | 101.8 | 108.2 | ||||||||||||
Notes issued by subsidiaries | 1.7 | 1.8 | 3.4 | 5.7 | ||||||||||||
Interest expense - long-term lease obligations: | ||||||||||||||||
Telecommunications network assets | 117.4 | 121.7 | 235.9 | 244.5 | ||||||||||||
Real estate contributed to pension plan | 1.6 | 1.6 | 3.1 | 3.1 | ||||||||||||
Impacts of interest rate swaps | (0.6 | ) | 3.2 | — | 6.0 | |||||||||||
Interest on capital leases and other | 1.0 | 1.3 | 2.5 | 2.4 | ||||||||||||
Less capitalized interest expense | (0.7 | ) | (1.8 | ) | (1.6 | ) | (4.1 | ) | ||||||||
Total interest expense | $ | 224.4 | $ | 214.4 | $ | 447.5 | $ | 426.2 | ||||||||
Interest expense increased $10.0 million, or 5 percent, and $21.3 million, or 5 percent, for the three and six month periods ended June 30, 2018, respectively, as compared to the same periods in 2017. The increase in 2018 was primarily due to the issuance of the secured 2025 Notes and additional interest costs attributable to incremental borrowings under the senior secured credit facility. These increases were partially offset by lower interest expense associated with the long-term lease obligation under the master lease with Uniti of $4.3 million and $8.6 million in the three and six month periods ended June 30, 2018, due to a larger portion of the monthly lease payment being recorded as a reduction to the long-term lease obligation in applying the effective interest method over the initial term of the master lease.
Income Taxes
During the three and six month periods ended June 30, 2018 we recognized income tax benefits of $30.4 million and $65.4 million, respectively, as compared to income tax benefits of $39.6 million and $96.6 million, respectively, for the same periods in 2017.The income tax benefits recorded in both periods of 2018 reflected the loss before taxes recognized in each period. The income tax benefit recorded in the six-month period of 2018 was offset by discrete tax expense of $3.3 million associated with the vesting of restricted stock. Comparatively, the income tax benefit recorded in the six-month period of 2017 was offset by discrete tax expense of $6.1 million for nondeductible transaction costs associated with the merger with EarthLink and discrete tax expense of $2.5 million associated with the vesting of restricted stock. Our effective tax rates were 24.5 percent and 23.3 percent, respectively, for the three and six month periods ended June 30, 2018, as compared to 36.8 percent and 35.0 percent, respectively, in the same periods in 2017. The decreases in our effective tax rates were due primarily to the reduction of the corporate tax rate from 35 percent to 21 percent as a result of the Tax Cuts and Jobs Act of 2017 ("2017 Tax Act") that was enacted on December 22, 2017. The effective rates for the six-month periods ended June 30, 2018 and 2017 were also impacted by the discrete items discussed above.
For 2018, our annualized effective income tax rate is expected to range between 25.0 percent and 26.0 percent, excluding one-time discrete items. Changes in our relative profitability, as well as recent and proposed changes to federal and state tax laws may cause the rate to change from historical rates. In determining our quarterly provision for income taxes, we use an estimated annual effective tax rate, which is based on our expected annual income, statutory rates and tax planning opportunities. Significant or unusual items are separately recognized in the quarter in which they occur.
64
On December 22, 2017, the SEC staff issued Staff Accounting Bulletin No. 118 (“SAB 118”) to address the application of U.S. GAAP in situations when a registrant does not have the necessary information available, prepared, or analyzed (including computations) in reasonable detail to complete the accounting for certain income tax effects of the 2017 Tax Act. We recognized provisional tax impacts related to the revaluation of deferred tax assets and liabilities in our consolidated financial statements for the year ended December 31, 2017. The ultimate impact may differ from those provisional amounts due to, among other things, additional analysis, changes in interpretations and assumptions we have made, additional regulatory guidance that may be issued, and actions we may take as a result of the 2017 Tax Act. Any adjustments made to the provisional amounts under SAB 118 will be recorded as discrete adjustments in the period identified (not to extend beyond the one-year measurement provided in SAB 118). During the six months ended June 30, 2018, we did not make any adjustments to the provisional amounts included in its consolidated financial statements for the year ended December 31, 2017.
SEGMENT OPERATING RESULTS
We disaggregate our operations between customers located in service areas in which we are the incumbent local exchange carrier (“ILEC”) and provide services over network facilities operated by us and those customers located in service areas in which we are a competitive local exchange carrier (“CLEC”) and provide services over network facilities primarily leased from other carriers. We have further disaggregated our CLEC operations between enterprise, wholesale and consumer customers. We operate and report the following four segments:
Consumer & Small Business – We manage as one business our residential and small business operations in those markets in which we are the ILEC due to the similarities with respect to service offerings, marketing strategies and customer service delivery. Products and services offered to customers include traditional local and long-distance voice services, high-speed Internet services, and value-added services such as security and online back-up, which are delivered primarily over network facilities operated by us. We offer consumer video services through relationships with DirecTV and Dish Network LLC and we also own and operate cable television franchises in some of our service areas. We offer Kinetic, a premium broadband and video entertainment offering in several of our markets.
Residential customers can bundle voice, high-speed Internet and video services, to provide one convenient billing solution and receive bundle discounts. Small Business services offer a wide range of advanced Internet, voice, and web conferencing products. These services are equipped to deliver high-speed Internet with competitive speeds, value added services to enhance business productivity and options to bundle services for a global business solution to meet our small business customer needs.
Enterprise – Products and services offered to our business customers include integrated voice and data services, which deliver voice and broadband services over a single Internet connection, data transport services, multi-site networking services which provide a fast and private connection between business locations, Software Defined Wide Area Network (“SD-WAN”), which optimizes application performance, Unified Communications as a Service (“UCaaS”), a next generation voice solution, as well as a variety of other data services, including cloud computing and collocation and managed services as an alternative to traditional information technology infrastructure.
Wholesale – Our wholesale operations are focused on providing network bandwidth to other telecommunications carriers, network operators, and content providers. These services include special access services, which provide access and network transport services to end users, Ethernet and Wave transport up to 100 Gbps, and dark fiber and colocation services. Wholesale services also include fiber-to-the-tower connections to support the wireless backhaul market. In addition, we offer voice and data carrier services to other communications providers and to larger-scale purchasers of network capacity. We also offer traditional services including special access services and Time Division Multiplexing (“TDM”) private line transport. The combination of these services allow wholesale customers to provide voice and data services to their customers through the use of our network or in combination with their own networks.
Consumer CLEC – Products and services offered to customers include traditional voice and long-distance services, nationwide Internet access services, both dial-up and high-speed, as well as value added services including online backup and various e-mail services.
65
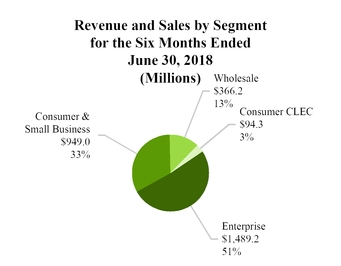
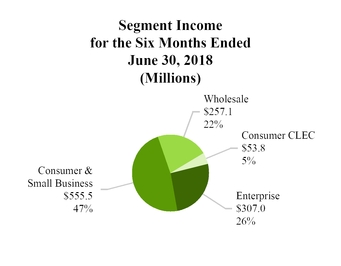
We evaluate performance of the segments based on contribution margin or segment income, which is computed as segment revenues and sales less segment operating expenses. Segment revenues are based upon each customer’s classification to an individual segment and include all services provided to that customer. Segment revenues also include revenue from federal and state universal service funds, CAF Phase II support, funds received from federal access recovery mechanisms, revenues from providing switched access services, including usage-based revenues from long-distance companies and other carriers for access to our network to complete long-distance calls, reciprocal compensation received from wireless and other local connecting carriers for the use of network facilities, certain surcharges assessed to our customers, including billings for our required contributions to federal and state USF programs, and product sales to contractors. There are no differences between total segment revenues and sales and total consolidated revenues and sales.
Segment expenses include specific expenses incurred as a direct result of providing services and products to segment customers; selling, general and administrative expenses that are directly associated with specific segment customers or activities; and certain allocated expenses which include network expenses, facilities expenses and other expenses, such as vehicle and real estate-related expenses. Operating expenses associated with regulatory and other revenues have also been assigned to our segments. We do not assign depreciation and amortization expense, goodwill impairment, merger, integration and other costs, restructuring charges, share-based compensation, pension costs, business transformation expenses and costs related to network optimization projects to our segments, because these expenses are centrally managed and are not monitored by or reported to the chief operating decision maker (“CODM”) by segment. Similarly, certain costs related to centrally-managed administrative functions, such as accounting and finance, information technology, network management, legal and human resources, are not assigned to our segments. Interest expense and net loss on early extinguishment of debt have also been excluded from segment operating results because we manage our financing activities on a total company basis and have not assigned any long-term debt obligations to the segments. Other income, net, and income tax benefit are not monitored as a part of our segment operations and, therefore, these items also have been excluded from our segment operating results.
See Note 13 to the consolidated financial statements for a reconciliation of segment income to consolidated net loss.
CONSUMER & SMALL BUSINESS SEGMENT
As of June 30, 2018, the Consumer & Small Business segment includes approximately 1.4 million residential and small business customers. This segment generated $949.0 million in revenue and $555.5 million in segment income, or contribution margin, during the first half of 2018.
Strategy
Within our Consumer & Small Business segment, we are focused on expanding and enhancing our broadband capabilities and product-set to provide a great customer experience, sustain average revenue per customer and increase market share.
Our 2017 network upgrades provide a great customer experience, which are helping sustain average revenue per customer per month and allow us to retain existing customers and increase our market share. We expect increases in real-time streaming video and traditional Internet usage to drive demand for faster broadband speeds and generate increased revenues as customers upgrade their services. We also sell value-added Internet services, such as security and online back-up, to leverage our broadband capabilities.
66
During the past twelve months, we have increased within our customer base the penetration of speeds of 25 Mbps or higher from approximately 18 percent to 32 percent. By the end of this year, we expect approximately 1.5 million households in our ILEC footprint will qualify for speeds of 50 Mbps or greater, representing almost 40 percent of our ILEC footprint.With the increased availability of premium broadband speeds, we have a significant opportunity to migrate customers to faster speeds, which we believe will reduce churn and improve the overall customer experience. We recently launched a new fixed wireless high-speed Internet technology in two of our ILEC exchanges, which delivers speeds up to 200 Mbps to eligible consumer households and small businesses. This deployment will allow us to meet CAF2 requirements in certain areas as well as to challenge the competition with faster speeds in the marketplace.
For 2018, we continue to focus on expanding and enhancing our broadband capabilities to provide a great customer experience, improve customer retention and grow market share by continuing to increase broadband speeds and capacity throughout our territories.
Consumer & Small Business Segment Results of Operations
The following table reflects the Consumer & Small Business segment results of operations:
Three Months Ended June 30, | Increase (Decrease) | Six Months Ended June 30, | Increase (Decrease) | |||||||||||||||||||||||||||
(Millions) | 2018 | 2017 | Amount | % | 2018 | 2017 | Amount | % | ||||||||||||||||||||||
Revenues and sales: | ||||||||||||||||||||||||||||||
Service revenues: | ||||||||||||||||||||||||||||||
High-speed Internet bundles (a) | $ | 254.3 | $ | 264.0 | $ | (9.7 | ) | (4 | ) | $ | 509.4 | $ | 530.1 | $ | (20.7 | ) | (4 | ) | ||||||||||||
Voice-only (b) | 30.7 | 33.5 | (2.8 | ) | (8 | ) | 62.1 | 67.1 | (5.0 | ) | (7 | ) | ||||||||||||||||||
Video and miscellaneous | 11.3 | 11.2 | 0.1 | 1 | 22.7 | 22.2 | 0.5 | 2 | ||||||||||||||||||||||
Total consumer | 296.3 | 308.7 | (12.4 | ) | (4 | ) | 594.2 | 619.4 | (25.2 | ) | (4 | ) | ||||||||||||||||||
Small business (c) | 76.5 | 81.4 | (4.9 | ) | (6 | ) | 154.6 | 164.8 | (10.2 | ) | (6 | ) | ||||||||||||||||||
Switched access (d) | 7.0 | 10.6 | (3.6 | ) | (34 | ) | 15.1 | 21.6 | (6.5 | ) | (30 | ) | ||||||||||||||||||
CAF Phase II funding and frozen federal USF (e) | 46.1 | 47.3 | (1.2 | ) | (3 | ) | 92.1 | 95.4 | (3.3 | ) | (3 | ) | ||||||||||||||||||
State USF and ARM support (e) | 23.9 | 29.6 | (5.7 | ) | (19 | ) | 48.1 | 56.8 | (8.7 | ) | (15 | ) | ||||||||||||||||||
End user surcharges (e) | 16.1 | 16.6 | (0.5 | ) | (3 | ) | 32.8 | 31.9 | 0.9 | 3 | ||||||||||||||||||||
Total service revenues | 465.9 | 494.2 | (28.3 | ) | (6 | ) | 936.9 | 989.9 | (53.0 | ) | (5 | ) | ||||||||||||||||||
Product sales (f) | 6.6 | 10.7 | (4.1 | ) | (38 | ) | 12.1 | 19.4 | (7.3 | ) | (38 | ) | ||||||||||||||||||
Total revenues and sales | 472.5 | 504.9 | (32.4 | ) | (6 | ) | 949.0 | 1,009.3 | (60.3 | ) | (6 | ) | ||||||||||||||||||
Costs and expenses (g) | 198.9 | 215.9 | (17.0 | ) | (8 | ) | 393.5 | 431.3 | (37.8 | ) | (9 | ) | ||||||||||||||||||
Segment income | $ | 273.6 | $ | 289.0 | $ | (15.4 | ) | (5 | ) | $ | 555.5 | $ | 578.0 | $ | (22.5 | ) | (4 | ) | ||||||||||||
(a) | Decreases due to fewer broadband units in service as further discussed below and the effects of implementing new lower priced acquisition and customer retention rate plans. |
(b) | Decreases in voice-only revenues were primarily due to fewer voice only lines in service consistent with the declines in households served as further discussed below. |
(c) | Decreases were primarily attributable to lower usage for voice-only and high-speed Internet services previously driven by declines in customers due to the impacts of competition. |
(d) | Switched access revenues include usage sensitive revenues from long-distance companies and other carriers for access to our network in connection with the completion of long-distance calls, as well as reciprocal compensation received from wireless and other local connecting carriers for use of our network facilities. Decreases were primarily due to the effects of inter-carrier compensation reform. See “Regulatory Matters” for a further discussion. |
(e) | Universal Service Fund (“USF”) revenues are government subsidies designed to partially offset the cost of providing wireline services in high-cost areas. CAF Phase II funding is provided for the purpose of expanding and supporting broadband service in rural areas and effectively replaces frozen federal USF support in those states in which we elected to receive the CAF Phase II funding. The access recovery mechanism (“ARM”) is additional federal universal service support available to help mitigate revenue losses from inter-carrier compensation reform not covered by the access |
67
recovery charge (“ARC”). The decreases in state USF, and ARM support, as well as the decline in USF surcharge revenues was primarily due to the effects of inter-carrier compensation reform. See “Regulatory Matters” for a further discussion of state and federal regulatory actions impacting these revenues and our election of CAF Phase II funding.
(f) | Decreases were primarily due to declines in sales of network equipment on a wholesale basis to contractors due to lower demand. |
(g) | Decreases were primarily due to reductions in contract labor and interconnection expense, reflecting lower voice-only revenues due to the decline in households served. Decreases also reflect reduced labor costs attributable to workforce reductions completed during the quarter. |
The following table reflects the Consumer & Small Business segment operating metrics:
Six Months Ended June 30, | Increase (Decrease) | ||||||||||||||||||
(Thousands) | 2018 | 2017 | Amount | % | |||||||||||||||
Consumer Operating Metrics: | |||||||||||||||||||
Households served (a) | 1,251.3 | 1,307.8 | (56.5 | ) | (4 | ) | |||||||||||||
High-speed Internet customers (b) | 1,006.7 | 1,025.8 | (19.1 | ) | (2 | ) | |||||||||||||
Digital television customers (c) | 256.6 | 300.7 | (44.1 | ) | (15 | ) | |||||||||||||
Small Business customers (d) | 123.2 | 134.1 | (10.9 | ) | (8 | ) | |||||||||||||
(a) | Decrease in the number of consumer households served was primarily attributable to the effects of competition from wireless carriers, cable companies and other providers using emerging technologies. For the three and six month periods ended June 30, 2018, consumer households served decreased by 6,000 and 17,500, respectively, compared to decreases of 29,700 and 46,800, respectively, for the same periods in 2017. |
(b) | Decrease in consumer high-speed Internet customers was primarily due to the effects of competition from other service providers and increased penetration in the marketplace, as the number of households without high-speed Internet service continues to shrink. As of June 30, 2018, we provided high-speed Internet service to approximately 85 percent of our primary residential lines in service and approximately 77 percent of our total voice lines had high-speed Internet competition, primarily from cable service providers. For the three and six month periods ended June 30, 2018, consumer high-speed Internet customers increased by 2,300 and 100, respectively, compared to decreases of 21,800 and 25,300, respectively, for the same periods in 2017. |
(c) | For the three and six month periods ended June 30, 2018, digital television customers decreased by 10,500 and 21,300, respectively, compared to decreases of 9,300 and 20,300, respectively, for the same period in 2017, primarily due to competition from other service providers. |
(d) | Decrease in small business customers was primarily due to competition from cable companies. For the three and six month periods ended June 30, 2018, small business customers decreased by 1,800 and 4,900, respectively, compared to decreases of 2,700 and 5,600, respectively, for the same period in 2017. |
We expect the number of consumer households, consumer high-speed Internet customers, digital television subscribers and small business customers in our ILEC footprint to continue to be impacted by the effects of competition. To slow losses in our high-speed customer base, we began matching certain promotional pricing offerings from a cable competitor in several key markets late in the second quarter of 2017 and also increased our marketing and advertising efforts.
ENTERPRISE SEGMENT
Our Enterprise segment provides advanced communications services to enterprise customers. During the first half of 2018, the Enterprise segment generated $1,489.2 million in revenue and $307.0 million in contribution margin.
Strategy
The strategy for our Enterprise business segment is to increase contribution margin, grow revenue by expanding our portfolio of next-generation products, expand our metro fiber and fixed wireless network assets, reduce costs and improve the customer
68
experience. As one of the country’s largest service providers with a nationwide network and broad portfolio of next-generation solutions, coupled with a highly responsive service model, we are well positioned to enable our customers transition to the cloud.
We target mid and large-size enterprise customers that consider their network and communication infrastructure as critical in operating their business. We support some of the most demanding IT organizations within the retail, healthcare, financial services, manufacturing, government and education sectors. We will continue to sharpen our focus on these markets in offering solutions tailored to enable businesses to compete more effectively in the digital economy.
We believe we can continue to drive meaningful improvements in our Enterprise margins by proactively migrating our existing customers to new solutions and by attracting new business customers seeking network upgrades required to support their expanding digital strategies.
We will continue to exploit opportunities to leverage our own network facilities to reduce third-party network access costs. We will also continue to improve employee productivity with targeted system and process enhancements. To grow profitability, we are focused on leveraging the latest technology in offering next-generation products that deliver significant value to our customers while also generating strong incremental sales margins. SD-WAN and UCaaS represent two examples of next-generation solutions where we are seeing significant sales and revenue growth. During the second quarter of 2018, sales from SD-WAN, UCaaS and other on-net services comprised more than 50 percent of our total Enterprise sales. In addition, we expect to improve operating efficiencies and enhance the customer experience by further integrating our internal processes in sales, service delivery, customer care and repair. Furthermore, we continue to follow an aggressive expense management and capital efficient strategy to drive reductions in network access costs, create on-network sales opportunities and improve our competitiveness in the marketplace.
Enterprise Segment Results of Operations
The following table reflects the Enterprise segment results of operations:
Three Months Ended June 30, | Increase (Decrease) | Six Months Ended June 30, | Increase (Decrease) | |||||||||||||||||||||||||||
(Millions) | 2018 | 2017 | Amount | % | 2018 | 2017 | Amount | % | ||||||||||||||||||||||
Revenues and sales: | ||||||||||||||||||||||||||||||
Service revenues: | ||||||||||||||||||||||||||||||
Voice and long-distance (a) | $ | 240.2 | $ | 240.4 | $ | (0.2 | ) | — | $ | 483.0 | $ | 450.5 | $ | 32.5 | 7 | |||||||||||||||
Data and integrated services (b) | 410.0 | 408.5 | 1.5 | — | 818.3 | 787.6 | 30.7 | 4 | ||||||||||||||||||||||
Miscellaneous (c) | 48.3 | 43.7 | 4.6 | 11 | 96.8 | 77.7 | 19.1 | 25 | ||||||||||||||||||||||
End user surcharges | 31.6 | 30.8 | 0.8 | — | 64.9 | 56.8 | 8.1 | 14 | ||||||||||||||||||||||
Total service revenues | 730.1 | 723.4 | 6.7 | 1 | 1,463.0 | 1,372.6 | 90.4 | 7 | ||||||||||||||||||||||
Product sales | 13.0 | 15.0 | (2.0 | ) | (13 | ) | 26.2 | 27.6 | (1.4 | ) | (5 | ) | ||||||||||||||||||
Total revenues and sales | 743.1 | 738.4 | 4.7 | 1 | 1,489.2 | 1,400.2 | 89.0 | 6 | ||||||||||||||||||||||
Costs and expenses (d) | 581.9 | 596.7 | (14.8 | ) | (2 | ) | 1,182.2 | 1,134.5 | 47.7 | 4 | ||||||||||||||||||||
Segment income | $ | 161.2 | $ | 141.7 | $ | 19.5 | 14 | $ | 307.0 | $ | 265.7 | $ | 41.3 | 16 | ||||||||||||||||
(a) | Changes during the three and six month periods ended June 30, 2018 were primarily attributable to incremental revenues of $73.0 million and $145.3 million, respectively, attributable to acquisitions offset by decreases in traditional voice, long-distance and data and integrated services due to increased customer churn attributable to the effects of competition, as well as declines in long-distance usage. |
(b) | Increases during the three and six month periods ended June 30, 2018 were primarily due to incremental revenues of $100.3 million and $194.9 million, respectively, attributable to acquisitions offset by the adverse effects of increased customer churn. |
(c) | Increases were primarily due to incremental revenues of $22.0 million and $43.6 million during the three and six month periods ended June 30, 2018, respectively, attributable to acquisitions offset by lower maintenance revenues. |
(d) | The changes were primarily due to incremental interconnection costs attributable to acquisitions of $24.6 million and $69.0 million during the three and six month periods ended June 30, 2018, respectively offset by rate reductions and costs improvements from the continuation of network efficiency projects, reduced labor costs due to workforce reductions and lower sales and marketing costs. |
69
The following table reflects the Enterprise segment operating metrics:
Six Months Ended June 30, | Increase (Decrease) | ||||||||||||||||||
(Thousands) | 2018 | 2017 | Amount | % | |||||||||||||||
Enterprise customers | 115.5 | 114.8 | 0.7 | 1 | |||||||||||||||
Enterprise customers decreased 5,200 and 10,200 during the three and six month periods ended June 30, 2018, respectively, compared to decreases of 6,000 and 11,500 respectively, for the same period in 2017.
WHOLESALE SEGMENT
The Wholesale segment leverages our nationwide network to provide 100 Gbps bandwidth and transport services to wholesale customers, including telecom companies, content providers, and cable and other network operators. The Wholesale business segment produced $366.2 million in revenue and $257.1 million in contribution margin for the first half of 2018.
Strategy
Our Wholesale strategy focuses on monetizing our network investment in strategic, high-traffic locations to drive new sales through the connection of our long-haul network from carrier hotels, international landing stations and data centers to our high fiber density markets. Our sales team continues to target high-growth areas including content, international and cable television providers. Our fiber network connects common interconnection points in tier one locations to our tier two and three markets, enabling our customers to reach their end users through unique and diverse routes. Including network assets acquired through our 2017 acquisitions, our fiber network spans approximately 150,000 route miles of fiber. We have made significant investments in our network adding route miles and new access points to provide advanced Wave and Metro Ethernet Forum (“MEF”) Ethernet services. Furthermore, advancing the service capabilities of our fiber network through Windstream’s use of SDN will provide our customers with the ability to dynamically configure and control their data networks.
To maintain our contribution margins in our Wholesale business, we will continue to leverage our network assets, offer advanced products and solutions, target our core customers and control costs through our disciplined approach to capital and expense management.
Wholesale Segment Results of Operations
The following table reflects the Wholesale segment results of operations:
Three Months Ended June 30, | Increase (Decrease) | Six Months Ended June 30, | Increase (Decrease) | |||||||||||||||||||||||||||
(Millions) | 2018 | 2017 | Amount | % | 2018 | 2017 | Amount | % | ||||||||||||||||||||||
Revenues: | ||||||||||||||||||||||||||||||
Service revenues: | ||||||||||||||||||||||||||||||
Core wholesale (a) | $ | 150.4 | $ | 162.2 | $ | (11.8 | ) | (7 | ) | $ | 300.7 | $ | 309.4 | $ | (8.7 | ) | (3 | ) | ||||||||||||
Resale (b) | 20.1 | 18.4 | 1.7 | 9 | 41.4 | 33.9 | 7.5 | 22 | ||||||||||||||||||||||
Wireless TDM (c) | 2.4 | 4.0 | (1.6 | ) | (40 | ) | 5.1 | 9.3 | (4.2 | ) | (45 | ) | ||||||||||||||||||
Switched access (d) | 9.4 | 12.0 | (2.6 | ) | (22 | ) | 18.8 | 22.8 | (4.0 | ) | (18 | ) | ||||||||||||||||||
Total service revenues | 182.3 | 196.6 | (14.3 | ) | (7 | ) | 366.0 | 375.4 | (9.4 | ) | (3 | ) | ||||||||||||||||||
Product sales | 0.1 | — | 0.1 | * | 0.2 | — | 0.2 | * | ||||||||||||||||||||||
Total revenues and sales | 182.4 | 196.6 | (14.2 | ) | (7 | ) | 366.2 | 375.4 | (9.2 | ) | (2 | ) | ||||||||||||||||||
Costs and expenses (e) | 53.6 | 61.6 | (8.0 | ) | (13 | ) | 109.1 | 113.3 | (4.2 | ) | (4 | ) | ||||||||||||||||||
Segment income | $ | 128.8 | $ | 135.0 | $ | (6.2 | ) | (5 | ) | $ | 257.1 | $ | 262.1 | $ | (5.0 | ) | (2 | ) | ||||||||||||
(a) | Core wholesale revenues primarily include revenues from providing special access circuits, fiber connections, data transport and wireless backhaul services. The decreases during the three and six month periods ended June 30, 2018 were primarily attributable to lower non-recurring revenue, lower usage for voice-only services and higher disconnect activity as a result of carriers migrating to fiber-based networks. The decrease in the six-month period of 2018 was partially offset by incremental revenues of $11.1 million attributable to acquisitions. |
70
(b) | Revenues represent voice and data services sold to other communications services providers on a resale basis. The increases were primarily attributable to acquisitions. |
(c) | Decreases in these revenues were attributable to declines in special access charges for dedicated copper-based circuits as carriers migrate to fiber-based networks. We expect these revenues to be adversely impacted as wireless carriers continue to migrate traffic to fiber-based connections. |
(d) | Decreases in these revenues were primarily attributable to the effects of inter-carrier compensation reform. |
(e) | Decreases were primarily related to lower interconnection expense, reductions in long-distance usage by our wholesale customers and rate reductions and costs improvements from the continuation of network efficiency projects. |
CONSUMER CLEC SEGMENT
Our Consumer CLEC segment primarily consists of the former EarthLink consumer Internet business residing outside of our ILEC footprint. These operations also include the remaining portion of our heritage CLEC business not transferred to Uniti as part of the REIT spin-off and revenues generated from our master services agreement with Uniti. This segment generated $94.3 million in revenue and $53.8 million in contribution margin for the first half of 2018.
Strategy
We classify our Consumer CLEC segment revenue in two categories: (1) access services, which include dial-up and high-speed Internet access services; and (2) value-added services, which include revenues from ancillary services sold as add-on features to our Internet access services, such as security products, premium email, home networking and email storage; search revenues; and advertising revenues.
Our Consumer CLEC strategy is focused on improving contribution margin trends by growing profitable customer relationships and managing costs. To moderate revenue declines, improve contribution margin and maximize profitability, we are focused on retaining customers, selling incremental services to existing customers and targeting new sales in select markets.
Products and services provided to our consumer customers include nationwide Internet access, both dial-up and high speed. We also offer on-line back-up, managed web design, web hosting and various email services to consumer customers.
Similar to our Consumer & Small Business operations, we experience competition from cable television companies and other communications services providers in areas served by our Consumer CLEC segment.
Consumer CLEC Segment Results of Operations
The following table reflects the Consumer CLEC segment results of operations:
Three Months Ended June 30, | Increase (Decrease) | Six Months Ended June 30, | Increase (Decrease) | ||||||||||||||||||||||||||
(Millions) | 2018 | 2017 | Amount | % | 2018 | 2017 | Amount | % | |||||||||||||||||||||
Revenues and sales: | |||||||||||||||||||||||||||||
Service revenues: | |||||||||||||||||||||||||||||
High-speed Internet | $ | 23.2 | $ | 26.0 | $ | (2.8 | ) | (11 | ) | $ | 47.6 | $ | 35.6 | $ | 12.0 | 34 | |||||||||||||
Dial-up, e-mail and miscellaneous | 22.5 | 24.8 | (2.3 | ) | (9 | ) | 45.3 | 35.5 | 9.8 | 28 | |||||||||||||||||||
End user surcharges | 0.6 | 0.7 | (0.1 | ) | (14 | ) | 1.2 | 1.1 | 0.1 | 9 | |||||||||||||||||||
Total service revenues (a) | 46.3 | 51.5 | (5.2 | ) | (10 | ) | 94.1 | 72.2 | 21.9 | 30 | |||||||||||||||||||
Product sales | 0.1 | 0.2 | (0.1 | ) | (50 | ) | 0.2 | 0.2 | — | * | |||||||||||||||||||
Total revenues and sales | 46.4 | 51.7 | (5.3 | ) | (10 | ) | 94.3 | 72.4 | 21.9 | 30 | |||||||||||||||||||
Cost and expenses (b) | 19.9 | 25.7 | (5.8 | ) | (23 | ) | 40.5 | 35.7 | 4.8 | 13 | |||||||||||||||||||
Segment income | $ | 26.5 | $ | 26.0 | $ | 0.5 | 2 | $ | 53.8 | $ | 36.7 | $ | 17.1 | 47 | |||||||||||||||
71
(a) | Decreases in three-month period of 2018 primarily reflects declines in high-speed Internet and dial-up access customers. The increases in the six-month period of 2018 primarily reflect incremental revenues attributable to the acquisition of EarthLink, partially offset by the declines in high-speed Internet and dial-up access customers. |
(b) | Decrease in three-month period of 2018 primarily reflects a decline in interconnect costs due to the overall decrease in customers. The increase in the six-month period of 2018 primarily reflects incremental costs attributable to the acquisition of EarthLink, partially offset by the declines in interconnect costs due to overall decrease in customers. |
The following table reflects the Consumer CLEC segment operating metrics:
Six Months Ended June 30, | Increase (Decrease) | |||||||||||||||||||
(Thousands) | 2018 | 2017 | Amount | % | ||||||||||||||||
Consumer CLEC customers | 623.1 | 684.4 | (61.3 | ) | (9 | ) | ||||||||||||||
Consumer CLEC customers decreased 17,900 and 39,000 during the three and six month periods ended June 30, 2018, respectively, compared to changes of 1,300 and (4,700), respectively, for the same periods in 2017.
Regulatory Matters
We are subject to regulatory oversight by the Federal Communications Commission (“FCC”) for particular interstate matters and state public utility commissions (“PUCs”) for certain intrastate matters. We are also subject to various federal and state statutes that direct such regulations. We actively monitor and participate in proceedings at the FCC and PUCs and engage federal and state legislatures on matters of importance to us.
From time to time federal and state legislation is introduced dealing with various matters that could affect our business. Most proposed legislation of this type never becomes law. Accordingly, it is difficult to predict what kind of legislation, if any, may be introduced and ultimately become law.
Federal Regulation and Legislation
Inter-carrier Compensation and USF Reform
In November 2011, the FCC released an order (“the Order”) that established a framework for reform of the inter-carrier compensation system and the federal USF. The Order included two primary provisions:
• | the elimination of terminating switched access rates and other per-minute terminating charges between service providers by 2018, through annual reductions in the rates, mitigated in some cases by two recovery mechanisms; and |
• | the provision of USF support for voice and broadband services. |
In reforming the USF, the Order established the CAF, which included a short-term (“CAF Phase I”) and a longer-term (“CAF Phase II”) framework. CAF Phase I provided for continued legacy USF funding frozen at 2011 levels as well as the opportunity for incremental broadband funding to numerous unserved and underserved locations. In accordance with FCC rules, Windstream certified its fulfillment of its obligations for both rounds of CAF Phase I incremental support.
In August 2015, Windstream accepted CAF Phase II support offers for 17 of its 18 states where it is an incumbent provider, totaling approximately $175.0 million in annual funding. Support was retroactive to the beginning of 2015 and will continue for six additional years. Windstream is obligated to offer broadband service at 10/1 Mbps or better to approximately 400,000 eligible locations in high-cost areas in those 17 states. Windstream declined the statewide offer in just one state, New Mexico, where Windstream’s projected cost to comply with FCC deployment requirements greatly exceeded the funding offer. We remained eligible to participate in a competitive bidding process for CAF Phase II support in New Mexico, along with other interested eligible competitors. The FCC’s CAF Phase II competitive bidding process started and is on-going at this time.. We will continue to receive annual USF funding in New Mexico frozen at 2011 levels until the implementation of CAF Phase II competitive bidding process is complete. We cannot reasonably predict what impact the CAF Phase II competitive bidding process will have on our USF support amounts.
72
A summary of CAF Phase II and frozen USF support we have received or expect to receive is as follows:
(Millions) | 2017 | 2018 | 2019 | 2020 | 2021 | Total | ||||||||||||
CAF Phase II support | $ | 175.7 | $ | 174.9 | $ | 174.9 | $ | 174.9 | $ | 174.9 | $ | 875.3 | ||||||
Transitional Frozen USF support | 7.7 | 2.8 | — | — | — | 10.5 | ||||||||||||
New Mexico Frozen USF support | 4.6 | 3.4 | — | — | — | 8.0 | ||||||||||||
Total | $ | 188.0 | $ | 181.1 | $ | 174.9 | $ | 174.9 | $ | 174.9 | $ | 893.8 | ||||||
The above-referenced CAF Phase II payouts assume that we will deploy to 100 percent of the required locations in each state. On December 31, 2015, we elected the flexibility to deploy to at least 95 percent but less than 100 percent in five of the states in which we accepted CAF Phase II support. We will be able to decide how much, if any, of the flexibility we use. If we avail ourselves of all the flexibility, however, we would have to return a total of approximately $50 million by 2021. We expect the incremental CAF Phase II receipts to be sufficient to cover the program’s capital obligations and to provide significant opportunities for Windstream to enhance broadband services in our more rural markets.
As part of the Order’s reform of inter-carrier compensation, the FCC established two recovery mechanisms that mitigate the revenue reductions resulting from the reduction and ultimate elimination of terminating access rates. First, the FCC established the ARC, a fee which may be assessed to some of our retail customers. Second, the ARM is a form of additional federal universal service support designed to allow carriers to recover some of the revenue reductions that cannot be recovered through assessment of the ARC. Carriers are required to use ARM support to build and operate broadband networks in areas substantially unserved by an unsubsidized competitor offering fixed voice and broadband service. Our ARM support decreased incrementally from $36.4 million in 2015 to $14.2 million in 2017, with a portion of the decrease offset by increases in ARC revenues. The FCC is phasing out the ARM annually in one-third increments, beginning in July 2017, and it will be eliminated completely as of July 2019.
In the Order, the FCC also capped intrastate and interstate originating access rates but otherwise deferred reforms to the originating access regime. In June 2017, the FCC invited interested parties to refresh the record on issues raised by the Order with respect to access charges for 8YY (toll free) calls, which are under the umbrella of originating access. On June 7, 2018, the FCC adopted a Further Notice of Proposed Rulemaking seeking comment on reforms to “curb abuses” in the 8YY toll-free access regime. Currently 8YY service providers pay access charges to the carrier whose customer makes an 8YY call, and compensate that originating carrier for an 8YY database query necessary to route the call correctly. The FCC proposes to move interstate and intrastate originating 8YY end office, tandem switching and transport access charges to bill-and-keep over a three-year period. The FCC also proposes to address concerns about excessive and irrationally priced rates for database query charges by capping those charges nationwide at the lowest rate currently charged by any price cap local exchange carrier, and allowing only one database query charge per 8YY call. The FCC also seeks comment on whether incumbent local exchange carriers should be able to recover their lost access charge revenues from their end users and whether it should provide any additional revenue recovery. We cannot now reasonably predict the timing or level of reductions, if any, the FCC may choose.
Set forth below is a summary of inter-carrier compensation revenue and federal USF and CAF Phase II support included in regulatory revenues within the consolidated statements of operations:
Three Months Ended June 30, | Six Months Ended June 30, | |||||||||||||||
(Millions) | 2018 | 2017 | 2018 | 2017 | ||||||||||||
Inter-carrier compensation revenue and ARM support | $ | 18.9 | $ | 28.0 | $ | 38.8 | $ | 54.3 | ||||||||
Federal universal service and CAF Phase II support | $ | 46.1 | $ | 47.3 | $ | 92.1 | $ | 95.5 | ||||||||
IntraMTA Switched Access Litigation
Several of our companies are defendants in approximately 25 lawsuits filed by Verizon and Sprint long-distance companies (IXCs) alleging that our companies may not bill them switched access charges for calls between wireline and wireless devices that originate and terminate within the same Major Trading Area. The complaints seek historical relief in the form of refunds and prospective relief concerning future billings. There are over 50 other such lawsuits against hundreds of defendants. All of the Verizon and Sprint suits were consolidated in a single federal district court in Texas, which dismissed Verizon and Sprint’s federal law claims on November 17, 2015. In March 2016, the plaintiffs were denied permission to appeal the dismissal, which permission was required given certain procedural issues. Verizon and Sprint’s state law claims, and the defendants’ counterclaims for return of all withholdings (including those involving Windstream), continued in federal district court, along with several lawsuits filed against
73
Level 3 (another long-distance company) and became part of the consolidated case (but not involving Windstream). On September 19, 2016, fifty-five Windstream subsidiaries jointly filed a lawsuit against Sprint in Kansas federal district court to collect late payment assessments on amounts Sprint previously withheld, and to ensure consistent application of any adjudication among the subsidiaries. That case was transferred to the consolidated court by an October 10, 2016 order. The parties filed summary judgment motions in March 2018, which were granted by the court on May 15, 2018. The interexchange carriers may appeal to the 5th Circuit Court of Appeals. The subject matter of the above suits remains a topic of a pending petition for declaratory ruling before the FCC. The outcome of the disputes is currently not predictable due to the possibility of appeal and FCC action.
Last-Mile Access
Windstream has actively engaged in policy advocacy in various FCC proceedings that address the rates, terms and conditions for access to the “last-mile” facilities (i.e., special access and unbundled network elements (“UNEs”)) we need to serve retail business customers through our competitive companies. In 2017, we incurred approximately $1.7 billion in interconnection expense and most of that was attributable to last-mile access. For the vast majority of our customers, last-mile facilities, the wires (“loops”) to a customer location from a central office, are not economic for Windstream to duplicate through its own investment and are not available from providers other than the incumbent carrier. Therefore, we often lease those connections from incumbent carriers as one of two distinct product types: either unbundled network elements (“UNEs”), which by law are not available in all areas but are subject to strict regulatory standards, or business data service (“BDS”) inputs, widely available from incumbents but subject to more flexible regulatory standards. Windstream’s purchase of business data service inputs may be subject to volume and term commitments and associated fees and penalties.
In April 2017, the FCC adopted comprehensive reforms to its BDS policies (“BDS Order”). We use BDS to, among other things, connect our national and city-based fiber network with customers for whom we do not have our own facilities serving their locations. These leased services have been subject to price caps and other FCC regulation for decades to control for ILEC market power and historical advantages. Despite evidence to the contrary provided by Windstream and other carriers, the FCC found that the markets for packet-based services, and for TDM based last-mile inputs in the vast majority of areas, are competitive and prices need not be regulated. Windstream, along with several other companies, has filed an appeal in federal court of the rules, which went into effect on August 1, 2017. Oral arguments took place on May 15, 2018, but the court has not yet issued an order in the appeal.
Additionally, on May 4, 2018, the United States Telecommunications Association (“USTA”) filed a Petition for Forbearance Pursuant to 47 U.S.C. Sec. 160(c) to Accelerate Investment in Broadband and Next-Generation Networks with the FCC. Among other requests, USTA, on behalf of certain of its members, sought relief from the requirement to provide unbundled network elements (“UNEs”) and resale discounts to other telecommunications providers. USTA initially requested that its members be relieved of the requirement to provide new UNEs or resale as of the date the FCC grants the petition, which could occur at any point after the comment cycle concludes on September 5, 2018 or 15 months from May 4, 2018 (the filing date) if the FCC fails to take action and the petition is deemed granted as a matter of law. USTA also requested the right to initiate a 15 percent rate increase on the embedded UNE base immediately upon the granting of the petition and that its members be relieved of the requirement to provide UNEs eighteen months from the date the petition is granted.
After successful negotiations, on June 21, 2018, Windstream and the members of USTA filed an ex parte request with the FCC, outlining that they had agreed to a transition time frame for access to UNEs until February 4, 2021, during which transition time Windstream will transition customers from UNEs or otherwise negotiate rates to supersede UNE rates. The parties requested that the FCC consider this a modification of USTA’s original forbearance request.
Windstream is pursuing a strategy to accelerate the transition of its customers from TDM to packet-based services, which is consistent with the underlying goal of the FCC’s reform of business data services and current market trends. However, we believe the BDS order (and the original USTA forbearance proposal) present unnecessary risk of disruption to the market by not allowing an adequate transition period. Customers such as small businesses, schools and libraries are at greatest risk to this disruption, which could occur in the form of price increases for TDM services, the forced transition to purchase new packet-based communications equipment and systems, and the forced obsolescence and write-off of legacy TDM communication systems. Our strategy is to position the company for this transition through investments to extend the reach of our metro fiber networks directly to more buildings using fiber and fixed wireless facilities and to negotiate with providers other than the ILECs for last mile access, and to develop next generation, value-added solutions such as SD-WAN and UCaaS. The BDS reforms and UNE forbearance proceeding could negatively impact Windstream due to increased expenses to purchase business data services and UNEs, the need for greater capital investments to retain our competitiveness, and increased customer and revenue churn due to increasing prices.
74
Rural Healthcare Funding
Windstream and one of its Enterprise customers entered an agreement pursuant to which Windstream provided communication services to several of the customer’s locations. The majority of funding for the services was administered by the Universal Service Administrative Company (“USAC”) pursuant to the Universal Service Rural Health Care Telecommunications Program that offers reduced rates for broadband and telecommunications services to rural health care facilities. In March 2017, USAC issued a funding denial to the customer on the basis that certain rules of the FCC were violated with the selection of Windstream as the service provider. Due to an alleged conflict of interest created by a third-party Windstream channel partner that acted as a consultant for the customer regarding the agreement, USAC asserted that Windstream’s selection was not based upon a fair and open competitive bidding process. USAC’s denial addressed accrued funding of approximately $16.6 million, as well as funding of approximately $6.0 million previously remitted to us. Windstream, along with the customer, appealed the denial; USAC rejected the appeal on June 29, 2018, upholding its previous denial of funding. Windstream plans to appeal the denial with the FCC and will do so prior to August 28, 2018, the deadline to file the appeal. While the ultimate resolution is not currently predictable, if there is a future adverse legal ruling against Windstream, the ruling could constitute a material adverse outcome on our future consolidated results of operations, cash flows or financial condition.
State Regulation and Legislation
State Universal Service
We recognize revenue from the receipt of state universal service funding in a limited number of states in which we operate: Texas, Georgia, Pennsylvania, New Mexico, Oklahoma, South Carolina, Alabama, Nebraska, and Arkansas. For the six-month period ended, June 30, 2018, we recognized $43.1 million in state USF revenue, the majority of which came from the Texas USF. These payments are intended to provide support, apart from the federal USF receipts, for the high cost of operating in certain rural markets.
There are two high-cost programs of the Texas USF, one for large companies and another for small companies. In the first half of 2018, we received $20.1 million from the large company program and $2.4 million from the small company program. The purpose of the Texas USF is to assist telecommunications carriers with providing basic local telecommunications services at reasonable rates to customers in high cost rural areas and to qualifying low-income and disabled customers.
By order of the Texas Public Utility Commission (“PUC”), the Texas USF distributes support to eligible carriers serving areas identified as high cost, on a per-line basis. Texas USF support payments are based on the number of actual lines in service and therefore are subject to reductions when customers discontinue service or migrate to a competitive carrier. All service providers of telecommunications services in Texas contribute to the Texas USF through the payment of a monthly surcharge collected from their customers.
Legislation adopted in Texas in 2013 requires reduction in USF support absent a demonstration of need for continued support through a two-step process which considers the level of competition and our expenses in the current supported exchanges. We have four operating companies in Texas - one company that is part of the large company fund, and three companies that are part of the small company fund. In May 2016 the Texas PUC granted our petition to retain $42.2 million in USF support from the large company fund for 153 exchanges served by Windstream Southwest. Following, in June 2017, the Texas PUC granted our petitions to retain an additional $4.7 million in support from the small company fund for 34 exchanges served by Texas Windstream and Windstream Communications Kerrville.
We did not seek to preserve $1.7 million in support for Windstream Sugar Land, LLC, because our analysis demonstrated that we would not pass the needs test. Thus, Windstream Sugar Land, LLC, has begun to experience a mandatory 25 percent reduction in support starting January 2018, with additional 25 percent reductions to occur in 2019 and 2020 with support leveling off at 25 percent in 2021.
In Nebraska, the Public Service Commission (“PSC”) confirmed that our high-cost Nebraska Universal Service Fund (“NUSF”) support for 2018 will be $4.5 million of which 20 percent is allocated to ongoing maintenance and support and 80 percent is allocated to approved capital construction projects. In 2017, our support was approximately $5.5 million allocated 20 percent to ongoing maintenance and support and 80 percent to capital construction projects.
75
In 2017, New Mexico enacted a statute to reform the New Mexico State Rural Universal Service Fund (“SRUSF”). Among other things, the legislation authorizes an annual broadband fund in addition to the access replacement fund from which we will continue to receive support. Beginning in 2018, the amount of support is determined by adjusting the 2014 support amount by a carrier’s change in access line count and imputing the affordability benchmark, which is currently based on the FCC’s residential rate benchmark. We will be required to use at least 60 percent of this support to deploy and maintain broadband service in rural areas of the state. Our support for 2017 was $6.4 million and is forecasted to be $5.5 million in 2018.
Historically, we have received $3.4 million from the Oklahoma high cost fund on an annual basis. On February 8, 2018, the Oklahoma Corporation Commission issued an order phasing out the high cost fund. Starting February 28, 2019, funding will be cut 25 percent per year, with all funding terminating on February 28, 2022.
Universal service reform is also possible in Pennsylvania. Windstream currently receives $13.3 million from that fund and cannot estimate the financial impact that would result from changes, if any.
FINANCIAL CONDITION, LIQUIDITY AND CAPITAL RESOURCES
Liquidity and Capital Resources
We rely largely on operating cash flows and long-term debt to provide for our liquidity requirements. We have assessed the current and expected business climate, our current and expected needs for funds and our current and expected sources of funds, and have determined, based on our forecasted financial results and financial condition as of June 30, 2018, that cash on hand and cash expected to be generated from operating activities, will be sufficient to fund our ongoing working capital requirements, planned capital expenditures, scheduled debt principal and interest payments, and lease payments due under the master lease agreement with Uniti. We also have access to capital markets and available borrowing capacity under our revolving credit agreement.
From time to time, we may seek transactions to optimize our capital structure, including entering into transactions to repurchase or redeem our outstanding indebtedness (including by means of open market purchases, privately negotiated repurchases, tender offers and/or redemptions pursuant to the debt’s terms), or seek to refinance our outstanding debt or may otherwise seek transactions to reduce interest expense. Our ability to consummate any such transaction will depend on prevailing market conditions, our liquidity requirements, contractual restrictions and other factors. Any of these transactions could impact our financial results. We cannot assure you if or when we will consummate any such transactions or the terms of any such transaction.
We have evaluated and we continue to evaluate possible acquisition and disposition transactions on an on-going basis. At any time we may be engaged in discussions or negotiations with respect to possible acquisitions and/or dispositions. We cannot assure you if or when we will consummate any such transaction or the terms of any such transaction. Any future transactions may result in the issuance of equity securities or use of our cash as consideration or incurrence of debt or contingent liabilities.
The actual amount and timing of our future capital requirements may differ materially from our estimates depending on the demand for our services and new market developments and opportunities, and on other factors, including those described in Part I, “Item 1A. Risk Factors” in our Annual Report on Form 10-K for the year ended December 31, 2017. If our plans or assumptions change or prove to be inaccurate, the foregoing sources of funds may prove to be insufficient. In addition, if we seek to acquire other businesses or to accelerate the expansion of our business, we may be required to seek material amounts of additional capital. Additional sources may include equity and debt financing. Further, if we believe we can obtain additional debt financing on advantageous terms, we may seek such financing at any time, to the extent that market conditions and other factors permit us to do so. The debt financing we may seek could be in the form of additional term loans under Windstream Services’ senior secured credit facility or additional debt securities having substantially the same terms as, or different terms from, Windstream Services’ outstanding senior notes.
Historical Cash Flows
The following table summarizes our cash flow activities for the six months ended June 30:
(Millions) | 2018 | 2017 | ||||||
Cash flows provided from (used in): | ||||||||
Operating activities | $ | 539.7 | $ | 374.9 | ||||
Investing activities | (452.7 | ) | (514.6 | ) | ||||
Financing activities | (85.1 | ) | 105.3 | |||||
Increase (decrease) in cash and cash equivalents | $ | 1.9 | $ | (34.4 | ) | |||
76
Our cash position increased by $1.9 million to $45.3 million at June 30, 2018, from $43.4 million at December 31, 2017, as compared to a decrease of $34.4 million during the same period in 2017. Cash inflows in the six-month period ended June 30, 2018 were primarily from operating activities and incremental debt proceeds. These inflows were partially offset by cash outflows for capital expenditures, repayments of debt, payments under our capital and long-term lease obligations, and the acquisition of MASS.
Cash Flows - Operating Activities
Cash provided from operations is our primary source of funds. Cash flows from operating activities increased by $164.8 million in the six-month period ended June 30, 2018, as compared to the same period in 2017. The increase primarily reflected the incremental operating cash flows generated from the Broadview, EarthLink and MASS acquisitions, reductions from the prior year in merger, integration and other costs of $52.3 million mainly attributable to the merger with EarthLink and favorable changes in working capital reflecting timing differences in the payment of trade accounts payable. These increases were partially offset by cash outlays related to our 2018 workforce reduction and decreases in consumer and enterprise revenues, wholesale services and switched access revenues due to customer losses from competition, declining demand for copper-based circuits to towers and the adverse effects of inter-carrier compensation reform, respectively. Higher cash interest payments of $11.2 million attributable to the increase in our long-term debt obligations following the acquisitions of Broadview and EarthLink and completion of our fourth quarter 2017 debt refinancing activities also adversely impacted cash flows from operating activities during the first half of 2018.
We are currently utilizing net operating loss carryforwards (“NOLs”) and other income tax initiatives to lower our cash income tax obligations during 2018. We expect the effects of the overall impact of the 2017 Tax Act will be favorable to us over the long-term by allowing us to extend the time frame we have to use our NOLs generated after December 31, 2017, and remain a minimal cash tax payer for the foreseeable future.
Cash Flows - Investing Activities
Cash used in investing activities primarily includes investments in our network to upgrade and expand our service offerings as well as spending on strategic initiatives. Cash used in investing activities decreased $61.9 million in the six-month period ended June 30, 2018, as compared to the same period in 2017, primarily due to a decrease in our capital spending, partially offset by the cash paid for the acquisition of MASS of $37.6 million. Capital expenditures were $406.3 million for the six-month period ended June 30, 2018 compared to $507.8 million for the same period in 2017, a decrease of $101.5 million. The decrease primarily reflected the completion in the second quarter of 2017 of Project Excel, a capital program begun in late 2015 to upgrade our broadband network. During the first half of 2017, capital expenditures related to Project Excel were $49.9 million. Capital expenditures for the first half of 2018 and 2017 also included $18.0 million and $10.9 million, respectively, of incremental spend related to our acquired Broadview and EarthLink operations.
Excluding incremental capital spend related to our 2017 acquisitions, we expect total 2018 capital expenditures to range between $750.0 million to $800.0 million.
Cash Flows - Financing Activities
Cash used in financing activities was $85.1 million for the six-month period ended June 30, 2018 compared to a net inflow of$105.3 million for the same period in 2017. This change was primarily attributable to a reduction from the prior year in the net inflow from new and incremental borrowings under Windstream Services’ senior secured credit facility, as further discussed below.
Proceeds from new issuances of long-term debt during the first six months of 2018 were $450.0 million, which consisted solely of new borrowings under Windstream Services’ revolving line of credit. Comparatively, proceeds from new issuances of long-term debt during the first six months of 2017 were $1,535.6 million consisting of new and incremental borrowings totaling $1,022.6 million under Tranches B6 and B7 of Windstream Services’ senior secured credit facility, which were issued at a discount, and additional borrowings of $513.0 million under the revolving line of credit.
Debt repayments for the six-month period ended June 30, 2018 totaled $413.1 million and included the one-time mandatory redemption payment of $150.0 million applicable to the 8.750 percent senior notes due December 15, 2024 (“2024 Notes”). The redemption payment was made on February 26, 2018 and was funded using available borrowing capacity under the revolving line of credit. During the first six months of 2018, Windstream Services also repaid $250.0 million of borrowings under its revolving line of credit. Comparatively, debt repayments for the six months ended June 30, 2017 totaled $1,282.2 million and primarily consisted of cash outlays of $579.1 million to repay amounts outstanding under Tranche B5 of Windstream Services’ senior secured credit facility and $435.3 million to repay amounts outstanding under EarthLink’s credit facility and to redeem EarthLink's
77
outstanding 8.875 percent Senior Notes due 2019 and 7.375 percent Senior Secured Notes due 2020. During the first half of 2017, Windstream Services also repaid $238.0 million of borrowings under its revolving line of credit.
During the six-month period ended June 30, 2017, dividends paid to shareholders were $35.6 million. Our board of directors elected to eliminate our quarterly common stock dividend commencing in the third quarter of 2017 after reviewing our capital allocation strategy and determining our common stock was undervalued. Our capital allocation practices can be changed at any time at the discretion of our board of directors, and are subject to the restricted payment capacity under Windstream Services’ debt covenants as further discussed below. See “Risk Factors” in Item 1A of Part I of this Annual Report on Form 10-K for the year ended December 31, 2017, for additional information.
Equity Distribution Agreement
On June 1, 2018, Windstream Holdings entered into an equity distribution agreement with Citigroup Global Markets Inc. (the “Sales Agent”). Under terms of the agreement, Windstream Holdings may issue and sell, from time to time to or through the Sales Agent, shares of its common stock, up to an aggregate offering price of $18.0 million. We intend to use the net proceeds from this offering for general corporate purposes, including, without limitation, the acquisition of companies or businesses and additional contributions to the Windstream Pension Plan.
Sales of our common stock under the equity distribution agreement may be made by the Sales Agent directly on or through the NASDAQ Market, on or through another market, through a market maker other than on an exchange, or in negotiated transactions at market prices prevailing at the time of sale or at negotiated prices, or as otherwise agreed with the Sales Agent. Windstream Holdings will pay a commission to the Sales Agent for any sales of our common shares made through the Sales Agent. The equity distribution agreement will terminate upon the earlier of (1) the sale of all shares subject to the agreement or (2) the termination of the agreement by us or the Sales Agent.
During June 2018, we issued and sold approximately 1.7 million of our common shares under the equity distribution agreement and received proceeds of approximately $11.1 million, net of commissions. In July 2018, we issued and sold an additional 0.2 million shares and received proceeds of approximately $1.1 million, net of commissions. As of August 9, 2018, subject to the terms and conditions of the equity distribution agreement, we may sell an additional $5.6 million aggregate offering price of shares of common stock.
In June 2018, Windstream reached a definitive agreement to acquire American Telephone Company LLC (“ATC”), a reseller of a broad range of voice and data communications services to businesses mainly headquartered in the greater New York metropolitan area. The transaction reflects our strategy to augment organic revenue growth with small, customer-base acquisitions. The transaction is expected to close in the third quarter of 2018 pending customary closing conditions, including receipt of federal and state regulatory approvals. We intend to fund the $10 million cash purchase price using proceeds from the equity distribution program.
Pension and Employee Savings Plan Contributions
For 2018, the expected employer contributions for pension benefits consists of $17.7 million to the qualified pension plan to satisfy our remaining 2017 and 2018 funding requirements. On January 12, 2018, we made our required quarterly employer contribution of $5.2 million in cash to the qualified pension plan. On February 27, 2018, we contributed 0.8 million shares of our common stock with a value of approximately $5.8 million to the qualified pension plan. As discussed above, we intend to utilize sales of our common stock through the equity distribution agreement to facilitate contributions of cash to the qualified pension plan to satisfy our remaining funding requirements for 2018. The amount and timing of future contributions to the qualified pension plan are dependent upon a myriad of factors including future investment performance, changes in future discount rates and changes in the demographics of the population participating in the plan. We also expect to make cash contributions in 2018 totaling $0.9 million to fund the expected benefit payments of our unfunded supplemental executive retirement pension plans.
We also sponsor an employee savings plan under section 401(k) of the Internal Revenue Code, which covers substantially all salaried employees and certain bargaining unit employees. We match on an annual basis up to a maximum of 4.0 percent of employee pre-tax contributions to the plan for employees contributing up to 5.0 percent of their eligible pre-tax compensation. In March 2018, we contributed 3.4 million shares of our common stock with a value of $26.9 million to the plan for the 2017 annual matching contribution. Comparatively, during the first half of 2017, we contributed 0.6 million shares of our common stock with a value of $22.7 million and $0.6 million in cash to the plan for the 2016 annual matching contribution.
78
Shareholder Rights Plan
On May 12, 2016, our shareholders ratified a shareholder rights plan, previously adopted by Windstream Holdings’ board of directors. The plan is designed to protect our NOLs from the effect of limitations imposed by federal and state tax rules following a change in the ownership of our stock. This plan was designed to deter an “ownership change” (as defined in IRC Section 382) from occurring, and therefore protect our ability to utilize our federal and state net operating loss carry forwards in the future. A person or group of affiliated or associated persons may cause the rights under the plan to become exercisable if such person or group is or becomes the beneficial owner of 4.90 percent or more of the “outstanding shares” of Windstream Holdings common stock other than as a result of repurchases of stock by Windstream Holdings, dividends or distributions by Windstream Holdings or certain inadvertent actions by Windstream Holdings’ stockholders. For purposes of calculating percentage ownership under the plan, “outstanding shares” of common stock include all of the shares of common stock actually issued and outstanding. Beneficial ownership is determined as provided in the rights plan and generally includes, without limitation, any ownership of securities a person would be deemed to actually or constructively own for purposes of Section 382 of the IRC or the Treasury Regulations promulgated thereunder.
The plan is not meant to be an anti-takeover measure and our board of directors has established a procedure to consider requests to exempt the acquisition of Windstream Holdings common stock from the rights plan, if such acquisition would not limit or impair the availability of our NOLs. Such determination will be made in the sole and absolute discretion of the Windstream Holdings’ board of directors, upon request by any person prior to the date upon which such person would otherwise become the beneficial owner of 4.90 percent or more of the outstanding shares of Windstream Holdings common stock. In addition, if the Windstream Holdings’ board of directors determines in good faith that a person has inadvertently become the beneficial owner of 4.90 percent or more of the outstanding shares of Windstream Holdings common stock, and such person divests as promptly as practicable a sufficient number of shares of common stock so that such person beneficially owns less than 4.90 percent, then such person will not cause the rights under the plan to become exercisable. The Rights Plan was amended by the Amendment No. 1 to Rights Agreement, dated November 5, 2016, to confirm that any EarthLink shareholder that became a 4.90 percent or greater shareholder of the combined company as a result of the merger is exempt and the ownership does not trigger implementation of the Rights Plan unless the shareholder acquires additional shares of common stock. This summary description of the rights plan does not purport to be complete and is qualified in its entirety by reference to the Rights Agreement, dated as of September 17, 2015, by and between Windstream Holdings and Computershare Trust Company, N.A., as Rights Agent, filed as an exhibit to the Windstream Holdings’ Annual Report on Form 10-K for the year ended December 31, 2015.
The plan was set to expire on September 17, 2018, unless its term was extended. In May 2018, our stockholders approved an amendment to extend the term of the plan by three years. On August 7, 2018, we amended the 382 Rights Agreement, dated as of September 17, 2015, by and between Windstream and Computershare Trust Company, N.A., as Rights Agent (the “Rights Agreement”), to extend its term to September 17, 2021.
Debt and Dividend Capacity
Windstream Holdings has no debt obligations. All of our debt, including the facility described below, has been incurred by our subsidiaries (primarily Windstream Services). Windstream Holdings is neither a guarantor of nor subject to the restrictive covenants imposed by such debt.
As of June 30, 2018, we had $5,885.8 million in long-term debt outstanding, including current maturities (see Note 5). As of June 30, 2018, the amount available for borrowing under Windstream Services’ revolving line of credit was $251.6 million. As of June 30, 2018, Windstream Services had approximately $432.9 million of restricted payment capacity as governed by its senior secured credit facility. Under terms of the credit facility, payments required under the master lease are deducted from operating income before depreciation and amortization (“OIBDA”). Windstream Services builds additional capacity through cash generated from operations while dividend distributions to Windstream Holdings, and other certain restricted investments reduce the available restricted payments capacity. Windstream Services will continue to consider free cash flow accretive initiatives.
In connection with the issuance of the 2024 Notes, Windstream Services agreed to certain provisions that prohibits its ability to issue restricted payments to its parent company, Windstream Holdings, if Windstream Services’ consolidated leverage ratio, as defined in the 2024 Notes, exceeds 3.50 to 1.0, except for purposes of allowing restricted payments to Windstream Holdings for the purposes of making rent payments under the master lease with Uniti and to pay certain administrative expenses. The provisions indirectly impact, and could limit, Windstream Holdings’ future issuance of dividends to holders of its common stock and its engagement in stock repurchase programs.
79
Debt Covenants and Amendments
The terms of the credit facility and indentures issued by Windstream Services include customary covenants that, among other things, require Windstream Services to maintain certain financial ratios and restrict its ability to incur additional indebtedness. These financial ratios include a maximum leverage ratio of 4.5 to 1.0 and a minimum interest coverage ratio of 2.75 to 1.0. In addition, the covenants include restrictions on dividend and certain other types of payments.
Certain of Windstream Services’ debt agreements contain various covenants and restrictions specific to the subsidiary that is the legal counterparty to the agreement. Under its long-term debt agreements, acceleration of principal payments would occur upon payment default, violation of debt covenants not cured within 30 days, a change in control including a person or group obtaining 50 percent or more of Windstream Services’ outstanding voting stock, or breach of certain other conditions set forth in the borrowing agreements. At June 30, 2018, Windstream Services was in compliance with all debt covenants and restrictions.
As further discussed in Notes 5 and 15, on September 22, 2017, Windstream Services received a purported notice of default dated September 21, 2017 (the “Original Notice”) from a noteholder that claims to hold greater than 25 percent in aggregate principal amount of the 6.375 percent 2023 Notes issued under the indenture dated January 23, 2013 (as amended and supplemented, the “2013 Indenture”), between Windstream Services, as issuer, Windstream Finance Corp., as co-issuer, the guarantors party thereto and U.S. Bank National Association, as trustee (the “Trustee”). The Original Notice alleged that the transfer of certain assets and the subsequent lease of those assets in connection with the spin-off of Uniti in April 2015 constituted a “sale and leaseback transaction” (as defined in the 2013 Indenture) which did not comply with the Sale and Leaseback covenant under the 2013 Indenture. The Original Notice further alleged that Windstream Services violated the restricted payment covenant under the 2013 Indenture by not delivering an officers’ certificate as required by the 2013 Indenture and that it made a restricted payment in reliance on the restricted payment builder basket during the pendency of an alleged default which is prohibited by the 2013 Indenture.
On November 6, 2017, Windstream Services completed an exchange of certain of its existing senior notes for additional 6.375 percent 2023 Notes and received consents from holders representing a majority of the outstanding aggregate principal amount of the 6.375 percent 2023 Notes to certain waivers and amendments relating to the defaults alleged in the Original Notice (the “Exchange and Consent Transactions”). On November 6, 2017, Windstream Services, the co-issuer, the guarantors party thereto and the Trustee executed a supplemental indenture to the 2013 Indenture giving effect to such waivers and amendments.
Additionally during the fourth quarter of 2017, Windstream Services completed consent solicitations with respect to its 2020 Notes, 2021 Notes, 2022 Notes, April 2023 Notes and the existing 6.375 percent 2023 Notes (collectively “the Windstream Services Notes”), pursuant to which noteholders agreed to waive alleged defaults with respect to the transactions related to the spin-off of Uniti and amend the indentures governing the Windstream Services Notes to give effect to such waivers and amendments. Windstream Services received such consents from the holders representing a majority of the outstanding aggregate principal amount of the Windstream Services Notes. Windstream Services, the trustee under the indentures governing the Windstream Services Notes and the other parties to such indentures executed supplemental indentures giving effect to the waivers and amendments pursuant to the consent solicitation. The waivers and amendments are now effective and operative and, as such, are binding on all holders of the Windstream Services Notes. Consent delivered pursuant to the consent solicitations may not be revoked. As a result of the debt exchanges and the consent transactions, Windstream Services has been, and remains, in compliance with all of the covenants under the 2013 Indenture.
As further discussed in Note 5, during the second quarter of 2018, Windstream Services received the requisite consents to amend the indenture governing the 2025 Notes. The purpose of the consent solicitation was (i) to permit Windstream Services to issue or incur indebtedness on a junior lien basis (which indebtedness is currently permitted by the indenture to be incurred on a first-priority lien basis) and (ii) to authorize the collateral agent under the indenture to enter into a junior lien intercreditor agreement upon the issuance or incurrence of junior lien secured indebtedness by the issuers and the guarantors under the indenture. In conjunction with receiving the requisite consents, the amendments to the indenture became effective and operative. All holders of the 2025 Notes are bound by the terms thereof, even if they did not deliver consents to the amendments.
Concurrent with the consent solicitation, Windstream Services also sought and obtained an amendment to its senior secured credit facility to, among other things, (i) permit the issuance or incurrence of second-priority lien secured indebtedness, (ii) allow Windstream Services to use the proceeds from the issuance or incurrence of such second-priority lien secured indebtedness and other secured indebtedness to repay certain of its outstanding secured and unsecured indebtedness, (iii) permit the execution of a first-lien/second-lien intercreditor agreement, (iv) allow for the incurrence of first-priority lien secured indebtedness if the proceeds of such indebtedness are used to prepay or repay revolving loans or term loans under the senior secured credit facility (and, for revolving loans, permanently reduce the commitments), even if Windstream Services does not meet the typical test of having a
80
pro forma first lien leverage ratio of not more than 2.25 to 1.0, and (v) limit the ability of Windstream Services to declare and pay dividends.
With the amendments to the 2025 Note indenture and the senior secure credit facility becoming operative and effective, Windstream Services may explore various financing alternatives to improve its capital structure, including issuing new junior lien secured indebtedness in one or more series or tranches or offering to exchange new junior lien secured indebtedness for one or more existing series of debt. The timing of any such transaction would be determined by the Windstream Services at its sole discretion, subject to market conditions, liquidity needs, contractual limitations and other factors.
Windstream Services’ senior secured credit facility include maintenance covenants derived from certain financial measures that are not calculated in accordance with accounting principles generally accepted in the United States (“non-GAAP financial measures”). These non-GAAP financial measures are presented below for the sole purpose of demonstrating our compliance with Windstream Services’ debt covenants and were calculated as follows at June 30, 2018:
(Millions, except ratios) | |||
Gross leverage ratio: | |||
Long term debt including current maturities | $ | 5,885.8 | |
Capital leases, including current maturities | 108.3 | ||
Total long term debt and capital leases | $ | 5,994.1 | |
Operating loss, last twelve months | $ | (1,577.8 | ) |
Depreciation and amortization, last twelve months | 1,521.6 | ||
Goodwill impairment, last twelve months | 1,840.8 | ||
Other expense adjustments required by the credit facility (a) | (324.3 | ) | |
Adjusted earnings before interest, taxes, depreciation and amortization (“Adjusted EBITDA”) | $ | 1,460.3 | |
Leverage ratio (b) | 4.10 | ||
Maximum gross leverage ratio allowed | 4.50 | ||
Interest coverage ratio: | |||
Adjusted EBITDA | $ | 1,460.3 | |
Interest expense, last twelve months | $ | 896.7 | |
Adjustments required by the credit facility (c) | (510.7 | ) | |
Adjusted interest expense | $ | 386.0 | |
Interest coverage ratio (d) | 3.78 | ||
Minimum interest coverage ratio allowed | 2.75 | ||
(a) | Adjustments required by the credit facility primarily consist of the inclusion of the annual cash rental payment due under the master lease agreement with Uniti, operating results of acquired companies for applicable periods prior to the date of acquisition and net cost savings from integrating acquired companies not to exceed $25.0 million on a quarterly basis. The required adjustments also consist of the exclusion of pension expense, share-based compensation expense, merger, integration and other costs, restructuring charges, business transformation expenses, costs related to network optimization projects, incremental hurricane-related storm costs, amounts incurred with a carrier access settlement, and a penalty for not meeting certain spend commitments under a circuit discount plan. |
(b) | The gross leverage ratio is computed by dividing total debt by adjusted EBITDA. |
(c) | Adjustments required by the credit facility primarily consist of the inclusion of capitalized interest and amortization of the discount on long-term debt, net of premiums, and the exclusion of the interest expense attributable to the long-term lease obligation under the master lease agreement with Uniti. |
(d) | The interest coverage ratio is computed by dividing adjusted EBITDA by adjusted interest expense. |
81
Credit Ratings
As of August 9, 2018, Moody’s Investors Service, Standard & Poor’s (“S&P”) Corporation and Fitch Ratings had granted the following senior secured, senior unsecured and corporate credit ratings:
Description | Moody’s | S&P | Fitch | |||
Senior secured credit rating (a) | Caa1/Caa2 | B/CCC | BB/BB- | |||
Senior unsecured credit rating (a) | Caa2 | CCC- | CCC+ | |||
Corporate credit rating (b) | Caa1 | CCC+ | B | |||
Outlook (b) | Negative | Developing | Negative | |||
(a) | Ratings assigned to Windstream Services. |
(b) | Corporate credit rating and outlook assigned to Windstream Services for Moody’s and Fitch, while S&P assigns corporate credit rating and outlook to Windstream Holdings, Inc. |
Factors that could affect our short and long-term credit ratings would include, but are not limited to, a material decline in our operating results, increased debt levels relative to operating cash flows resulting from future acquisitions, increased capital expenditure requirements, or changes to our dividend policy. If our credit ratings were to be downgraded, we might incur higher interest costs on future borrowings, and our access to the public capital markets could be adversely affected. A downgrade in our current short or long-term credit ratings would not accelerate scheduled principal payments of our existing long-term debt. Our exposure to interest risk is further discussed in the Market Risk section below.
Off-Balance Sheet Arrangements
We do not use securitization of trade receivables, affiliation with special purpose entities, variable interest entities or synthetic leases to finance our operations. Additionally, we have not entered into any arrangement requiring us to guarantee payment of third party debt or to fund losses of an unconsolidated special purpose entity.
Contractual Obligations and Commitments
There have been no significant changes in our other contractual obligations and commitments since December 31, 2017, as set forth in our Annual Report on Form 10-K.
Reconciliation of Non-GAAP Financial Measures
From time to time, we will reference certain non-GAAP measures in our filings including a non-GAAP measure entitled operating income before depreciation and amortization (“OIBDA”). OIBDA can be calculated directly from the Company’s consolidated financial statements prepared in accordance with GAAP by taking operating income and adding back and depreciation and amortization expense. Management considers OIBDA to be useful to investors as we believe it provides for comparability and evaluation of our ongoing operating performance and trends by excluding the impact of non-cash depreciation and amortization from capital investments. Management’s purpose for including these measures is to provide investors with measures of performance that management uses in evaluating the performance of the business. These non-GAAP measures should not be considered in isolation or as a substitute for measures of financial performance reported under GAAP.
82
Following is a reconciliation of a non-GAAP financial measure titled OIBDA to the most closely related financial measure reported under GAAP referenced in this filing.
Three Months Ended June 30, | Six Months Ended June 30, | |||||||||||||||
(Millions) | 2018 | 2017 | 2018 | 2017 | ||||||||||||
Operating income | $ | 88.3 | $ | 102.5 | $ | 157.3 | $ | 146.6 | ||||||||
Depreciation and amortization | 370.7 | 362.4 | 752.5 | 700.9 | ||||||||||||
OIBDA (a) | $ | 459.0 | $ | 464.9 | $ | 909.8 | $ | 847.5 | ||||||||
(a) | OIBDA is defined as operating income plus depreciation and amortization expense. We believe this measure provides investors with insight into the true earnings capacity of providing telecommunications services to our customers. |
Critical Accounting Policies and Estimates
Our consolidated financial statements are prepared in accordance with accounting principles generally accepted in the United States. In Management’s Discussion and Analysis of Financial Condition and Results of Operations for the year ended December 31, 2017, in our Annual Report on Form 10-K, we identified the critical accounting policies which affect our more significant estimates and assumptions used in preparing our consolidated financial statements. These critical accounting policies include evaluating the collectability of trade receivables, calculating depreciation and amortization expense, assessing goodwill for impairment, accounting for pension benefits, determining the fair values of derivative instruments, and accounting for deferred income taxes and related tax contingencies. There were no material changes to these critical accounting policies during the six-month period ended June 30, 2018.
Recently Adopted Authoritative Guidance
During the first quarter of 2018, we adopted the following authoritative guidance;
• | Revenue Recognition |
• | Presentation of Defined Benefit Retirement Costs |
• | Hedging Activities |
• | Statement of Cash Flows |
See Note 1 for further discussion of this guidance and the related impacts to our consolidated financial statements.
Recently Issued Authoritative Guidance
The following authoritative guidance, together with our evaluation of the related impact to the consolidated financial statements, is more fully described in Note 1.
• | Leases |
• | Financial Instruments - Credit Losses |
83
Forward-Looking Statements
This Management’s Discussion and Analysis of Financial Condition and Results of Operations includes, and future filings on Form 10-K, Form 10-Q and Form 8-K and future oral and written statements by us and our management may include, certain forward-looking statements. We claim the protection of the safe-harbor for forward-looking statements contained in the Private Securities Litigation Reform Act of 1995 for this Quarterly Report on Form 10-Q. Forward-looking statements are subject to uncertainties that could cause actual future events and results to differ materially from those expressed in the forward-looking statements. Forward-looking statements include, but are not limited to, statements regarding the benefits of the mergers with EarthLink and Broadview, including future financial and operating results, projected synergies in operating and capital expenditures and the timing of achieving the synergies, reduction in net leverage, and improvement in our ability to compete; our ability to improve our debt profile and reduce interest costs; our cost reduction activities, including, but not limited to, workforce reductions and network cost optimization; our ability to defend claims made by one or more noteholders that Windstream Services is in alleged default pursuant to a certain indenture governing a series of senior notes; expectations regarding our network investments to improve financial performance and increase market share; expectations regarding revenue trends, sales opportunities, improving margins in, and the directional outlook of, our business segments; expectations regarding the benefits of our updated business unit structure; stability and growth in adjusted OIBDA; statements regarding our 2018 operational priorities; expected levels of support from universal service funds or other government programs; expected rates of loss of consumer households served or inter-carrier compensation; expected increases in high-speed Internet and business data connections, including increasing availability of higher Internet speeds and services utilizing next generation technology for customers; expectations regarding expanding enhanced services related to Internet speeds, Kinetic and 1 Gbps services to more locations due to network upgrades and expanding our fiber network; expectations regarding sales and trends of strategic products for business customers; our expected ability to fund operations; expected required contributions to our pension plan and our ability to make contributions utilizing our common stock; the completion and benefits from network investments related to the Connect America Fund to fund the deployment of broadband services and capital expenditure amounts related to these investments; anticipated capital expenditures and certain debt maturities from cash flows from operations; and expected effective federal income tax rates and our ability to utilize certain net loss operating carryforwards and the length of time we have to utilize under the 2017 Tax Act. These and other forward-looking statements are based on estimates, projections, beliefs, and assumptions that we believe are reasonable but are not guarantees of future events and results. Actual future events and our results may differ materially from those expressed in these forward-looking statements as a result of a number of important factors.
Factors that could cause actual results to differ materially from those contemplated in our forward-looking statements include, among others:
• | the cost savings and expected synergies from the mergers with EarthLink and Broadview may not be fully realized or may take longer to realize than expected; |
• | the integration of Windstream and EarthLink and Broadview may not be successful, may cause disruption in relationships with customers, vendors and suppliers and may divert attention of management and key personnel; |
• | the impact of the Federal Communications Commission’s comprehensive business data services reforms or additional FCC reforms or actions, including actions related to unbundled network elements, that may result in greater capital investments and customer and revenue churn because of possible price increases by our ILEC suppliers for certain services we use to serve customer locations where we do not have facilities; |
• | the potential for incumbent carriers to impose monetary penalties for failure to meet specific volume and term commitments under their special access pricing and tariff plans, which Windstream uses to lease last-mile connections to serve its retail business data service customers, without FCC action; |
• | the impact of new, emerging or competing technologies and our ability to utilize these technologies to provide services to our customers; |
• | the alleged ability of one or more purported noteholders to establish that transactions related to the spin-off of certain assets in 2015 into a publicly-traded real estate investment trust allegedly violated certain covenants in existing indentures governing certain outstanding senior notes allegedly allowing the noteholders to seek to accelerate payment under the indentures; |
84
• | the benefits of our current capital allocation strategy, which may be changed at anytime at the discretion of our board of directors, and certain cost reduction activities may not be fully realized or may take longer to realize than expected, or the implementation of these initiatives may adversely affect our sales and operational activities or otherwise disrupt our business and personnel; |
• | the availability and cost of financing in the corporate debt markets; |
• | unanticipated increases or other changes in our future cash requirements, whether caused by unanticipated increases in capital expenditures, increases in pension funding requirements, or otherwise; |
• | for certain operations where we lease facilities from other carriers, adverse effects on the availability, quality of service, price of facilities and services provided by other carriers on which our services depend; |
• | our election to accept state-wide offers under the FCC’s Connect America Fund, Phase II, and the impact of such election on our future receipt of federal universal service funds and capital expenditures, and any return of support received pursuant to the program; |
• | our ability to make rent payments under the master lease to Uniti, which may be affected by results of operations, changes in our cash requirements, cash tax payment obligations, or overall financial position; |
• | further adverse changes in economic conditions in the markets served by us; |
• | the extent, timing and overall effects of competition in the communications business; |
• | unfavorable rulings by state public service commissions in current and further proceedings regarding universal service funds, inter-carrier compensation or other matters that could reduce revenues or increase expenses; |
• | material changes in the communications industry that could adversely affect vendor relationships with equipment and network suppliers and customer relationships with wholesale and enterprise customers; |
• | the impact of recent adverse changes in the ratings given to our debt securities by nationally accredited ratings organizations and the potential for additional adverse changes in the future; |
• | earnings on pension plan investments significantly below our expected long term rate of return for plan assets or a significant change in the discount rate or other actuarial assumptions; |
• | unfavorable results of litigation or intellectual property infringement claims asserted against us; |
• | the risks associated with non-compliance by us with regulations or statutes applicable to government programs under which we receive material amounts of end-user revenue and government subsidies, or non-compliance by us, our partners, or our subcontractors with any terms of our government contracts; |
• | the effects of federal and state legislation, and rules and regulations, and changes thereto, including changes implemented by administrative agencies, governing the communications industry; |
• | continued loss of consumer households served and consumer high-speed Internet customers; |
• | the impact of equipment failure, natural disasters or terrorist acts; |
• | the effects of work stoppages by our employees or employees of other communications companies on whom we rely for service; and |
• | those additional factors under “Risk Factors” in Item 1A of Part I of our Annual Report on Form 10-K for the year ended December 31, 2017, and in subsequent filings with the Securities and Exchange Commission at www.sec.gov. |
85
In addition to these factors, actual future performance, outcomes and results may differ materially because of more general factors including, among others, general industry and market conditions and growth rates, economic conditions, and governmental and public policy changes.
We undertake no obligation to update or revise any forward-looking statements, whether as a result of new information, future events or otherwise. The foregoing review of factors that could cause our actual results to differ materially from those contemplated in the forward-looking statements should be considered in connection with information regarding risks and uncertainties that may affect our future results included in this Management’s Discussion and Analysis of Financial Condition and Results of Operations and in our other filings with the Securities and Exchange Commission at www.sec.gov.
86
WINDSTREAM HOLDINGS, INC.
WINDSTREAM SERVICES, LLC
FORM 10-Q
PART I - FINANCIAL INFORMATION
Item 3. Quantitative and Qualitative Disclosures About Market Risk
Market risk is comprised of three elements: interest rate risk, equity risk and foreign currency risk. We continue to have exposure to market risk from changes in interest rates, as further discussed below. Because we do not own any marketable equity securities nor operate in foreign countries denominated in foreign currencies, we are not exposed to equity or foreign currency risk. We have estimated our market risk using sensitivity analysis. The results of the sensitivity analysis are further discussed below. Actual results may differ from our estimates.
Interest Rate Risk
We are exposed to market risk through changes in interest rates, primarily as it relates to the variable interest rates we are charged under Windstream Services’ senior secured credit facility. Under our current policy, Windstream Services enters into interest rate swap agreements to obtain a targeted mixture of variable and fixed interest rate debt such that the portion of debt subject to variable rates does not exceed 25 percent of our total debt outstanding.
We have established policies and procedures for risk assessment and the approval, reporting and monitoring of interest rate swap activity. We do not enter into interest rate swap agreements, or other derivative financial instruments, for trading or speculative purposes. Management periodically reviews our exposure to interest rate fluctuations and implements strategies to manage the exposure.
As of June 30, 2018, Windstream Services has entered into six pay fixed, receive variable interest rate swap agreements designated as cash flow hedges of the benchmark LIBOR interest rate risk created by the variable cash flows paid on Windstream Services’ senior secured credit facility. The interest rate swaps mature on October 17, 2021. The hedging relationships are expected to be highly effective in mitigating cash flow risks resulting from changes in interest rates. For additional information regarding our interest rate swap agreements, see Note 6 to the consolidated financial statements.
As of June 30, 2018 and 2017, the unhedged portion of Windstream Services’ variable rate senior secured credit facility was $1,357.9 million, and $1,290.1 million, or approximately 22.8 percent and 22.9 percent, of Windstream Services’ total outstanding long-term debt excluding unamortized debt issuance costs, respectively. For variable rate debt instruments, market risk is defined as the potential change in earnings resulting from a hypothetical adverse change in interest rates. A hypothetical increase of 100.0 basis points in variable interest rates would have reduced annual pre-tax earnings by approximately $13.6 million and $12.9 million for the six-month period ended June 30, 2018 and 2017, respectively. Actual results may differ from this estimate.
87
WINDSTREAM HOLDINGS, INC.
WINDSTREAM SERVICES, LLC
FORM 10-Q
PART I - FINANCIAL INFORMATION
Item 4. Controls and Procedures
Controls and Procedures for Windstream Holdings, Inc.
(a) | Evaluation of disclosure controls and procedures. |
Our management, with the participation of the Chief Executive Officer and Chief Financial Officer, has evaluated the effectiveness of Windstream Holdings’ disclosure controls and procedures as of the end of the period covered by these quarterly reports (the “Evaluation Date”). The term “disclosure controls and procedures” (defined in Exchange Act Rule 13a-15(e)) refers to the controls and other procedures that are designed to ensure that information required to be disclosed by us in the reports that we file or submit under the Securities Exchange Act of 1934 (the “Exchange Act”) is recorded, processed, summarized and reported within the time periods specified in the SEC’s rules and forms. Disclosure controls and procedures include, without limitation, controls and procedures designed to ensure that information required to be disclosed by us in the reports that we file or submit under the Exchange Act is accumulated and communicated to our management, including our principal executive and principal financial officers, or persons performing similar functions, as appropriate to allow timely decisions regarding required disclosure. Based on the evaluation, our Chief Executive Officer and Chief Financial Officer have concluded that, as of the Evaluation Date, such disclosure controls and procedures were effective.
(b) | Changes in internal control over financial reporting. |
We continue to integrate policies, processes, people, technology, and operations relating to acquisitions of Broadview and EarthLink and will continue to evaluate the impact of any related changes to our internal control over financial reporting. Except for any changes in our internal control over financial reporting related to the integration of Broadview and EarthLink, there were no other changes in our internal control over financial reporting during the second quarter of 2018 that have materially affected, or are reasonably likely to materially affect, our internal control over financial reporting.
Controls and Procedures for Windstream Services, LLC
(a) | Evaluation of disclosure controls and procedures. |
Our management, with the participation of the Chief Executive Officer and Chief Financial Officer, has evaluated the effectiveness of Windstream Services’ disclosure controls and procedures as of the end of the period covered by these quarterly reports (the “Evaluation Date”). The term “disclosure controls and procedures” (defined in Exchange Act Rule 13a-15(e)) refers to the controls and other procedures that are designed to ensure that information required to be disclosed by us in the reports that we file or submit under the Securities Exchange Act of 1934 (the “Exchange Act”) is recorded, processed, summarized and reported within the time periods specified in the SEC’s rules and forms. Disclosure controls and procedures include, without limitation, controls and procedures designed to ensure that information required to be disclosed by us in the reports that we file or submit under the Exchange Act is accumulated and communicated to our management, including our principal executive and principal financial officers, or persons performing similar functions, as appropriate to allow timely decisions regarding required disclosure. Based on the evaluation, our Chief Executive Officer and Chief Financial Officer have concluded that, as of the Evaluation Date, such disclosure controls and procedures were effective.
(b) | Changes in internal control over financial reporting. |
We continue to integrate policies, processes, people, technology, and operations relating to acquisitions of Broadview and EarthLink and will continue to evaluate the impact of any related changes to our internal control over financial reporting. Except for any changes in our internal control over financial reporting related to the integration of Broadview and EarthLink, there were no other changes in our internal control over financial reporting during the second quarter of 2018 that have materially affected, or are reasonably likely to materially affect, our internal control over financial reporting.
88
WINDSTREAM HOLDINGS, INC.
WINDSTREAM SERVICES, LLC
FORM 10-Q
PART II - OTHER INFORMATION
Item 1. Legal Proceedings
Litigation
On February 9, 2015, a putative stockholder filed a Shareholder Class Action Complaint in the Delaware Court of Chancery (the “Court”), captioned Doppelt v. Windstream Holdings, Inc., et al., C.A. No. 10629-VCN, against the Company and its board of directors. This complaint was accompanied by a motion for a preliminary injunction seeking to enjoin the spin-off. The Court, ruling from the bench on February 19, 2015 - the day before a special meeting of stockholders was scheduled to vote on a reverse stock split and amended governing documents (the “Proposals”) - denied plaintiff’s motion for a preliminary injunction, reasoning that much of the information sought by plaintiff had been disclosed in public filings available on the United States Securities and Exchange Commission’s website, the Windstream Holdings’ board of directors was in no way conflicted, and while approval of the Proposals would facilitate the spin-off, approval was not necessary to effect the spin-off. On March 16, 2015, plaintiff, joined by a second putative Windstream stockholder, filed an Amended Shareholder Class Action Complaint alleging breaches of fiduciary duty by the Company and its Board concerning Windstream’s disclosures and seeking to rescind the spin-off and unspecified monetary damages. On February 5, 2016, the Court dismissed Windstream as a named party and also dismissed the plaintiffs’ demand to rescind the spin-off, but otherwise denied Windstream’s motion to dismiss plaintiffs’ claims. On or about January 27, 2017, the plaintiffs filed a motion seeking class certification which the Court granted on April 17, 2017. The parties reached a settlement of all claims that was approved by the court at a hearing on June 20, 2018, and the case was dismissed.
In a notice letter received September 22, 2017 (the “Original Notice”), Aurelius Capital Master, Ltd. ("Aurelius") asserted an alleged default of certain senior unsecured notes, the 6.375 percent Senior Notes due 2023 of Windstream Services, based on alleged violations of the associated indenture (the "2013 Indenture"). Aurelius primarily alleged that Windstream Services violated the 2013 Indenture by executing the REIT Spin-Off in April 2015 that, according to Aurelius, constituted a Sale and Leaseback Transaction that was prohibited under Section 4.19 of the Indenture and that violated Section 4.07 of the 2013 Indenture by not delivering certain required Officers' Certificates associated with alleged Restricted Payments. The Original Notice purported to constitute a written notice of default, which would trigger a 60-day grace or cure period after which the Indenture trustee or holders of at least 25 percent in aggregate principal amount of outstanding Notes could declare the principal amount of all outstanding 6.375 percent Notes to be immediately due and payable. If an “Event of Default” is found to have occurred under the 2013 Indenture, then such “Event of Default” could also constitute an “Event of Default” under the Windstream Services’ Credit Agreement. In addition, if an “Event of Default” is deemed to have occurred under the 2013 Indenture and Windstream Services’ obligations under the 2013 Indenture and the 6.375 percent 2023 Notes are accelerated, this could also constitute an “Event of Default” under the indentures governing the Windstream Services’ other senior notes.
In light of the allegations in the Original Notice, Windstream Services filed suit against U.S. Bank N.A., the Indenture Trustee (the “Trustee”), in Delaware Chancery Court seeking a declaration that it had not violated any provision of the 2013 Indenture and injunctive relief. On October 12, 2017, the Trustee filed suit in the Southern District of New York seeking a declaration that defaults had occurred. Windstream Services filed an answer and affirmative defenses in response to the Trustee’s complaint the following day, as well as counterclaims against the Trustee and Aurelius for declaratory relief. The Delaware action was subsequently dismissed.
Additionally, as outlined in Note 5, on October 18, 2017, Windstream Services launched debt exchange offers with respect to its senior notes, including the Notes, and on October 31, 2017, learned that based on tenders of notes in the exchange offers and consents delivered in the consent solicitation, upon early settlement of the exchange offers, holders representing the requisite percentage of the Notes needed to waive the defaults alleged in the Original Notice would be received. On November 6, 2017, Windstream Services and the Trustee executed a supplemental indenture, and new 6.375 percent Notes were issued, which gave effect to the waivers and consents for the Notes, is binding on all noteholders, and negates assertions made by Aurelius and the Indenture Trustee.During the fourth quarter of 2017, Windstream Services also completed consent solicitations with respect to each of its series of outstanding Notes, pursuant to which noteholders agreed to waive alleged defaults with respect to the transactions related to the spin-off of Uniti and amend the indentures governing the Notes to give effect to such waivers and amendments. Windstream Services received such consents from the holders representing a majority of the outstanding aggregate principal amount of the Notes. Windstream Services, the trustee under the indentures governing the Notes and the other parties to such indentures executed supplemental indentures giving effect to the waivers and amendments pursuant to the consent solicitation.
89
On November 22, 2017, Windstream Services filed a motion for judgment on the pleadings seeking dismissal of the Trustee’s complaint, which motion was denied without prejudice. On the same date, Aurelius filed counterclaims seeking a declaration that the new 6.375 percent Notes were improperly issued and that the debt exchange offers and consent solicitation were void. Windstream Services asserted that such counterclaims should be dismissed pursuant to Section 6.06 of the Indenture, which contains a "no-action" clause. Aurelius amended its counterclaims, and on February 2, 2018, Windstream Services filed an answer and affirmative defenses in response to the amended counterclaims. On November 27, 2017, Windstream Services received a second purported notice of default dated November 27, 2017 (the “Second Notice”) from Aurelius which alleged that certain of the Exchange and Consent Transactions violated the terms of the Indenture. Aurelius withdrew the Second Notice on December 6, 2017, and served an alleged notice of an Event of Default and acceleration on December 7, 2017 (“Notice of Acceleration”). The Notice of Acceleration claimed that the principal amount, and all accrued interest, owed under the note associated with the 2013 Indenture was now due and payable as result of Windstream Services allegedly not curing the alleged defaults set forth in the Original Notice within the sixty-day cure period. Windstream Services disputes that any amounts are due and owing and has denied all allegations made in the Original Notice, the Second Notice (now withdrawn) and the Notice of Acceleration, and asserted the allegations are without merit in the pending litigation. Windstream Services maintains that claims asserted by Aurelius and the Trustee are mooted in light of the debt exchanges and consent transactions discussed herein and that Windstream Services has been, and remains, in compliance with all of the covenants under the 2013 Indenture. However, there is no guarantee of success in the litigation and any adverse ruling could have a material adverse effect on our future consolidated results of operations, cash flows or financial condition.
Trial in this matter occurred July 23-25, 2018, and the court heard final arguments on July 31, 2018. At this time, the court has not yet issued a ruling in the matter.
We are party to various legal proceedings and the ultimate resolution of these legal proceedings cannot be determined at this time. However, based on current circumstances, management does not believe such proceedings, individually or in the aggregate, will have a material adverse effect on our future consolidated results of operations, cash flows or financial condition.
Finally, management is currently not aware of any environmental matters, individually or in the aggregate, that would have a material adverse effect on our consolidated financial condition or results of our operations.
Other Matters
Windstream and one of its business customers had an agreement pursuant to which Windstream provided communication services to several of the customer’s locations. The majority of funding for the services is administered by the Universal Service Administrative Company (“USAC”) pursuant to the Universal Service Rural Health Care Telecommunications Program that offers reduced rates for broadband and telecommunications services to rural health care facilities. In March 2017, USAC issued a funding denial to the customer on the basis that certain rules of the FCC were violated with the selection of Windstream as the service provider. Due to an alleged conflict of interest created by a third-party Windstream channel partner that acted as a consultant for the customer regarding the agreement, USAC asserted that Windstream’s selection was not based upon a fair and open competitive bidding process. USAC’s denial addressed accrued funding of approximately $16.6 million, as well as funding of approximately $6.0 million previously remitted to us. Windstream, along with the customer, has appealed the denial; USAC rejected the appeal on June 29, 2018, upholding its previous denial of funding. Windstream plans to appeal the denial with the FCC and will do so prior to August 28, 2018, the deadline to file the appeal. While the ultimate resolution is not currently predictable, if there is a future adverse legal ruling against Windstream, the ruling could constitute a material adverse outcome on our f
Item 1A. Risk Factors
There have been no material changes to the risk factors affecting our businesses that were discussed in “Risk Factors” in Item 1A of Part I of our Annual Report on Form 10-K for the year ended December 31, 2017, filed with the SEC on February 28, 2018.
90
Item 6. Exhibits
INDEX OF EXHIBITS | |||
Form 10-Q Exhibit No. | Description of Exhibits | ||
31(a) | (a) | ||
31(b) | (a) | ||
32(a) | (a) | ||
32(b) | (a) | ||
101.INS | XBRL Instance Document | (a) | |
101.SCH | XBRL Taxonomy Extension Schema Document | (a) | |
101.CAL | XBRL Taxonomy Extension Calculation Linkbase Document | (a) | |
101.DEF | XBRL Taxonomy Extension Definition Linkbase Document | (a) | |
101.LAB | XBRL Taxonomy Extension Label Linkbase Document | (a) | |
101.PRE | XBRL Taxonomy Extension Presentation Linkbase Document | (a) | |
* | Incorporated herein by reference as indicated. |
(a) | Filed herewith. |
91
SIGNATURE
Pursuant to the requirements of the Securities Exchange Act of 1934, this registrants have duly caused this report to be signed on its behalf the undersigned, thereunto duly authorized.
WINDSTREAM HOLDINGS, INC. | WINDSTREAM SERVICES, LLC | |
(Registrant) | (Registrant) | |
/s/ Robert E. Gunderman | /s/ Robert E. Gunderman | |
Robert E. Gunderman Chief Financial Officer and Treasurer (Principal Financial Officer) | Robert E. Gunderman Chief Financial Officer and Treasurer (Principal Financial Officer) | |
August 9, 2018 | August 9, 2018 | |
92