Attached files
| file | filename |
|---|---|
| 8-K - 8-K - Village Bank & Trust Financial Corp. | tv500561_8k.htm |
You're a Neighbor, Not a Number August 2018 Investor Presentation Exhibit 99.1
Cautionary Statement Regarding Forward - Looking Statements This presentation contains forward - looking statements within the meaning of the Private Securities Litigation Reform Act of 1995. These forward - looking statements include, but are not limited to, statements about ( i ) the Company’s plans, objectives, expectations and intentions and other statements contained in this presentation that are not historical facts; and (ii) other statements identified by words such as “expects” “anticipates,” “intends,” “plans,” “believes,” “seeks,” “estimates,” “targets,” “projects,” or words of similar meaning generally intended to identify forward - looking statements. These forward - looking statements are based on the current beliefs and expectations of the Company’s management and are inherently subject to significant business, economic and competitive uncertainties and contingencies, many of which are beyond management’s control. In addition, these forward - looking statements are subject to assumptions with respect to future business strategies and decisions that are subject to change. Actual results may differ materially from the anticipated results discussed or implied in these forward - looking statements because of numerous possible uncertainties. The following factors, among others, could cause actual results to differ materially from the anticipated results or other expectations expressed in the forward - looking statements: (1) adverse governmental or regulatory policies may be enacted; (2) the interest rate environment may compress margins and adversely affect net interest income; (3) results may be adversely affected by continued diversification of assets and adverse changes to credit quality; (4) competition from other financial services companies in the Company’s markets could adversely affect operations; (5) a change in the current economic environment could adversely affect credit quality and loan originations; and (6) social and political conditions such as war, political unrest and terrorism or natural disasters could have unpredictable negative effects on our businesses and the economy. Additional factors that could cause actual results to differ materially from those expressed in the forward - looking statements are discussed in the Company’s reports (such as our Annual Report on Form 10 - K, Quarterly Reports on Form 10 - Q and Current Reports on Form 8 - K) filed with the Securities and Exchange Commission and available on the SEC’s website at www.sec.gov.
Agenda Who is Village Bank? Financial Highlights Plan for Completing our Work of Becoming a Top Performer I II III
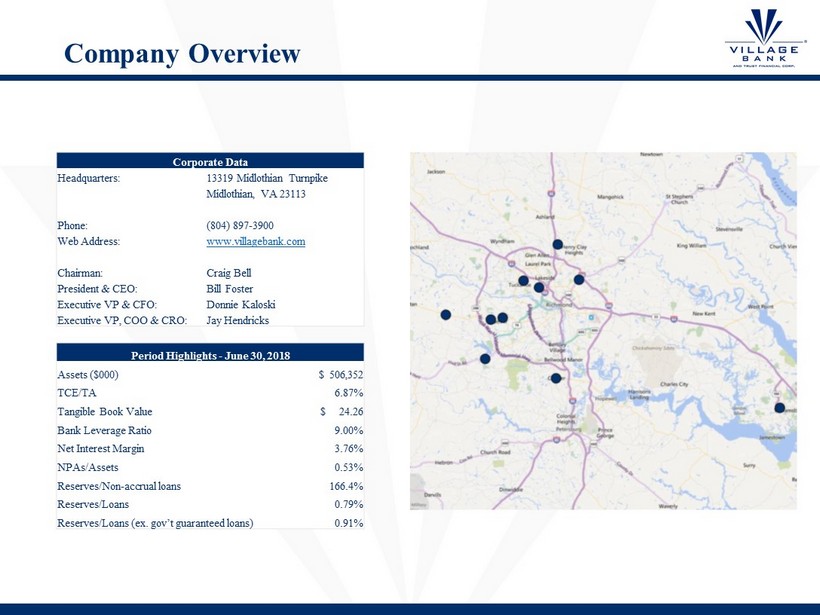
Company Overview Corporate Data Headquarters: 13319 Midlothian Turnpike Midlothian, VA 23113 Phone: (804) 897 - 3900 Web Address: www.villagebank.com Chairman: Craig Bell President & CEO: Bill Foster Executive VP & CFO: Donnie Kaloski Executive VP, COO & CRO: Jay Hendricks Period Highlights - June 30, 2018 Assets ($000) $ 506,352 TCE/TA 6.87% Tangible Book Value $ 24.26 Bank Leverage Ratio 9.00% Net Interest Margin 3.76% NPAs/Assets 0.53% Reserves/Non - accrual loans 166.4% Reserves/Loans 0.79% Reserves/Loans (ex. gov’t guaranteed loans) 0.91%

Leadership Team Bill Foster President & CEO Jay Hendricks Chief Risk Officer Chief Operating Officer Donnie Kaloski Chief Financial Officer Max Morehead Commercial Banking Joy Kline Retail Banking Clif Winn President & CEO Village Bank Mortgage Corp Lindsay Cheatham Director of Human Resources Price Beazley Chief Technology Officer Jen Merritt Director of Marketing
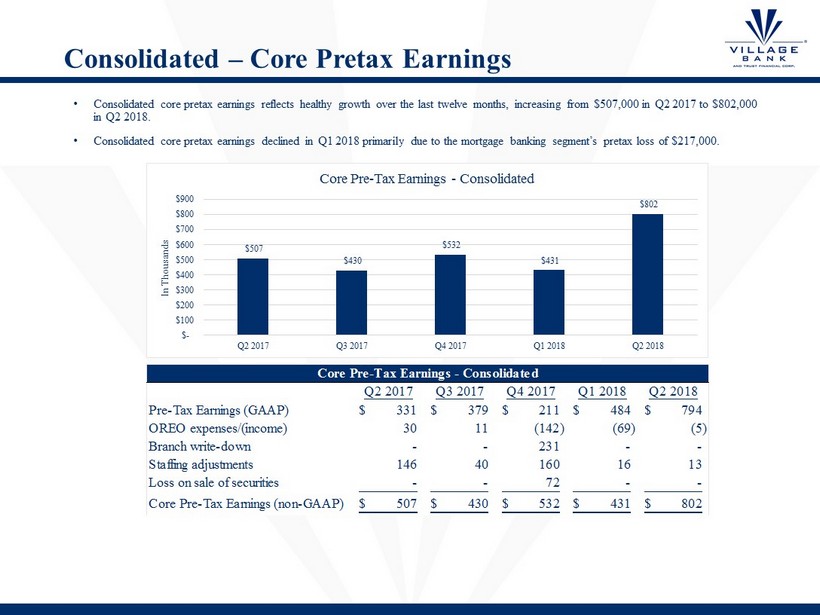
Consolidated – Core Pretax Earnings • Consolidated core pretax earnings reflects healthy growth over the last twelve months, increasing from $507,000 in Q2 2017 to $8 02,000 in Q2 2018. • Consolidated core pretax earnings declined in Q1 2018 primarily due to the mortgage banking segment’s pretax loss of $217,000 . Q2 2017 Q3 2017 Q4 2017 Q1 2018 Q2 2018 Pre-Tax Earnings (GAAP) 331$ 379$ 211$ 484$ 794$ OREO expenses/(income) 30 11 (142) (69) (5) Branch write-down - - 231 - - Staffing adjustments 146 40 160 16 13 Loss on sale of securities - - 72 - - Core Pre-Tax Earnings (non-GAAP) 507$ 430$ 532$ 431$ 802$ Core Pre-Tax Earnings - Consolidated $507 $430 $532 $431 $802 $- $100 $200 $300 $400 $500 $600 $700 $800 $900 Q2 2017 Q3 2017 Q4 2017 Q1 2018 Q2 2018 In Thousands Core Pre - Tax Earnings - Consolidated
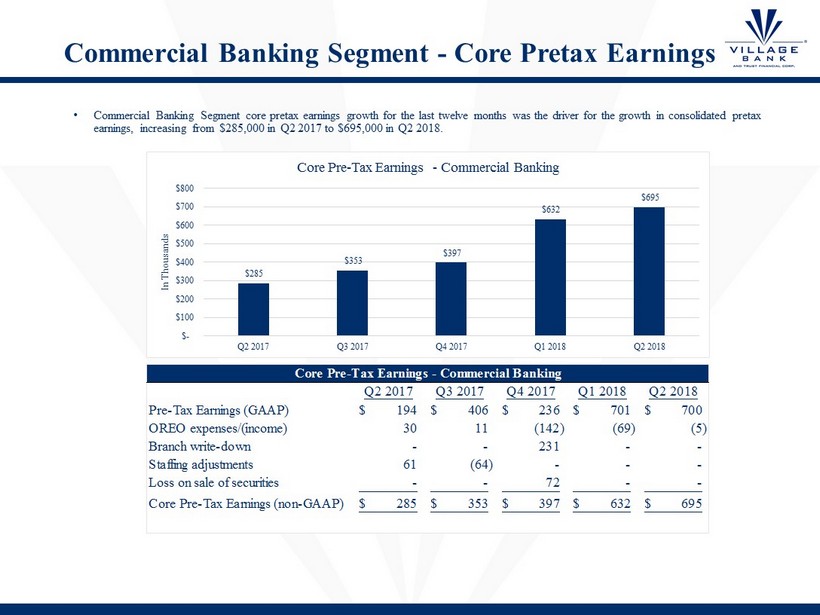
Commercial Banking Segment - Core Pretax Earnings • Commercial Banking Segment core pretax earnings growth for the last twelve months was the driver for the growth in consolidated pretax earnings, increasing from $285,000 in Q2 2017 to $695,000 in Q2 2018 . Q2 2017 Q3 2017 Q4 2017 Q1 2018 Q2 2018 Pre-Tax Earnings (GAAP) 194$ 406$ 236$ 701$ 700$ OREO expenses/(income) 30 11 (142) (69) (5) Branch write-down - - 231 - - Staffing adjustments 61 (64) - - - Loss on sale of securities - - 72 - - Core Pre-Tax Earnings (non-GAAP) 285$ 353$ 397$ 632$ 695$ Core Pre-Tax Earnings - Commercial Banking $285 $353 $397 $632 $695 $- $100 $200 $300 $400 $500 $600 $700 $800 Q2 2017 Q3 2017 Q4 2017 Q1 2018 Q2 2018 In Thousands Core Pre - Tax Earnings - Commercial Banking
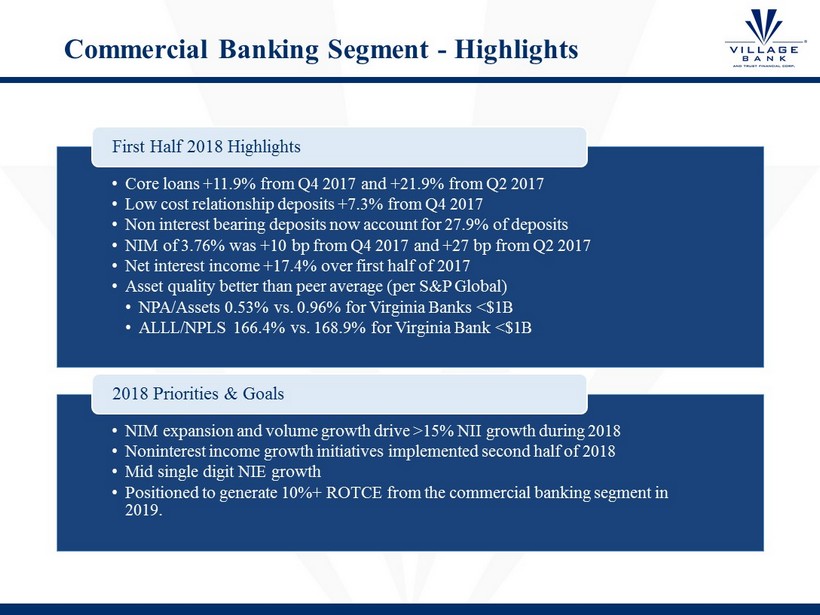
Commercial Banking Segment - Highlights • Core loans +11.9% from Q4 2017 and +21.9% from Q2 2017 • Low cost relationship deposits +7.3% from Q4 2017 • Non interest bearing deposits now account for 27.9% of deposits • NIM of 3.76% was +10 bp from Q4 2017 and +27 bp from Q2 2017 • Net interest income +17.4% over first half of 2017 • Asset quality better than peer average (per S&P Global) • NPA/Assets 0.53% vs. 0.96% for Virginia Banks <$1B • ALLL/NPLS 166.4% vs. 168.9% for Virginia Bank <$1B First Half 2018 Highlights • NIM expansion and volume growth drive >15% NII growth during 2018 • Noninterest income growth initiatives implemented second half of 2018 • Mid single digit NIE growth • Positioned to generate 10%+ ROTCE from the commercial banking segment in 2019. 2018 Priorities & Goals
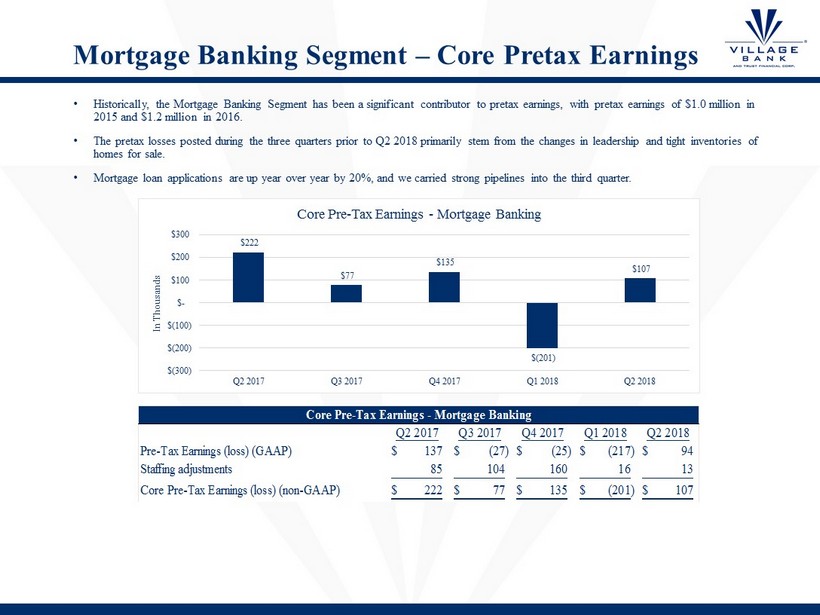
Mortgage Banking Segment – Core Pretax Earnings • Historically, the Mortgage Banking Segment has been a significant contributor to pretax earnings, with pretax earnings of $1. 0 m illion in 2015 and $1.2 million in 2016. • The pretax losses posted during the three quarters prior to Q2 2018 primarily stem from the changes in leadership and tight i nve ntories of homes for sale. • Mortgage loan applications are up year over year by 20%, and we carried strong pipelines into the third quarter. Q2 2017 Q3 2017 Q4 2017 Q1 2018 Q2 2018 Pre-Tax Earnings (loss) (GAAP) 137$ (27)$ (25)$ (217)$ 94$ Staffing adjustments 85 104 160 16 13 Core Pre-Tax Earnings (loss) (non-GAAP) 222$ 77$ 135$ (201)$ 107$ Core Pre-Tax Earnings - Mortgage Banking $222 $77 $135 $(201) $107 $(300) $(200) $(100) $- $100 $200 $300 Q2 2017 Q3 2017 Q4 2017 Q1 2018 Q2 2018 In Thousands Core Pre - Tax Earnings - Mortgage Banking
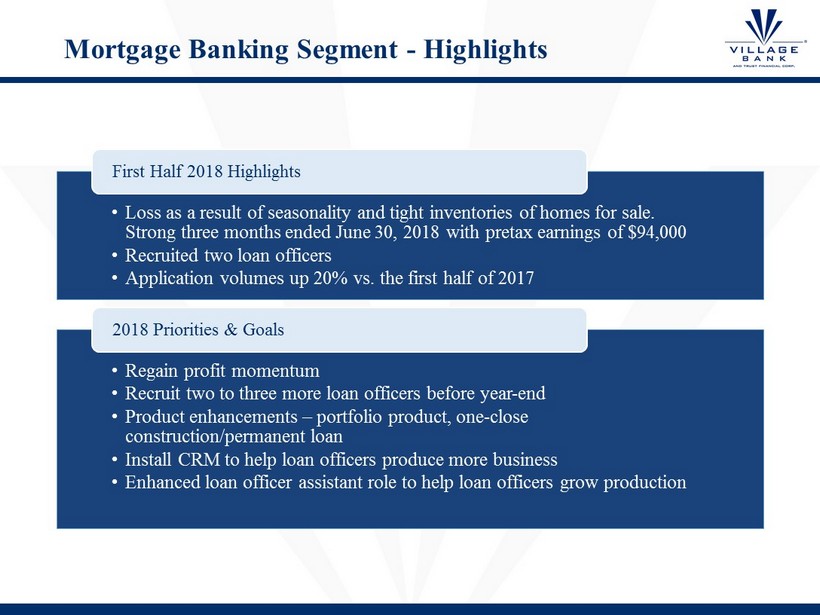
Mortgage Banking Segment - Highlights • Loss as a result of seasonality and tight inventories of homes for sale. Strong three months ended June 30, 2018 with pretax earnings of $94,000 • Recruited two loan officers • Application volumes up 20% vs. the first half of 2017 First Half 2018 Highlights • Regain profit momentum • Recruit two to three more loan officers before year - end • Product enhancements – portfolio product, one - close construction/permanent loan • Install CRM to help loan officers produce more business • Enhanced loan officer assistant role to help loan officers grow production 2018 Priorities & Goals
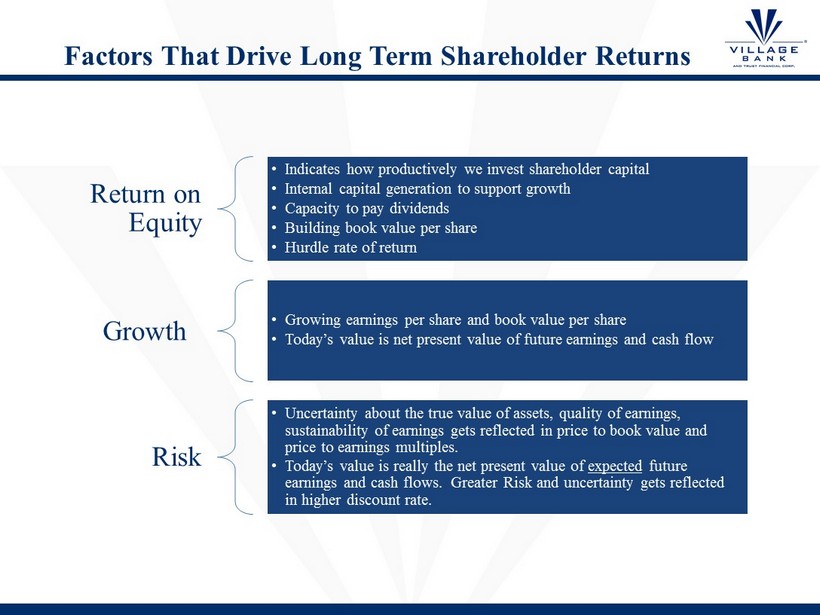
Factors That Drive Long Term Shareholder Returns Return on Equity • Indicates how productively we invest shareholder capital • Internal capital generation to support growth • Capacity to pay dividends • Building book value per share • Hurdle rate of return Growth • Growing earnings per share and book value per share • Today’s value is net present value of future earnings and cash flow Risk • Uncertainty about the true value of assets, quality of earnings, sustainability of earnings gets reflected in price to book value and price to earnings multiples. • Today’s value is really the net present value of expected future earnings and cash flows. Greater Risk and uncertainty gets reflected in higher discount rate.
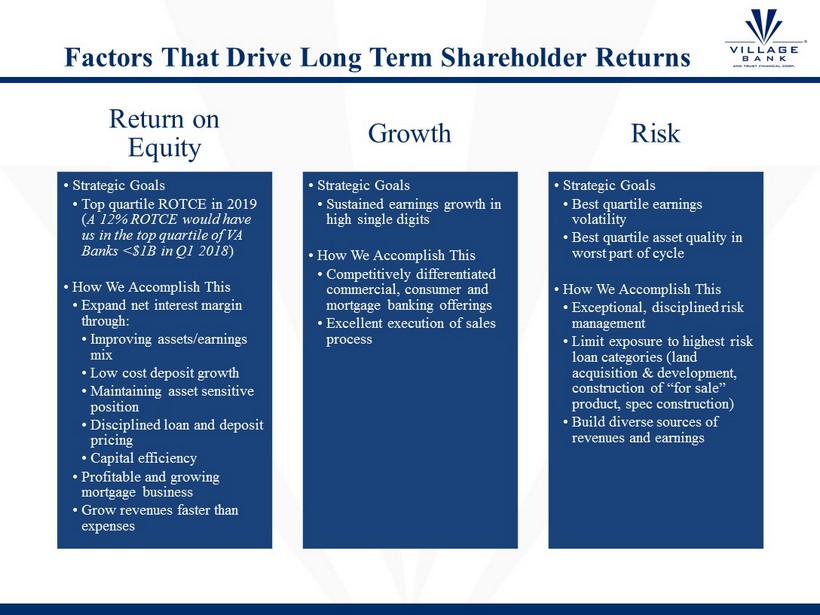
Factors That Drive Long Term Shareholder Returns Return on Equity • Strategic Goals • Top quartile ROTCE in 2019 ( A 12% ROTCE would have us in the top quartile of VA Banks <$1B in Q1 2018 ) • How We Accomplish This • Expand net interest margin through: • Improving assets/earnings mix • Low cost deposit growth • Maintaining asset sensitive position • Disciplined loan and deposit pricing • Capital efficiency • Profitable and growing mortgage business • Grow revenues faster than expenses Growth • Strategic Goals • Sustained earnings growth in high single digits • How We Accomplish This • Competitively differentiated commercial, consumer and mortgage banking offerings • Excellent execution of sales process Risk • Strategic Goals • Best quartile earnings volatility • Best quartile asset quality in worst part of cycle • How We Accomplish This • Exceptional, disciplined risk management • Limit exposure to highest risk loan categories (land acquisition & development, construction of “for sale” product, spec construction) • Build diverse sources of revenues and earnings
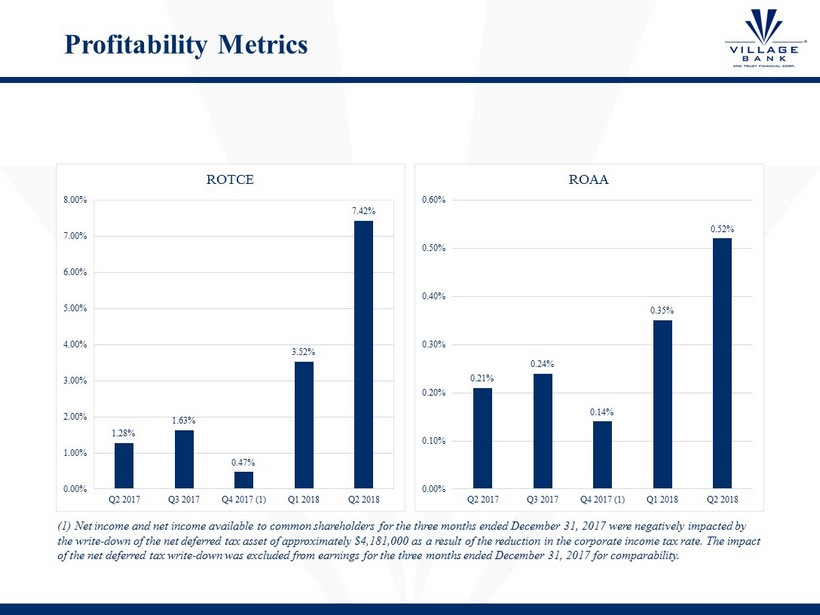
Profitability Metrics 1.28% 1.63% 0.47% 3.52% 7.42% 0.00% 1.00% 2.00% 3.00% 4.00% 5.00% 6.00% 7.00% 8.00% Q2 2017 Q3 2017 Q4 2017 (1) Q1 2018 Q2 2018 ROTCE 0.21% 0.24% 0.14% 0.35% 0.52% 0.00% 0.10% 0.20% 0.30% 0.40% 0.50% 0.60% Q2 2017 Q3 2017 Q4 2017 (1) Q1 2018 Q2 2018 ROAA (1) Net income and net income available to common shareholders for the three months ended December 31, 2017 were negatively impacted by the write - down of the net deferred tax asset of approximately $4,181,000 as a result of the reduction in the corporate income ta x rate. The impact of the net deferred tax write - down was excluded from earnings for the three months ended December 31, 2017 for comparability.
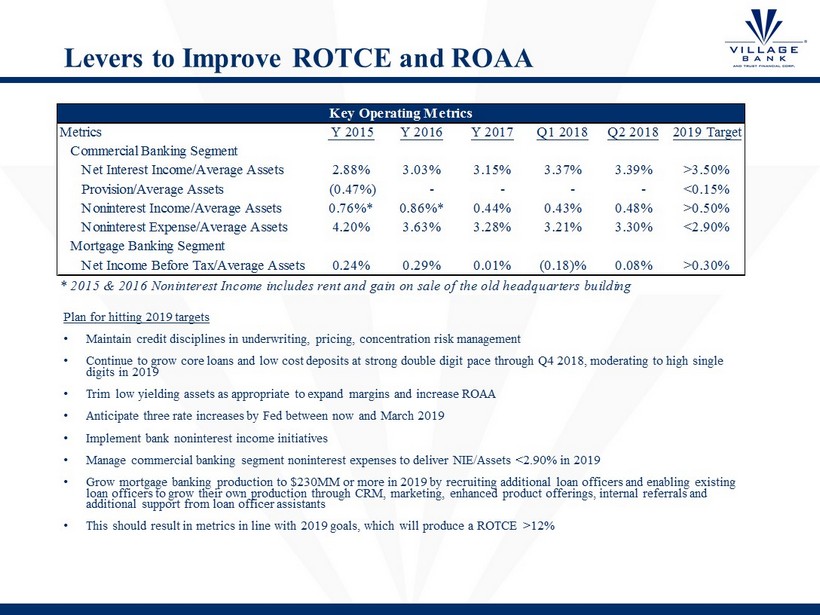
Levers to Improve ROTCE and ROAA Plan for hitting 2019 targets • Maintain credit disciplines in underwriting, pricing, concentration risk management • Continue to grow core loans and low cost deposits at strong double digit pace through Q4 2018, moderating to high single digits in 2019 • Trim low yielding assets as appropriate to expand margins and increase ROAA • Anticipate three rate increases by Fed between now and March 2019 • Implement bank noninterest income initiatives • Manage commercial banking segment noninterest expenses to deliver NIE/Assets <2.90% in 2019 • Grow mortgage banking production to $230MM or more in 2019 by recruiting additional loan officers and enabling existing loan officers to grow their own production through CRM, marketing, enhanced product offerings, internal referrals and additional support from loan officer assistants • This should result in metrics in line with 2019 goals, which will produce a ROTCE >12% Metrics Y 2015 Y 2016 Y 2017 Q1 2018 Q2 2018 2019 Target Commercial Banking Segment Net Interest Income/Average Assets 2.88% 3.03% 3.15% 3.37% 3.39% >3.50% Provision/Average Assets (0.47%) - - - - <0.15% Noninterest Income/Average Assets 0.76%* 0.86%* 0.44% 0.43% 0.48% >0.50% Noninterest Expense/Average Assets 4.20% 3.63% 3.28% 3.21% 3.30% <2.90% Mortgage Banking Segment Net Income Before Tax/Average Assets 0.24% 0.29% 0.01% (0.18)% 0.08% >0.30% * 2015 & 2016 Noninterest Income includes rent and gain on sale of the old headquarters building Key Operating Metrics
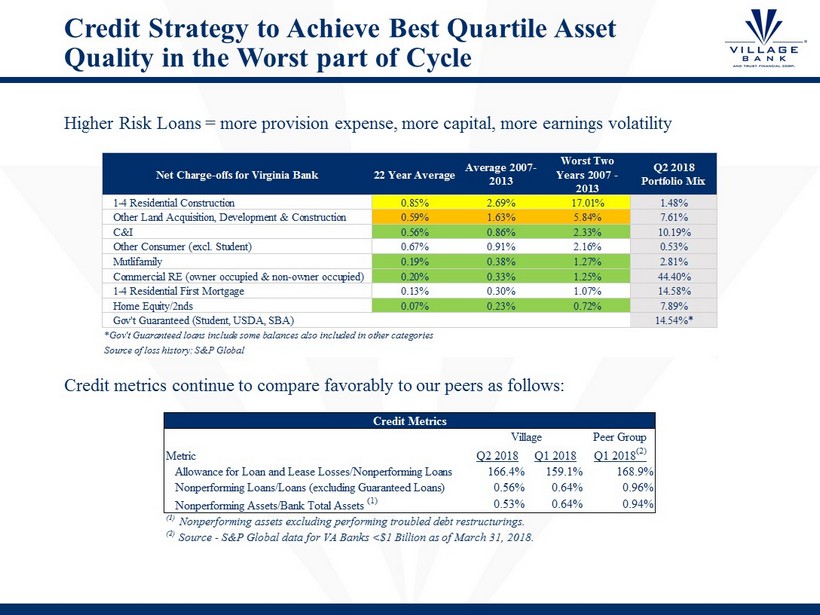
Credit Strategy to Achieve Best Quartile Asset Quality in the Worst part of Cycle Higher Risk Loans = more provision expense, more capital, more earnings volatility Net Charge-offs for Virginia Bank 22 Year Average Average 2007- 2013 Worst Two Years 2007 - 2013 Q2 2018 Portfolio Mix 1-4 Residential Construction 0.85% 2.69% 17.01% 1.48% Other Land Acquisition, Development & Construction 0.59% 1.63% 5.84% 7.61% C&I 0.56% 0.86% 2.33% 10.19% Other Consumer (excl. Student) 0.67% 0.91% 2.16% 0.53% Mutlifamily 0.19% 0.38% 1.27% 2.81% Commercial RE (owner occupied & non-owner occupied) 0.20% 0.33% 1.25% 44.40% 1-4 Residential First Mortgage 0.13% 0.30% 1.07% 14.58% Home Equity/2nds 0.07% 0.23% 0.72% 7.89% Gov't Guaranteed (Student, USDA, SBA) 14.54%* *Gov't Guaranteed loans include some balances also included in other categories Source of loss history: S&P Global Peer Group Q2 2018 Q1 2018 Q1 2018 (2) Allowance for Loan and Lease Losses/Nonperforming Loans 166.4% 159.1% 168.9% Nonperforming Loans/Loans (excluding Guaranteed Loans) 0.56% 0.64% 0.96% Nonperforming Assets/Bank Total Assets (1) 0.53% 0.64% 0.94% (1) Nonperforming assets excluding performing troubled debt restructurings. (2) Source - S&P Global data for VA Banks <$1 Billion as of March 31, 2018. Village Metric Credit Metrics Credit metrics continue to compare favorably to our peers as follows:
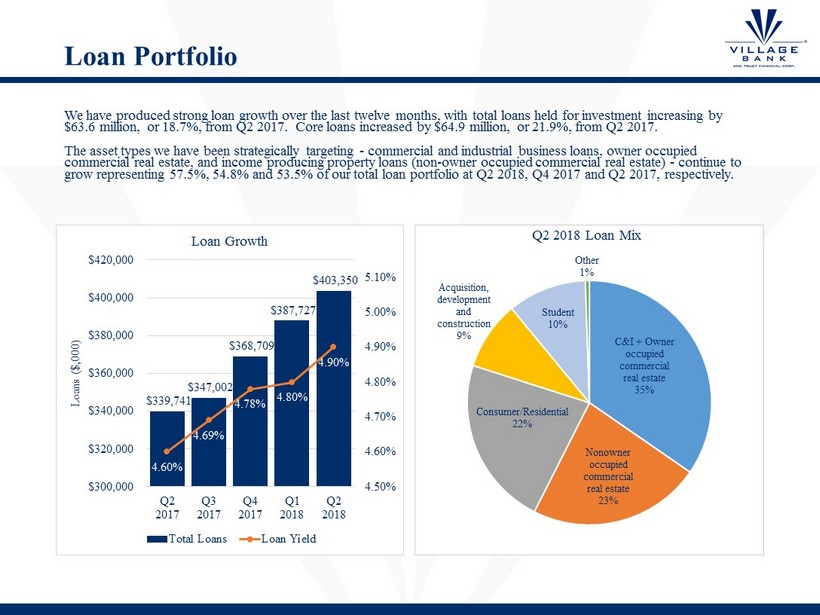
Loan Portfolio C&I + Owner occupied commercial real estate 35% Nonowner occupied commercial real estate 23% Consumer/Residential 22% Acquisition, development and construction 9% Student 10% Other 1% Q2 2018 Loan Mix We have produced strong loan growth over the last twelve months, with total loans held for investment increasing by $63.6 million, or 18.7%, from Q2 2017. Core loans increased by $64.9 million, or 21.9%, from Q2 2017. The asset types we have been strategically targeting - commercial and industrial business loans, owner occupied commercial real estate, and income producing property loans (non - owner occupied commercial real estate) - continue to grow representing 57.5%, 54.8% and 53.5% of our total loan portfolio at Q2 2018, Q4 2017 and Q2 2017, respectively. $339,741 $347,002 $368,709 $387,727 $403,350 4.60% 4.69% 4.78% 4.80% 4.90% 4.50% 4.60% 4.70% 4.80% 4.90% 5.00% 5.10% $300,000 $320,000 $340,000 $360,000 $380,000 $400,000 $420,000 Q2 2017 Q3 2017 Q4 2017 Q1 2018 Q2 2018 Loans ($,000) Loan Growth Total Loans Loan Yield
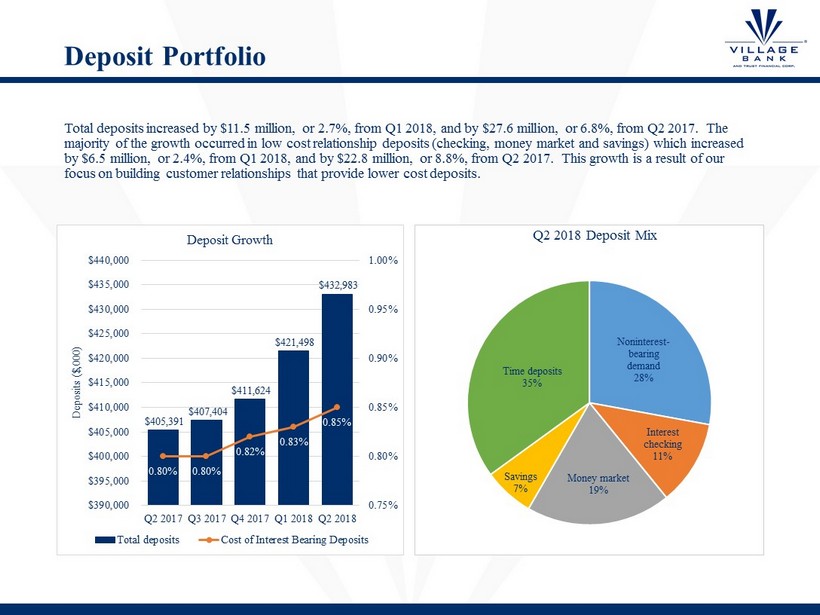
Deposit Portfolio Total deposits increased by $11.5 million, or 2.7%, from Q1 2018, and by $27.6 million, or 6.8%, from Q2 2017. The majority of the growth occurred in low cost relationship deposits (checking, money market and savings) which increased by $6.5 million, or 2.4%, from Q1 2018, and by $22.8 million, or 8.8%, from Q2 2017. This growth is a result of our focus on building customer relationships that provide lower cost deposits. Noninterest - bearing demand 28% Interest checking 11% Money market 19% Savings 7% Time deposits 35% Q2 2018 Deposit Mix $405,391 $407,404 $411,624 $421,498 $432,983 0.80% 0.80% 0.82% 0.83% 0.85% 0.75% 0.80% 0.85% 0.90% 0.95% 1.00% $390,000 $395,000 $400,000 $405,000 $410,000 $415,000 $420,000 $425,000 $430,000 $435,000 $440,000 Q2 2017 Q3 2017 Q4 2017 Q1 2018 Q2 2018 Deposits ($,000) Deposit Growth Total deposits Cost of Interest Bearing Deposits
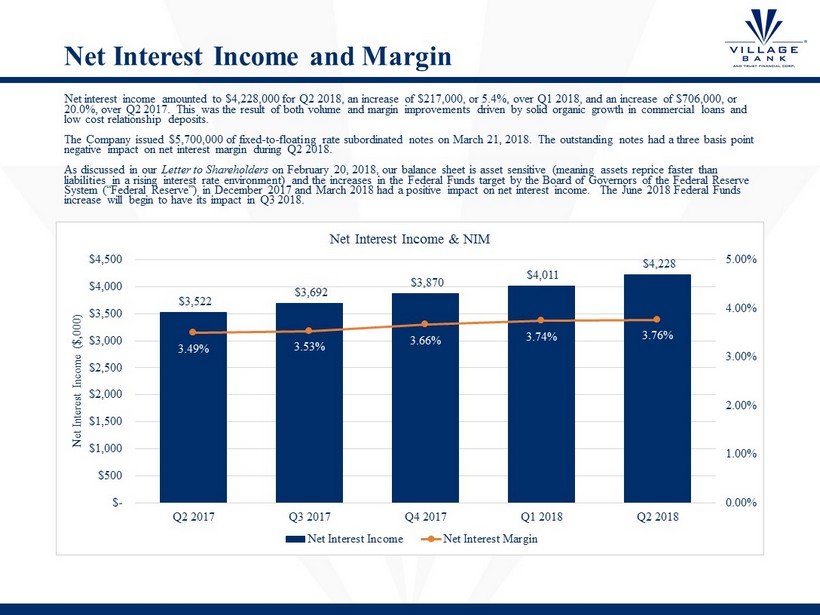
Net Interest Income and Margin Net interest income amounted to $4,228,000 for Q2 2018, an increase of $217,000, or 5.4%, over Q1 2018, and an increase of $7 06, 000, or 20.0%, over Q2 2017. This was the result of both volume and margin improvements driven by solid organic growth in commercial lo ans and low cost relationship deposits . The Company issued $5,700,000 of fixed - to - floating rate subordinated notes on March 21, 2018. The outstanding notes had a three basis point negative impact on net interest margin during Q2 2018. As discussed in our Letter to Shareholders on February 20, 2018, our balance sheet is asset sensitive (meaning assets reprice faster than liabilities in a rising interest rate environment) and the increases in the Federal Funds target by the Board of Governors of th e Federal Reserve System (“Federal Reserve”) in December 2017 and March 2018 had a positive impact on net interest income. The June 2018 Feder al Funds increase will begin to have its impact in Q3 2018. $3,522 $3,692 $3,870 $4,011 $4,228 3.49% 3.53% 3.66% 3.74% 3.76% 0.00% 1.00% 2.00% 3.00% 4.00% 5.00% $- $500 $1,000 $1,500 $2,000 $2,500 $3,000 $3,500 $4,000 $4,500 Q2 2017 Q3 2017 Q4 2017 Q1 2018 Q2 2018 Net Interest Income ($,000) Net Interest Income & NIM Net Interest Income Net Interest Margin
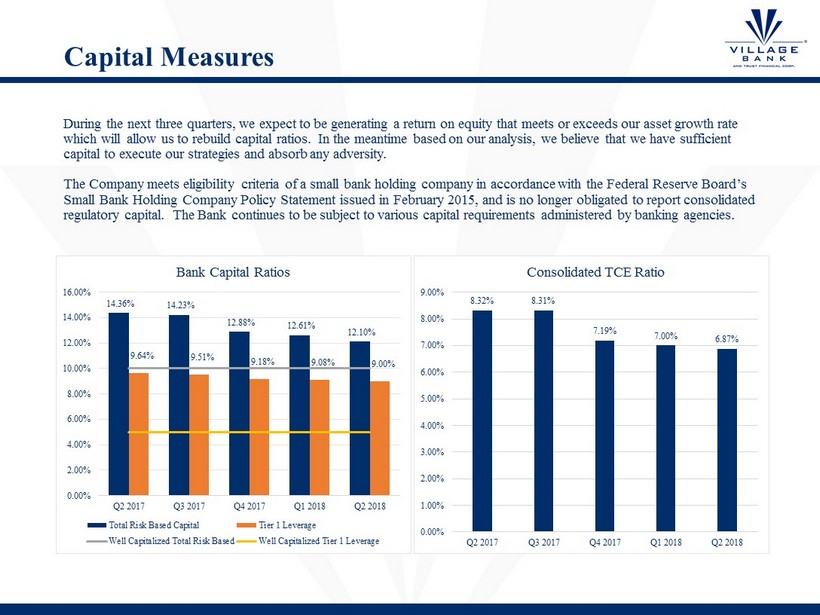
Capital Measures During the next three quarters, we expect to be generating a return on equity that meets or exceeds our asset growth rate which will allow us to rebuild capital ratios. In the meantime based on our analysis, we believe that we have sufficient capital to execute our strategies and absorb any adversity . The Company meets eligibility criteria of a small bank holding company in accordance with the Federal Reserve Board’s Small Bank Holding Company Policy Statement issued in February 2015, and is no longer obligated to report consolidated regulatory capital. The Bank continues to be subject to various capital requirements administered by banking agencies. 14.36% 14.23% 12.88% 12.61% 12.10% 9.64% 9.51% 9.18% 9.08% 9.00% 0.00% 2.00% 4.00% 6.00% 8.00% 10.00% 12.00% 14.00% 16.00% Q2 2017 Q3 2017 Q4 2017 Q1 2018 Q2 2018 Bank Capital Ratios Total Risk Based Capital Tier 1 Leverage Well Capitalized Total Risk Based Well Capitalized Tier 1 Leverage 8.32% 8.31% 7.19% 7.00% 6.87% 0.00% 1.00% 2.00% 3.00% 4.00% 5.00% 6.00% 7.00% 8.00% 9.00% Q2 2017 Q3 2017 Q4 2017 Q1 2018 Q2 2018 Consolidated TCE Ratio
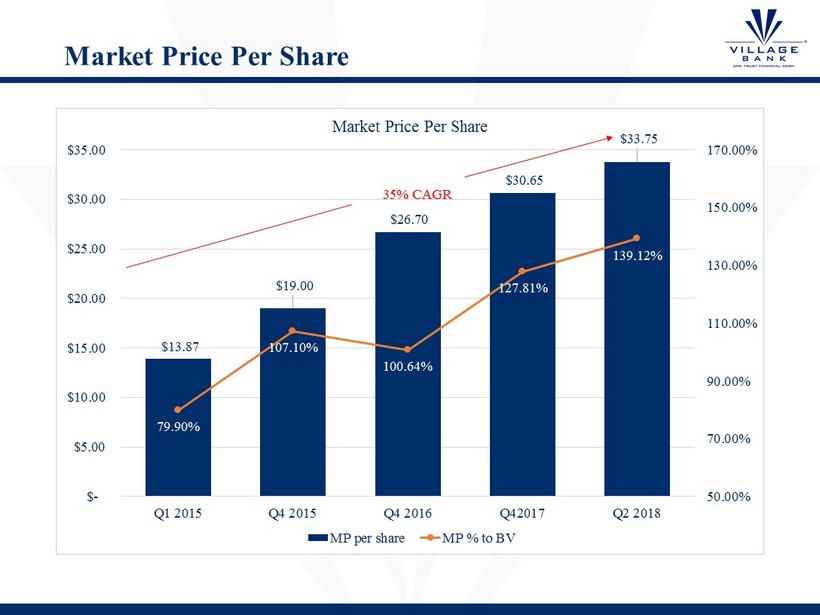
Market Price Per Share $13.87 $19.00 $26.70 $30.65 $33.75 79.90% 107.10% 100.64% 127.81% 139.12% 50.00% 70.00% 90.00% 110.00% 130.00% 150.00% 170.00% $- $5.00 $10.00 $15.00 $20.00 $25.00 $30.00 $35.00 Q1 2015 Q4 2015 Q4 2016 Q42017 Q2 2018 Market Price Per Share MP per share MP % to BV 35% CAGR
Conclusion • We believe that we have the talent, market and franchise to do what is necessary to achieve our objectives. • After several years of hard work, our balance sheet is positioned to be a high return balance sheet • Earning asset mix • Funding mix • Asset sensitivity • Credit profile • Our organic loan and low cost deposit growth is among the best in Virginia. • Our board has been doing the delicate work of reconfiguring itself and building a board for the future. This will continue in 2018 and 2019. • We will revisit our strategy of growth through bank M&A, expansion into wealth management, insurance or other lines of business once we hit our performance targets. Right now, we are focused on hitting our return and profitability targets. • Our stock price appreciation has been very strong, and we believe that hitting our targets will produce a very attractive upside.