Attached files
| file | filename |
|---|---|
| EX-32.2 - EXHIBIT 32.2 - Resolute Forest Products Inc. | rfp-2018630xex322.htm |
| EX-32.1 - EXHIBIT 32.1 - Resolute Forest Products Inc. | rfp-2018630xex321.htm |
| EX-31.2 - EXHIBIT 31.2 - Resolute Forest Products Inc. | rfp-2018630xex312.htm |
| EX-31.1 - EXHIBIT 31.1 - Resolute Forest Products Inc. | rfp-2018630xex311.htm |
| EX-10.2 - EXHIBIT 10.2 - Resolute Forest Products Inc. | rfp-2018630xex102.htm |
| EX-10.1 - EXHIBIT 10.1 - Resolute Forest Products Inc. | rfp-2018630xex101.htm |
UNITED STATES SECURITIES AND EXCHANGE COMMISSION
WASHINGTON, D.C. 20549
FORM 10-Q
(Mark One)
þ | QUARTERLY REPORT PURSUANT TO SECTION 13 OR 15(d) OF THE SECURITIES EXCHANGE ACT OF 1934 | |
FOR THE QUARTERLY PERIOD ENDED JUNE 30, 2018
¨ | TRANSITION REPORT PURSUANT TO SECTION 13 OR 15(d) OF THE SECURITIES EXCHANGE ACT OF 1934 | |
FOR THE TRANSITION PERIOD FROM TO
COMMISSION FILE NUMBER: 001-33776
RESOLUTE FOREST PRODUCTS INC.
(Exact name of registrant as specified in its charter)
Delaware | 98-0526415 |
(State or other jurisdiction of incorporation or organization) | (I.R.S. employer identification number) |
111 Robert-Bourassa Boulevard, Suite 5000; Montreal, Quebec; Canada H3C 2M1 |
(Address of principal executive offices) (Zip Code) |
(514) 875-2160 |
(Registrant’s telephone number, including area code) |
(Former name, former address and former fiscal year, if changed since last report) |
Indicate by check mark whether the registrant: (1) has filed all reports required to be filed by Section 13 or 15(d) of the Securities Exchange Act of 1934 during the preceding 12 months (or for such shorter period that the registrant was required to file such reports), and (2) has been subject to such filing requirements for the past 90 days. Yes þ No ¨
Indicate by check mark whether the registrant has submitted electronically and posted on its corporate Website, if any, every Interactive Data File required to be submitted and posted pursuant to Rule 405 of Regulation S-T (§232.405 of this chapter) during the preceding 12 months (or for such shorter period that the registrant was required to submit and post such files).
Yes þ No ¨
Indicate by check mark whether the registrant is a large accelerated filer, an accelerated filer, a non-accelerated filer, smaller reporting company, or an emerging growth company. See the definitions of “large accelerated filer,” “accelerated filer,” “smaller reporting company,” and “emerging growth company” in Rule 12b-2 of the Exchange Act.
Large accelerated filer ¨ | Accelerated filer þ | |
Non-accelerated filer ¨ (Do not check if a smaller reporting company) | Smaller reporting company ¨ | |
Emerging growth company ¨ | ||
If an emerging growth company, indicate by check mark if the registrant has elected not to use the extended transition period for complying with any new or revised financial accounting standards provided pursuant to Section 13(a) of the Exchange Act. ¨
Indicate by check mark whether the registrant is a shell company (as defined in Rule 12b-2 of the Exchange Act).
Yes ¨ No þ
As of July 31, 2018, there were 90,341,516 shares of Resolute Forest Products Inc. common stock, $0.001 par value, outstanding.
RESOLUTE FOREST PRODUCTS INC.
TABLE OF CONTENTS
Page Number | ||
PART I. FINANCIAL INFORMATION | ||
Item 1. Financial Statements: | ||
PART II. OTHER INFORMATION | ||
PART I. | FINANCIAL INFORMATION |
ITEM 1. | FINANCIAL STATEMENTS |
RESOLUTE FOREST PRODUCTS INC.
CONSOLIDATED STATEMENTS OF OPERATIONS
(Unaudited, in millions, except per share amounts)
Three Months Ended June 30, | Six Months Ended June 30, | ||||||||||||||||
2018 | 2017 | 2018 | 2017 | ||||||||||||||
Sales | $ | 976 | $ | 858 | $ | 1,850 | $ | 1,730 | |||||||||
Costs and expenses: | |||||||||||||||||
Cost of sales, excluding depreciation, amortization and distribution costs | 639 | 646 | 1,253 | 1,317 | |||||||||||||
Depreciation and amortization | 54 | 50 | 107 | 101 | |||||||||||||
Distribution costs | 123 | 108 | 239 | 218 | |||||||||||||
Selling, general and administrative expenses | 42 | 37 | 85 | 79 | |||||||||||||
Closure costs, impairment and other related charges | 1 | 65 | 1 | 72 | |||||||||||||
Net gain on disposition of assets | (4 | ) | — | (4 | ) | — | |||||||||||
Operating income (loss) | 121 | (48 | ) | 169 | (57 | ) | |||||||||||
Interest expense | (11 | ) | (12 | ) | (24 | ) | (23 | ) | |||||||||
Non-operating pension and other postretirement benefit credits | 12 | 1 | 25 | 4 | |||||||||||||
Other (expense) income, net | (3 | ) | 5 | (10 | ) | 5 | |||||||||||
Income (loss) before income taxes | 119 | (54 | ) | 160 | (71 | ) | |||||||||||
Income tax provision | (47 | ) | (19 | ) | (78 | ) | (48 | ) | |||||||||
Net income (loss) including noncontrolling interests | 72 | (73 | ) | 82 | (119 | ) | |||||||||||
Net income attributable to noncontrolling interests | — | (1 | ) | — | (2 | ) | |||||||||||
Net income (loss) attributable to Resolute Forest Products Inc. | $ | 72 | $ | (74 | ) | $ | 82 | $ | (121 | ) | |||||||
Net income (loss) per share attributable to Resolute Forest Products Inc. common shareholders: | |||||||||||||||||
Basic | $ | 0.79 | $ | (0.82 | ) | $ | 0.90 | $ | (1.34 | ) | |||||||
Diluted | 0.77 | (0.82 | ) | 0.88 | (1.34 | ) | |||||||||||
Weighted-average number of Resolute Forest Products Inc. common shares outstanding: | |||||||||||||||||
Basic | 91.3 | 90.3 | 91.2 | 90.3 | |||||||||||||
Diluted | 93.2 | 90.3 | 93.1 | 90.3 | |||||||||||||
See accompanying notes to unaudited interim Consolidated Financial Statements.
1
RESOLUTE FOREST PRODUCTS INC.
CONSOLIDATED STATEMENTS OF COMPREHENSIVE INCOME (LOSS)
(Unaudited, in millions)
Three Months Ended June 30, | Six Months Ended June 30, | ||||||||||||||||
2018 | 2017 | 2018 | 2017 | ||||||||||||||
Net income (loss) including noncontrolling interests | $ | 72 | $ | (73 | ) | $ | 82 | $ | (119 | ) | |||||||
Other comprehensive income: | |||||||||||||||||
Unamortized prior service credits | |||||||||||||||||
Change in unamortized prior service credits | (4 | ) | (3 | ) | (8 | ) | (7 | ) | |||||||||
Income tax provision | — | — | — | — | |||||||||||||
Change in unamortized prior service credits, net of tax | (4 | ) | (3 | ) | (8 | ) | (7 | ) | |||||||||
Unamortized actuarial losses | |||||||||||||||||
Change in unamortized actuarial losses | 9 | 13 | 18 | 27 | |||||||||||||
Income tax provision | (2 | ) | (3 | ) | (4 | ) | (5 | ) | |||||||||
Change in unamortized actuarial losses, net of tax | 7 | 10 | 14 | 22 | |||||||||||||
Foreign currency translation | — | (1 | ) | — | — | ||||||||||||
Other comprehensive income, net of tax | 3 | 6 | 6 | 15 | |||||||||||||
Comprehensive income (loss) including noncontrolling interests | 75 | (67 | ) | 88 | (104 | ) | |||||||||||
Comprehensive income attributable to noncontrolling interests | — | (1 | ) | — | (2 | ) | |||||||||||
Comprehensive income (loss) attributable to Resolute Forest Products Inc. | $ | 75 | $ | (68 | ) | $ | 88 | $ | (106 | ) | |||||||
See accompanying notes to unaudited interim Consolidated Financial Statements.
2
RESOLUTE FOREST PRODUCTS INC.
CONSOLIDATED BALANCE SHEETS
(Unaudited, in millions, except per share amount)
June 30, 2018 | December 31, 2017 | |||||||
Assets | ||||||||
Current assets: | ||||||||
Cash and cash equivalents | $ | 6 | $ | 6 | ||||
Accounts receivable, net: | ||||||||
Trade | 387 | 399 | ||||||
Other | 129 | 80 | ||||||
Inventories, net | 547 | 526 | ||||||
Other current assets | 39 | 33 | ||||||
Total current assets | 1,108 | 1,044 | ||||||
Fixed assets, less accumulated depreciation of $1,719 and $1,614 as of June 30, 2018 and December 31, 2017, respectively | 1,669 | 1,716 | ||||||
Amortizable intangible assets, less accumulated amortization of $23 and $21 as of June 30, 2018 and December 31, 2017, respectively | 63 | 65 | ||||||
Goodwill | 81 | 81 | ||||||
Deferred income tax assets | 941 | 1,076 | ||||||
Other assets | 163 | 165 | ||||||
Total assets | $ | 4,025 | $ | 4,147 | ||||
Liabilities and equity | ||||||||
Current liabilities: | ||||||||
Accounts payable and accrued liabilities | $ | 438 | $ | 420 | ||||
Current portion of long-term debt | 1 | 1 | ||||||
Total current liabilities | 439 | 421 | ||||||
Long-term debt, net of current portion | 674 | 788 | ||||||
Pension and other postretirement benefit obligations | 1,148 | 1,257 | ||||||
Deferred income tax liabilities | 1 | 13 | ||||||
Other liabilities | 71 | 68 | ||||||
Total liabilities | 2,333 | 2,547 | ||||||
Commitments and contingencies | ||||||||
Equity: | ||||||||
Resolute Forest Products Inc. shareholders’ equity: | ||||||||
Common stock, $0.001 par value. 118.3 shares issued and 90.3 shares outstanding as of June 30, 2018; 118.2 shares issued and 90.2 shares outstanding as of December 31, 2017 | — | — | ||||||
Additional paid-in capital | 3,797 | 3,793 | ||||||
Deficit | (1,212 | ) | (1,294 | ) | ||||
Accumulated other comprehensive loss | (774 | ) | (780 | ) | ||||
Treasury stock at cost, 28.0 shares as of June 30, 2018 and December 31, 2017 | (120 | ) | (120 | ) | ||||
Total Resolute Forest Products Inc. shareholders’ equity | 1,691 | 1,599 | ||||||
Noncontrolling interests | 1 | 1 | ||||||
Total equity | 1,692 | 1,600 | ||||||
Total liabilities and equity | $ | 4,025 | $ | 4,147 | ||||
See accompanying notes to unaudited interim Consolidated Financial Statements.
3
RESOLUTE FOREST PRODUCTS INC.
CONSOLIDATED STATEMENTS OF CHANGES IN EQUITY
(Unaudited, in millions)
Six Months Ended June 30, 2018 | ||||||||||||||||||||||||||||
Resolute Forest Products Inc. Shareholders’ Equity | ||||||||||||||||||||||||||||
Common Stock | Additional Paid-In Capital | Deficit | Accumulated Other Comprehensive Loss | Treasury Stock | Non-controlling Interests | Total Equity | ||||||||||||||||||||||
Balance as of December 31, 2017 | $ | — | $ | 3,793 | $ | (1,294 | ) | $ | (780 | ) | $ | (120 | ) | $ | 1 | $ | 1,600 | |||||||||||
Share-based compensation costs for equity-classified awards | — | 4 | — | — | — | — | 4 | |||||||||||||||||||||
Net income | — | — | 82 | — | — | — | 82 | |||||||||||||||||||||
Stock unit awards vested (0.1 shares), net of shares forfeited for employee withholding taxes | — | — | — | — | — | — | — | |||||||||||||||||||||
Other comprehensive income, net of tax | — | — | — | 6 | — | — | 6 | |||||||||||||||||||||
Balance as of June 30, 2018 | $ | — | $ | 3,797 | $ | (1,212 | ) | $ | (774 | ) | $ | (120 | ) | $ | 1 | $ | 1,692 | |||||||||||
Six Months Ended June 30, 2017 | ||||||||||||||||||||||||||||
Resolute Forest Products Inc. Shareholders’ Equity | ||||||||||||||||||||||||||||
Common Stock | Additional Paid-In Capital | Deficit | Accumulated Other Comprehensive Loss | Treasury Stock | Non- controlling Interests | Total Equity | ||||||||||||||||||||||
Balance as of December 31, 2016 | $ | — | $ | 3,775 | $ | (1,207 | ) | $ | (755 | ) | $ | (120 | ) | $ | 18 | $ | 1,711 | |||||||||||
Share-based compensation costs for equity-classified awards | — | 6 | — | — | — | — | 6 | |||||||||||||||||||||
Net (loss) income | — | — | (121 | ) | — | — | 2 | (119 | ) | |||||||||||||||||||
Cumulative-effect adjustment upon deferred tax charge elimination (Note 9) | — | — | (3 | ) | — | — | — | (3 | ) | |||||||||||||||||||
Other comprehensive income, net of tax | — | — | — | 15 | — | — | 15 | |||||||||||||||||||||
Balance as of June 30, 2017 | $ | — | $ | 3,781 | $ | (1,331 | ) | $ | (740 | ) | $ | (120 | ) | $ | 20 | $ | 1,610 | |||||||||||
See accompanying notes to unaudited interim Consolidated Financial Statements.
4
RESOLUTE FOREST PRODUCTS INC.
CONSOLIDATED STATEMENTS OF CASH FLOWS
(Unaudited, in millions)
Six Months Ended June 30, | ||||||||
2018 | 2017 | |||||||
Cash flows from operating activities: | ||||||||
Net income (loss) including noncontrolling interests | $ | 82 | $ | (119 | ) | |||
Adjustments to reconcile net income (loss) including noncontrolling interests to net cash provided by operating activities: | ||||||||
Share-based compensation | 5 | 7 | ||||||
Depreciation and amortization | 107 | 101 | ||||||
Closure costs, impairment and other related charges | — | 60 | ||||||
(Reversal of) inventory write-downs related to closures | (1 | ) | 13 | |||||
Deferred income taxes | 75 | 46 | ||||||
Net pension contributions and other postretirement benefit payments | (70 | ) | (57 | ) | ||||
Net gain on disposition of assets | (4 | ) | — | |||||
Loss (gain) on translation of foreign currency denominated deferred income taxes | 44 | (38 | ) | |||||
(Gain) loss on translation of foreign currency denominated pension and other postretirement benefit obligations | (36 | ) | 32 | |||||
Net planned major maintenance payments | (3 | ) | (8 | ) | ||||
Changes in working capital: | ||||||||
Accounts receivable | 17 | 35 | ||||||
Inventories | (20 | ) | 10 | |||||
Other current assets | (1 | ) | 2 | |||||
Accounts payable and accrued liabilities | 18 | (27 | ) | |||||
Other, net | 7 | 3 | ||||||
Net cash provided by operating activities | 220 | 60 | ||||||
Cash flows from investing activities: | ||||||||
Cash invested in fixed assets | (53 | ) | (116 | ) | ||||
Disposition of assets | 2 | — | ||||||
Increase in countervailing duty cash deposits on supercalendered paper | (11 | ) | (12 | ) | ||||
Increase in countervailing and anti-dumping duty cash deposits on softwood lumber | (41 | ) | (4 | ) | ||||
Increase in countervailing duty cash deposits on uncoated groundwood paper | (6 | ) | — | |||||
Net cash used in investing activities | (109 | ) | (132 | ) | ||||
Cash flows from financing activities: | ||||||||
Net (repayments) borrowings under revolving credit facilities | (114 | ) | 77 | |||||
Payments of financing and credit facility fees | (1 | ) | — | |||||
Net cash (used in) provided by financing activities | (115 | ) | 77 | |||||
Effect of exchange rate changes on cash and cash equivalents, and restricted cash | (2 | ) | 3 | |||||
Net (decrease) increase in cash and cash equivalents, and restricted cash | (6 | ) | 8 | |||||
Cash and cash equivalents, and restricted cash: | ||||||||
Beginning of period | 49 | 73 | ||||||
End of period | $ | 43 | $ | 81 | ||||
Cash and cash equivalents, and restricted cash at period end: | ||||||||
Cash and cash equivalents | $ | 6 | $ | 44 | ||||
Restricted cash (included in “Other current assets” and “Other assets”) | 37 | 37 | ||||||
See accompanying notes to unaudited interim Consolidated Financial Statements.
5
RESOLUTE FOREST PRODUCTS INC.
Notes to Unaudited Interim Consolidated Financial Statements
Note 1. Organization and Basis of Presentation
Nature of operations
Resolute Forest Products Inc. (with its subsidiaries and affiliates, either individually or collectively, unless otherwise indicated, referred to as “Resolute Forest Products,” “we,” “our,” “us,” “Parent” or the “Company”) is incorporated in Delaware. We are a global leader in the forest products industry with a diverse range of products, including market pulp, tissue, wood products, newsprint and specialty papers, which are marketed in close to 70 countries. We own or operate some 40 manufacturing facilities, as well as power generation assets, in the United States and Canada.
Financial statements
Our interim consolidated financial statements and related notes (or the “Consolidated Financial Statements”) are unaudited and have been prepared in accordance with the requirements of the U.S. Securities and Exchange Commission (or the “SEC”) for interim reporting. Under those rules, certain footnotes and other financial information that are normally required by U.S. generally accepted accounting principles may be condensed or omitted. In our opinion, all adjustments (consisting of normal recurring adjustments) necessary for the fair statement of the unaudited interim Consolidated Financial Statements have been made. All amounts are expressed in U.S. dollars, unless otherwise indicated. The results for the interim period ended June 30, 2018, are not necessarily indicative of the results to be expected for the full year. These unaudited interim Consolidated Financial Statements should be read in conjunction with our Annual Report on Form 10-K for the year ended December 31, 2017, filed with the SEC on March 1, 2018. Certain prior period amounts in our footnotes have been reclassified to conform to the 2018 presentation.
New accounting pronouncements adopted
ASU 2014-09 “Revenue from Contracts from Customers”
Effective January 1, 2018, we adopted Accounting Standards Update (or “ASU”) 2014-09, “Revenue from Contracts from Customers,” issued by the Financial Accounting Standards Board (or the “FASB”), and the series of related accounting standard updates that followed (collectively, “Topic 606”). We utilized the modified retrospective method, which required the application of Topic 606 to: (i) all new revenue contracts entered into after January 1, 2018; and (ii) all existing revenue contracts as of January 1, 2018. The adoption of Topic 606 had no impact on our revenues, results of operations, or financial position. As a result of the implementation of Topic 606, our revenue recognition policy was updated as follows:
Revenue arises from contracts with customers in which the sale of goods is the main performance obligation. A contract’s transaction price is allocated to each distinct performance obligation and recognized as revenue when or as the performance obligation is satisfied, which is when (point in time) or as (over time) control of the promised good or service is transferred to the customer.
Revenue is measured at the amount to which we are expected to be entitled in exchange for transferring goods based on consideration specified in the contract with the customer. Taxes assessed by a governmental authority that are both imposed on and concurrent with a specific revenue-producing transaction, that we collect from the customer, are excluded from revenue. When a contract with a customer includes variable consideration such as special pricing agreements and other volume-based incentives, revenue is recognized at the most likely amount based on sales forecasts, for which it is probable that a revenue reversal will not subsequently occur.
Revenue is recorded at a point in time when control over the goods transfers to the customer, which typically occurs upon shipment or delivery depending on the terms of the underlying contracts with customers. Pulp, tissue, paper and wood products are delivered to our customers in the United States and Canada directly from our mills primarily by truck or rail. Pulp and paper products are delivered to our international customers primarily by ship. For sales where control transfers to the customer at the shipping point, revenue is recorded when the product leaves the facility, whereas for sales where control transfers at the destination, revenue is recorded when the product is delivered to the customer’s delivery site. Shipping and handling costs associated with outbound freight after control over a product has transferred to a customer are accounted for as a fulfillment cost and are included in “Distribution costs” in our Consolidated Statements of Operations.
Sales of our other products (green power produced from renewable sources, wood chips, and other wood-related products) are recognized when the products are delivered and are included in “Cost of sales, excluding depreciation, amortization and distribution costs” in our Consolidated Statements of Operations.
6
RESOLUTE FOREST PRODUCTS INC.
Notes to Unaudited Interim Consolidated Financial Statements
ASU 2016-01 “Recognition and Measurement of Financial Assets and Financial Liabilities”
In January 2016, the FASB issued ASU 2016-01, “Recognition and Measurement of Financial Assets and Financial Liabilities,” which amends certain aspects of the recognition, measurement, presentation and disclosure of financial instruments. This update is effective for fiscal years beginning after December 15, 2017, including interim periods within those fiscal years. We adopted this ASU on January 1, 2018. The adoption of this accounting guidance did not impact our results of operations, financial position or cash flows.
ASU 2016-15 “Classification of Certain Cash Receipts and Cash Payments”
In August 2016, the FASB issued ASU 2016-15, “Classification of Certain Cash Receipts and Cash Payments,” which is intended to reduce diversity in practice in how certain transactions are classified in the statement of cash flows. This update is effective for fiscal years beginning after December 15, 2017, and interim periods within those fiscal years. All amendments to the guidance shall be adopted in the same period on a retrospective basis. We adopted this ASU on January 1, 2018. The adoption of this accounting guidance did not impact the presentation of our cash flows.
ASU 2016-18 “Restricted Cash”
In November 2016, the FASB issued ASU 2016-18, “Restricted Cash,” which requires companies to include amounts generally described as restricted cash and restricted cash equivalents in cash and cash equivalents when reconciling beginning-of-period and end-of-period total amounts shown on the statement of cash flows. This update is effective for fiscal years beginning after December 15, 2017, and interim periods within those fiscal years. We adopted this ASU on January 1, 2018. Prior period amounts have been reclassified to conform to the 2018 presentation.
ASU 2017-05 “Clarifying the Scope of Asset Derecognition Guidance and Accounting for Partial Sales of Nonfinancial Assets”
In February 2017, the FASB issued ASU 2017-05, “Clarifying the Scope of Asset Derecognition Guidance and Accounting for Partial Sales of Nonfinancial Assets,” which clarifies the scope of Subtopic 610-20, “Other Income – Gains and Losses from the Derecognition of Nonfinancial Assets” and adds guidance for partial sales of nonfinancial assets. This update is effective for fiscal years beginning after December 15, 2017, and interim periods within those fiscal years. We adopted this ASU on January 1, 2018. The adoption of this accounting guidance did not impact our results of operations, financial position or cash flows.
ASU 2017-07 “Improving the Presentation of Net Periodic Pension Cost and Net Periodic Postretirement Benefit Cost”
In March 2017, the FASB issued ASU 2017-07, “Improving the Presentation of Net Periodic Pension Cost and Net Periodic Postretirement Benefit Cost,” which requires employers that present a measure of operating income in their statements of earnings to disaggregate and present only the service cost component of net periodic pension cost and net periodic other postretirement benefit (or “OPEB”) cost in operating expenses (together with other employee compensation costs arising during the period). The other components of the net periodic pension cost and net periodic OPEB cost (or “Non-operating pension and OPEB costs”) are reported separately outside any subtotal of operating income. This update is effective retrospectively for fiscal years beginning after December 15, 2017, including interim periods within those fiscal years. We adopted this ASU on January 1, 2018.
7
RESOLUTE FOREST PRODUCTS INC.
Notes to Unaudited Interim Consolidated Financial Statements
The effect of this ASU on our Consolidated Statements of Operations for the three months ended June 30, 2018 and 2017, was as follows:
Three Months Ended June 30, 2018 | Three Months Ended June 30, 2017 | |||||||||||||||||||||||
(Unaudited, in millions) | Before Accounting Standards Update | Effect of Change | As Reported | As Previously Reported | Effect of Change | As Adjusted | ||||||||||||||||||
Cost of sales, excluding depreciation, amortization and distribution costs | $ | 627 | $ | 12 | $ | 639 | $ | 645 | $ | 1 | $ | 646 | ||||||||||||
Operating income (loss) | 133 | (12 | ) | 121 | (47 | ) | (1 | ) | (48 | ) | ||||||||||||||
Non-operating pension and other postretirement benefit credits | — | 12 | 12 | — | 1 | 1 | ||||||||||||||||||
The effect of this ASU on our Consolidated Statements of Operations for the six months ended June 30, 2018 and 2017, was as follows:
Six Months Ended June 30, 2018 | Six Months Ended June 30, 2017 | |||||||||||||||||||||||
(Unaudited, in millions) | Before Accounting Standards Update | Effect of Change | As Reported | As Previously Reported | Effect of Change | As Adjusted | ||||||||||||||||||
Cost of sales, excluding depreciation, amortization and distribution costs | $ | 1,227 | $ | 26 | $ | 1,253 | $ | 1,312 | $ | 5 | $ | 1,317 | ||||||||||||
Selling, general and administrative expenses | 86 | (1 | ) | 85 | 80 | (1 | ) | 79 | ||||||||||||||||
Operating income (loss) | 194 | (25 | ) | 169 | (53 | ) | (4 | ) | (57 | ) | ||||||||||||||
Non-operating pension and other postretirement benefit credits | — | 25 | 25 | — | 4 | 4 | ||||||||||||||||||
Accounting pronouncements not yet adopted
In February 2016, the FASB issued ASU 2016-02, “Leases,” which requires lessees to recognize leases on the balance sheet while continuing to recognize expenses in the income statement in a manner similar to current accounting standards. For lessors, the new standard modifies the classification criteria and the accounting for sales-type and direct financing leases. Enhanced disclosures will also be required to give financial statement users the ability to assess the amount, timing, and uncertainty of cash flows arising from leases.
We are currently in the process of evaluating our existing lease portfolio, which consists primarily of operating leases where we are the lessee. Upon adoption, we expect to recognize a liability and corresponding asset associated with in-scope leases. We are continuing our assessment and review of existing leases, which may identify other impacts, and are addressing necessary policy and process changes in preparation for adoption.
This ASU may either be adopted on a modified retrospective approach at the beginning of the earliest comparative period, or through a cumulative-effect adjustment at the adoption date. This update is effective for fiscal years beginning after December 15, 2018, including interim periods within those fiscal years, with early adoption permitted. We plan to adopt this standard on January 1, 2019, through a cumulative-effect adjustment at the adoption date.
8
RESOLUTE FOREST PRODUCTS INC.
Notes to Unaudited Interim Consolidated Financial Statements
Note 2. Closure Costs, Impairment and Other Related Charges
Closure costs, impairment and other related charges were $1 million for both the three and six months ended June 30, 2018.
Closure costs, impairment and other related charges for the three and six months ended June 30, 2017, were comprised of the following:
(Unaudited, in millions) | Impairment of Assets | Severance and Other Costs | Total | |||||||||
Pulp mill in Coosa Pines (Alabama) (1) | ||||||||||||
Second quarter | $ | 55 | $ | — | $ | 55 | ||||||
First six months | 55 | — | 55 | |||||||||
Permanent closures | ||||||||||||
Paper machine in Catawba (South Carolina) | ||||||||||||
Second quarter | 5 | 4 | 9 | |||||||||
First six months | 5 | 4 | 9 | |||||||||
Paper mill in Mokpo (South Korea) | ||||||||||||
Second quarter | — | — | — | |||||||||
First six months | — | 7 | 7 | |||||||||
Other | ||||||||||||
Second quarter | — | 1 | 1 | |||||||||
First six months | — | 1 | 1 | |||||||||
Total | ||||||||||||
Second quarter | $ | 60 | $ | 5 | $ | 65 | ||||||
First six months | 60 | 12 | 72 | |||||||||
(1)As a result of the continued deterioration of actual and projected cash flows, we recorded long-lived asset impairment charges of $55 million for the three and six months ended June 30, 2017, to reduce the carrying value of the assets to their estimated fair value, which was determined using the market approach, by reference to market transaction prices for similar assets. The fair value measurement is considered a Level 3 measurement due to the significance of its unobservable inputs.
Note 3. Accumulated Other Comprehensive Loss
The change in our accumulated other comprehensive loss by component (net of tax) for the six months ended June 30, 2018, was as follows:
(Unaudited, in millions) | Unamortized Prior Service Credits | Unamortized Actuarial Losses | Foreign Currency Translation | Total | ||||||||||||
Balance as of December 31, 2017 | $ | 52 | $ | (826 | ) | $ | (6 | ) | $ | (780 | ) | |||||
Amounts reclassified from accumulated other comprehensive loss (1) | (8 | ) | 14 | — | 6 | |||||||||||
Balance as of June 30, 2018 | $ | 44 | $ | (812 | ) | $ | (6 | ) | $ | (774 | ) | |||||
(1) | See the table below for details about these reclassifications. |
9
RESOLUTE FOREST PRODUCTS INC.
Notes to Unaudited Interim Consolidated Financial Statements
The reclassifications out of accumulated other comprehensive loss for the six months ended June 30, 2018, were comprised of the following:
(Unaudited, in millions) | Amounts Reclassified From Accumulated Other Comprehensive Loss | Affected Line in the Consolidated Statements of Operations | |||
Unamortized Prior Service Credits | |||||
Amortization of prior service credits | $ | (8 | ) | Non-operating pension and other postretirement benefit credits (1) | |
— | Income tax provision | ||||
$ | (8 | ) | Net of tax | ||
Unamortized Actuarial Losses | |||||
Amortization of actuarial losses | $ | 17 | Non-operating pension and other postretirement benefit credits (1) | ||
Settlement loss | 1 | Non-operating pension and other postretirement benefit credits (1) | |||
(4 | ) | Income tax provision | |||
$ | 14 | Net of tax | |||
Total Reclassifications | $ | 6 | Net of tax | ||
(1) | These items are included in the computation of net periodic benefit cost related to our pension and OPEB plans summarized in Note 8, “Employee Benefit Plans.” |
Note 4. Net Income (Loss) Per Share
The reconciliation of the basic and diluted net income (loss) per share for the three and six months ended June 30, 2018 and 2017, was as follows:
Three Months Ended June 30, | Six Months Ended June 30, | ||||||||||||||||
(Unaudited, in millions, except per share amounts) | 2018 | 2017 | 2018 | 2017 | |||||||||||||
Numerator: | |||||||||||||||||
Net income (loss) attributable to Resolute Forest Products Inc. | $ | 72 | $ | (74 | ) | $ | 82 | $ | (121 | ) | |||||||
Denominator: | |||||||||||||||||
Basic weighted-average number of Resolute Forest Products Inc. common shares outstanding | 91.3 | 90.3 | 91.2 | 90.3 | |||||||||||||
Dilutive impact of nonvested stock unit awards | 1.9 | — | 1.9 | — | |||||||||||||
Diluted weighted-average number of Resolute Forest Products Inc. common shares outstanding | 93.2 | 90.3 | 93.1 | 90.3 | |||||||||||||
Net income (loss) per share attributable to Resolute Forest Products Inc. common shareholders: | |||||||||||||||||
Basic | $ | 0.79 | $ | (0.82 | ) | $ | 0.90 | $ | (1.34 | ) | |||||||
Diluted | 0.77 | (0.82 | ) | 0.88 | (1.34 | ) | |||||||||||
10
RESOLUTE FOREST PRODUCTS INC.
Notes to Unaudited Interim Consolidated Financial Statements
The weighted-average number of outstanding stock options and nonvested equity-classified restricted stock units, deferred stock units and performance stock units (collectively, “stock unit awards”) that were excluded from the calculation of diluted net income (loss) per share, as their impact would have been antidilutive, for the three and six months ended June 30, 2018 and 2017, was as follows:
Three Months Ended June 30, | Six Months Ended June 30, | ||||||||||||
(Unaudited, in millions) | 2018 | 2017 | 2018 | 2017 | |||||||||
Stock options | 1.3 | 1.4 | 1.3 | 1.4 | |||||||||
Stock unit awards | — | 4.7 | — | 4.6 | |||||||||
Note 5. Inventories, Net
Inventories, net as of June 30, 2018 and December 31, 2017, were comprised of the following:
(Unaudited, in millions) | June 30, 2018 | December 31, 2017 | ||||||
Raw materials | $ | 100 | $ | 108 | ||||
Work in process | 44 | 38 | ||||||
Finished goods | 188 | 175 | ||||||
Mill stores and other supplies | 215 | 205 | ||||||
$ | 547 | $ | 526 | |||||
During the three months ended June 30, 2017, we recorded charges for write-downs of mill stores and other supplies of $9 million primarily related to the permanent closure of a paper machine at our Catawba paper mill and the permanent closure of our Mokpo paper mill. During the six months ended June 30, 2017, we also recorded charges of $4 million for write-downs of mill stores and other supplies primarily as a result of the permanent closure of our Mokpo paper mill. These charges were included in “Cost of sales, excluding depreciation, amortization and distribution costs” in our Consolidated Statements of Operations.
Note 6. Accounts Payable and Accrued Liabilities
Accounts payable and accrued liabilities as of June 30, 2018 and December 31, 2017, were comprised of the following:
(Unaudited, in millions) | June 30, 2018 | December 31, 2017 | ||||||
Trade accounts payable | $ | 330 | $ | 306 | ||||
Payroll, bonuses and severance payable | 50 | 55 | ||||||
Accrued interest | 5 | 5 | ||||||
Pension and other postretirement benefit obligations | 18 | 18 | ||||||
Income and other taxes payable | 8 | 10 | ||||||
Environmental liabilities | 2 | 2 | ||||||
Other | 25 | 24 | ||||||
$ | 438 | $ | 420 | |||||
11
RESOLUTE FOREST PRODUCTS INC.
Notes to Unaudited Interim Consolidated Financial Statements
Note 7. Long-Term Debt
Overview
Long-term debt, including current portion, as of June 30, 2018 and December 31, 2017, was comprised of the following:
(Unaudited, in millions) | June 30, 2018 | December 31, 2017 | ||||||
5.875% senior unsecured notes due 2023: | ||||||||
Principal amount | $ | 600 | $ | 600 | ||||
Deferred financing costs | (5 | ) | (5 | ) | ||||
Unamortized discount | (3 | ) | (3 | ) | ||||
Total senior notes due 2023 | 592 | 592 | ||||||
Term loan due 2025 | 46 | 46 | ||||||
Borrowings under revolving credit facilities | 30 | 144 | ||||||
Capital lease obligation | 7 | 7 | ||||||
Total debt | 675 | 789 | ||||||
Less: Current portion of long-term debt | (1 | ) | (1 | ) | ||||
Long-term debt, net of current portion | $ | 674 | $ | 788 | ||||
2023 Notes
We issued $600 million in aggregate principal amount of 5.875% senior unsecured notes due 2023 (or the “2023 Notes”) on May 8, 2013. Upon their issuance, the notes were recorded at their fair value of $594 million, which reflected a discount of $6 million that is being amortized to “Interest expense” in our Consolidated Statements of Operations using the interest method over the term of the notes, resulting in an effective interest rate of 6%. Interest on the notes is payable semi-annually on May 15 and November 15, until their maturity date of May 15, 2023. In connection with the issuance of the notes, we incurred financing costs of approximately $9 million, which were deferred and recorded as a reduction of the notes. These deferred financing costs are being amortized to “Interest expense” in our Consolidated Statements of Operations using the interest method over the term of the notes. The fair value of the 2023 Notes (Level 1) was $613 million and $622 million as of June 30, 2018 and December 31, 2017, respectively.
Senior Secured Credit Facility
On September 7, 2016, we entered into a senior secured credit facility (or the “Senior Secured Credit Facility”) for up to $185 million. The Senior Secured Credit Facility provides a term loan of $46 million with a maturity date of September 7, 2025 (the “Term Loan”), and a revolving credit facility of up to $139 million with a maturity date of September 7, 2022 (the “Revolving Credit Facility”). As of June 30, 2018, we had $127 million of availability under the Revolving Credit Facility, net of $12 million of borrowings. The fair values of the Term Loan and Revolving Credit Facility (Level 2) approximated their carrying values as of both June 30, 2018 and December 31, 2017.
ABL Credit Facility
On May 22, 2015, we entered into a senior secured asset-based revolving credit facility (the “ABL Credit Facility”), with an aggregate lender commitment of up to $600 million at any time outstanding, subject to borrowing base availability based on specified advance rates, eligibility criteria and customary reserves. The ABL Credit Facility will mature on May 22, 2020. As of June 30, 2018, we had $384 million of availability under the ABL Credit Facility, net of $18 million of borrowings and $43 million of ordinary course letters of credit outstanding. The fair value of the ABL Credit Facility (Level 2) approximated its carrying value as of both June 30, 2018 and December 31, 2017.
Capital lease obligation
We have a capital lease obligation for a warehouse with a maturity date of December 1, 2027, which can be renewed for 20 years at our option. Minimum monthly payments are determined by an escalatory price clause.
12
RESOLUTE FOREST PRODUCTS INC.
Notes to Unaudited Interim Consolidated Financial Statements
Note 8. Employee Benefit Plans
Pension and other postretirement benefit plans
The components of net periodic benefit cost relating to our pension and OPEB plans for the three and six months ended June 30, 2018 and 2017, were as follows:
Pension Plans:
Three Months Ended June 30, | Six Months Ended June 30, | ||||||||||||||||
(Unaudited, in millions) | 2018 | 2017 | 2018 | 2017 | |||||||||||||
Interest cost | $ | 48 | $ | 49 | $ | 96 | $ | 98 | |||||||||
Expected return on plan assets | (67 | ) | (61 | ) | (134 | ) | (124 | ) | |||||||||
Amortization of actuarial losses | 10 | 14 | 20 | 28 | |||||||||||||
Amortization of prior service credits | — | — | (1 | ) | — | ||||||||||||
Non-operating pension (credits) costs | (9 | ) | 2 | (19 | ) | 2 | |||||||||||
Service cost | 4 | 4 | 9 | 9 | |||||||||||||
Net periodic benefit (credits) costs before special events | (5 | ) | 6 | (10 | ) | 11 | |||||||||||
Settlement loss | 1 | 1 | 1 | 1 | |||||||||||||
$ | (4 | ) | $ | 7 | $ | (9 | ) | $ | 12 | ||||||||
OPEB Plans:
Three Months Ended June 30, | Six Months Ended June 30, | ||||||||||||||||
(Unaudited, in millions) | 2018 | 2017 | 2018 | 2017 | |||||||||||||
Interest cost | $ | 2 | $ | 1 | $ | 3 | $ | 3 | |||||||||
Amortization of actuarial gains | (2 | ) | (2 | ) | (3 | ) | (3 | ) | |||||||||
Amortization of prior service credits | (4 | ) | (3 | ) | (7 | ) | (7 | ) | |||||||||
Non-operating other postretirement benefit credits | (4 | ) | (4 | ) | (7 | ) | (7 | ) | |||||||||
Service cost | 1 | 1 | 1 | 1 | |||||||||||||
$ | (3 | ) | $ | (3 | ) | $ | (6 | ) | $ | (6 | ) | ||||||
Defined contribution plans
Our expense for the defined contribution plans totaled $5 million and $6 million for the three months ended June 30, 2018 and 2017, respectively, and $10 million and $11 million for the six months ended June 30, 2018 and 2017, respectively.
13
RESOLUTE FOREST PRODUCTS INC.
Notes to Unaudited Interim Consolidated Financial Statements
Note 9. Income Taxes
Tax Cuts and Jobs Act
On December 22, 2017, the Tax Cuts and Jobs Act (or the “TCJA”) was enacted into law which, among other changes, reduced the U.S. federal statutory income tax rate from 35% to 21%, and introduced the global intangible low-taxed income (or “GILTI”) regime, the base erosion anti-abuse tax, and the foreign-derived intangible income deduction.
During the three and six months ended June 30, 2018, the enactment of the TCJA resulted in an income tax provision attributable to the GILTI inclusion of $18 million and $25 million, respectively, before valuation allowance, with no other impact on our results of operations. After having evaluated the impact of the TCJA on the reinvestment of foreign earnings, we have maintained the position that such earnings continue to be permanently reinvested. Accordingly, no provision was recorded for undistributed foreign earnings.
The impacts of the TCJA on our 2017 financial results remain provisional and unchanged as of June 30, 2018. We have yet to adopt an accounting policy for the treatment of GILTI, and accordingly, no deferred tax amounts have been recorded.
The final impact of the TCJA may differ due to, among other things, changes in interpretations, the issuance of additional legislative guidance and clarification, and actions we may take as a result of the TCJA. We will recognize any adjustments to our provisional estimates in the reporting period they are determined, up to a period not to exceed one year from the date of enactment.
Effective income tax rate reconciliation
The income tax provision attributable to income (loss) before income taxes differs from the amounts computed by applying the U.S. federal statutory income tax rate of 21% for the three and six months ended June 30, 2018 and 2017, as a result of the following:
Three Months Ended June 30, | Six Months Ended June 30, | ||||||||||||||||
(Unaudited, in millions) | 2018 | 2017 | 2018 | 2017 | |||||||||||||
Income (loss) before income taxes | $ | 119 | $ | (54 | ) | $ | 160 | $ | (71 | ) | |||||||
Income tax provision: | |||||||||||||||||
Expected income tax (provision) benefit | (25 | ) | 11 | (34 | ) | 15 | |||||||||||
Changes resulting from: | |||||||||||||||||
U.S. federal tax rate change reconciliation | — | 8 | — | 10 | |||||||||||||
Valuation allowance (1) | 13 | (49 | ) | 8 | (75 | ) | |||||||||||
Enactment of change in foreign tax rate | — | — | — | (12 | ) | ||||||||||||
Foreign exchange | (7 | ) | 2 | (14 | ) | 1 | |||||||||||
State income taxes, net of federal income tax benefit | — | 4 | 2 | 6 | |||||||||||||
Foreign tax rate differences (2) | (25 | ) | 5 | (37 | ) | 8 | |||||||||||
Other, net | (3 | ) | — | (3 | ) | (1 | ) | ||||||||||
$ | (47 | ) | $ | (19 | ) | $ | (78 | ) | $ | (48 | ) | ||||||
(1) | Relates to our U.S. operations for the three and six months ended June 30, 2018, and primarily to our U.S. operations for the three and six months ended June 30, 2017. |
(2) | Includes an income tax provision attributable to the GILTI inclusion of $18 million and $25 million, before valuation allowance, for the three months and six months ended June 30, 2018, respectively. |
Deferred tax charge
On January 1, 2017, we adopted ASU 2016-16, “Intra-Entity Transfers of Assets Other Than Inventory,” which eliminates the deferral of the tax effects of intra-entity asset transfers other than inventory until the transferred assets are sold to a third party or recovered through use. As a result, a cumulative-effect adjustment of $3 million was recorded to “Deficit” in our Consolidated Balance Sheet as of January 1, 2017.
14
RESOLUTE FOREST PRODUCTS INC.
Notes to Unaudited Interim Consolidated Financial Statements
Note 10. Commitments and Contingencies
Legal matters
We become involved in various legal proceedings and other disputes in the normal course of business, including matters related to contracts, commercial and trade disputes, taxes, environmental issues, activist damages, employment and workers’ compensation claims, grievances, human rights complaints, pension and benefit plans and obligations, health and safety, financial reporting and disclosure obligations, corporate governance, antitrust, First Nations claims, and other matters. Although the final outcome is subject to many variables and cannot be predicted with any degree of certainty, we regularly assess the status of the matters and establish provisions (including legal costs expected to be incurred) when we believe an adverse outcome is probable, and the amount can be reasonably estimated. Except as described below and for claims that cannot be assessed due to their preliminary nature, we believe that the ultimate disposition of these matters outstanding or pending as of June 30, 2018, will not have a material adverse effect on our Consolidated Financial Statements.
Countervailing duty and anti-dumping investigations on uncoated groundwood paper
On August 9, 2017, countervailing duty and anti-dumping petitions were filed with the U.S. Department of Commerce (or “Commerce”) and the U.S. International Trade Commission (or “ITC”) by a U.S. uncoated groundwood (or “UGW”) paper producer requesting that the U.S. government impose countervailing and anti-dumping duties on Canadian-origin UGW paper exported to the U.S. One of our subsidiaries was identified in the petition as being a Canadian exporting producer of UGW paper to the U.S. and was selected as a mandatory respondent to be investigated by Commerce in both the countervailing duty and anti-dumping investigations.
On January 9, 2018, Commerce announced its preliminary determination in its countervailing duty investigation on Canadian-origin UGW paper exported to the U.S. As a result, beginning January 16, 2018, we were required to pay cash deposits to the U.S. Customs and Border Protection agency (or “U.S. Customs”) at a rate of 4.42% of the custom’s value for estimated countervailing duties on our U.S. imports of the UGW paper produced at our Canadian mills, with the exception of supercalendered (or “SC”) paper, which was subject to distinct countervailing duties, as further discussed below. On August 2, 2018, Commerce changed the rate to 9.81% in its final affirmative determination. The preliminary rate of 4.42% remained in effect until May 15, 2018, and we are not required to pay deposits for countervailing duties on the affected UGW paper imports until the ITC makes an affirmative material injury determination. If such a determination were made, Commerce would issue its countervailing duty order and we would then be required to resume making cash deposits at the rate of 9.81%, until Commerce sets a countervailing duty rate in a subsequent administrative review or the rate were overturned through an appeal to a North American Free Trade Agreement (or “NAFTA”) Chapter 19 binational panel or the United States Court of International Trade. Through June 30, 2018, our cash deposits on our imports of the affected UGW paper to the U.S. totaled $6 million, and, based on the 9.81% rate and our current operating parameters, could be as high as $40 million per year. We are not presently able to determine the ultimate resolution of this matter, but we believe it is not probable that we will ultimately be assessed with significant countervailing duties, if any, on our Canadian-produced UGW that is exported to the U.S. Accordingly, no contingent loss was recorded in respect of this petition in our Consolidated Statement of Operations for the six months ended June 30, 2018, and our cash deposits were recorded in “Other assets” in our Consolidated Balance Sheets.
On March 13, 2018, Commerce announced its preliminary determination in the anti-dumping investigation, whereby it determined that we did not sell Canadian-origin UGW paper exported to the U.S. for less than fair market value during the relevant period (from July 1, 2016 to June 30, 2017). Commerce confirmed this determination on August 2, 2018, in its final affirmative determination. As a result, we are not required to pay cash deposits to the U.S. Customs for anti-dumping duties and will not be subject to administrative review, regardless of the ITC’s outcome and whether Commerce issues an anti-dumping duty order.
Countervailing duty and anti-dumping investigations on softwood lumber
On November 25, 2016, countervailing duty and anti-dumping petitions were filed with Commerce and the ITC by certain U.S. softwood lumber producers and forest landowners, requesting that the U.S. government impose countervailing and anti-dumping duties on Canadian-origin softwood lumber exported to the U.S. One of our subsidiaries was identified in the petition as being a Canadian exporting producer of softwood lumber to the U.S. and was selected as a mandatory respondent to be investigated by Commerce in both the countervailing duty and anti-dumping investigations.
On April 24, 2017, Commerce announced its preliminary determination in the countervailing duty investigation and, as a result, after April 28, 2017, we were required to pay cash deposits to the U.S. Customs at a rate of 12.82% for estimated countervailing
15
RESOLUTE FOREST PRODUCTS INC.
Notes to Unaudited Interim Consolidated Financial Statements
duties on our U.S. imports of softwood lumber produced at our Canadian sawmills. The preliminary rate remained in effect until August 26, 2017. Commerce changed the rate in its final affirmative determination on November 2, 2017, but the new rate did not take effect until December 28, 2017, following the ITC’s final affirmative determination and the publication by Commerce of a countervailing duty order. Since that date, we have been required to resume paying cash deposits to the U.S. Customs at a rate of 14.7% for our softwood lumber U.S. imports from our Canadian sawmills. This rate will continue until Commerce sets a duty rate in an administrative review, or a new rate may be set through a remand determination should a NAFTA binational panel on appeal remand the final determination to Commerce. Through June 30, 2018, our cash deposits totaled $50 million and, based on the 14.7% rate and our current operating parameters, could be as high as $65 million per year.
On June 26, 2017, Commerce announced its preliminary determination in the anti-dumping investigation and, as a result, after June 30, 2017, we were required to pay cash deposits to the U.S. Customs at a rate of 4.59% for estimated anti-dumping duties on our U.S. imports of softwood lumber produced at our Canadian sawmills. On November 2, 2017, Commerce announced its final affirmative determination in the anti-dumping investigation and, as a result, since November 8, 2017, we have been required to pay cash deposits to the U.S. Customs, at a rate of 3.2% for our softwood lumber U.S. imports from our Canadian sawmills. This rate that will apply until Commerce sets a duty rate in an administrative review, or in a possible remand determination. Through June 30, 2018, our cash deposits totaled $17 million and, based on the 3.2% rate and our current operating parameters, could be as high as $15 million per year.
We are not presently able to determine the ultimate resolution of these matters, but we believe it is not probable that we will ultimately be assessed with significant duties, if any, on our U.S. imports of Canadian-produced softwood lumber. Accordingly, no contingent loss was recorded in respect of these petitions in our Consolidated Statement of Operations for the six months ended June 30, 2018, and our cash deposits were recorded in “Other assets” in our Consolidated Balance Sheets.
Countervailing duty investigation on SC paper
On February 26, 2015, a countervailing duty petition was filed with Commerce and the ITC by certain U.S. SC paper producers requesting that the U.S. government impose countervailing duties on Canadian-origin SC paper exported to the U.S. market. One of our subsidiaries was identified in the petition as being a Canadian exporting producer of SC paper to the U.S. and was selected as a mandatory respondent to be investigated by Commerce. As a result of that investigation, after August 3, 2015, we were required to pay cash deposits to the U.S. Customs for estimated countervailing duties on our U.S. imports of SC paper produced at our Canadian mills. Between August 3, 2015 and October 15, 2015, we were required to make cash deposits at a rate of 2.04%. On October 15, 2015, that rate increased to 17.87%, 17.10% of which was not based on any countervailable subsidy we received, but rather on a punitive application of “adverse facts available.”
On March 21, 2018, Verso Corporation, the sole remaining U.S. SC paper petitioner, filed a request with Commerce for a changed circumstances review to revoke the countervailing duty order, retroactive to August 3, 2015, and for Commerce to refund all countervailing duty deposits with interest. On May 8, 2018, Commerce announced the initiation of a changed circumstances review, and on July 6, 2018, Commerce signed the revocation order. As a result, we will receive a refund of all outstanding cash deposits made on our U.S. imports of SC paper produced at our Canadian mills, plus interest, and no further cash deposits will be required going forward. In addition, this resulted in the termination of all pending administrative reviews.
Through June 30, 2018, our cumulative cash deposits, to be refunded, totaled $60 million. These cash deposits were recorded in “Accounts receivable, net – Other” in our Consolidated Balance Sheets.
Jedson Case
On March 9, 2017, Jedson Engineering, Inc. and Jedson C.M., Inc. (or the “Jedson plaintiffs”) filed a complaint against our subsidiary, Resolute FP US Inc., and other defendants in state court in Tennessee. The complaint alleged breach of contract and violation of Tennessee’s Prompt Pay Act for failure to pay for services in connection with the design and construction of our Calhoun (Tennessee) tissue project, and sought a recovery of, and enforcement of mechanic’s liens for, approximately $10 million, plus interest and cost of litigation. On April 17, 2017, we filed an answer and counterclaim alleging, among other things, breach of contract and professional negligence by the Jedson plaintiffs and seeking recovery for, among other things, resulting costs on the project. On April 4, 2017, the Jedson plaintiffs also filed a motion for an injunction under the Prompt Pay Act seeking immediate payment of monies claimed and, on April 20, 2017, a motion to abate Resolute FP US Inc.’s counterclaim, both of which we opposed and have not been heard by the court. On August 25, 2017, the Jedson plaintiffs amended their complaint. As amended, the complaint includes allegations of fraud, intentional and negligent misrepresentation, unjust enrichment, and a claim for punitive damages in an amount of up to approximately $20 million. Effective February 20, 2018, the parties entered into an agreement to submit their disputes to binding private arbitration. On February 23, 2018, the
16
RESOLUTE FOREST PRODUCTS INC.
Notes to Unaudited Interim Consolidated Financial Statements
state court issued an order staying the consolidated court proceedings pending completion of the arbitration subject to limited exceptions regarding certain defined procedural matters. The Company disputes the plaintiffs’ allegations, and intends to vigorously defend the action. The arbitration hearing is expected to occur in the first half of 2019. We are not presently able to determine the ultimate resolution of this matter or to reasonably estimate the potential impact on our Consolidated Financial Statements.
Modification of U.S. OPEB plan
Effective January 1, 2015, we modified our U.S. OPEB plan so that unionized participants, upon reaching Medicare eligibility, are provided Medicare coverage via a Medicare Exchange program rather than via a Company-sponsored medical plan. On March 2, 2016, a proposed class action lawsuit (Reynolds, et al v. Resolute Forest Products Inc., Resolute FP US Inc., Resolute FP US Health and Resolute Welfare Benefit Plan) was filed in the United States District Court for the Eastern District of Tennessee (or the “District Court”) on behalf of certain Medicare-eligible retirees who were previously unionized employees of our Calhoun, Catawba, and Coosa Pines mills, and their spouses and dependents (or the “proposed class”). The plaintiffs allege that the modifications described above breach the collective bargaining agreements and plan covering the members of the proposed class in the lawsuit. Plaintiffs seek reinstatement of the health care benefits as in effect before January 1, 2015, for the proposed class in the lawsuit. On May 23, 2016, the Company filed a motion to dismiss the complaint. The motion to dismiss was denied by the District Court on March 1, 2017. On June 28, 2017, a settlement agreement in principle was reached between the parties to the lawsuit subject to court approval. On June 5, 2018, the District Court issued an order providing for preliminary approval of the settlement. On August 3, 2018, a final order approving the class action settlement and dismissing the case was entered, which if no appeals are filed within the applicable 30-day appeal period, would result in an amendment of our U.S. OPEB plan and a corresponding increase to both “Pension and other postretirement benefit obligations” and “Accumulated other comprehensive loss” in our Consolidated Balance Sheet, as of the date the plan amendment is adopted. We do not expect that the resulting increase would have a material impact on our Consolidated Financial Statements.
Fibrek acquisition
Effective July 31, 2012, we completed the final step of the transaction pursuant to which we acquired the remaining 25.4% of the outstanding Fibrek Inc. (or “Fibrek”) shares, following the approval of Fibrek’s shareholders on July 23, 2012, and the issuance of a final order of the Quebec Superior Court in Canada approving the arrangement on July 27, 2012. Certain former shareholders of Fibrek exercised (or purported to exercise) rights of dissent in respect of the transaction, asking for a judicial determination of the fair value of their claim under the Canada Business Corporations Act. No consideration has to date been paid to the former Fibrek shareholders who exercised (or purported to exercise) rights of dissent. Any such consideration will only be paid out upon settlement or judicial determination of the fair value of their claims and will be paid entirely in cash. Accordingly, we cannot presently determine the amount that ultimately will be paid to former holders of Fibrek shares in connection with the proceedings, but we have accrued approximately Cdn $14 million ($11 million, based on the exchange rate in effect on June 30, 2018) for the eventual payment of those claims. The hearing in this matter is expected to occur in 2019.
Partial wind-ups of pension plans
On June 12, 2012, we filed a motion for directives with the Quebec Superior Court, the court with jurisdiction in the creditor protection proceedings under the Companies’ Creditors Arrangement Act (Canada) (or the “CCAA Creditor Protection Proceedings”), seeking an order to prevent pension regulators in each of Quebec, New Brunswick, and Newfoundland and Labrador from declaring partial wind-ups of pension plans relating to employees of former operations in New Brunswick, and Newfoundland and Labrador, or a declaration that any claim for accelerated reimbursements of deficits arising from a partial wind-up is a barred claim under the CCAA Creditor Protection Proceedings. We contend, among other things, that any such declaration, if issued, would be inconsistent with the Quebec Superior Court’s sanction order confirming the CCAA debtors’ CCAA Plan of Reorganization and Compromise, as amended, and the terms of our emergence from the CCAA Creditor Protection Proceedings. A partial wind-up would likely shorten the period in which any deficit within those plans, which could reach up to Cdn $150 million ($115 million, based on the exchange rate in effect on June 30, 2018), would have to be funded if we do not obtain the relief sought. The hearing in this matter could occur in 2018.
17
RESOLUTE FOREST PRODUCTS INC.
Notes to Unaudited Interim Consolidated Financial Statements
Environmental matters
We are subject to a variety of federal or national, state, provincial, and local environmental laws and regulations in the jurisdictions in which we operate. We believe our operations are in material compliance with current applicable environmental laws and regulations. Environmental regulations promulgated in the future could require substantial additional expenditures for compliance and could have a material impact on us, in particular, and the industry in general.
We may be a “potentially responsible party” with respect to a hazardous waste site that is being addressed pursuant to the Comprehensive Environmental Response, Compensation and Liability Act of 1980 (commonly known as Superfund). We believe we will not be liable for any significant amounts at this site.
We have environmental liabilities of $8 million recorded as of both June 30, 2018 and December 31, 2017, primarily related to environmental remediation related to closed sites. The amount of these liabilities represents management’s estimate of the ultimate settlement based on an assessment of relevant factors and assumptions and could be affected by changes in facts or assumptions not currently known to management for which the outcome cannot be reasonably estimated at this time. These liabilities are included in “Accounts payable and accrued liabilities” or “Other liabilities” in our Consolidated Balance Sheets.
We have also asset retirement obligations of $26 million and $24 million recorded as of June 30, 2018 and December 31, 2017, respectively, primarily consisting of liabilities associated with landfills, sludge basins and the dismantling of retired assets. These liabilities are included in “Accounts payable and accrued liabilities” or “Other liabilities” in our Consolidated Balance Sheets.
18
RESOLUTE FOREST PRODUCTS INC.
Notes to Unaudited Interim Consolidated Financial Statements
Note 11. Segment Information
We manage our business based on the products we manufacture. Accordingly, our reportable segments correspond to our principal product lines: market pulp, tissue, wood products, newsprint, and specialty papers.
None of the income or loss items following “Operating income (loss)” in our Consolidated Statements of Operations are allocated to our segments, since those items are reviewed separately by management. For the same reason, closure costs, impairment and other related charges, inventory write-downs related to closures, start-up costs, gains and losses on disposition of assets, as well as other discretionary charges or credits are not allocated to our segments. We allocate depreciation and amortization expense to our segments, although the related fixed assets and amortizable intangible assets are not allocated to segment assets. Additionally, all selling, general and administrative expenses are allocated to our segments, with the exception of certain discretionary charges and credits, which we present under “corporate and other.”
Information about certain segment data for the three and six months ended June 30, 2018 and 2017, was as follows:
(Unaudited, in millions) | Market Pulp (1) | Tissue (2) | Wood Products (3) | Newsprint | Specialty Papers | Segment Total | Corporate and Other | Total | ||||||||||||||||||||||||
Sales | ||||||||||||||||||||||||||||||||
Second quarter | ||||||||||||||||||||||||||||||||
2018 | $ | 264 | $ | 35 | $ | 254 | $ | 230 | $ | 193 | $ | 976 | $ | — | $ | 976 | ||||||||||||||||
2017 | 213 | 20 | 197 | 201 | 227 | 858 | — | 858 | ||||||||||||||||||||||||
First six months | ||||||||||||||||||||||||||||||||
2018 | 521 | 57 | 463 | 428 | 381 | 1,850 | — | 1,850 | ||||||||||||||||||||||||
2017 | 422 | 40 | 374 | 427 | 467 | 1,730 | — | 1,730 | ||||||||||||||||||||||||
Depreciation and amortization | ||||||||||||||||||||||||||||||||
Second quarter | ||||||||||||||||||||||||||||||||
2018 | $ | 8 | $ | 5 | $ | 7 | $ | 17 | $ | 12 | $ | 49 | $ | 5 | $ | 54 | ||||||||||||||||
2017 | 8 | 1 | 7 | 17 | 11 | 44 | 6 | 50 | ||||||||||||||||||||||||
First six months | ||||||||||||||||||||||||||||||||
2018 | 15 | 6 | 15 | 33 | 24 | 93 | 14 | 107 | ||||||||||||||||||||||||
2017 | 16 | 2 | 16 | 33 | 23 | 90 | 11 | 101 | ||||||||||||||||||||||||
Operating income (loss) (4) | ||||||||||||||||||||||||||||||||
Second quarter | ||||||||||||||||||||||||||||||||
2018 | $ | 41 | $ | (10 | ) | $ | 79 | $ | 18 | $ | 4 | $ | 132 | $ | (11 | ) | $ | 121 | ||||||||||||||
2017 | 16 | (1 | ) | 45 | (7 | ) | (7 | ) | 46 | (94 | ) | (48 | ) | |||||||||||||||||||
First six months | ||||||||||||||||||||||||||||||||
2018 | 74 | (11 | ) | 132 | 14 | (3 | ) | 206 | (37 | ) | 169 | |||||||||||||||||||||
2017 | 23 | (1 | ) | 65 | (11 | ) | (3 | ) | 73 | (130 | ) | (57 | ) | |||||||||||||||||||
(1) | Inter-segment sales of $9 million and $10 million for the three months ended June 30, 2018 and 2017, respectively, and $19 million for both the six months ended June 30, 2018 and 2017, which are transacted at cost, were excluded from market pulp sales. |
(2) | The operating results of our Calhoun tissue operations, previously recorded under “corporate and other,” have been recorded in our tissue segment since April 1, 2018. |
(3) | Wood products sales to our joint ventures, which are transacted at arm’s length negotiated prices, were $8 million and $6 million for the three months ended June 30, 2018 and 2017, respectively, and $16 million and $10 million for the six months ended June 30, 2018 and 2017, respectively. |
(4) | In the first quarter of 2018, we changed our presentation of operating income in accordance with FASB ASU 2017-07, to present only the service cost component of net periodic pension cost and OPEB cost in operating expenses (together with other employee compensation costs arising during the period). The non-operating pension and OPEB costs, |
19
RESOLUTE FOREST PRODUCTS INC.
Notes to Unaudited Interim Consolidated Financial Statements
presented under “corporate and other,” are reported separately outside any subtotal of operating income. Prior period amounts have been reclassified to conform to the 2018 presentation. See Note 1. Organization and Basis of Presentation – New accounting pronouncements adopted – ASU 2017-07 “Improving the Presentation of Net Periodic Pension Cost and Net Periodic Postretirement Benefit Cost” for more information.
20
RESOLUTE FOREST PRODUCTS INC.
Notes to Unaudited Interim Consolidated Financial Statements
Note 12. Condensed Consolidating Financial Information
The following information is presented in accordance with Rule 3-10 of Regulation S-X and the public information requirements of Rule 144 promulgated pursuant to the Securities Act of 1933, as amended, in connection with Resolute Forest Products Inc.’s 2023 Notes that are fully and unconditionally guaranteed, on a joint and several basis, by all of our 100% owned material U.S. subsidiaries (or the “Guarantor Subsidiaries”). The 2023 Notes are not guaranteed by our foreign subsidiaries (or the “Non-guarantor Subsidiaries”).
The following condensed consolidating financial information sets forth the Statements of Operations and Comprehensive Income (Loss) for the three and six months ended June 30, 2018 and 2017, the Balance Sheets as of June 30, 2018 and December 31, 2017, and the Statements of Cash Flows for the six months ended June 30, 2018 and 2017 for the Parent, the Guarantor Subsidiaries on a combined basis, and the Non-guarantor Subsidiaries also on a combined basis. The condensed consolidating financial information reflects the investments of the Parent in the Guarantor Subsidiaries and Non-guarantor Subsidiaries, as well as the investments of the Guarantor Subsidiaries in the Non-guarantor Subsidiaries, using the equity method of accounting. The principal consolidating adjustments are entries to eliminate the investments in subsidiaries and intercompany balances and transactions.
CONDENSED CONSOLIDATING STATEMENT OF OPERATIONS AND COMPREHENSIVE INCOME | ||||||||||||||||||||
For the Three Months Ended June 30, 2018 | ||||||||||||||||||||
(Unaudited, in millions) | Parent | Guarantor Subsidiaries | Non-guarantor Subsidiaries | Consolidating Adjustments | Consolidated | |||||||||||||||
Sales | $ | — | $ | 731 | $ | 674 | $ | (429 | ) | $ | 976 | |||||||||
Costs and expenses: | ||||||||||||||||||||
Cost of sales, excluding depreciation, amortization and distribution costs | — | 666 | 396 | (423 | ) | 639 | ||||||||||||||
Depreciation and amortization | — | 21 | 33 | — | 54 | |||||||||||||||
Distribution costs | — | 38 | 85 | — | 123 | |||||||||||||||
Selling, general and administrative expenses | 7 | 14 | 21 | — | 42 | |||||||||||||||
Closure costs, impairment and other related charges | — | — | 1 | — | 1 | |||||||||||||||
Net gain on disposition of assets | — | — | (4 | ) | — | (4 | ) | |||||||||||||
Operating (loss) income | (7 | ) | (8 | ) | 142 | (6 | ) | 121 | ||||||||||||
Interest expense | (24 | ) | (1 | ) | (3 | ) | 17 | (11 | ) | |||||||||||
Non-operating pension and other postretirement benefit credits | — | 3 | 9 | — | 12 | |||||||||||||||
Other income (expense), net | — | 19 | (5 | ) | (17 | ) | (3 | ) | ||||||||||||
Equity in income of subsidiaries | 103 | 28 | — | (131 | ) | — | ||||||||||||||
Income before income taxes | 72 | 41 | 143 | (137 | ) | 119 | ||||||||||||||
Income tax provision | — | — | (48 | ) | 1 | (47 | ) | |||||||||||||
Net income including noncontrolling interests | 72 | 41 | 95 | (136 | ) | 72 | ||||||||||||||
Net income attributable to noncontrolling interests | — | — | — | — | — | |||||||||||||||
Net income attributable to Resolute Forest Products Inc. | $ | 72 | $ | 41 | $ | 95 | $ | (136 | ) | $ | 72 | |||||||||
Comprehensive income attributable to Resolute Forest Products Inc. | $ | 75 | $ | 39 | $ | 100 | $ | (139 | ) | $ | 75 | |||||||||
21
RESOLUTE FOREST PRODUCTS INC.
Notes to Unaudited Interim Consolidated Financial Statements
CONDENSED CONSOLIDATING STATEMENT OF OPERATIONS AND COMPREHENSIVE INCOME | ||||||||||||||||||||
For the Six Months Ended June 30, 2018 | ||||||||||||||||||||
(Unaudited, in millions) | Parent | Guarantor Subsidiaries | Non-guarantor Subsidiaries | Consolidating Adjustments | Consolidated | |||||||||||||||
Sales | $ | — | $ | 1,540 | $ | 1,266 | $ | (956 | ) | $ | 1,850 | |||||||||
Costs and expenses: | ||||||||||||||||||||
Cost of sales, excluding depreciation, amortization and distribution costs | — | 1,437 | 762 | (946 | ) | 1,253 | ||||||||||||||
Depreciation and amortization | — | 41 | 66 | — | 107 | |||||||||||||||
Distribution costs | — | 77 | 164 | (2 | ) | 239 | ||||||||||||||
Selling, general and administrative expenses | 12 | 31 | 42 | — | 85 | |||||||||||||||
Closure costs, impairment and other related charges | — | — | 1 | — | 1 | |||||||||||||||
Net gain on disposition of assets | — | — | (4 | ) | — | (4 | ) | |||||||||||||
Operating (loss) income | (12 | ) | (46 | ) | 235 | (8 | ) | 169 | ||||||||||||
Interest expense | (47 | ) | (4 | ) | (6 | ) | 33 | (24 | ) | |||||||||||
Non-operating pension and other postretirement benefit credits | — | 7 | 18 | — | 25 | |||||||||||||||
Other income (expense), net | — | 33 | (10 | ) | (33 | ) | (10 | ) | ||||||||||||
Equity in income of subsidiaries | 141 | 49 | — | (190 | ) | — | ||||||||||||||
Income before income taxes | 82 | 39 | 237 | (198 | ) | 160 | ||||||||||||||
Income tax provision | — | — | (80 | ) | 2 | (78 | ) | |||||||||||||
Net income including noncontrolling interests | 82 | 39 | 157 | (196 | ) | 82 | ||||||||||||||
Net income attributable to noncontrolling interests | — | — | — | — | — | |||||||||||||||
Net income attributable to Resolute Forest Products Inc. | $ | 82 | $ | 39 | $ | 157 | $ | (196 | ) | $ | 82 | |||||||||
Comprehensive income attributable to Resolute Forest Products Inc. | $ | 88 | $ | 34 | $ | 168 | $ | (202 | ) | $ | 88 | |||||||||
22
RESOLUTE FOREST PRODUCTS INC.
Notes to Unaudited Interim Consolidated Financial Statements
CONDENSED CONSOLIDATING STATEMENT OF OPERATIONS AND COMPREHENSIVE (LOSS) INCOME | ||||||||||||||||||||
For the Three Months Ended June 30, 2017 | ||||||||||||||||||||
(Unaudited, in millions) | Parent | Guarantor Subsidiaries | Non-guarantor Subsidiaries | Consolidating Adjustments | Consolidated | |||||||||||||||
Sales | $ | — | $ | 706 | $ | 540 | $ | (388 | ) | $ | 858 | |||||||||
Costs and expenses: | ||||||||||||||||||||
Cost of sales, excluding depreciation, amortization and distribution costs | — | 682 | 350 | (386 | ) | 646 | ||||||||||||||
Depreciation and amortization | — | 18 | 32 | — | 50 | |||||||||||||||
Distribution costs | — | 39 | 70 | (1 | ) | 108 | ||||||||||||||
Selling, general and administrative expenses | 5 | 17 | 15 | — | 37 | |||||||||||||||
Closure costs, impairment and other related charges | — | 64 | 1 | — | 65 | |||||||||||||||
Operating (loss) income | (5 | ) | (114 | ) | 72 | (1 | ) | (48 | ) | |||||||||||
Interest expense | (22 | ) | (3 | ) | (3 | ) | 16 | (12 | ) | |||||||||||
Non-operating pension and other postretirement benefit credits | — | — | 1 | — | 1 | |||||||||||||||
Other income, net | — | 20 | 1 | (16 | ) | 5 | ||||||||||||||
Equity in loss of subsidiaries | (47 | ) | — | — | 47 | — | ||||||||||||||
(Loss) income before income taxes | (74 | ) | (97 | ) | 71 | 46 | (54 | ) | ||||||||||||
Income tax provision | — | (1 | ) | (18 | ) | — | (19 | ) | ||||||||||||
Net (loss) income including noncontrolling interests | (74 | ) | (98 | ) | 53 | 46 | (73 | ) | ||||||||||||
Net income attributable to noncontrolling interests | — | — | (1 | ) | — | (1 | ) | |||||||||||||
Net (loss) income attributable to Resolute Forest Products Inc. | $ | (74 | ) | $ | (98 | ) | $ | 52 | $ | 46 | $ | (74 | ) | |||||||
Comprehensive (loss) income attributable to Resolute Forest Products Inc. | $ | (68 | ) | $ | (99 | ) | $ | 59 | $ | 40 | $ | (68 | ) | |||||||
23
RESOLUTE FOREST PRODUCTS INC.
Notes to Unaudited Interim Consolidated Financial Statements
CONDENSED CONSOLIDATING STATEMENT OF OPERATIONS AND COMPREHENSIVE (LOSS) INCOME | ||||||||||||||||||||
For the Six Months Ended June 30, 2017 | ||||||||||||||||||||
(Unaudited, in millions) | Parent | Guarantor Subsidiaries | Non-guarantor Subsidiaries | Consolidating Adjustments | Consolidated | |||||||||||||||
Sales | $ | — | $ | 1,415 | $ | 1,090 | $ | (775 | ) | $ | 1,730 | |||||||||
Costs and expenses: | ||||||||||||||||||||
Cost of sales, excluding depreciation, amortization and distribution costs | — | 1,360 | 731 | (774 | ) | 1,317 | ||||||||||||||
Depreciation and amortization | — | 37 | 64 | — | 101 | |||||||||||||||
Distribution costs | — | 80 | 139 | (1 | ) | 218 | ||||||||||||||
Selling, general and administrative expenses | 14 | 34 | 31 | — | 79 | |||||||||||||||
Closure costs, impairment and other related charges | — | 64 | 8 | — | 72 | |||||||||||||||
Operating (loss) income | (14 | ) | (160 | ) | 117 | — | (57 | ) | ||||||||||||
Interest expense | (42 | ) | (4 | ) | (6 | ) | 29 | (23 | ) | |||||||||||
Non-operating pension and other postretirement benefit credits | — | 1 | 3 | — | 4 | |||||||||||||||
Other income, net | — | 33 | 1 | (29 | ) | 5 | ||||||||||||||
Equity in (loss) income of subsidiaries | (65 | ) | 1 | — | 64 | — | ||||||||||||||
(Loss) income before income taxes | (121 | ) | (129 | ) | 115 | 64 | (71 | ) | ||||||||||||
Income tax provision | — | (1 | ) | (47 | ) | — | (48 | ) | ||||||||||||
Net (loss) income including noncontrolling interests | (121 | ) | (130 | ) | 68 | 64 | (119 | ) | ||||||||||||
Net income attributable to noncontrolling interests | — | — | (2 | ) | — | (2 | ) | |||||||||||||
Net (loss) income attributable to Resolute Forest Products Inc. | $ | (121 | ) | $ | (130 | ) | $ | 66 | $ | 64 | $ | (121 | ) | |||||||
Comprehensive (loss) income attributable to Resolute Forest Products Inc. | $ | (106 | ) | $ | (132 | ) | $ | 83 | $ | 49 | $ | (106 | ) | |||||||
24
RESOLUTE FOREST PRODUCTS INC.
Notes to Unaudited Interim Consolidated Financial Statements
CONDENSED CONSOLIDATING BALANCE SHEET | ||||||||||||||||||||
As of June 30, 2018 | ||||||||||||||||||||
(Unaudited, in millions) | Parent | Guarantor Subsidiaries | Non-guarantor Subsidiaries | Consolidating Adjustments | Consolidated | |||||||||||||||
Assets | ||||||||||||||||||||
Current assets: | ||||||||||||||||||||
Cash and cash equivalents | $ | — | $ | 1 | $ | 5 | $ | — | $ | 6 | ||||||||||
Accounts receivable, net | — | 376 | 140 | — | 516 | |||||||||||||||
Accounts receivable from affiliates | — | 562 | 919 | (1,481 | ) | — | ||||||||||||||
Inventories, net | — | 259 | 305 | (17 | ) | 547 | ||||||||||||||
Note, advance and interest receivable from parent | — | 409 | — | (409 | ) | — | ||||||||||||||
Notes and interest receivable from affiliates | — | 33 | — | (33 | ) | — | ||||||||||||||
Other current assets | — | 18 | 21 | — | 39 | |||||||||||||||
Total current assets | — | 1,658 | 1,390 | (1,940 | ) | 1,108 | ||||||||||||||
Fixed assets, net | — | 679 | 990 | — | 1,669 | |||||||||||||||
Amortizable intangible assets, net | — | 12 | 51 | — | 63 | |||||||||||||||
Goodwill | — | 81 | — | — | 81 | |||||||||||||||
Deferred income tax assets | — | 1 | 936 | 4 | 941 | |||||||||||||||
Note receivable from parent | — | 488 | — | (488 | ) | — | ||||||||||||||
Note receivable from affiliate | — | 111 | — | (111 | ) | — | ||||||||||||||
Investments in consolidated subsidiaries and affiliates | 4,086 | 2,160 | — | (6,246 | ) | — | ||||||||||||||
Other assets | — | 93 | 70 | — | 163 | |||||||||||||||
Total assets | $ | 4,086 | $ | 5,283 | $ | 3,437 | $ | (8,781 | ) | $ | 4,025 | |||||||||
Liabilities and equity | ||||||||||||||||||||
Current liabilities: | ||||||||||||||||||||
Accounts payable and accrued liabilities | $ | 5 | $ | 186 | $ | 247 | $ | — | $ | 438 | ||||||||||
Current portion of long-term debt | — | 1 | — | — | 1 | |||||||||||||||
Accounts payable to affiliates | 562 | 964 | — | (1,526 | ) | — | ||||||||||||||
Note, advance and interest payable to subsidiaries | 409 | — | — | (409 | ) | — | ||||||||||||||
Notes and interest payable to affiliate | — | — | 33 | (33 | ) | — | ||||||||||||||
Total current liabilities | 976 | 1,151 | 280 | (1,968 | ) | 439 | ||||||||||||||
Long-term debt, net of current portion | 592 | 82 | — | — | 674 | |||||||||||||||
Note payable to subsidiary | 488 | — | — | (488 | ) | — | ||||||||||||||
Note payable to affiliate | — | — | 111 | (111 | ) | — | ||||||||||||||
Pension and other postretirement benefit obligations | — | 361 | 787 | — | 1,148 | |||||||||||||||
Deferred income tax liabilities | — | — | 1 | — | 1 | |||||||||||||||
Other liabilities | 4 | 25 | 42 | — | 71 | |||||||||||||||
Total liabilities | 2,060 | 1,619 | 1,221 | (2,567 | ) | 2,333 | ||||||||||||||
Total equity | 2,026 | 3,664 | 2,216 | (6,214 | ) | 1,692 | ||||||||||||||
Total liabilities and equity | $ | 4,086 | $ | 5,283 | $ | 3,437 | $ | (8,781 | ) | $ | 4,025 | |||||||||
25
RESOLUTE FOREST PRODUCTS INC.
Notes to Unaudited Interim Consolidated Financial Statements
CONDENSED CONSOLIDATING BALANCE SHEET | ||||||||||||||||||||
As of December 31, 2017 | ||||||||||||||||||||
(Unaudited, in millions) | Parent | Guarantor Subsidiaries | Non-guarantor Subsidiaries | Consolidating Adjustments | Consolidated | |||||||||||||||
Assets | ||||||||||||||||||||
Current assets: | ||||||||||||||||||||
Cash and cash equivalents | $ | — | $ | 3 | $ | 3 | $ | — | $ | 6 | ||||||||||
Accounts receivable, net | — | 319 | 160 | — | 479 | |||||||||||||||
Accounts receivable from affiliates | — | 535 | 729 | (1,264 | ) | — | ||||||||||||||
Inventories, net | — | 243 | 292 | (9 | ) | 526 | ||||||||||||||
Note, advance and interest receivable from parent | — | 538 | — | (538 | ) | — | ||||||||||||||
Notes and interest receivable from affiliates | — | 32 | — | (32 | ) | — | ||||||||||||||
Other current assets | — | 16 | 17 | — | 33 | |||||||||||||||
Total current assets | — | 1,686 | 1,201 | (1,843 | ) | 1,044 | ||||||||||||||
Fixed assets, net | — | 692 | 1,024 | — | 1,716 | |||||||||||||||
Amortizable intangible assets, net | — | 13 | 52 | — | 65 | |||||||||||||||
Goodwill | — | 81 | — | — | 81 | |||||||||||||||
Deferred income tax assets | — | 1 | 1,073 | 2 | 1,076 | |||||||||||||||
Notes receivable from parent | — | 330 | — | (330 | ) | — | ||||||||||||||
Note receivable from affiliate | — | 116 | — | (116 | ) | — | ||||||||||||||
Investments in consolidated subsidiaries and affiliates | 3,939 | 2,111 | — | (6,050 | ) | — | ||||||||||||||
Other assets | — | 98 | 67 | — | 165 | |||||||||||||||
Total assets | $ | 3,939 | $ | 5,128 | $ | 3,417 | $ | (8,337 | ) | $ | 4,147 | |||||||||
Liabilities and equity | ||||||||||||||||||||
Current liabilities: | ||||||||||||||||||||
Accounts payable and accrued liabilities | $ | 4 | $ | 171 | $ | 245 | $ | — | $ | 420 | ||||||||||
Current portion of long-term debt | — | 1 | — | — | 1 | |||||||||||||||
Accounts payable to affiliates | 536 | 728 | — | (1,264 | ) | — | ||||||||||||||
Note, advance and interest payable to subsidiaries | 538 | — | — | (538 | ) | — | ||||||||||||||
Notes and interest payable to affiliate | — | — | 32 | (32 | ) | — | ||||||||||||||
Total current liabilities | 1,078 | 900 | 277 | (1,834 | ) | 421 | ||||||||||||||
Long-term debt, net of current portion | 592 | 196 | — | — | 788 | |||||||||||||||
Note payable to subsidiary | 330 | — | — | (330 | ) | — | ||||||||||||||
Note payable to affiliate | — | — | 116 | (116 | ) | — | ||||||||||||||
Pension and other postretirement benefit obligations | — | 378 | 879 | — | 1,257 | |||||||||||||||
Deferred income tax liabilities | — | — | 13 | — | 13 | |||||||||||||||
Other liabilities | 5 | 24 | 39 | — | 68 | |||||||||||||||
Total liabilities | 2,005 | 1,498 | 1,324 | (2,280 | ) | 2,547 | ||||||||||||||
Total equity | 1,934 | 3,630 | 2,093 | (6,057 | ) | 1,600 | ||||||||||||||
Total liabilities and equity | $ | 3,939 | $ | 5,128 | $ | 3,417 | $ | (8,337 | ) | $ | 4,147 | |||||||||
26
RESOLUTE FOREST PRODUCTS INC.
Notes to Unaudited Interim Consolidated Financial Statements
CONDENSED CONSOLIDATING STATEMENT OF CASH FLOWS | ||||||||||||||||||||
For the Six Months Ended June 30, 2018 | ||||||||||||||||||||
(Unaudited, in millions) | Parent | Guarantor Subsidiaries | Non-guarantor Subsidiaries | Consolidating Adjustments | Consolidated | |||||||||||||||
Net cash provided by operating activities | $ | — | $ | 187 | $ | 33 | $ | — | $ | 220 | ||||||||||
Cash flows from investing activities: | ||||||||||||||||||||
Cash invested in fixed assets | — | (16 | ) | (37 | ) | — | (53 | ) | ||||||||||||
Disposition of assets | — | — | 2 | — | 2 | |||||||||||||||
Increase in countervailing duty cash deposits on supercalendered paper | — | (11 | ) | — | — | (11 | ) | |||||||||||||
Increase in countervailing and anti-dumping duty cash deposits on softwood lumber | — | (41 | ) | — | — | (41 | ) | |||||||||||||
Increase in countervailing duty cash deposits on uncoated groundwood paper | — | (6 | ) | — | — | (6 | ) | |||||||||||||
Advance to parent | — | (1 | ) | — | 1 | — | ||||||||||||||
Net cash used in investing activities | — | (75 | ) | (35 | ) | 1 | (109 | ) | ||||||||||||
Cash flows from financing activities: | ||||||||||||||||||||
Net repayments under revolving credit facilities | — | (114 | ) | — | — | (114 | ) | |||||||||||||
Payments of financing and credit facility fees | (1 | ) | — | — | — | (1 | ) | |||||||||||||
Advance from subsidiary | 1 | — | — | (1 | ) | — | ||||||||||||||
Net cash used in financing activities | — | (114 | ) | — | (1 | ) | (115 | ) | ||||||||||||
Effect of exchange rate changes on cash and cash equivalents, and restricted cash | — | — | (2 | ) | — | (2 | ) | |||||||||||||
Net decrease in cash and cash equivalents, and restricted cash | — | (2 | ) | (4 | ) | — | (6 | ) | ||||||||||||
Cash and cash equivalents, and restricted cash: | ||||||||||||||||||||
Beginning of period | — | 3 | 46 | — | 49 | |||||||||||||||
End of period | $ | — | $ | 1 | $ | 42 | $ | — | $ | 43 | ||||||||||
Cash and cash equivalents, and restricted cash at period end: | ||||||||||||||||||||
Cash and cash equivalents | $ | — | $ | 1 | $ | 5 | $ | — | $ | 6 | ||||||||||
Restricted cash | — | — | 37 | — | 37 | |||||||||||||||
27
RESOLUTE FOREST PRODUCTS INC.
Notes to Unaudited Interim Consolidated Financial Statements
CONDENSED CONSOLIDATING STATEMENT OF CASH FLOWS | ||||||||||||||||||||
For the Six Months Ended June 30, 2017 | ||||||||||||||||||||
(Unaudited, in millions) | Parent | Guarantor Subsidiaries | Non-guarantor Subsidiaries | Consolidating Adjustments | Consolidated | |||||||||||||||
Net cash provided by operating activities | $ | — | $ | 39 | $ | 21 | $ | — | $ | 60 | ||||||||||
Cash flows from investing activities: | ||||||||||||||||||||
Cash invested in fixed assets | — | (95 | ) | (21 | ) | — | (116 | ) | ||||||||||||
Increase in countervailing duty cash deposits on supercalendered paper | — | (12 | ) | — | — | (12 | ) | |||||||||||||
Increase in countervailing and anti-dumping duty cash deposits on softwood lumber | — | (4 | ) | — | — | (4 | ) | |||||||||||||
Increase in notes receivable from affiliate | — | (7 | ) | — | 7 | — | ||||||||||||||
Cash used in investing activities | — | (118 | ) | (21 | ) | 7 | (132 | ) | ||||||||||||
Cash flows from financing activities: | ||||||||||||||||||||
Net borrowings under revolving credit facilities | — | 77 | — | — | 77 | |||||||||||||||
Increase in notes payable to affiliate | — | — | 7 | (7 | ) | — | ||||||||||||||
Net cash provided by financing activities | — | 77 | 7 | (7 | ) | 77 | ||||||||||||||
Effect of exchange rate changes on cash and cash equivalents | — | — | 3 | — | 3 | |||||||||||||||
Net (decrease) increase in cash and cash equivalents, and restricted cash | — | (2 | ) | 10 | — | 8 | ||||||||||||||
Cash and cash equivalents, and restricted cash: | ||||||||||||||||||||
Beginning of period | — | 2 | 71 | — | 73 | |||||||||||||||
End of period | $ | — | $ | — | $ | 81 | $ | — | $ | 81 | ||||||||||
Cash and cash equivalents, and restricted cash at period end: | ||||||||||||||||||||
Cash and cash equivalents | $ | — | $ | — | $ | 44 | $ | — | $ | 44 | ||||||||||
Restricted cash | — | — | 37 | — | 37 | |||||||||||||||
28
ITEM 2. | MANAGEMENT’S DISCUSSION AND ANALYSIS OF FINANCIAL CONDITION AND RESULTS OF OPERATIONS |
The following management’s discussion and analysis is intended to help the reader understand Resolute Forest Products, our results of operations, cash flows and financial condition. The discussion is provided as a supplement to, and should be read in conjunction with, our consolidated financial statements and the accompanying notes (or the “Consolidated Financial Statements”) contained in Item 1 – Financial Statements of this Quarterly Report on Form 10-Q (or “Form 10-Q”).
When we refer to “Resolute Forest Products,” “we,” “our,” “us” or the “Company,” we mean Resolute Forest Products Inc. with its subsidiaries and affiliates, either individually or collectively, unless otherwise indicated.
CAUTIONARY STATEMENTS REGARDING FORWARD-LOOKING INFORMATION AND USE OF THIRD-PARTY DATA
Statements in this Form 10-Q that are not reported financial results or other historical information of Resolute Forest Products are “forward-looking statements” within the meaning of the Private Securities Litigation Reform Act of 1995. They include, for example, statements relating to our: strategic investment plan for our Saint-Félicien (Quebec) pulp mill; efforts and initiatives to reduce costs and increase revenues and profitability; business and operating outlook; assessment of market conditions; growth strategies and prospects, and the growth potential of the Company and the industry in which we operate; liquidity; future cash flows; and strategies for achieving our goals generally. Forward-looking statements may be identified by the use of forward-looking terminology such as the words “should,” “would,” “could,” “will,” “may,” “expect,” “believe,” “anticipate,” “attempt,” “project” and other terms with similar meaning indicating possible future events or potential impact on our business or Resolute Forest Products’ shareholders.
The reader is cautioned not to place undue reliance on these forward-looking statements, which are not guarantees of future performance. These statements are based on management’s current assumptions, beliefs and expectations, all of which involve a number of business risks and uncertainties that could cause actual results to differ materially. The potential risks and uncertainties that could cause our actual future financial condition, results of operations and performance to differ materially from those expressed or implied in this Form 10-Q include, but are not limited to, the impact of: developments in non-print media, and the effectiveness of our responses to these developments; intense competition in the forest products industry; any inability to offer products certified to globally recognized forestry management and chain of custody standards; any inability to successfully implement our strategies to increase our earnings power; the possible failure to successfully integrate acquired businesses with ours or to realize the anticipated benefits of acquisitions, such as Atlas Paper Holdings, Inc. and its subsidiaries, or divestitures or other strategic transactions or projects, such as our Calhoun (Tennessee) tissue operations; uncertainty or changes in political or economic conditions in the U.S., Canada or other countries in which we sell our products; global economic conditions; the highly cyclical nature of the forest products industry; any difficulties in obtaining timber or wood fiber at favorable prices, or at all; changes in the cost of purchased energy and other raw materials; physical and financial risks associated with global, regional, and local weather conditions, and climate change; any disruption in operations or increased labor costs due to labor disputes; difficulties in our employee relations or retention; disruptions to our supply chain, operations or the delivery of our products; cybersecurity risks; risks related to the operation and transition of legacy system applications; negative publicity, even if unjustified; currency fluctuations; any increase in the level of required contributions to our pension plans, including as a result of any increase in the amount by which they are underfunded; our ability to maintain adequate capital resources to provide for all of our substantial capital requirements; the terms of our outstanding indebtedness, which could restrict our current and future operations; losses that are not covered by insurance; any additional closure costs and long-lived asset or goodwill impairment or accelerated depreciation charges; any need to record additional valuation allowances against our recorded deferred income tax assets; our exports from one country to another country becoming or remaining subject to duties, cash deposit requirements, border taxes, quotas or other trade remedies or restrictions; countervailing or anti-dumping duties on imports to the U.S. of most of our paper products and substantially all of our softwood lumber products produced at our Canadian mills; any failure to comply with laws or regulations generally; any additional environmental or health and safety liabilities; any violation of trade laws, export controls or other laws relating to our international sales and operations; adverse outcomes of legal proceedings or disputes in which we are involved; the actions of holders of a significant percentage of our common stock; and the potential risks and uncertainties set forth under Part I, Item 1A, “Risk Factors,” of our annual report on Form 10-K for the year ended December 31, 2017, filed with the U.S. Securities and Exchange Commission, or the “SEC”, on March 1, 2018 (the “2017 Annual Report”).
All forward-looking statements in this Form 10-Q are expressly qualified by the cautionary statements contained or referred to in this section and in our other filings with the SEC and the Canadian securities regulatory authorities. We disclaim any obligation to publicly update or revise any forward-looking information, whether as a result of new information, future events or otherwise, except as required by law.
29
Market and industry data
The information on industry and general economic conditions in this Form 10-Q was derived from third-party sources and trade publications we believe to be widely accepted and accurate. We have not independently verified the information and cannot assure you of its accuracy.
OVERVIEW
Resolute Forest Products is a global leader in the forest products industry with a diverse range of products, including market pulp, tissue, wood products, newsprint and specialty papers, which are marketed in close to 70 countries. The company owns or operates some 40 manufacturing facilities, as well as power generation assets, in the U.S. and Canada. We are the largest Canadian producer of wood products east of the Canadian Rockies and one of the most significant pulp producers in North America. By capacity, we are the number one producer of newsprint in the world and the largest producer of uncoated mechanical papers in North America. We are also an emerging tissue producer.
We report our activities in five business segments: market pulp, tissue, wood products, newsprint, and specialty papers.
We are guided by our vision and values, focusing on safety, profitability, accountability, sustainability and teamwork. These are the elements that we believe best define us:
• | Competitive cost structure and diversified asset base - With our large-scale, efficient and integrated operations, competitive sources of energy and fiber, strategically located mills, and cost-effective management structure, we believe we are well positioned to compete in the global marketplace. We maintain a rigorous focus on reducing costs, optimizing production across our network, adjusting to market dynamics, as well as capitalizing on our access to international markets. |
• | Conservative capital structure - Our low debt, which has favorable pricing and flexibility, and solid liquidity levels are key to our continued transformation to a more sustainable company. In order to maintain financial strength and flexibility, we continue to spend our capital in a disciplined, strategic and focused manner, concentrating on our most competitive sites. |
• | Strategic perspectives - We pursue initiatives that improve our cost position, advance diversification, provide synergies or position us to expand into future growth markets. All are key to our continuing transformation: focus on pulp, tissue operations, and wood products, and keep pace with structurally-declining paper demand. To that end, we take an opportunistic approach that aligns with our strategic plan and that we believe positions us favorably for the long-term evolution of the paper and forest products industry, including bioproducts. |
Our Business
For information relating to our business, including our products, strategy and recent highlights, capital management, sustainable performance and development, and power generation assets, refer to our 2017 Annual Report.
Second Quarter Overview
In the first quarter of 2018, we changed our presentation of operating income in accordance with Financial Accounting Standards Board Accounting Standards Update 2017-07, to present only the service cost component of net periodic pension cost and net periodic other postretirement benefit (or “OPEB”) cost in operating expenses (together with other employee compensation costs arising during the period). The other components of the net periodic pension cost and net periodic OPEB cost (or “Non-operating pension and OPEB costs”), recorded under “corporate and other,” are reported separately outside any subtotal of operating income. Prior period amounts have been reclassified to conform to the 2018 presentation. See Item 1. Financial Statements – Note 1. Organization and Basis of Presentation – New accounting pronouncements adopted – ASU 2017-07 “Improving the Presentation of Net Periodic Pension Cost and Net Periodic Postretirement Benefit Cost” for more information.
Three months ended June 30, 2018 vs. June 30, 2017
Our operating income was $121 million in the quarter, compared to a loss of $48 million in the second quarter of 2017. Excluding special items, we generated operating income of $118 million, compared to $33 million in the year-ago period. Special items are described below.
30
Our net income in the quarter was $72 million, or $0.77 per diluted share, compared to a net loss of $74 million, or $0.82 per share, in the year-ago period. Our net income in the quarter, excluding special items, was $66 million, or $0.71 per diluted share, compared to a net loss, excluding special items, of $3 million, or $0.03 per share, in the year-ago period.
Three Months Ended June 30, 2018 | Operating Income (Loss) | Net Income (Loss) | EPS | |||||||||
(Unaudited, in millions, except per share amounts) | ||||||||||||
GAAP, as reported | $ | 121 | $ | 72 | $ | 0.77 | ||||||
Adjustments for special items: | ||||||||||||
Foreign exchange loss | — | 1 | 0.01 | |||||||||
Closure costs, impairment and other related charges | 1 | 1 | 0.01 | |||||||||
Net gain on disposition of assets | (4 | ) | (4 | ) | (0.04 | ) | ||||||
Non-operating pension and other postretirement benefit credits | — | (12 | ) | (0.13 | ) | |||||||
Other expense, net | — | 2 | 0.02 | |||||||||
Income tax effect of special items | — | 6 | 0.07 | |||||||||
Adjusted for special items (1) | $ | 118 | $ | 66 | $ | 0.71 | ||||||
Three Months Ended June 30, 2017 | Operating Income (Loss) | Net Income (Loss) | EPS | |||||||||
(Unaudited, in millions, except per share amounts) | ||||||||||||
GAAP, as reported | $ | (48 | ) | $ | (74 | ) | $ | (0.82 | ) | |||
Adjustments for special items: | ||||||||||||
Foreign exchange gain | — | (3 | ) | (0.03 | ) | |||||||
Closure costs, impairment and other related charges | 65 | 65 | 0.72 | |||||||||
Inventory write-downs related to closures | 9 | 9 | 0.10 | |||||||||
Start-up costs | 7 | 7 | 0.08 | |||||||||
Non-operating pension and other postretirement benefit credits | — | (1 | ) | (0.01 | ) | |||||||
Other income, net | — | (2 | ) | (0.02 | ) | |||||||
Income tax effect of special items | — | (4 | ) | (0.05 | ) | |||||||
Adjusted for special items (1) | $ | 33 | $ | (3 | ) | $ | (0.03 | ) | ||||
(1) | Operating income (loss), net income (loss) and net income (loss) per share (or “EPS”), in each case as adjusted for special items, are not financial measures recognized under U.S. generally accepted accounting principles (or “GAAP”). We calculate operating income (loss), as adjusted for special items, as operating income (loss) from our Consolidated Statements of Operations, adjusted for items such as closure costs, impairment and other related charges, inventory write-downs related to closures, start-up costs, gains and losses on disposition of assets, and other charges or credits that are excluded from our segment’s performance from GAAP operating income (loss). We calculate net income (loss), as adjusted for special items, as net income (loss) from our Consolidated Statements of Operations, adjusted for the same special items applied to operating income (loss), in addition to foreign exchange gains and losses, non-operating pension and OPEB costs and credits, other income (expense), net, and the income tax effect of the special items. EPS, as adjusted for special items, is calculated as net income (loss), as adjusted for special items, per diluted share. We believe that using these non-GAAP measures is useful because they are consistent with the indicators management uses internally to measure the Company’s performance, and it allows the reader to more easily compare our operations and financial performance from period to period. Operating income (loss), net income (loss) and EPS, in each case as adjusted for special items, are internal measures, and therefore may not be comparable to those of other companies. These non-GAAP measures should not be viewed as substitutes to financial measures determined under GAAP. |
31
Six months ended June 30, 2018 vs. June 30, 2017
Our operating income was $169 million in the first half of the year, compared to a loss of $57 million in the year-ago period. Excluding special items, we generated operating income of $173 million, compared to $43 million in the year-ago period. Special items are described below.
Our net income in the first half of the year was $82 million, or $0.88 per diluted share, compared to a net loss of $121 million, or $1.34 per share in the year-ago period. Our net income in the period, excluding special items, was $83 million, or $0.89 per diluted share, compared to a net loss, excluding special items, of $33 million, or $0.37 per share, in the year-ago period.
Six Months Ended June 30, 2018 | Operating Income (Loss) | Net Income (Loss) | EPS | |||||||||
(Unaudited, in millions, except per share amounts) | ||||||||||||
GAAP, as reported | $ | 169 | $ | 82 | $ | 0.88 | ||||||
Adjustments for special items: | ||||||||||||
Foreign exchange loss | — | 2 | 0.02 | |||||||||
Closure costs, impairment and other related charges | 1 | 1 | 0.01 | |||||||||
Reversal of inventory write-downs related to closures | (1 | ) | (1 | ) | (0.01 | ) | ||||||
Start-up costs | 8 | 8 | 0.09 | |||||||||
Net gain on disposition of assets | (4 | ) | (4 | ) | (0.05 | ) | ||||||
Non-operating pension and other postretirement benefit credits | — | (25 | ) | (0.27 | ) | |||||||
Other expense, net | — | 8 | 0.09 | |||||||||
Income tax effect of special items | — | 12 | 0.13 | |||||||||
Adjusted for special items (1) | $ | 173 | $ | 83 | $ | 0.89 | ||||||
Six Months Ended June 30, 2017 | Operating Income (Loss) | Net Income (Loss) | EPS | |||||||||
(Unaudited, in millions, except per share amounts) | ||||||||||||
GAAP, as reported | $ | (57 | ) | $ | (121 | ) | $ | (1.34 | ) | |||
Adjustments for special items: | ||||||||||||
Foreign exchange gain | — | (3 | ) | (0.03 | ) | |||||||
Closure costs, impairment and other related charges | 72 | 72 | 0.80 | |||||||||
Inventory write-downs related to closures | 13 | 13 | 0.14 | |||||||||
Start-up costs | 15 | 15 | 0.16 | |||||||||
Non-operating pension and other postretirement benefit credits | — | (4 | ) | (0.05 | ) | |||||||
Other income, net | — | (2 | ) | (0.02 | ) | |||||||
Income tax effect of special items | — | (3 | ) | (0.03 | ) | |||||||
Adjusted for special items (1) | $ | 43 | $ | (33 | ) | $ | (0.37 | ) | ||||
(1) | Operating income (loss), net income (loss) and EPS, in each case as adjusted for special items, are non-GAAP financial measures. For more information on the calculation and reasons we include these measures, see note 1 under “Overview – Second Quarter Overview” above. |
32
RESULTS OF OPERATIONS
Consolidated Results
Selected financial information
Three Months Ended June 30, | Six Months Ended June 30, | ||||||||||||||||
(Unaudited, in millions, except per share amounts) | 2018 | 2017 | 2018 | 2017 | |||||||||||||
Sales | $ | 976 | $ | 858 | $ | 1,850 | $ | 1,730 | |||||||||
Operating income (loss) per segment: | |||||||||||||||||
Market pulp | 41 | 16 | 74 | 23 | |||||||||||||
Tissue | (10 | ) | (1 | ) | (11 | ) | (1 | ) | |||||||||
Wood products | 79 | 45 | 132 | 65 | |||||||||||||
Newsprint | 18 | (7 | ) | 14 | (11 | ) | |||||||||||
Specialty papers | 4 | (7 | ) | (3 | ) | (3 | ) | ||||||||||
Segment total | 132 | 46 | 206 | 73 | |||||||||||||
Corporate and other | (11 | ) | (94 | ) | (37 | ) | (130 | ) | |||||||||
Operating income (loss) | 121 | (48 | ) | 169 | (57 | ) | |||||||||||
Net income (loss) attributable to Resolute Forest Products Inc. | 72 | (74 | ) | 82 | (121 | ) | |||||||||||
Net income (loss) per common share attributable to Resolute Forest Products Inc. common shareholders: | |||||||||||||||||
Basic | $ | 0.79 | $ | (0.82 | ) | $ | 0.90 | $ | (1.34 | ) | |||||||
Diluted | 0.77 | (0.82 | ) | 0.88 | (1.34 | ) | |||||||||||
Adjusted EBITDA (1) | $ | 172 | $ | 83 | $ | 280 | $ | 144 | |||||||||
(Unaudited, in millions) | June 30, 2018 | December 31, 2017 | ||||||
Cash and cash equivalents | $ | 6 | $ | 6 | ||||
Total assets | 4,025 | 4,147 | ||||||
(1) | Earnings before interest expense, income taxes, and depreciation and amortization, or “EBITDA” and adjusted EBITDA are not financial measures recognized under GAAP. EBITDA is calculated as net income (loss) including noncontrolling interests from the Consolidated Statements of Operations, adjusted for interest expense, income taxes, and depreciation and amortization. Adjusted EBITDA means EBITDA, excluding special items, such as foreign exchange gains and losses, closure costs, impairment and other related charges, inventory write-downs related to closures, start-up costs, gains and losses on disposition of assets, non-operating pension and OPEB costs and credits, and other charges or credits. We believe that using non-GAAP measures such as EBITDA and adjusted EBITDA is useful because they are consistent with the indicators management uses internally to measure the Company’s performance and it allows the reader to more easily compare our operations and financial performance from period to period. EBITDA and adjusted EBITDA are internal measures, and therefore may not be comparable to those of other companies. These non-GAAP measures should not be viewed as substitutes to financial measures determined under GAAP. |
33
Three Months Ended June 30, | Six Months Ended June 30, | ||||||||||||||||
(Unaudited, in millions) | 2018 | 2017 | 2018 | 2017 | |||||||||||||
Net income (loss) including noncontrolling interests | $ | 72 | $ | (73 | ) | $ | 82 | $ | (119 | ) | |||||||
Interest expense | 11 | 12 | 24 | 23 | |||||||||||||
Income tax provision | 47 | 19 | 78 | 48 | |||||||||||||
Depreciation and amortization | 54 | 50 | 107 | 101 | |||||||||||||
EBITDA | $ | 184 | $ | 8 | $ | 291 | $ | 53 | |||||||||
Foreign exchange loss (gain) | 1 | (3 | ) | 2 | (3 | ) | |||||||||||
Closure costs, impairment and other related charges | 1 | 65 | 1 | 72 | |||||||||||||
Inventory write-downs (reversal) related to closures | — | 9 | (1 | ) | 13 | ||||||||||||
Start-up costs | — | 7 | 8 | 15 | |||||||||||||
Net gain on disposition of assets | (4 | ) | — | (4 | ) | — | |||||||||||
Non-operating pension and other postretirement benefit credits | (12 | ) | (1 | ) | (25 | ) | (4 | ) | |||||||||
Other expense (income), net | 2 | (2 | ) | 8 | (2 | ) | |||||||||||
Adjusted EBITDA | $ | 172 | $ | 83 | $ | 280 | $ | 144 | |||||||||
The operating results of our Calhoun tissue operations, previously recorded under “corporate and other,” have been recorded in our tissue segment since April 1, 2018.
Three months ended June 30, 2018 vs. June 30, 2017
Operating income (loss) variance analysis
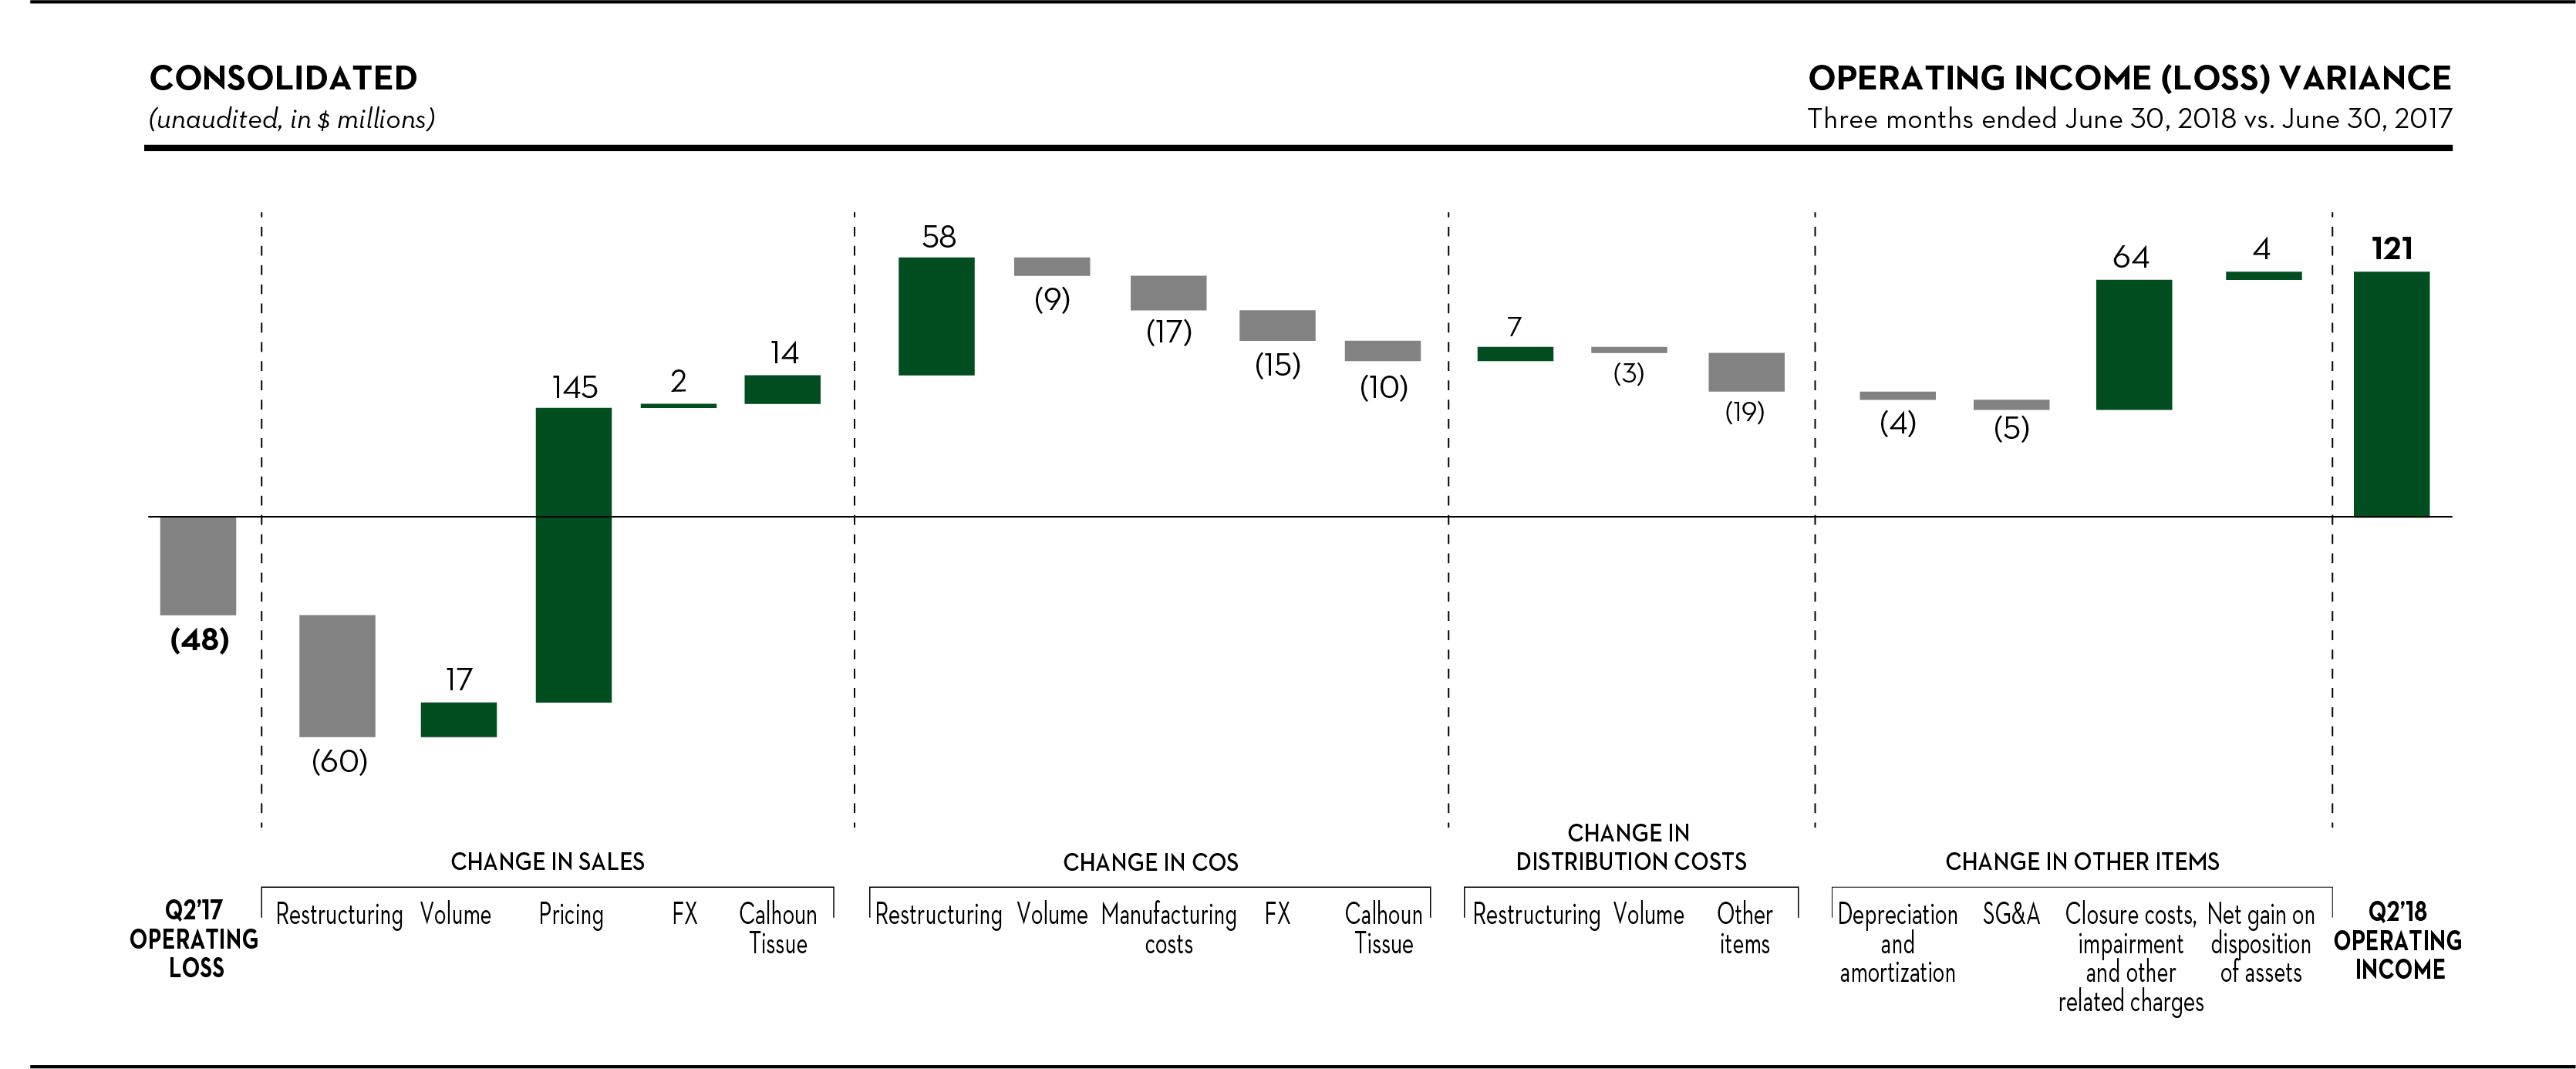
Sales
Sales increased by $118 million, or 14%, compared to the year-ago period, to $976 million. Including restructuring initiatives, sales volume had an unfavorable impact of $43 million, mainly reflecting a 74,000 short ton (67,000 metric ton) decline in specialty papers shipments resulting from the capacity reduction initiatives taken in 2017. Sales volumes in wood products also decreased, down 3%, while market pulp shipments improved by 5%. Pricing was up across all segments, contributing to a $145 million increase in sales. The average transaction price increased 33% for wood products, 18% for market pulp, 15% for newsprint, and 8% for specialty papers. The inclusion of our Calhoun tissue operations’ results in our tissue segment increased sales by $14 million.
34
Cost of sales, excluding depreciation, amortization and distribution costs
Cost of sales, excluding depreciation, amortization and distribution costs, which we refer to as “COS”, was $7 million lower in the quarter. Restructuring initiatives reduced COS by $58 million, including the elimination of $20 million in fixed manufacturing costs. After removing the higher volume, the COS related to Calhoun’s tissue operations, and the effects of the Canadian dollar fluctuation and restructuring initiatives, manufacturing costs increased by $17 million, reflecting:
• | higher maintenance and related labor costs ($13 million), mostly related to scheduled outages; and |
• | unfavorable fiber costs ($13 million), mostly due to higher market-based stumpage fees and diesel fuel expense, both included in log cost, and recycled fiber prices; |
partly offset by:
• | write-downs of mill stores and other supplies incurred in the year-ago period ($9 million), primarily as a result of the permanent closure of a paper machine in Catawba (South Carolina), and of our Mokpo (South Korea) paper mill; and |
• | lower wood chip prices ($4 million). |
Distribution costs
After removing the distribution costs related to Calhoun’s tissue operations and the effects of higher volume, restructuring initiatives, and the Canadian dollar fluctuation, distribution costs rose by $16 million in the quarter, mainly due to higher truck and rail car rates, an increase in the average length of haul, and higher fuel surcharges.
Depreciation and amortization
Depreciation and amortization was $4 million higher in the current quarter, mainly because of additional costs associated with the implementation of our integrated business management software, and an increase in amortization of costs associated with the Calhoun tissue manufacturing and converting facility.
Selling, general and administrative expenses
Selling, general and administrative expenses (or “SG&A”) were $5 million greater in the period, reflecting primarily higher variable compensation expense accruals related to the Company’s performance and increase in share price.
Closure costs, impairment and other related charges
See the corresponding variance analysis under “– Segment Earnings – Corporate and Other” below.
Net income (loss) variance analysis
Non-operating pension and other postretirement benefit credits
We recorded non-operating pension and OPEB credits of $12 million in the quarter, compared to $1 million in the year-ago period. The increase compared to the year-ago period is largely due to higher expected return on plan assets, and lower amortization of actuarial losses for our U.S. pension plan, which became predominantly inactive at year-end in 2017, resulting in a longer amortization period.
Income taxes
We recorded an income tax provision of $47 million in the quarter, on income before income taxes of $119 million, compared to an expected income tax provision of $25 million based on the U.S. federal statutory income tax rate of 21%. The difference reflects foreign tax rate differences ($25 million), including an $18 million income tax provision attributable to the global intangible low-taxed income (or “GILTI”) inclusion, and foreign exchange items ($7 million), offset by a $13 million valuation allowance reversal related to our U.S. operations where we recognize a valuation allowance against virtually all of our net deferred income tax assets.
In the second quarter of 2017, we recorded an income tax provision of $19 million, on a loss before income taxes of $54 million, compared to an expected income tax benefit of $11 million based on the U.S. federal statutory income tax rate of 21%. The difference reflects mostly a $49 million valuation allowance, primarily related to our U.S. operations where we recognized a valuation allowance against all of our net deferred income tax assets, partially offset by state and foreign tax rate differences ($9 million), and the change in U.S. federal tax rate ($8 million).
35
On December 22, 2017, the Tax Cuts and Jobs Act (or the “TCJA”) was enacted into law which, among other changes, reduced the U.S. federal statutory income tax rate from 35% to 21%, and introduced the GILTI regime, the base erosion anti-abuse tax, and the foreign-derived intangible income deduction. The enactment of the TCJA resulted in an income tax provision attributable to the GILTI inclusion, before valuation allowance, with no other impact on our results of operations. The impacts of the TCJA on our 2017 financial results remain provisional and unchanged as of June 30, 2018. See Item 1 – Financial Statements – Note 9. Income Taxes – Tax Cuts and Jobs Act for more information.
Six months ended June 30, 2018 vs. June 30, 2017
Operating income (loss) variance analysis
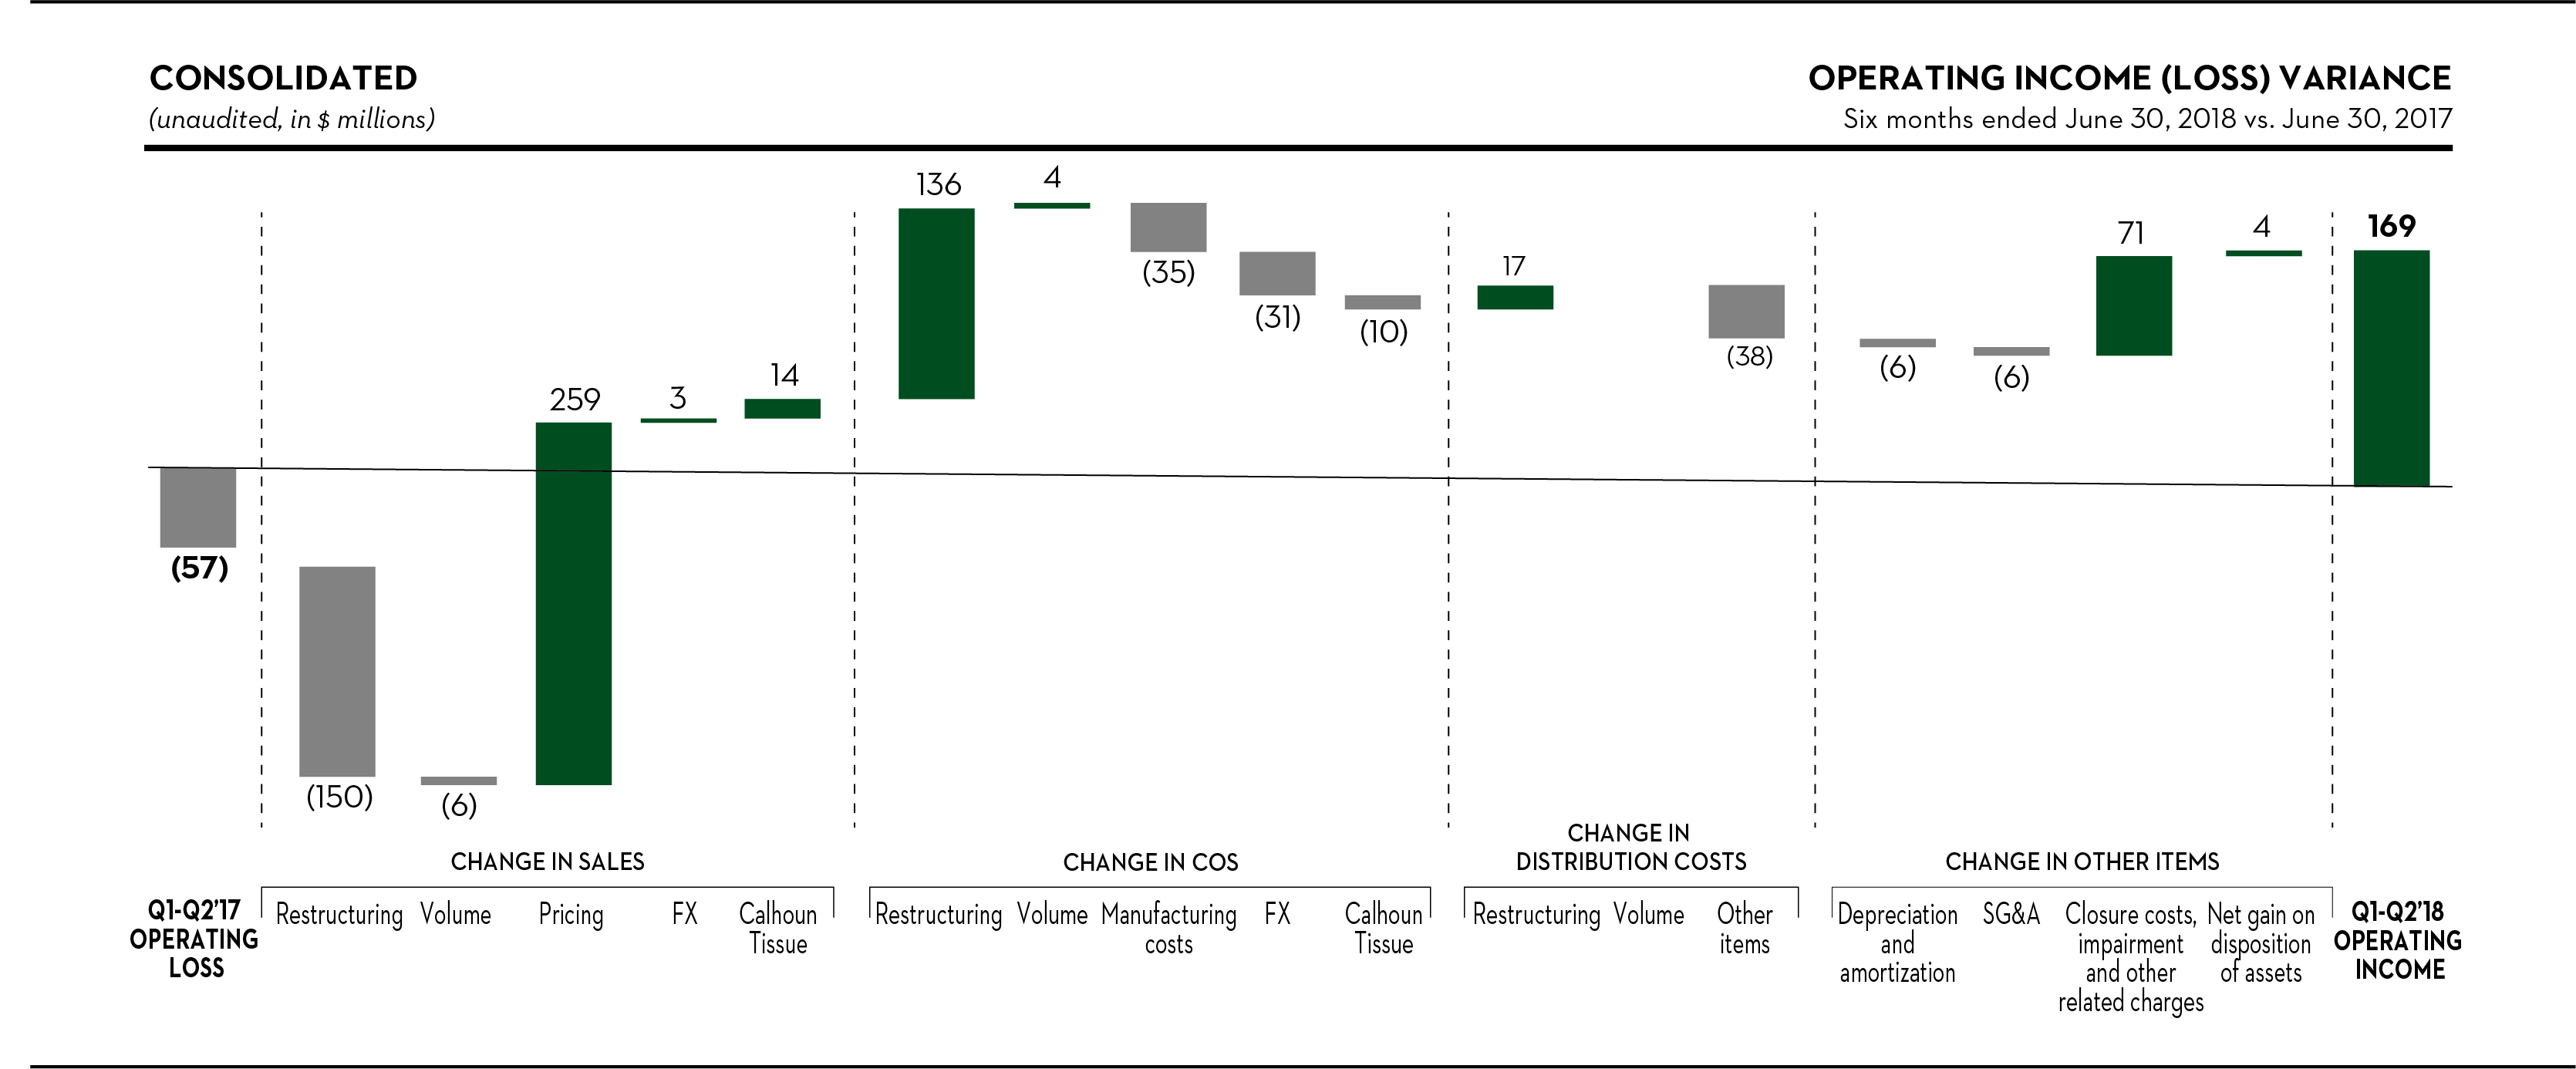
Sales
Sales rose by $120 million, or 7%, compared to the year-ago period, to $1,850 million. Including restructuring initiatives, sales volume had an unfavorable impact of $156 million, reflecting decreases of 159,000 short tons (144,000 metric tons) in shipments of specialty papers, and 92,000 metric tons in newsprint, as a result of the 2017 capacity reduction initiatives. Sales volumes in wood products also decreased, down 6%, partly due to shipping constraints in the first quarter of 2018, while market pulp shipments were up 4%. Pricing had a $259 million favorable impact on sales, improving across almost all segments. The average transaction price increased 33% for wood products, 19% for market pulp, 12% for newsprint, and 5% for specialty papers. The inclusion of our Calhoun tissue operations’ results in our tissue segment contributed to a $14 million increase in sales.
Cost of sales, excluding depreciation, amortization and distribution costs
COS was $64 million lower in the period. Restructuring initiatives reduced COS by $136 million, including the elimination of $42 million in fixed manufacturing costs. After removing the lower volume, the COS related to Calhoun’s tissue operations, and the effects of the Canadian dollar fluctuation and restructuring initiatives, manufacturing costs increased by $35 million, reflecting:
• | higher maintenance and labor costs ($27 million); |
• | unfavorable fiber costs ($18 million), mostly due to higher market-based stumpage fees and diesel fuel expense, both included in log cost, and recycled fiber prices; and |
• | unfavorable power and steam costs ($10 million), largely related to the unusually cold weather in the southern U.S. in the first quarter of 2018; |
partly offset by:
• | write-downs of mill stores and other supplies incurred in the year-ago period ($13 million), primarily as a result of the permanent closure of a paper machine in Catawba, and of our Mokpo paper mill; and |
• | lower wood chip prices ($8 million). |
36
Distribution costs
After removing the distribution costs related to Calhoun’s tissue operations and the effects of restructuring initiatives and the Canadian dollar fluctuation, distribution costs were $34 million greater in 2018, mainly due to higher truck and rail car rates, an increase in the average length of haul, and higher fuel surcharges.
Depreciation and amortization
Depreciation and amortization was $6 million greater in the first half of 2018, mainly explained by additional costs associated with the implementation of our integrated business management software, and an increase in amortization of costs associated with the Calhoun tissue manufacturing and converting facility.
Selling, general and administrative expenses
SG&A rose by $6 million this year when compared to last year, almost all attributable to higher variable compensation expense accruals as a result of the Company’s performance.
Closure costs, impairment and other related charges
See the corresponding variance analysis under “Corporate and Other” below.
Net income (loss) variance analysis
Non-operating pension and other postretirement benefit credits
We recorded non-operating pension and OPEB credits of $25 million in the first half of 2018, compared to $4 million in the prior year. The increase compared to 2017 is primarily due to higher expected return on plan assets, and lower amortization of actuarial losses for our U.S. pension plan, which became predominantly inactive at year-end in 2017, resulting in a longer amortization period.
Income taxes
We recorded an income tax provision of $78 million in the period, on income before income taxes of $160 million, compared to an expected income tax provision of $34 million based on the U.S. federal statutory income tax rate of 21%. The difference reflects state and foreign tax rate differences ($35 million), including a $25 million income tax provision attributable to the GILTI inclusion, and foreign exchange items ($14 million), offset by an $8 million valuation allowance reversal related to our U.S. operations where we recognize a valuation allowance against virtually all of our net deferred income tax assets.
In the first half of 2017, we recorded an income tax provision of $48 million, on a loss before income taxes of $71 million, compared to an expected income tax benefit of $15 million based on the U.S. federal statutory income tax rate of 21%. The difference reflects a $75 million valuation allowance, primarily related to our U.S. operations where we recognized a valuation allowance against all of our net deferred income tax assets, and a $12 million decrease to our deferred income tax assets due to the enactment, in 2017, of a lower foreign income tax rate, offset in part by state and foreign tax rate differences ($14 million), and the change in U.S. federal tax rate ($10 million).
Segment Earnings
We manage our business based on the products we manufacture. Accordingly, our reportable segments correspond to our principal product lines: market pulp, tissue, wood products, newsprint, and specialty papers.
We do not allocate any of the income or loss items following “operating income (loss)” in our Consolidated Statements of Operations to our segments because those items are reviewed separately by management. Similarly, we do not allocate to the segments: closure costs, impairment and other related charges; inventory write-downs related to closures; start-up costs; gains and losses on disposition of assets; as well as other discretionary charges or credits.
We allocate depreciation and amortization expense to our segments, although the related fixed assets and amortizable intangible assets are not allocated to segment assets. Additionally, all SG&A are allocated to our segments, with the exception of certain discretionary charges and credits, which we present under “corporate and other.”
37
MARKET PULP
Highlights
Three Months Ended June 30, | Six Months Ended June 30, | ||||||||||||||||
(Unaudited, in millions, except where otherwise stated) | 2018 | 2017 | 2018 | 2017 | |||||||||||||
Sales | $ | 264 | $ | 213 | $ | 521 | $ | 422 | |||||||||
Operating income (1) | 41 | 16 | 74 | 23 | |||||||||||||
EBITDA (2) | 49 | 24 | 89 | 39 | |||||||||||||
(In thousands of metric tons) | |||||||||||||||||
Shipments | 353 | 336 | 715 | 689 | |||||||||||||
Downtime | 22 | 36 | 28 | 47 | |||||||||||||
June 30, | ||||||||
(Unaudited, in thousands of metric tons) | 2018 | 2017 | ||||||
Finished goods inventory | 108 | 94 | ||||||
(1) | Net income including noncontrolling interests is equal to operating income in this segment. |
(2) | EBITDA, a non-GAAP financial measure, is reconciled below. For more information on the calculation and reasons we include this measure, see note 1 under “Results of Operations – Consolidated Results – Selected Financial Information” above. |
Three Months Ended June 30, | Six Months Ended June 30, | ||||||||||||||||
(Unaudited, in millions) | 2018 | 2017 | 2018 | 2017 | |||||||||||||
Net income including noncontrolling interests | $ | 41 | $ | 16 | $ | 74 | $ | 23 | |||||||||
Depreciation and amortization | 8 | 8 | 15 | 16 | |||||||||||||
EBITDA | 49 | 24 | 89 | 39 | |||||||||||||
Industry trends
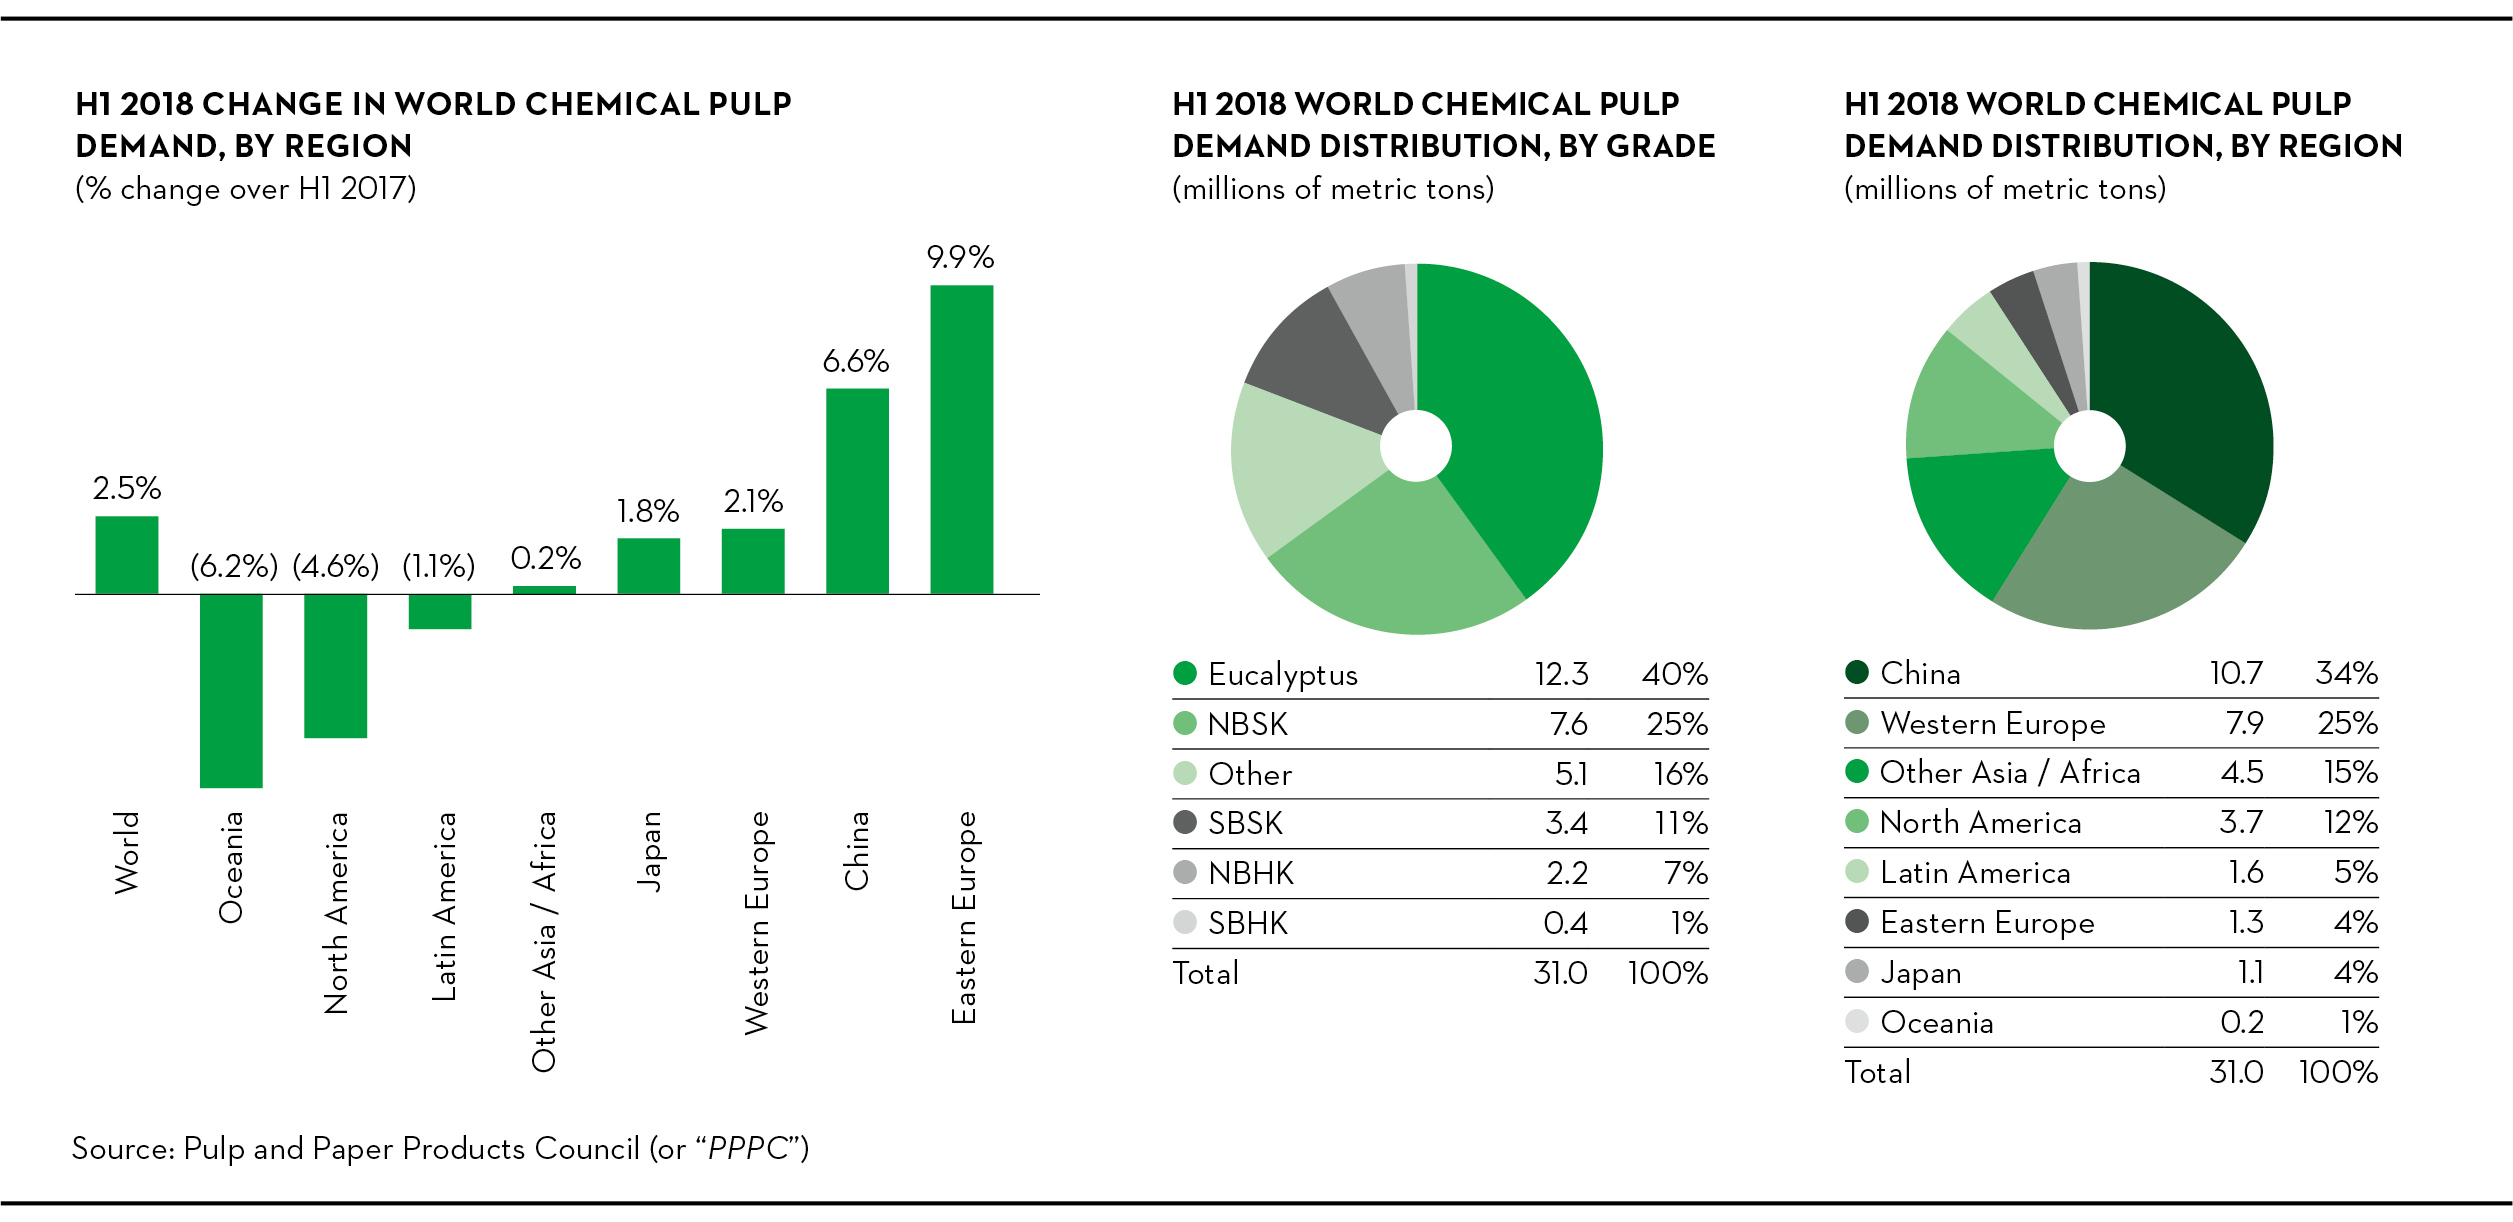
38
World demand for chemical pulp grew by 2.5% in the first half of the year compared to the year-ago period, including an increase of 6.6% in China, and 2.1% in Western Europe, partly offset by a decrease of 4.6% in North America. World capacity grew by 5.7% over the same period.
World demand for softwood pulp was relatively unchanged in the first half of the year compared to the year-ago period. This reflects an increase of 3.6% in shipments to China, partly offset by decreases of 4.1% and 0.7% to North America and Western Europe, respectively. The operating rate was 91%, a decrease of 3% from the year-ago period.
In the same period, demand for hardwood pulp was up by 4.1%, with shipments to China and Western Europe up by 8.5% and 3.9%, respectively, while North America was down by 5.2%. The operating rate was 87%, a decrease of 3% from the year-ago period.
39
Three months ended June 30, 2018 vs. June 30, 2017
Operating income variance analysis
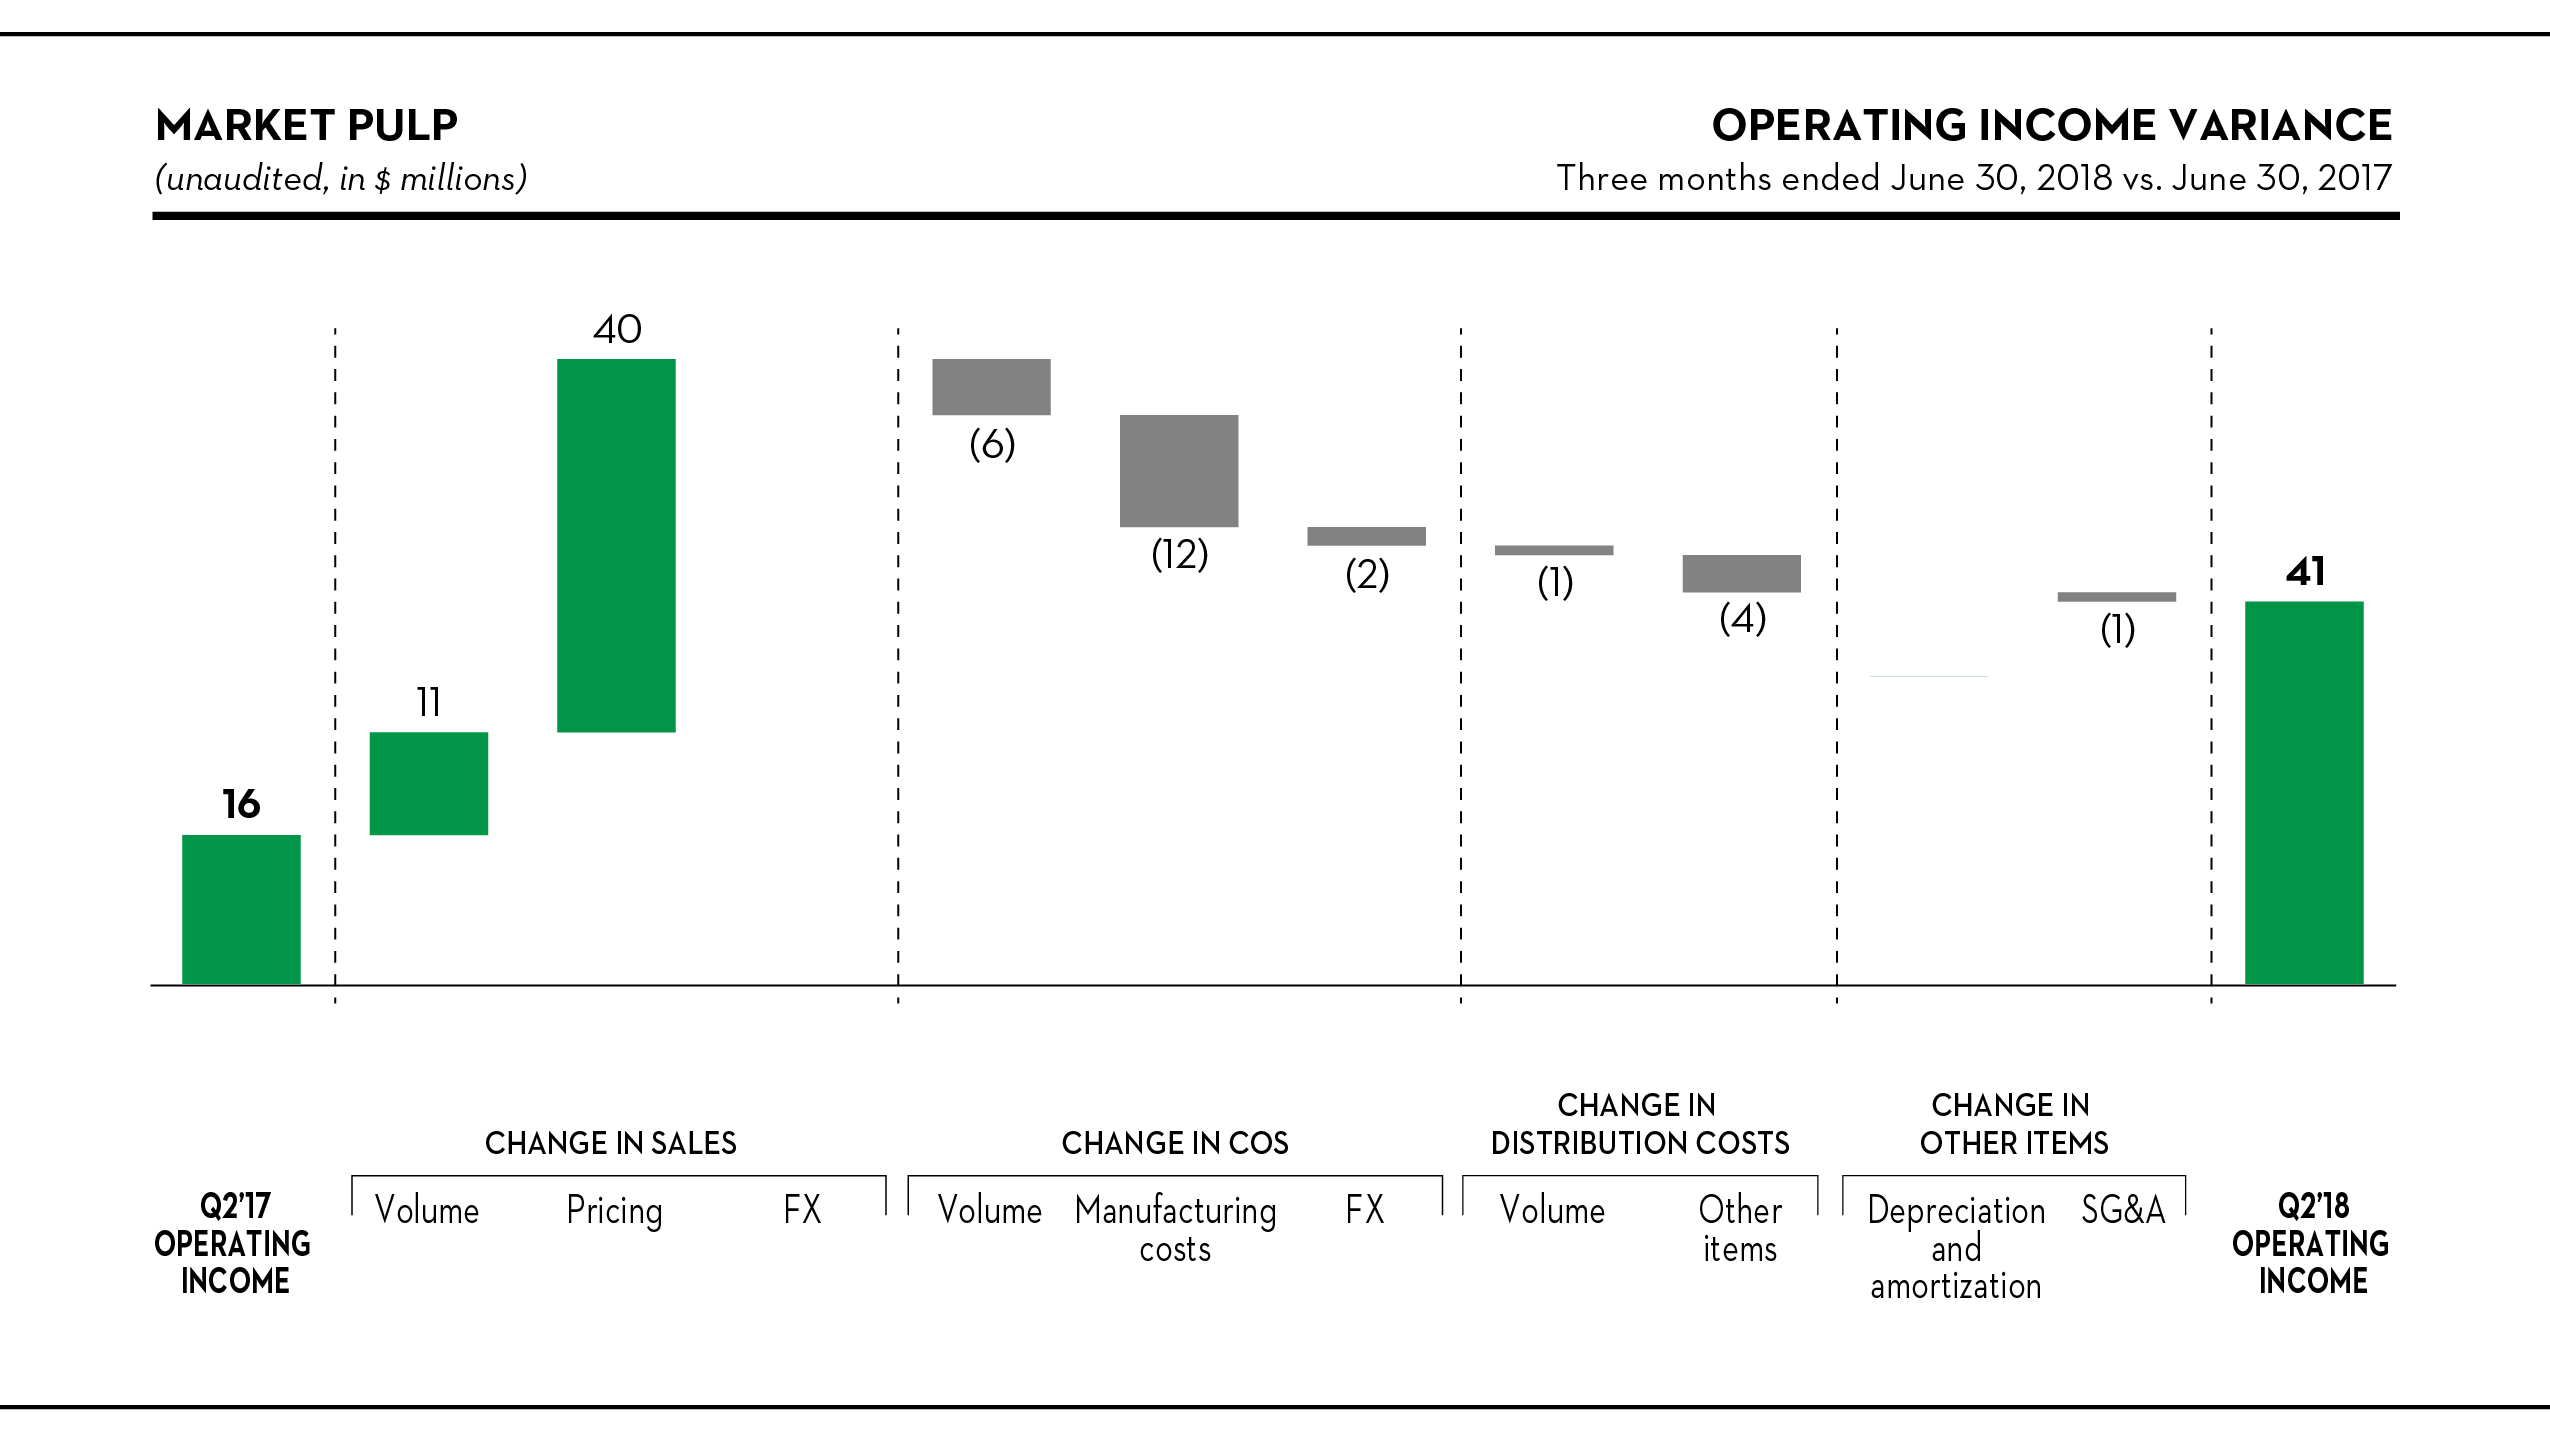
Sales
Sales were $51 million higher, or 24%, to $264 million in the quarter. The increase in the average transaction price of $115 per metric ton reflects higher market prices across all grades. Shipments were higher by 17,000 metric tons as a result of improved productivity, in part due to the timing of scheduled outages, and favorable recycled bleached kraft (or “RBK”) market conditions, partly offset by a planned inventory buildup at Saint-Félicien, ahead of an extended outage required for the mill’s strategic investment plan discussed further below.
Cost of sales, excluding depreciation, amortization and distribution costs
Manufacturing costs increased by $12 million after adjusting for the effects of higher volume and the Canadian dollar fluctuation, reflecting higher maintenance and related labor costs ($8 million), and an increase in recycled fiber prices ($4 million), partly offset by lower wood chip prices ($3 million).
Distribution costs
After removing the effect of higher volume, distribution costs were $4 million greater in the quarter, mostly due to higher truck rates, an increase in the average length of haul, and higher fuel surcharges.
40
Six months ended June 30, 2018 vs. June 30, 2017
Operating income variance analysis
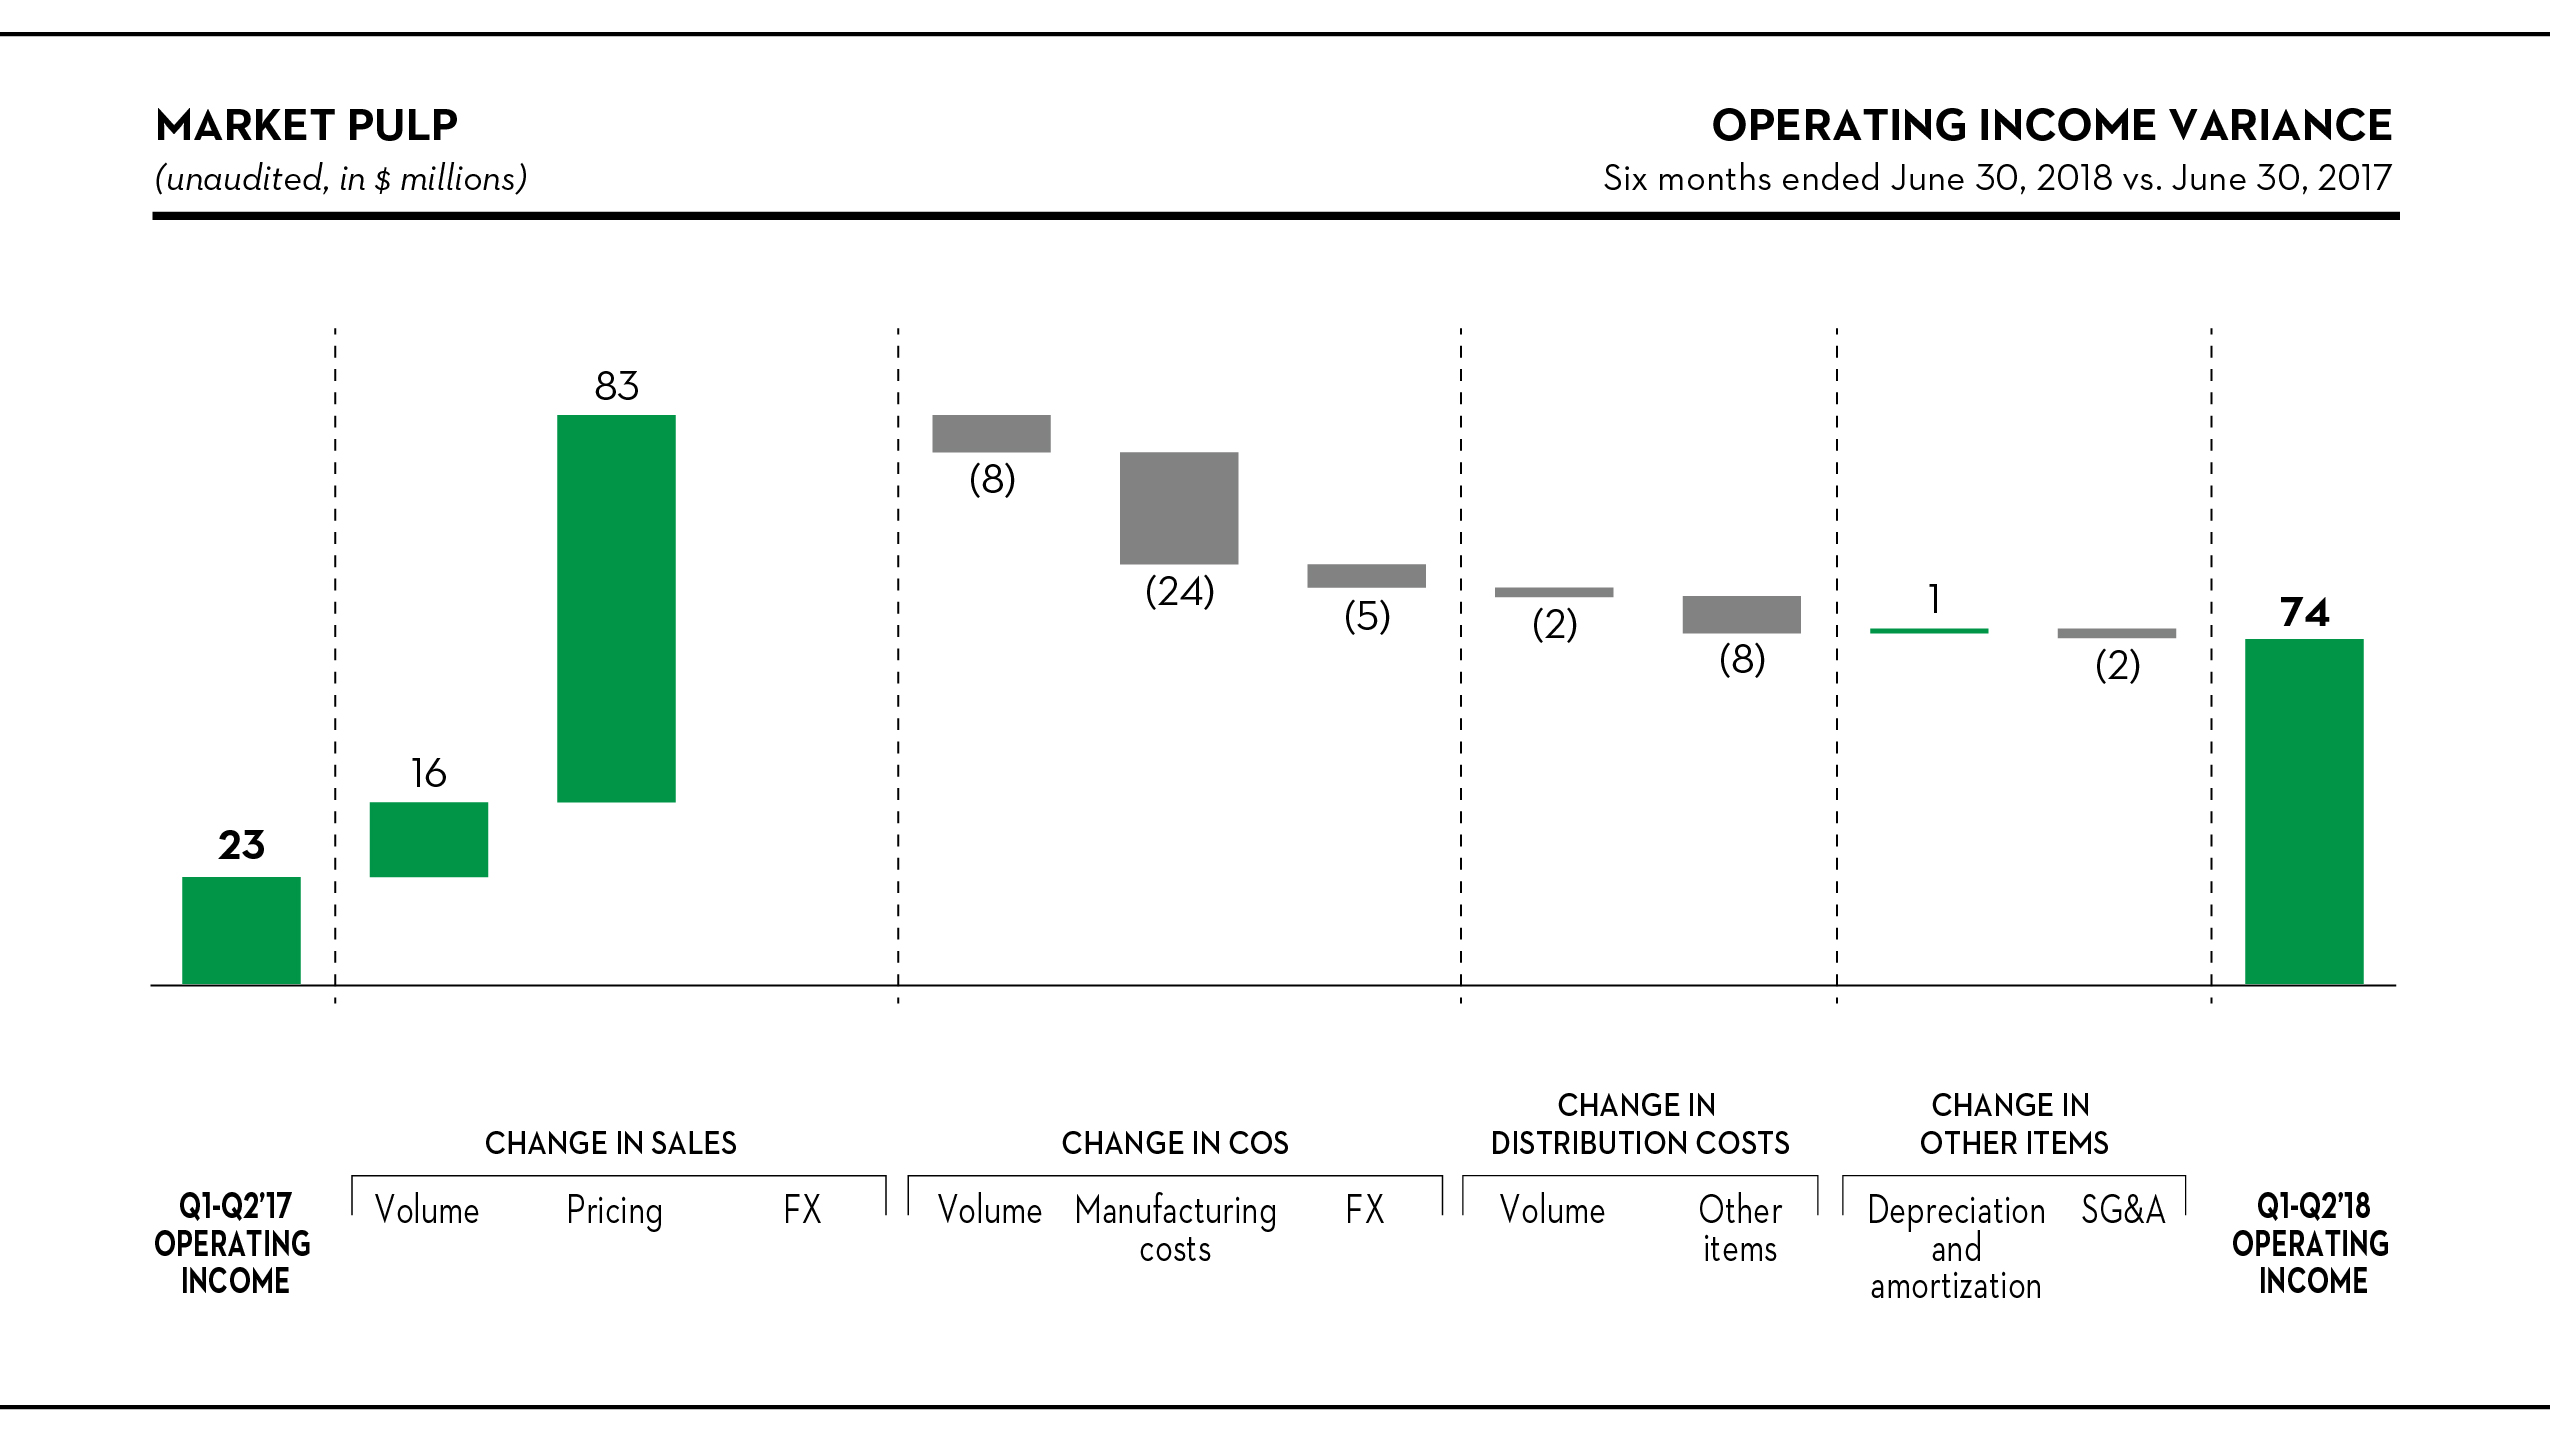
Sales
Sales were $99 million greater, or 23%, to $521 million, in the first half of the year. The average transaction price rose by $116 per metric ton, reflecting higher market prices across all grades. Shipments increased by 26,000 metric tons as a result of improved productivity, in part due to the timing of a scheduled outage at Coosa Pines (Alabama), and higher shipments of RBK as a result of favorable market conditions, partly offset by a planned inventory buildup at Saint-Félicien, ahead of an extended outage required for the mill’s strategic investment plan further discussed below.
Cost of sales, excluding depreciation, amortization and distribution costs
Manufacturing costs increased by $24 million after adjusting for the effects of higher volume and the Canadian dollar fluctuation, reflecting:
• | higher maintenance and labor costs ($14 million); |
• | unfavorable fiber costs ($6 million), mainly related to higher recycled fiber prices; |
• | higher chemical costs ($3 million); and |
• | unfavorable steam costs ($3 million), mostly due to higher natural gas prices; |
partly offset by lower wood chip prices ($5 million).
Distribution costs
After removing the effect of higher volume, distribution costs rose by $8 million in the current year, reflecting higher truck rates, an increase in the average length of haul, and higher fuel surcharges.
Saint-Félicien pulp mill strategic investment plan
During the second quarter of 2018, we announced a strategic investment plan for our Saint-Félicien pulp mill, which is expected to improve costs, increase the average daily production capacity by 76 metric tons and reduce greenhouse gas emissions from the use of fossil fuels by 20%. The upgrades are expected to be completed by the end of 2019.
41
TISSUE
Highlights
Three Months Ended June 30, | Six Months Ended June 30, | ||||||||||||||||
(Unaudited, in millions, except where otherwise stated) | 2018 | 2017 | 2018 | 2017 | |||||||||||||
Sales | $ | 35 | $ | 20 | $ | 57 | $ | 40 | |||||||||
Operating loss (1) | (10 | ) | (1 | ) | (11 | ) | (1 | ) | |||||||||
EBITDA (2) | (5 | ) | — | (5 | ) | 1 | |||||||||||
(In thousands of short tons) | |||||||||||||||||
Shipments (3) (4) | 23 | 13 | 38 | 26 | |||||||||||||
Downtime | 1 | — | 1 | — | |||||||||||||
June 30, | ||||||||
(Unaudited, in thousands of short tons) | 2018 | 2017 | ||||||
Finished goods inventory (3) | 8 | 8 | ||||||
(1) | Net loss including noncontrolling interests is equal to operating loss in this segment. |
(2) | EBITDA, a non-GAAP financial measure, is reconciled below. For more information on the calculation and reasons we include this measure, see note 1 under “Results of Operations – Consolidated Results – Selected Financial Information” above. |
(3) | Tissue converted products, which are measured in cases, are converted to short tons. |
(4) | The conversion ratio to short tons for tissue converted products was revised in the fourth quarter of 2017. Prior period data has been adjusted for comparative purposes. |
Three Months Ended June 30, | Six Months Ended June 30, | ||||||||||||||||
(Unaudited, in millions) | 2018 | 2017 | 2018 | 2017 | |||||||||||||
Net loss including noncontrolling interests | $ | (10 | ) | $ | (1 | ) | $ | (11 | ) | $ | (1 | ) | |||||
Depreciation and amortization | 5 | 1 | 6 | 2 | |||||||||||||
EBITDA | (5 | ) | — | (5 | ) | 1 | |||||||||||
The operating results of our Calhoun tissue operations, previously recorded under “corporate and other,” have been recorded in our tissue segment since April 1, 2018.
42
Industry trends
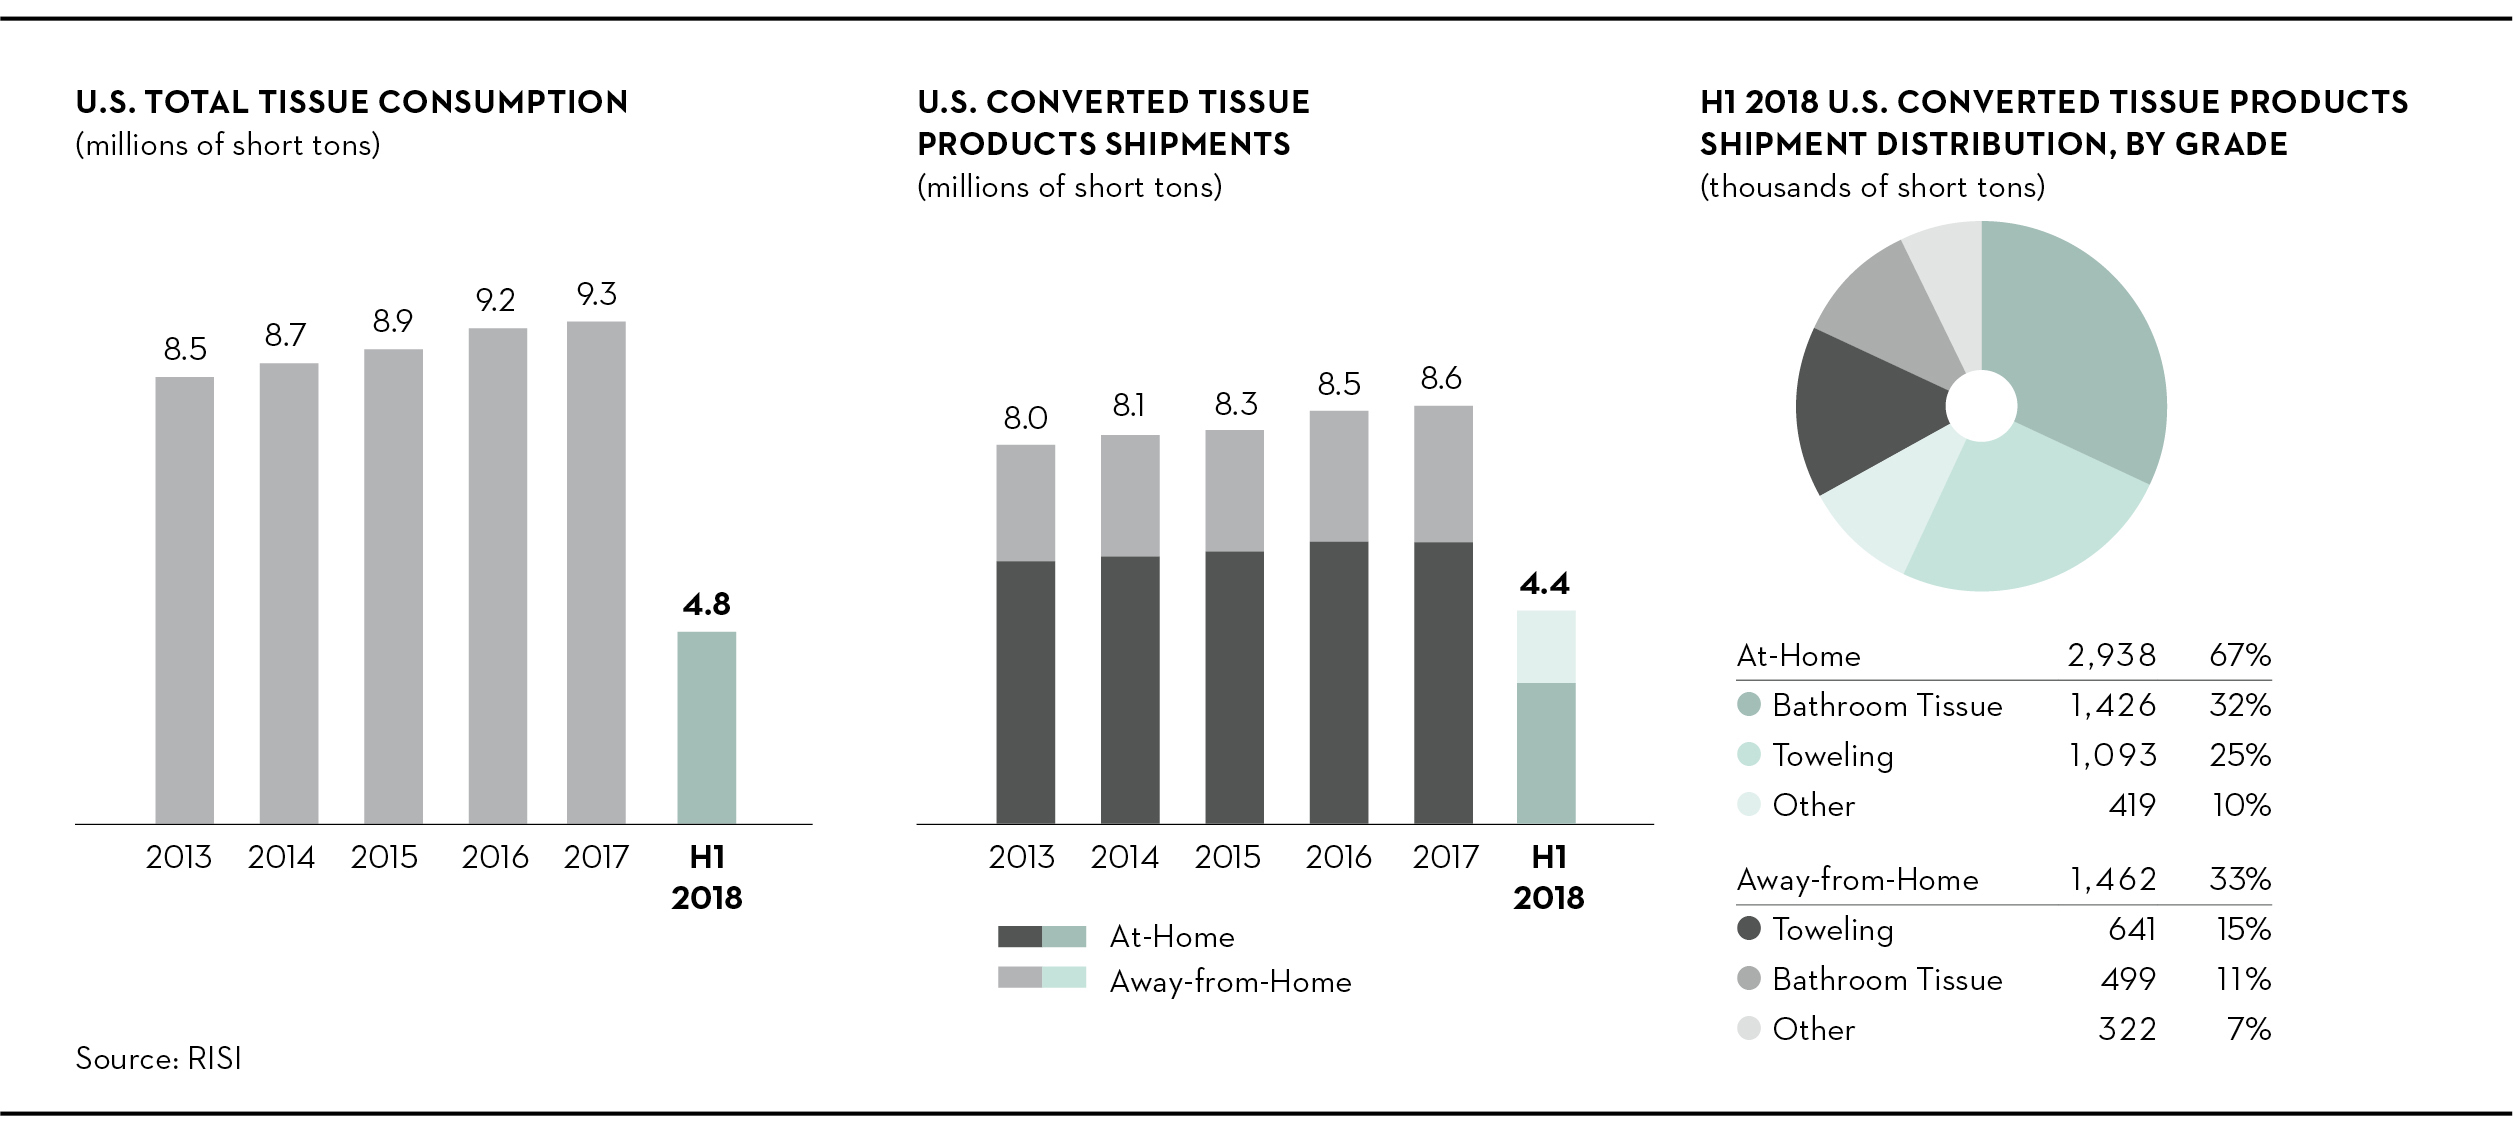
In the first half of the year, total tissue consumption in the U.S. grew by 2.0% compared to the same period last year. U.S. converted tissue products shipments also increased by 2.0%, as a result of an increase in away-from-home shipments, up by 3.0%, and at-home shipments, up by 1.5%. U.S. parent roll production showed a growth of 1.8% from the year-ago period. Tissue capacity also increased by 1.6%, contributing to a 94% average industry operating rate, largely unchanged from the year-ago period.
43
Three months ended June 30, 2018 vs. June 30, 2017
Operating loss variance analysis
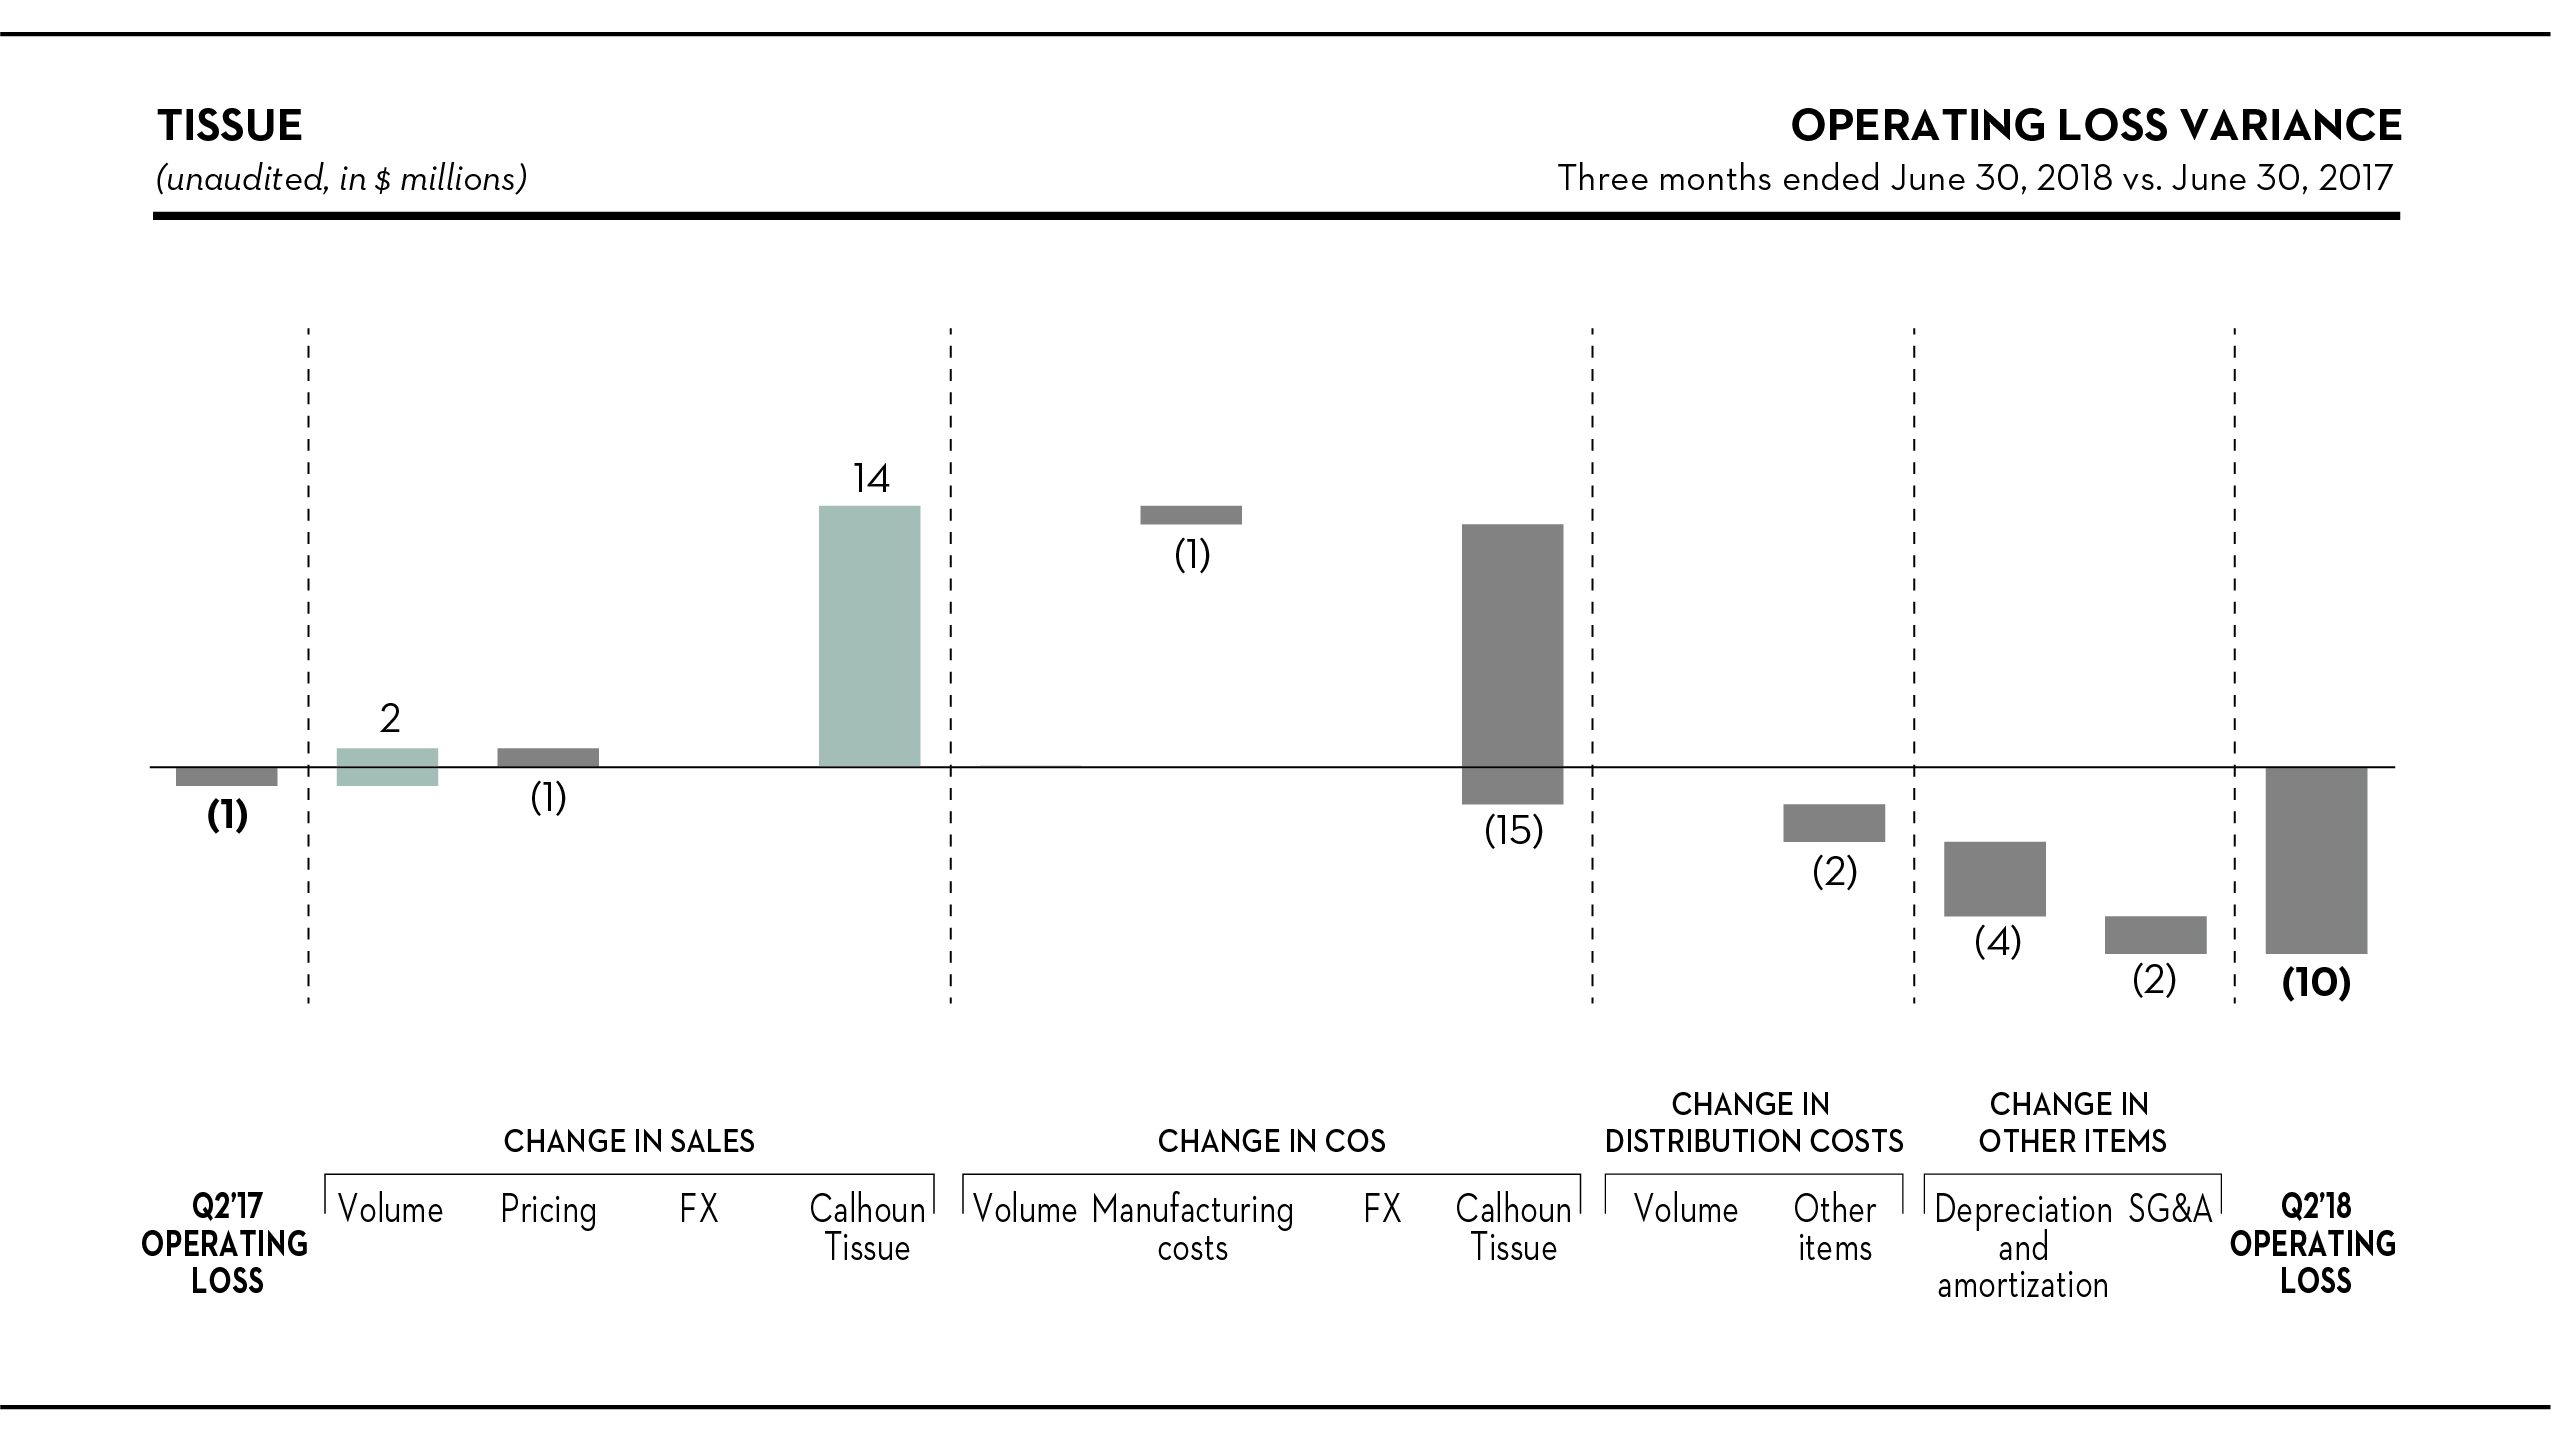
Sales
Sales were $15 million higher, or 75%, to $35 million in the quarter, reflecting an increase in shipments of 10,000 short tons (9,000 metric tons), attributable to the first time inclusion of Calhoun’s results in our tissue segment. The average transaction price also increased, up $10 per short ton, as a result of favorable product mix.
Cost of sales, excluding depreciation, amortization and distribution costs
COS increased by $16 million in the second quarter of 2018, almost entirely related to Calhoun’s operations.
Depreciation and amortization
Depreciation and amortization was $4 million higher in the current quarter, all attributable to the inclusion of Calhoun’s results in our tissue segment.
44
Six months ended June 30, 2018 vs. June 30, 2017
Operating loss variance analysis
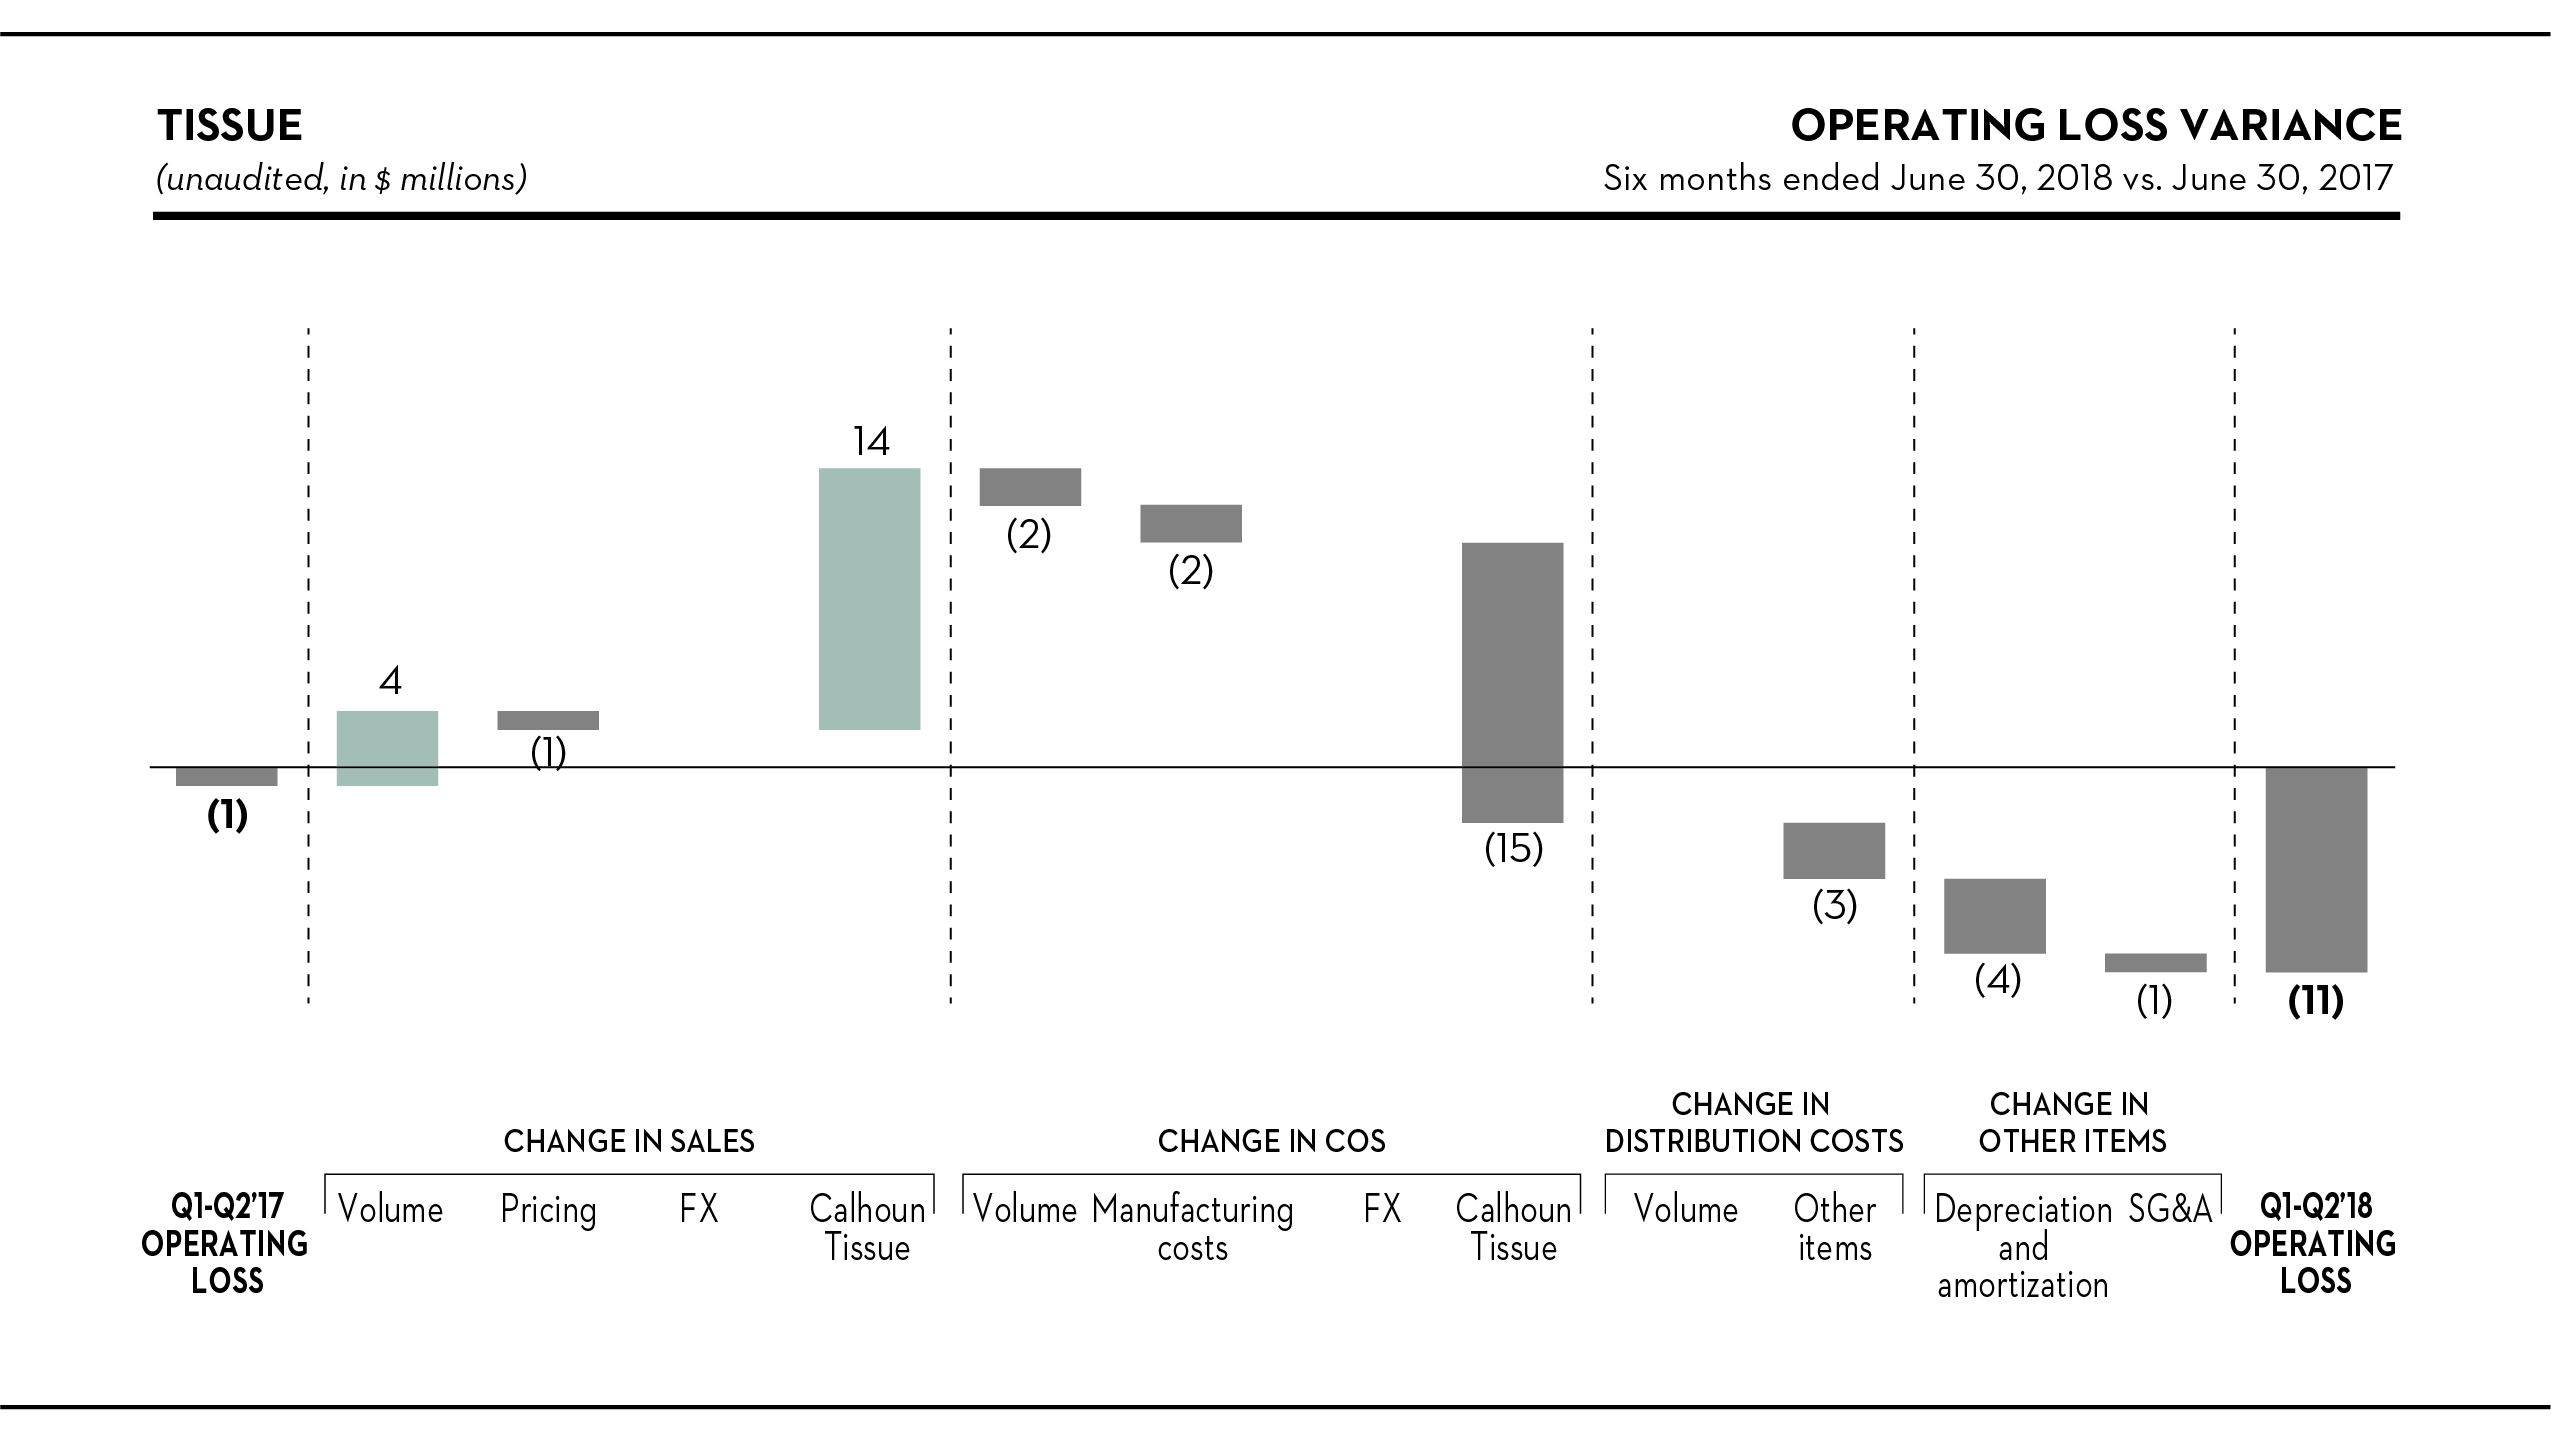
Sales
Sales were $17 million greater, or 43%, to $57 million in the first half of the year, reflecting an increase in shipments of 12,000 short tons (11,000 metric tons), mainly attributable to the inclusion of Calhoun’s results in our tissue segment.
Cost of sales, excluding depreciation, amortization and distribution costs
After removing the effects of the higher volume and the COS related to Calhoun’s operations, our manufacturing costs increased by $2 million in the period, mainly due to higher maintenance costs ($1 million) resulting from the timing of annual outages.
Depreciation and amortization
Depreciation and amortization was $4 million higher this year, all attributable to the inclusion of Calhoun’s results in our tissue segment.
45
WOOD PRODUCTS
Highlights
Three Months Ended June 30, | Six Months Ended June 30, | ||||||||||||||||
(Unaudited, in millions, except where otherwise stated) | 2018 | 2017 | 2018 | 2017 | |||||||||||||
Sales | $ | 254 | $ | 197 | $ | 463 | $ | 374 | |||||||||
Operating income (1) | 79 | 45 | 132 | 65 | |||||||||||||
EBITDA (2) | 86 | 52 | 147 | 81 | |||||||||||||
(In millions board feet) | |||||||||||||||||
Shipments (3) | 494 | 509 | 949 | 1,014 | |||||||||||||
Downtime | 26 | 39 | 49 | 80 | |||||||||||||
June 30, | ||||||||
(Unaudited, in millions board feet) | 2018 | 2017 | ||||||
Finished goods inventory (3) | 128 | 125 | ||||||
(1) | Net income including noncontrolling interests is equal to operating income in this segment. |
(2) | EBITDA, a non-GAAP financial measure, is reconciled below. For more information on the calculation and reasons we include this measure, see note 1 under “Results of Operations – Consolidated Results – Selected Financial Information” above. |
(3) | Includes wood pellets measured by mass, converted to board feet using a density-based conversion ratio. |
Three Months Ended June 30, | Six Months Ended June 30, | ||||||||||||||||
(Unaudited, in millions) | 2018 | 2017 | 2018 | 2017 | |||||||||||||
Net income including noncontrolling interests | $ | 79 | $ | 45 | $ | 132 | $ | 65 | |||||||||
Depreciation and amortization | 7 | 7 | 15 | 16 | |||||||||||||
EBITDA | 86 | 52 | 147 | 81 | |||||||||||||
Industry trends
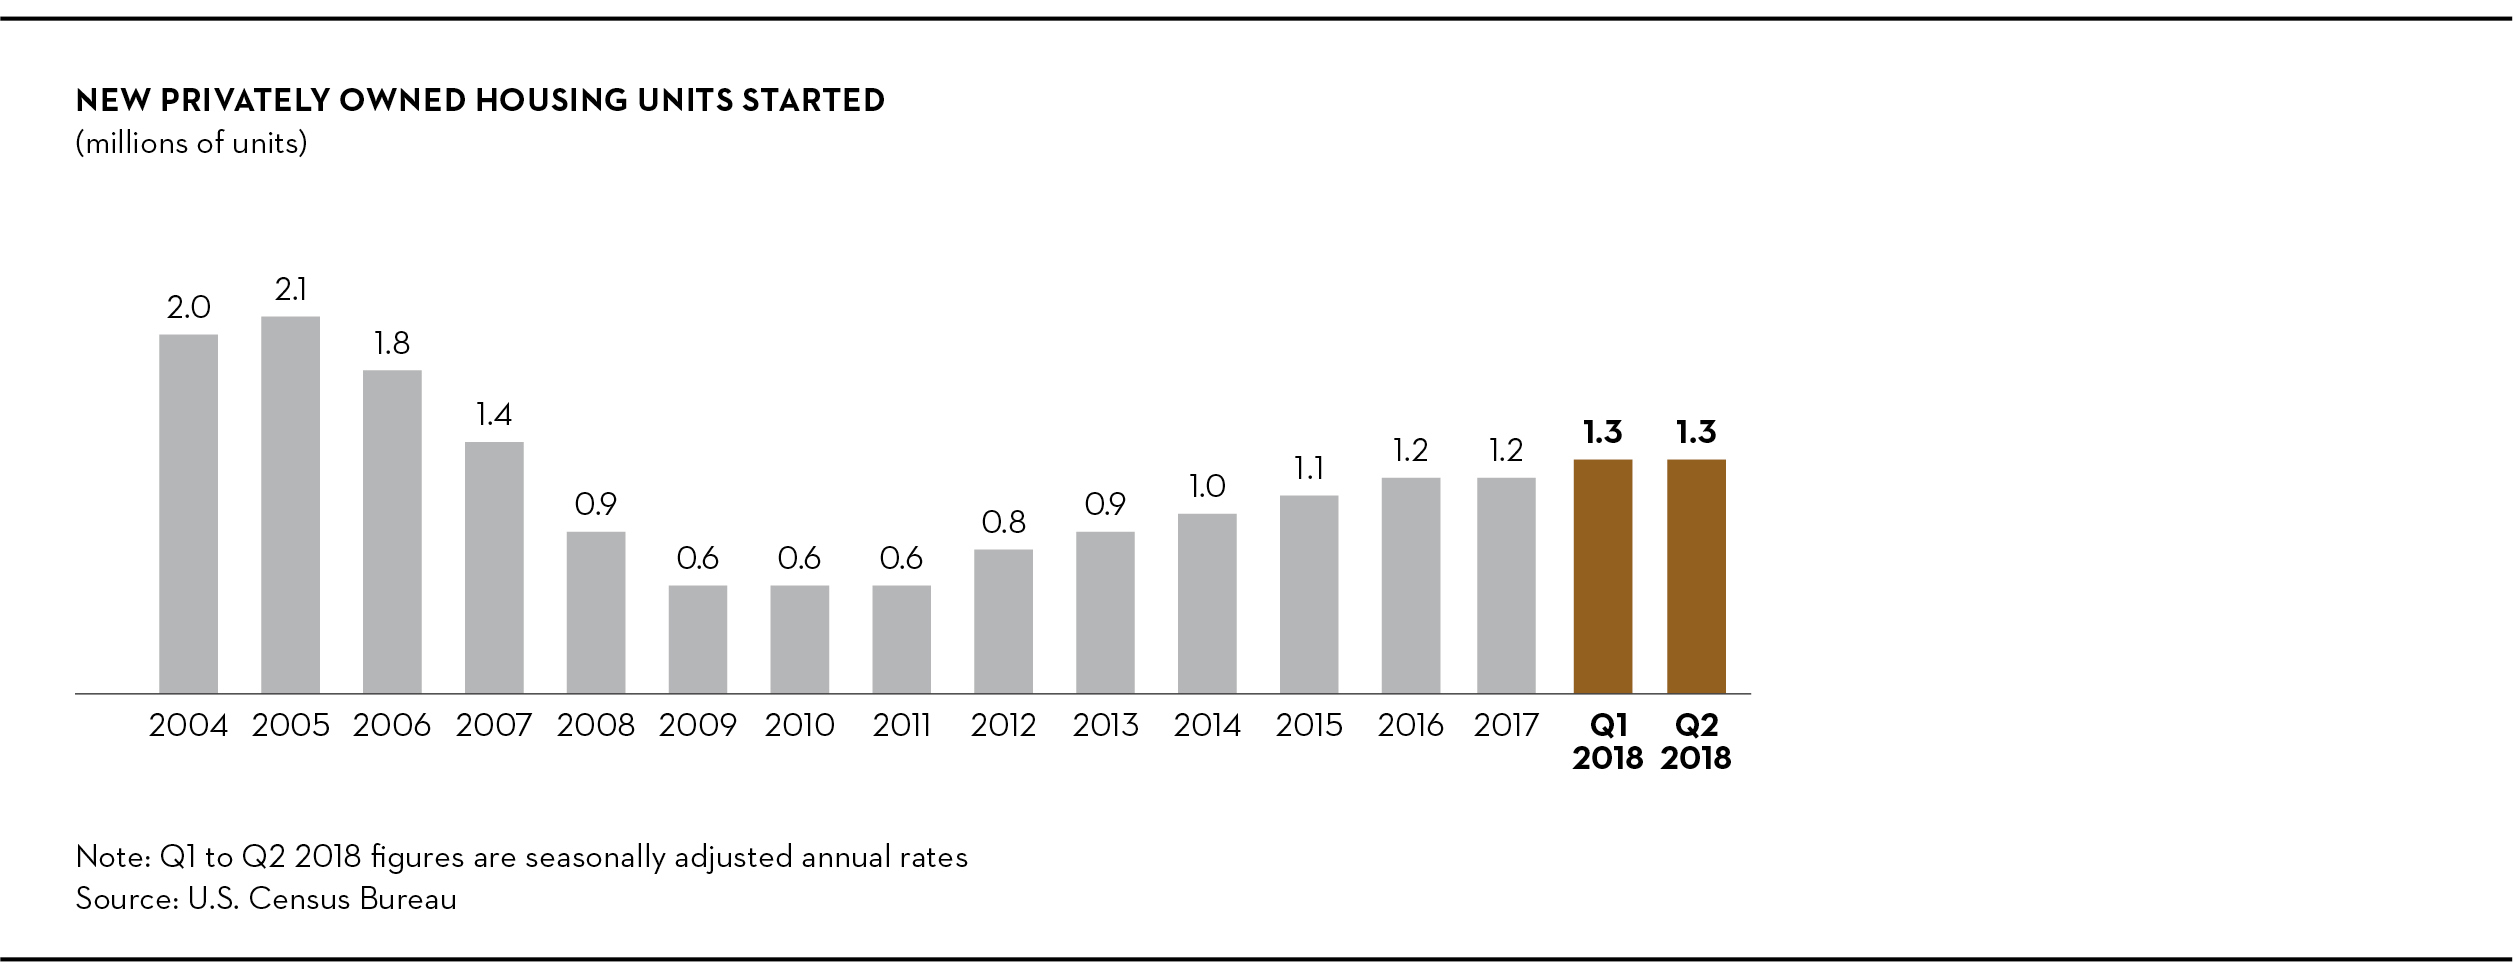
Average U.S. housing starts were 1.3 million on a seasonally-adjusted basis in the first half of 2018, up 7.4% from the same period last year. Single-family starts, which consume larger lumber volumes per start, rose by 7.6%, while multi-family starts increased by 6.2%.
46
Three months ended June 30, 2018 vs. June 30, 2017
Operating income variance analysis
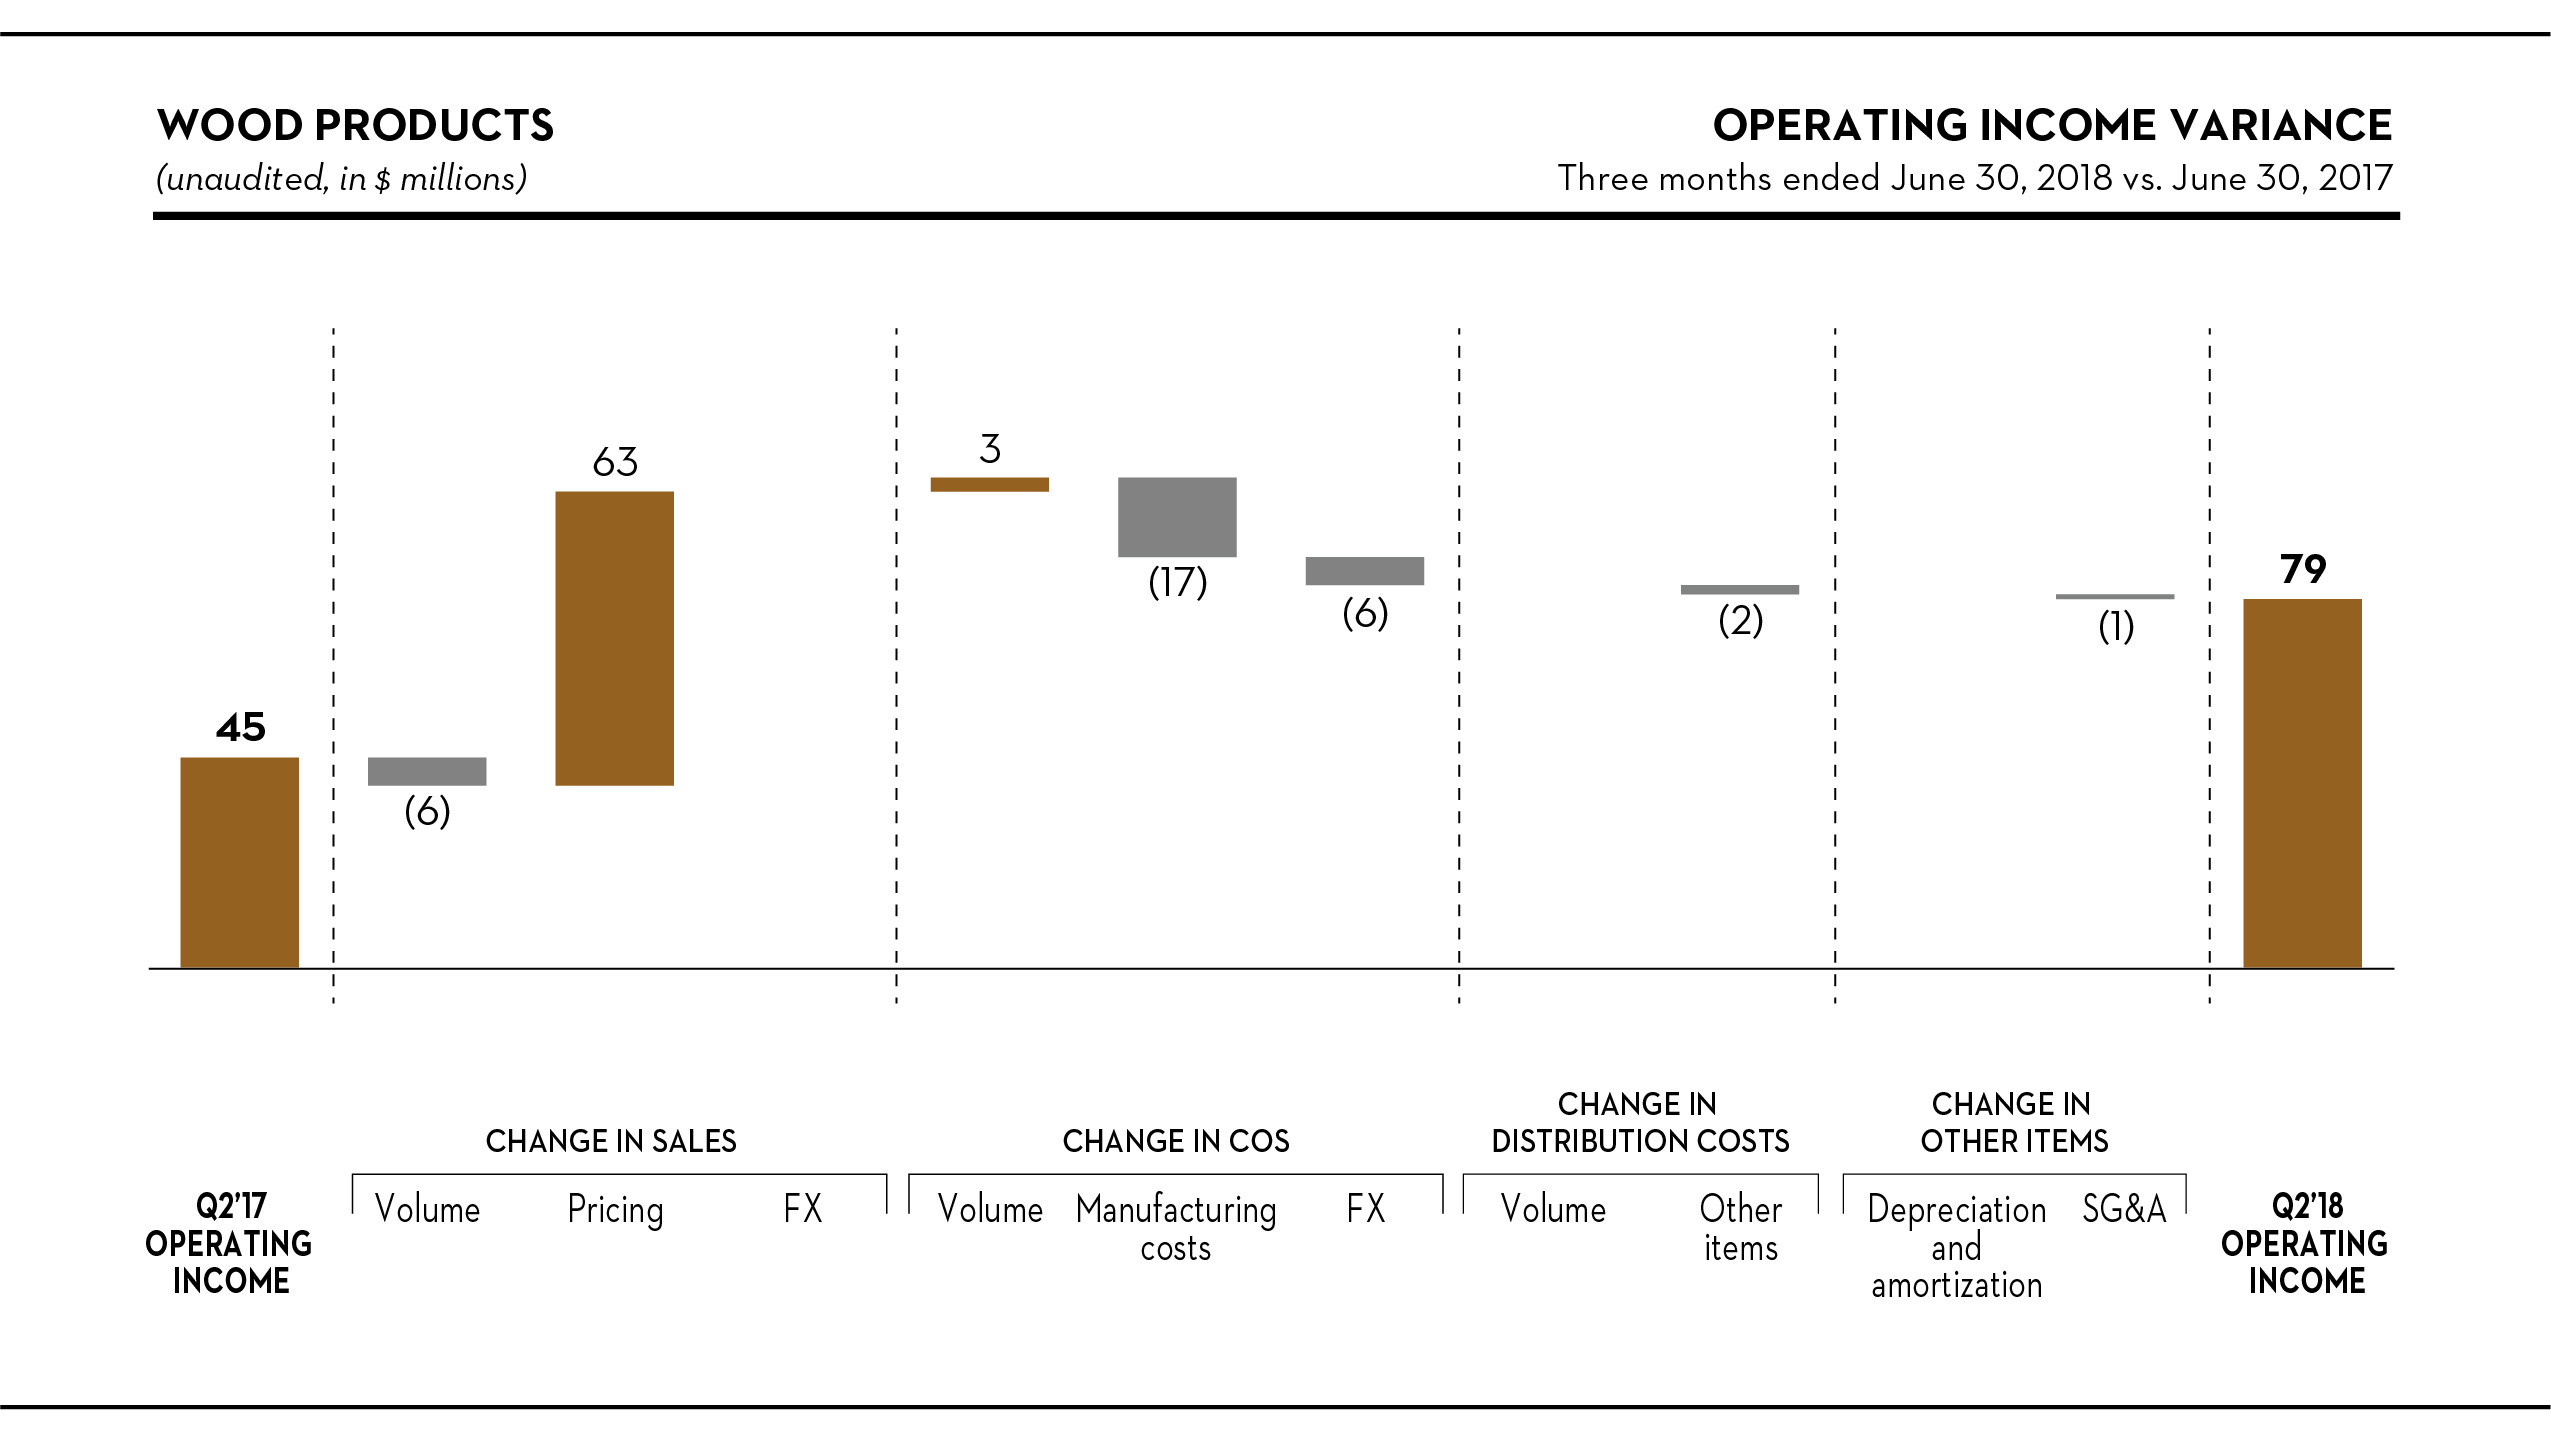
Sales
Sales were $57 million greater, or 29%, to $254 million in the quarter. The average transaction price increased by $128 per thousand board feet, or 33%, while shipments decreased by 15 million board feet, reflecting higher volumes from Western producers in North America following shipping constraints in the first quarter of 2018.
Cost of sales, excluding depreciation, amortization and distribution costs
After adjusting for the effects of the Canadian dollar fluctuation and lower volume, manufacturing costs increased by $17 million, reflecting:
• | higher fiber costs ($8 million), including higher market-based stumpage fees and diesel fuel expense; |
• | lower internal wood chip selling prices ($5 million); and |
• | unfavorable maintenance and labor costs ($3 million). |
47
Six months ended June 30, 2018 vs. June 30, 2017
Operating income variance analysis
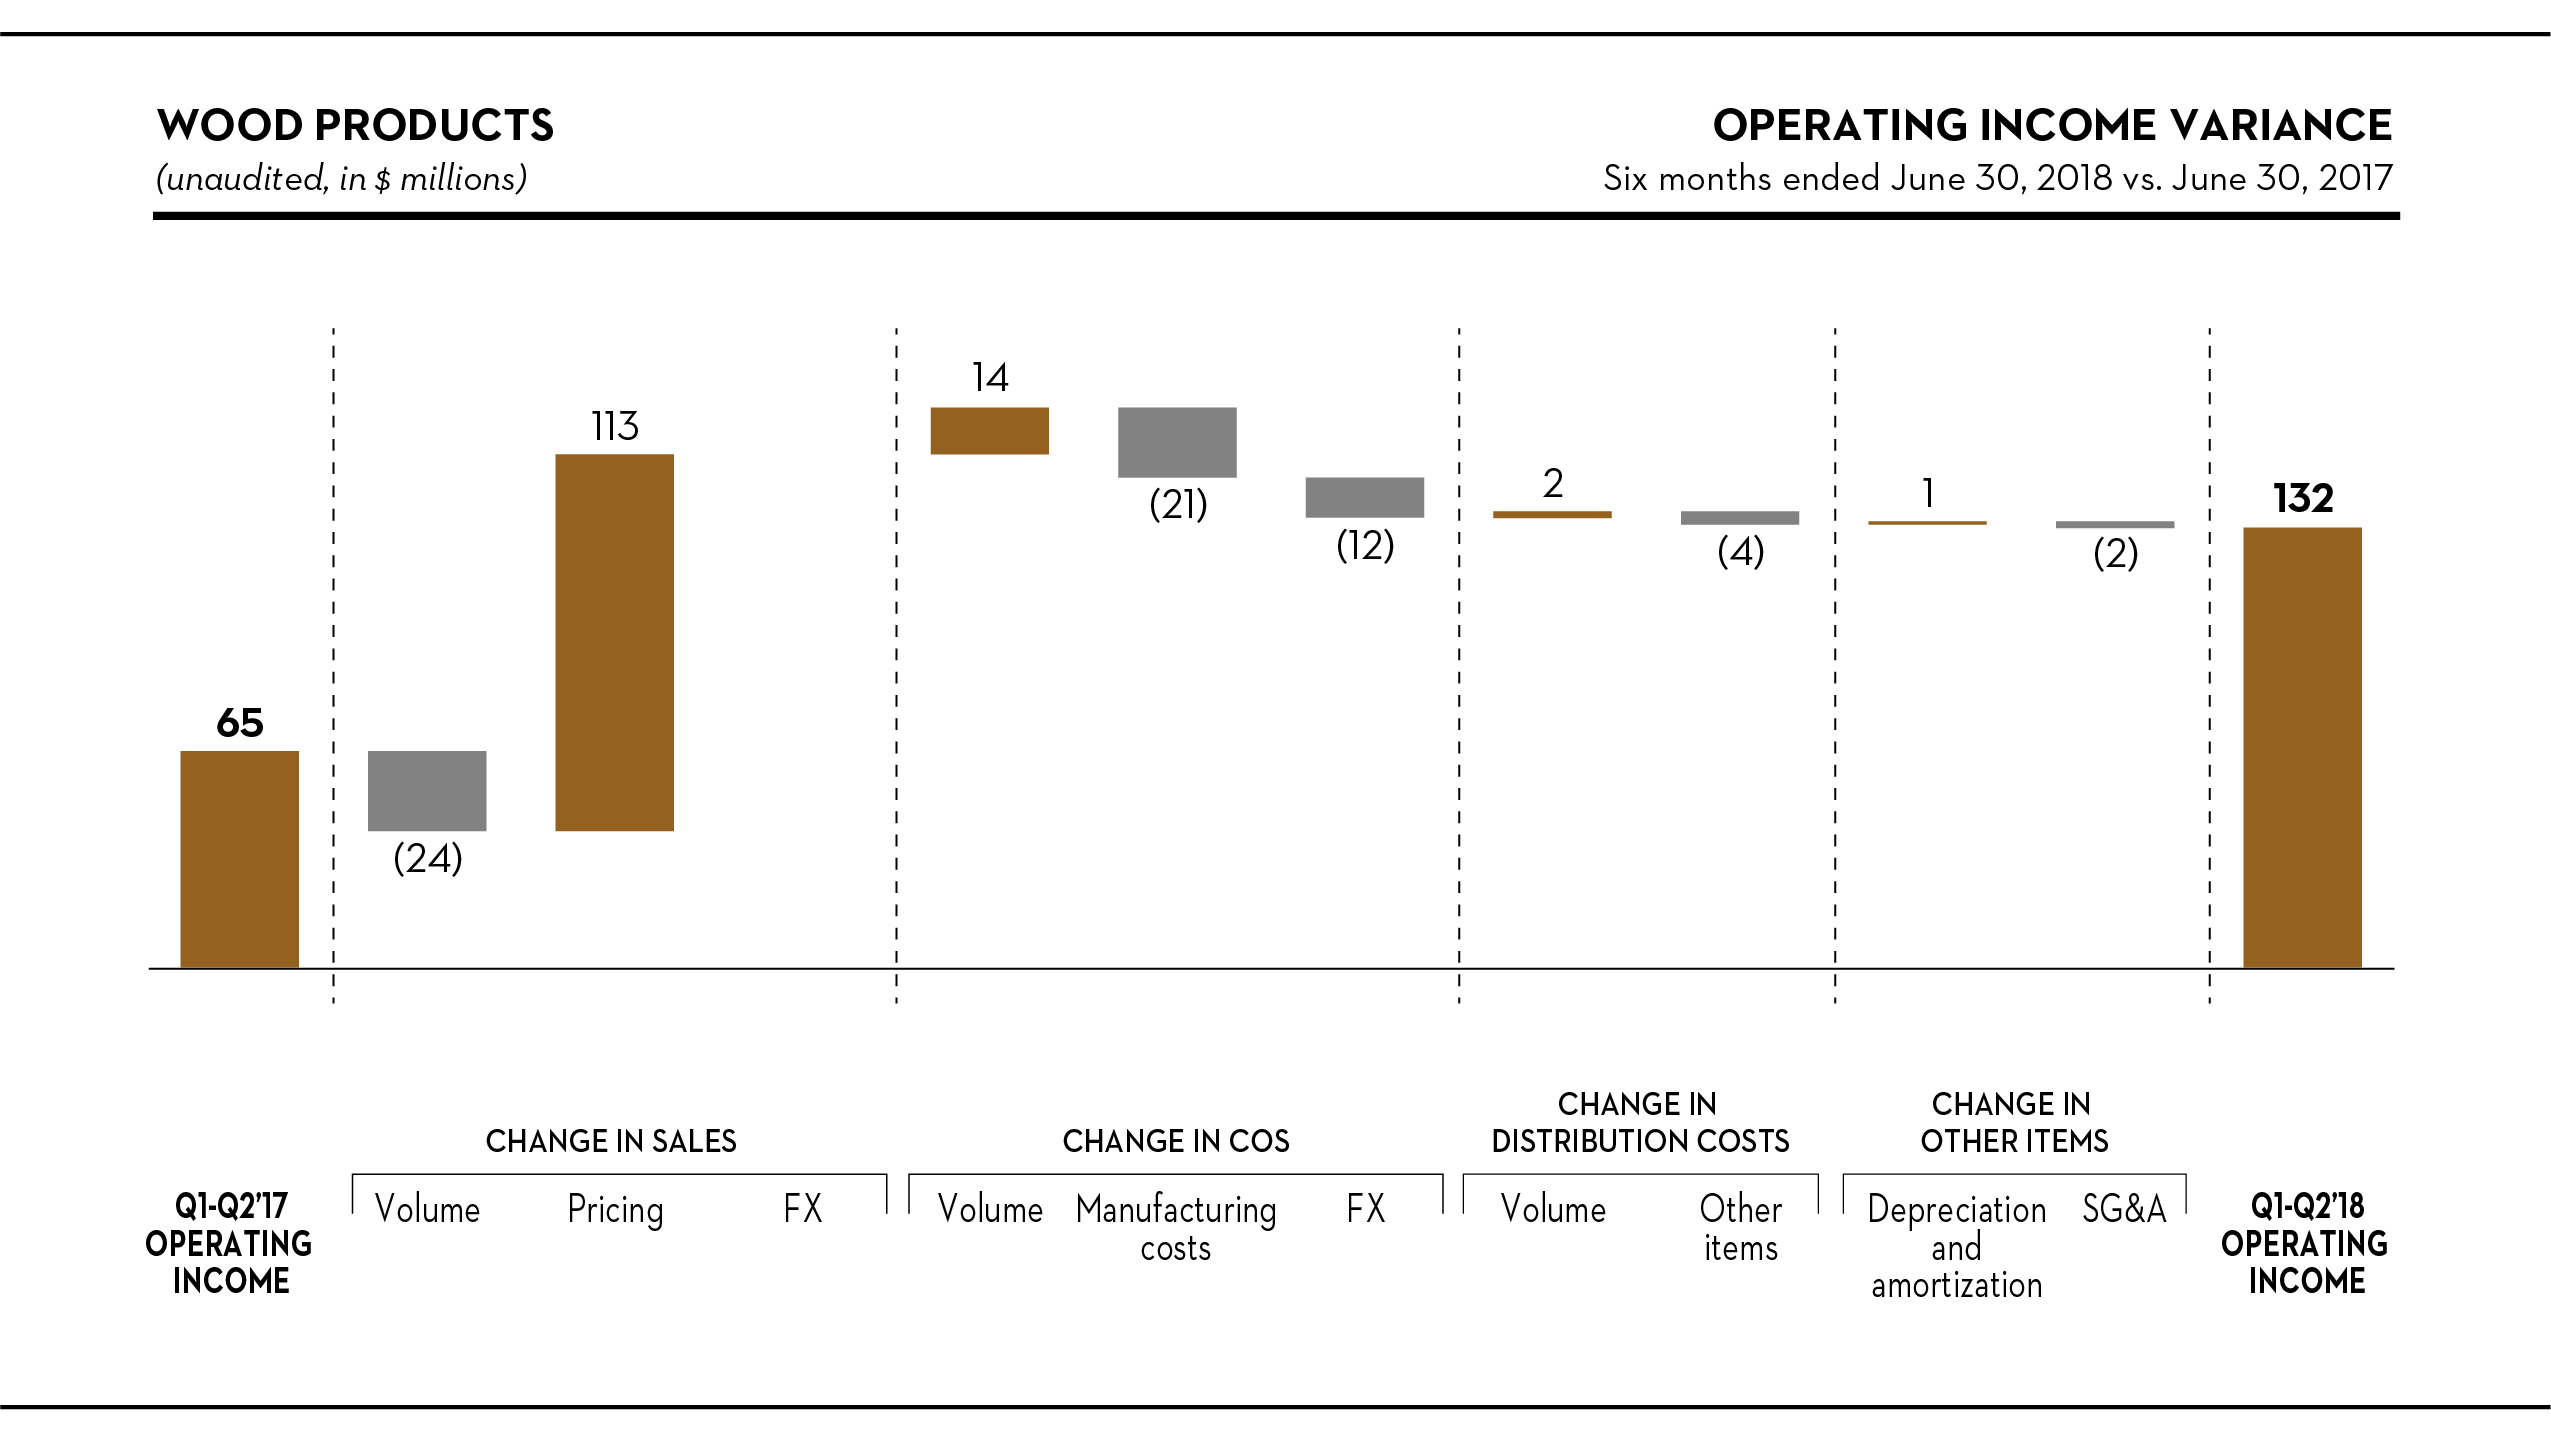
Sales
Sales were $89 million higher, or 24%, to $463 million in the first half of the year. The average transaction price rose by $120 per thousand board feet, or 33%, largely due to supply constraints, low inventories, and the imposition of trade barriers in the U.S. Shipments, however, were lower by 65 million board feet, reflecting the sale of our Saint-Hilarion (Quebec) sawmill in the third quarter of 2017, the consolidation of our two sawmills in Senneterre (Quebec) in the third quarter of 2017, and lower productivity.
Cost of sales, excluding depreciation, amortization and distribution costs
After adjusting for the effects of the Canadian dollar fluctuation and lower volume, manufacturing costs increased by $21 million, reflecting:
• | higher fiber costs ($10 million), including higher market-based stumpage fees, transportation costs and diesel fuel expense; |
• | lower internal wood chip selling prices ($7 million); and |
• | unfavorable maintenance and labor costs ($3 million). |
Distribution costs
After removing the effect of lower volume, distribution costs increased by $4 million in the current year, mostly reflecting higher rail car rates and an increase in cross-border sales.
48
NEWSPRINT
Highlights
Three Months Ended June 30, | Six Months Ended June 30, | ||||||||||||||||
(Unaudited, in millions, except where otherwise stated) | 2018 | 2017 | 2018 | 2017 | |||||||||||||
Sales | $ | 230 | $ | 201 | $ | 428 | $ | 427 | |||||||||
Operating income (loss) (1) | 18 | (7 | ) | 14 | (11 | ) | |||||||||||
EBITDA (2) | 35 | 10 | 47 | 22 | |||||||||||||
(In thousands of metric tons) | |||||||||||||||||
Shipments | 393 | 397 | 748 | 840 | |||||||||||||
Downtime | 6 | 17 | 14 | 17 | |||||||||||||
June 30, | ||||||||
(Unaudited, in thousands of metric tons) | 2018 | 2017 | ||||||
Finished goods inventory | 85 | 114 | ||||||
(1) | Net income (loss) including noncontrolling interests is equal to operating income (loss) in this segment. |
(2) | EBITDA, a non-GAAP financial measure, is reconciled below. For more information on the calculation and reasons we include this measure, see note 1 under “Results of Operations – Consolidated Results – Selected Financial Information” above. |
Three Months Ended June 30, | Six Months Ended June 30, | ||||||||||||||||
(Unaudited, in millions) | 2018 | 2017 | 2018 | 2017 | |||||||||||||
Net income (loss) including noncontrolling interests | $ | 18 | $ | (7 | ) | $ | 14 | $ | (11 | ) | |||||||
Depreciation and amortization | 17 | 17 | 33 | 33 | |||||||||||||
EBITDA | 35 | 10 | 47 | 22 | |||||||||||||
Industry trends
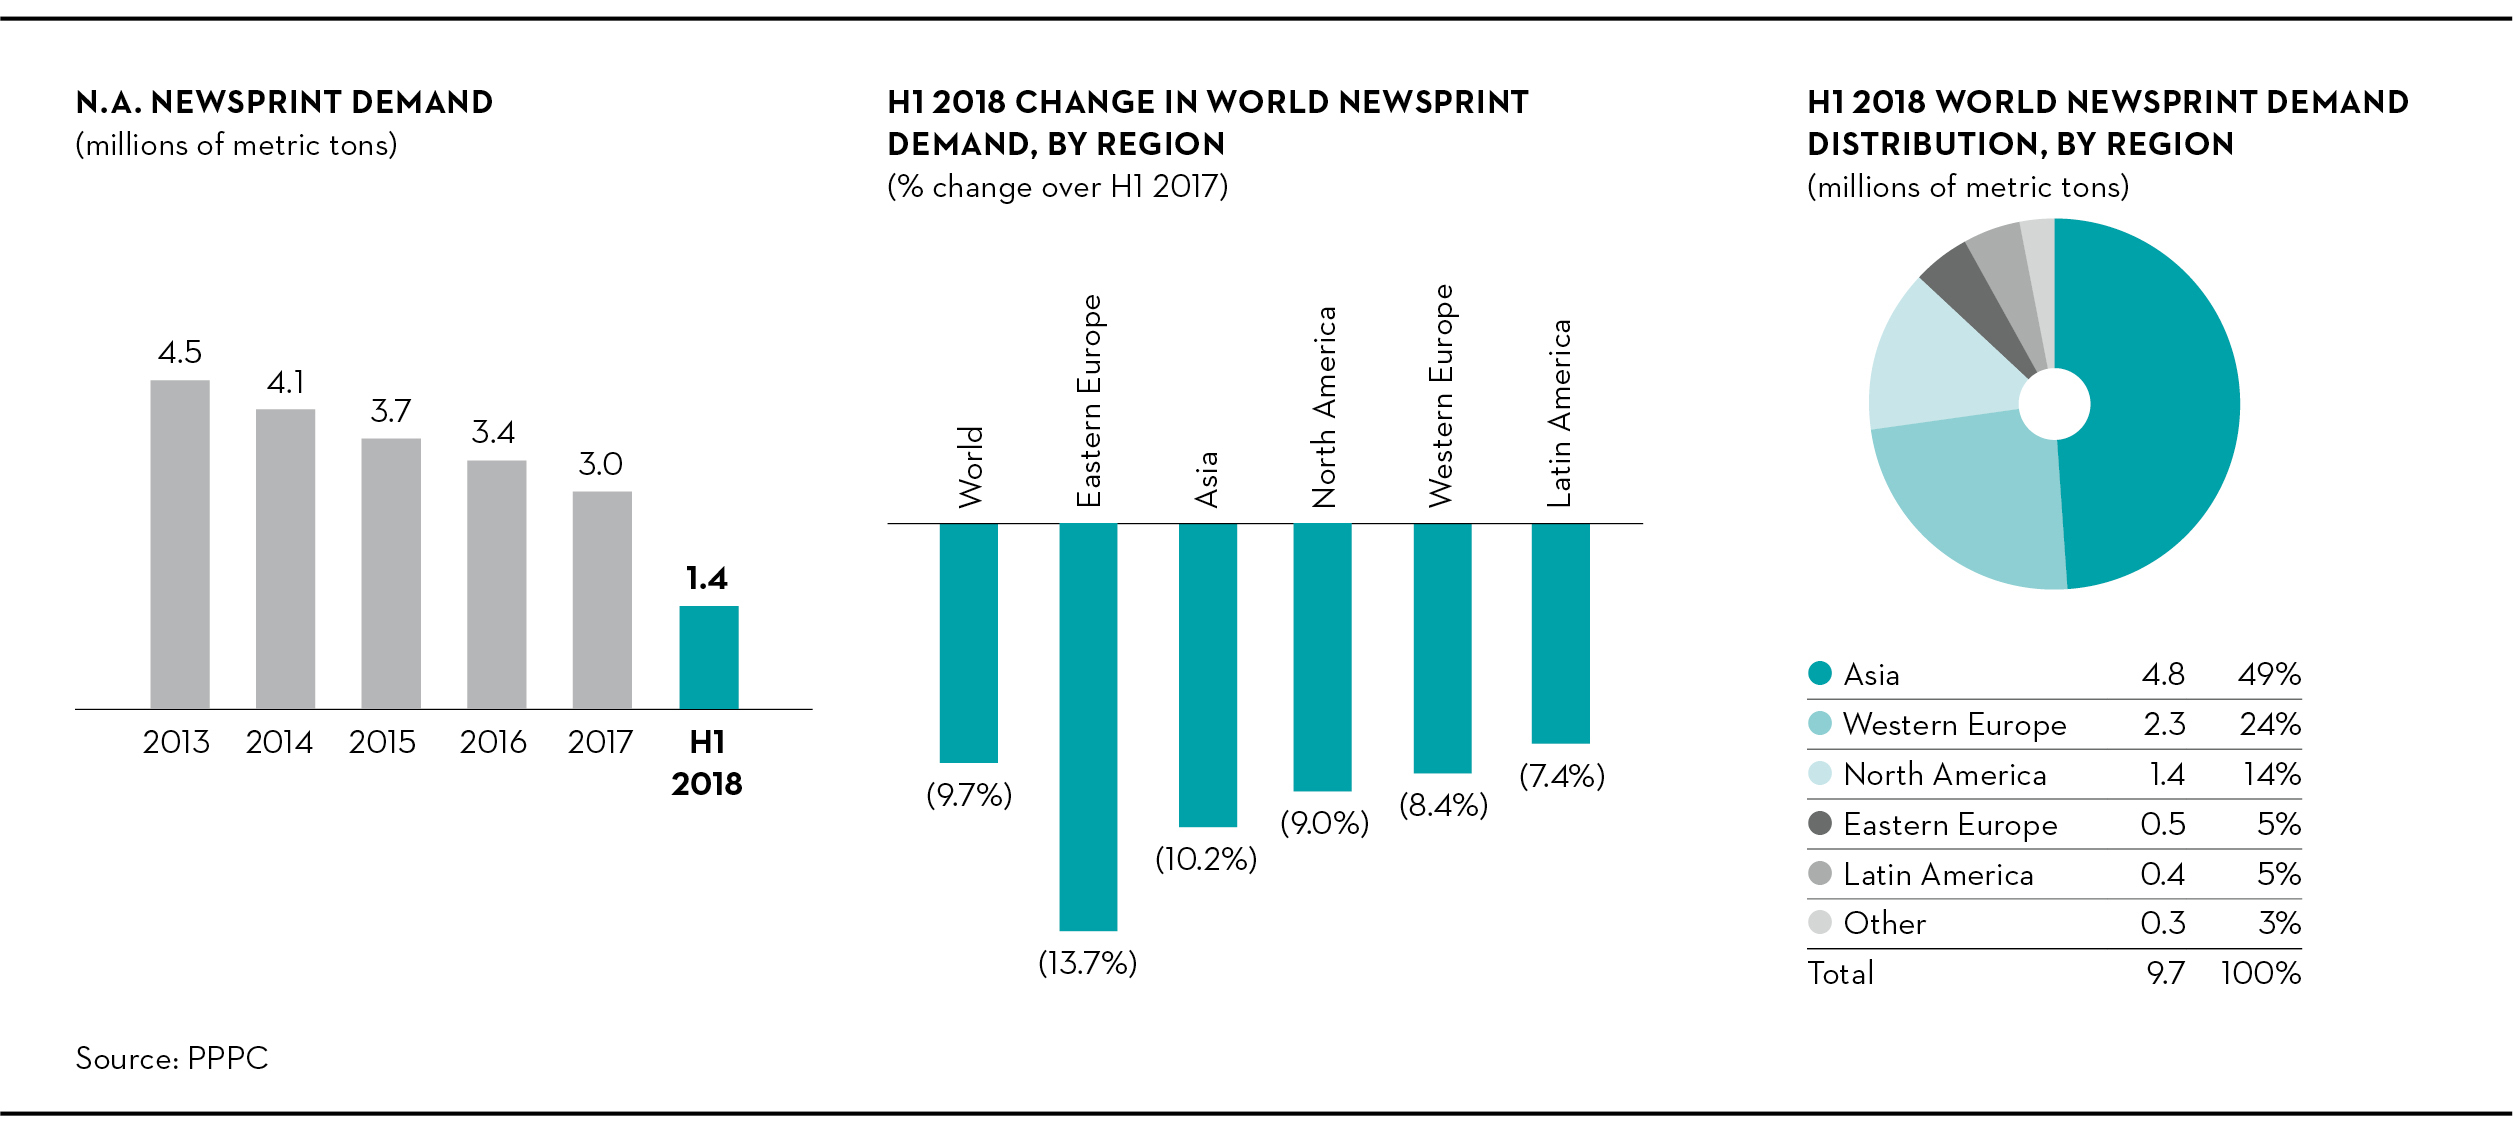
North American demand for newsprint declined by 9.0% in the first half of the year compared to the same period last year, driven by a 12.5% reduction in demand from newspaper publishers. Demand from commercial printers also decreased, dropping by 7.0%. Industry production was lower, down 10.9%, contributing to a North American shipment-to-capacity ratio of 96%, up from 92% in the year-ago period.
49
Global demand for newsprint was down by 9.7% in the first half of the year compared to the same period last year, with Asia down by 10.2%, and Western Europe by 8.4%. Despite the drop, the global operating rate rose to 92%, as a result of major global capacity reductions in the second half of 2017.
Three months ended June 30, 2018 vs. June 30, 2017
Operating income (loss) variance analysis
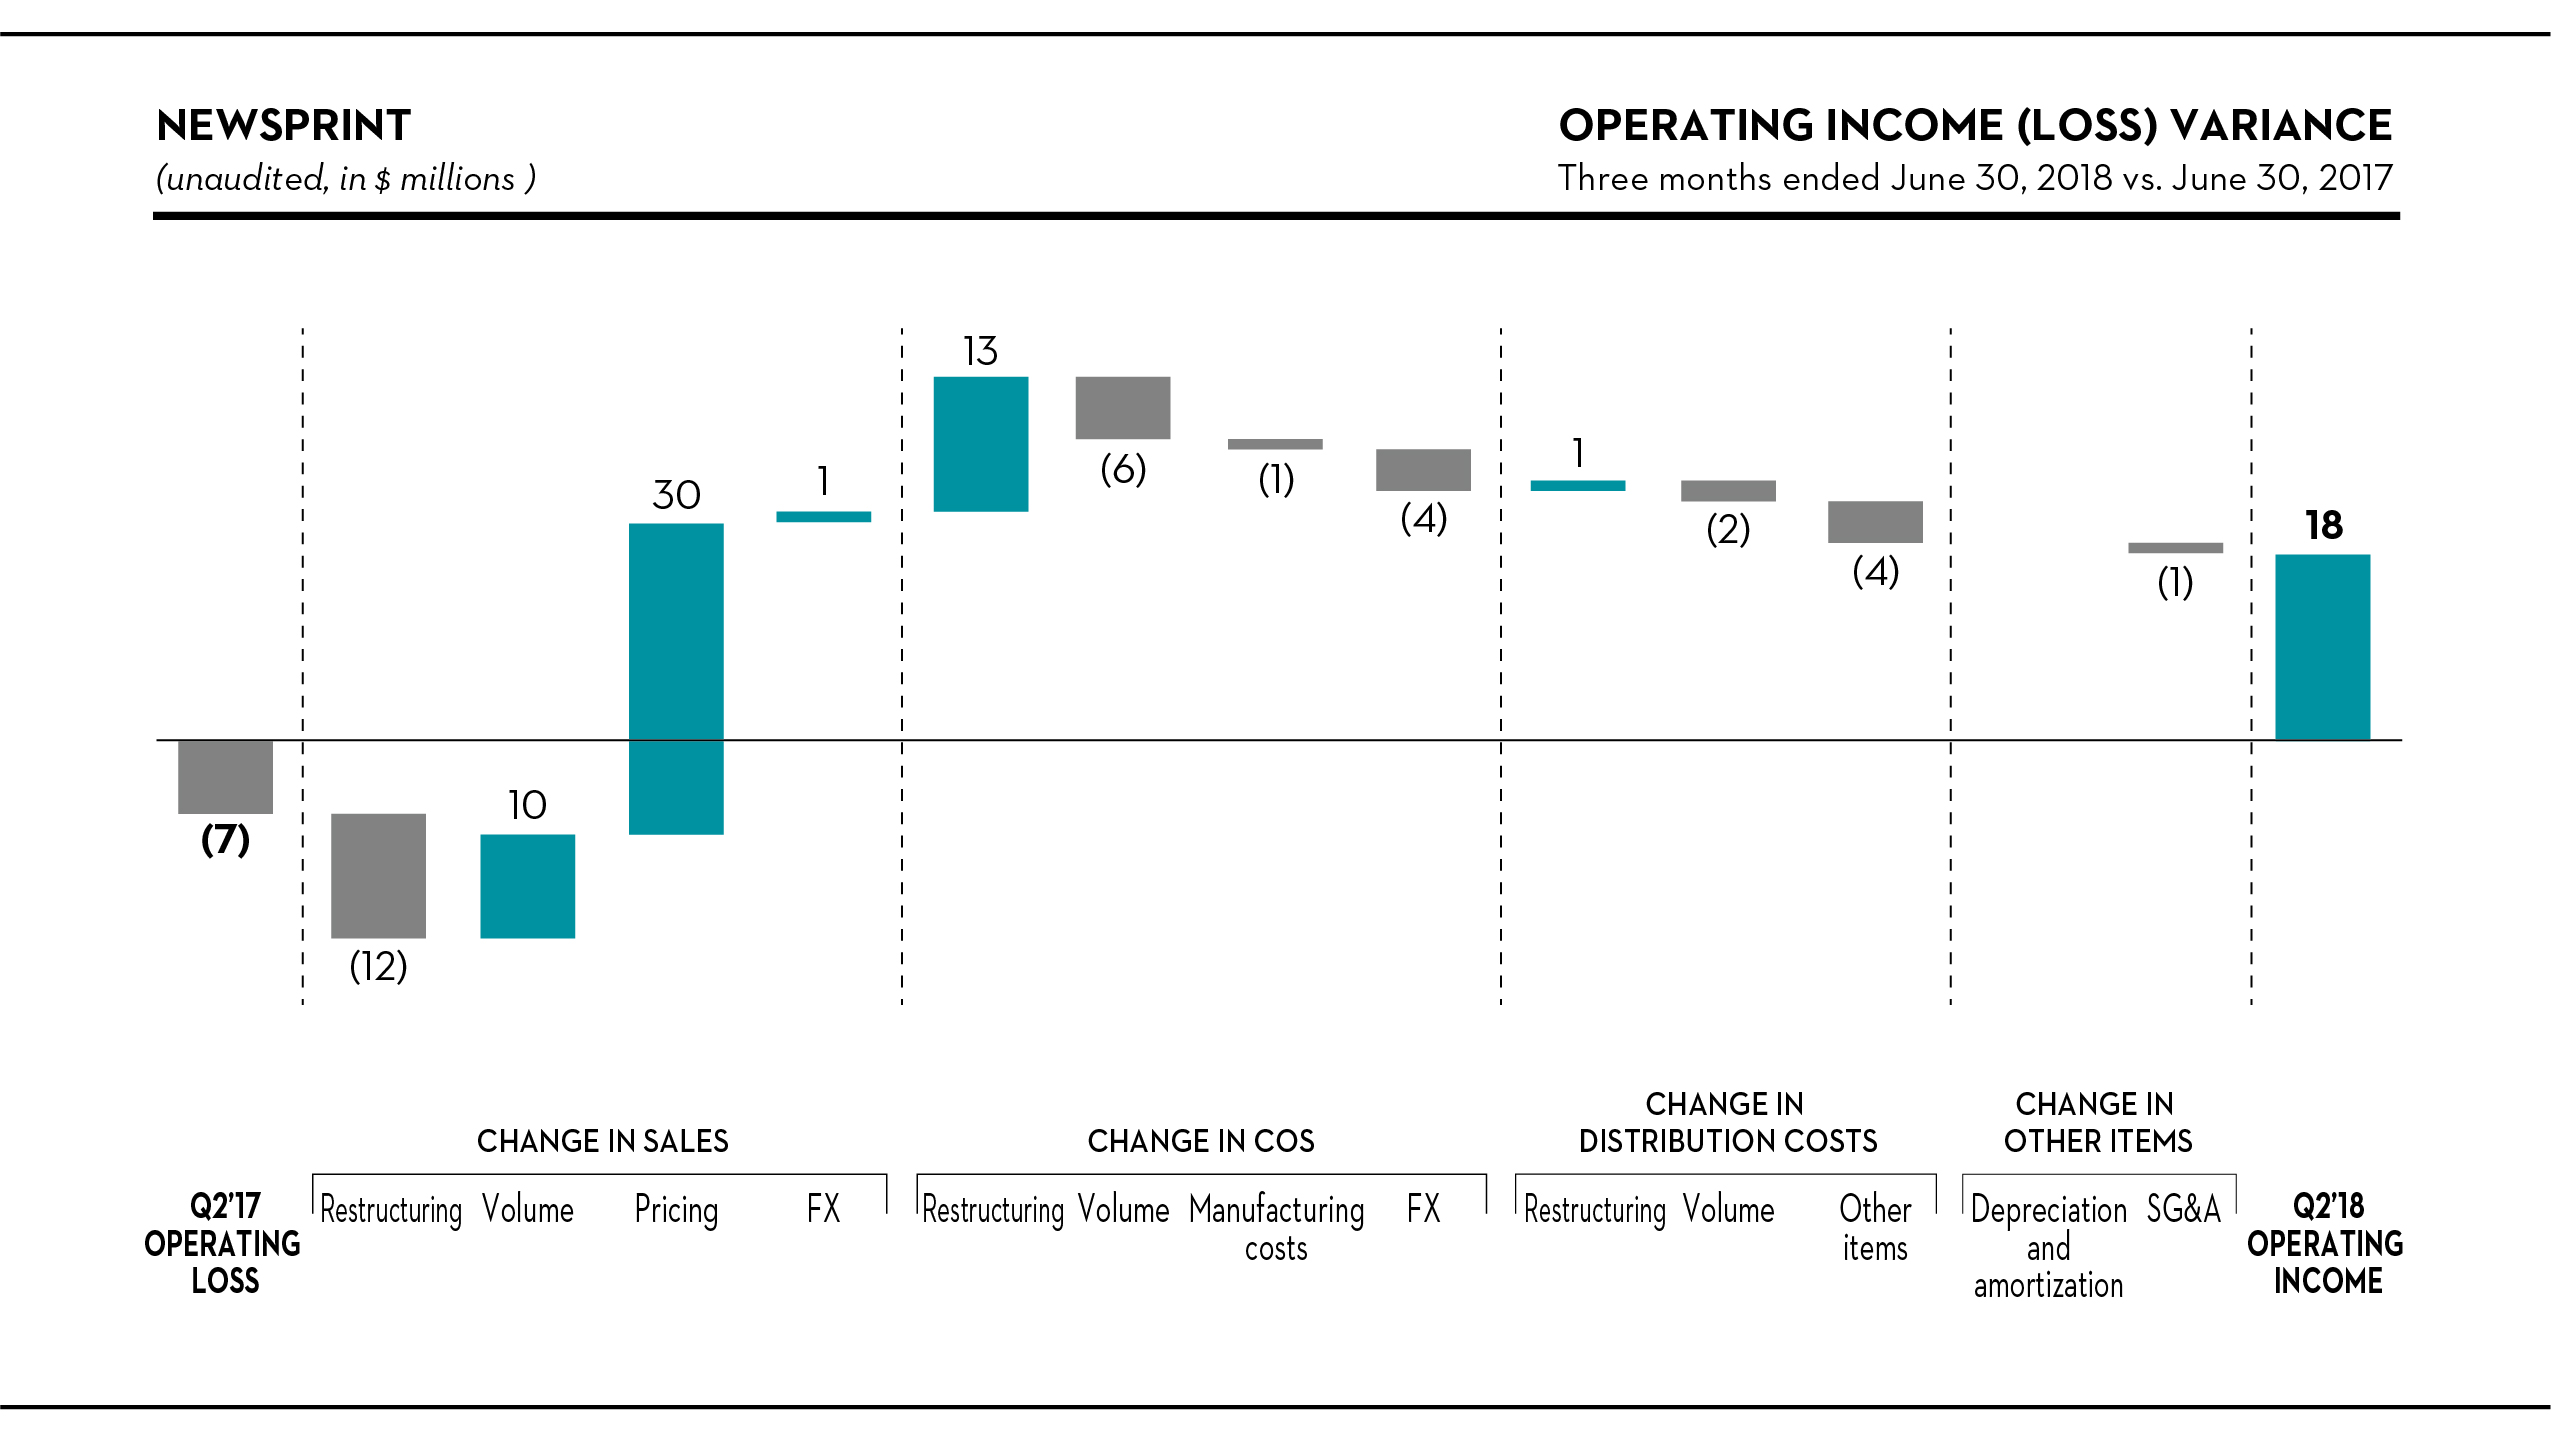
Sales
Newsprint sales increased by $29 million, or 14%, to $230 million in the second quarter of the year, reflecting an increase of $75 per metric ton in the average transaction price, as price increases were realized in both North American and export markets. Shipments decreased by 4,000 metric tons, mainly due to the lower production volumes following the paper machine closures in Calhoun at the end of the third quarter of 2017, largely offset by the timing of export sales and favorable export market conditions in the current year. Accordingly, finished goods inventory fell by 29,000 metric tons.
Compared to the second quarter of 2017, our international shipments rose by 17%, while our domestic shipments dropped by 10%. Domestic shipments represented 59% of total newsprint shipments in the quarter, compared to 65% in the year-ago period.
Cost of sales, excluding depreciation, amortization and distribution costs
COS was $2 million lower in the quarter. Restructuring initiatives reduced COS by $13 million, including the elimination of $4 million in fixed manufacturing costs. After removing the effects of the Canadian dollar fluctuation, higher volume, and the restructuring initiatives, manufacturing costs were relatively unchanged compared to the same period last year.
Distribution costs
After removing the effects of higher volume and restructuring initiatives, distribution costs rose by $4 million in the quarter, mostly attributable to higher truck and rail car rates, an increase in international shipments, and higher fuel surcharges.
50
Six months ended June 30, 2018 vs. June 30, 2017
Operating income (loss) variance analysis
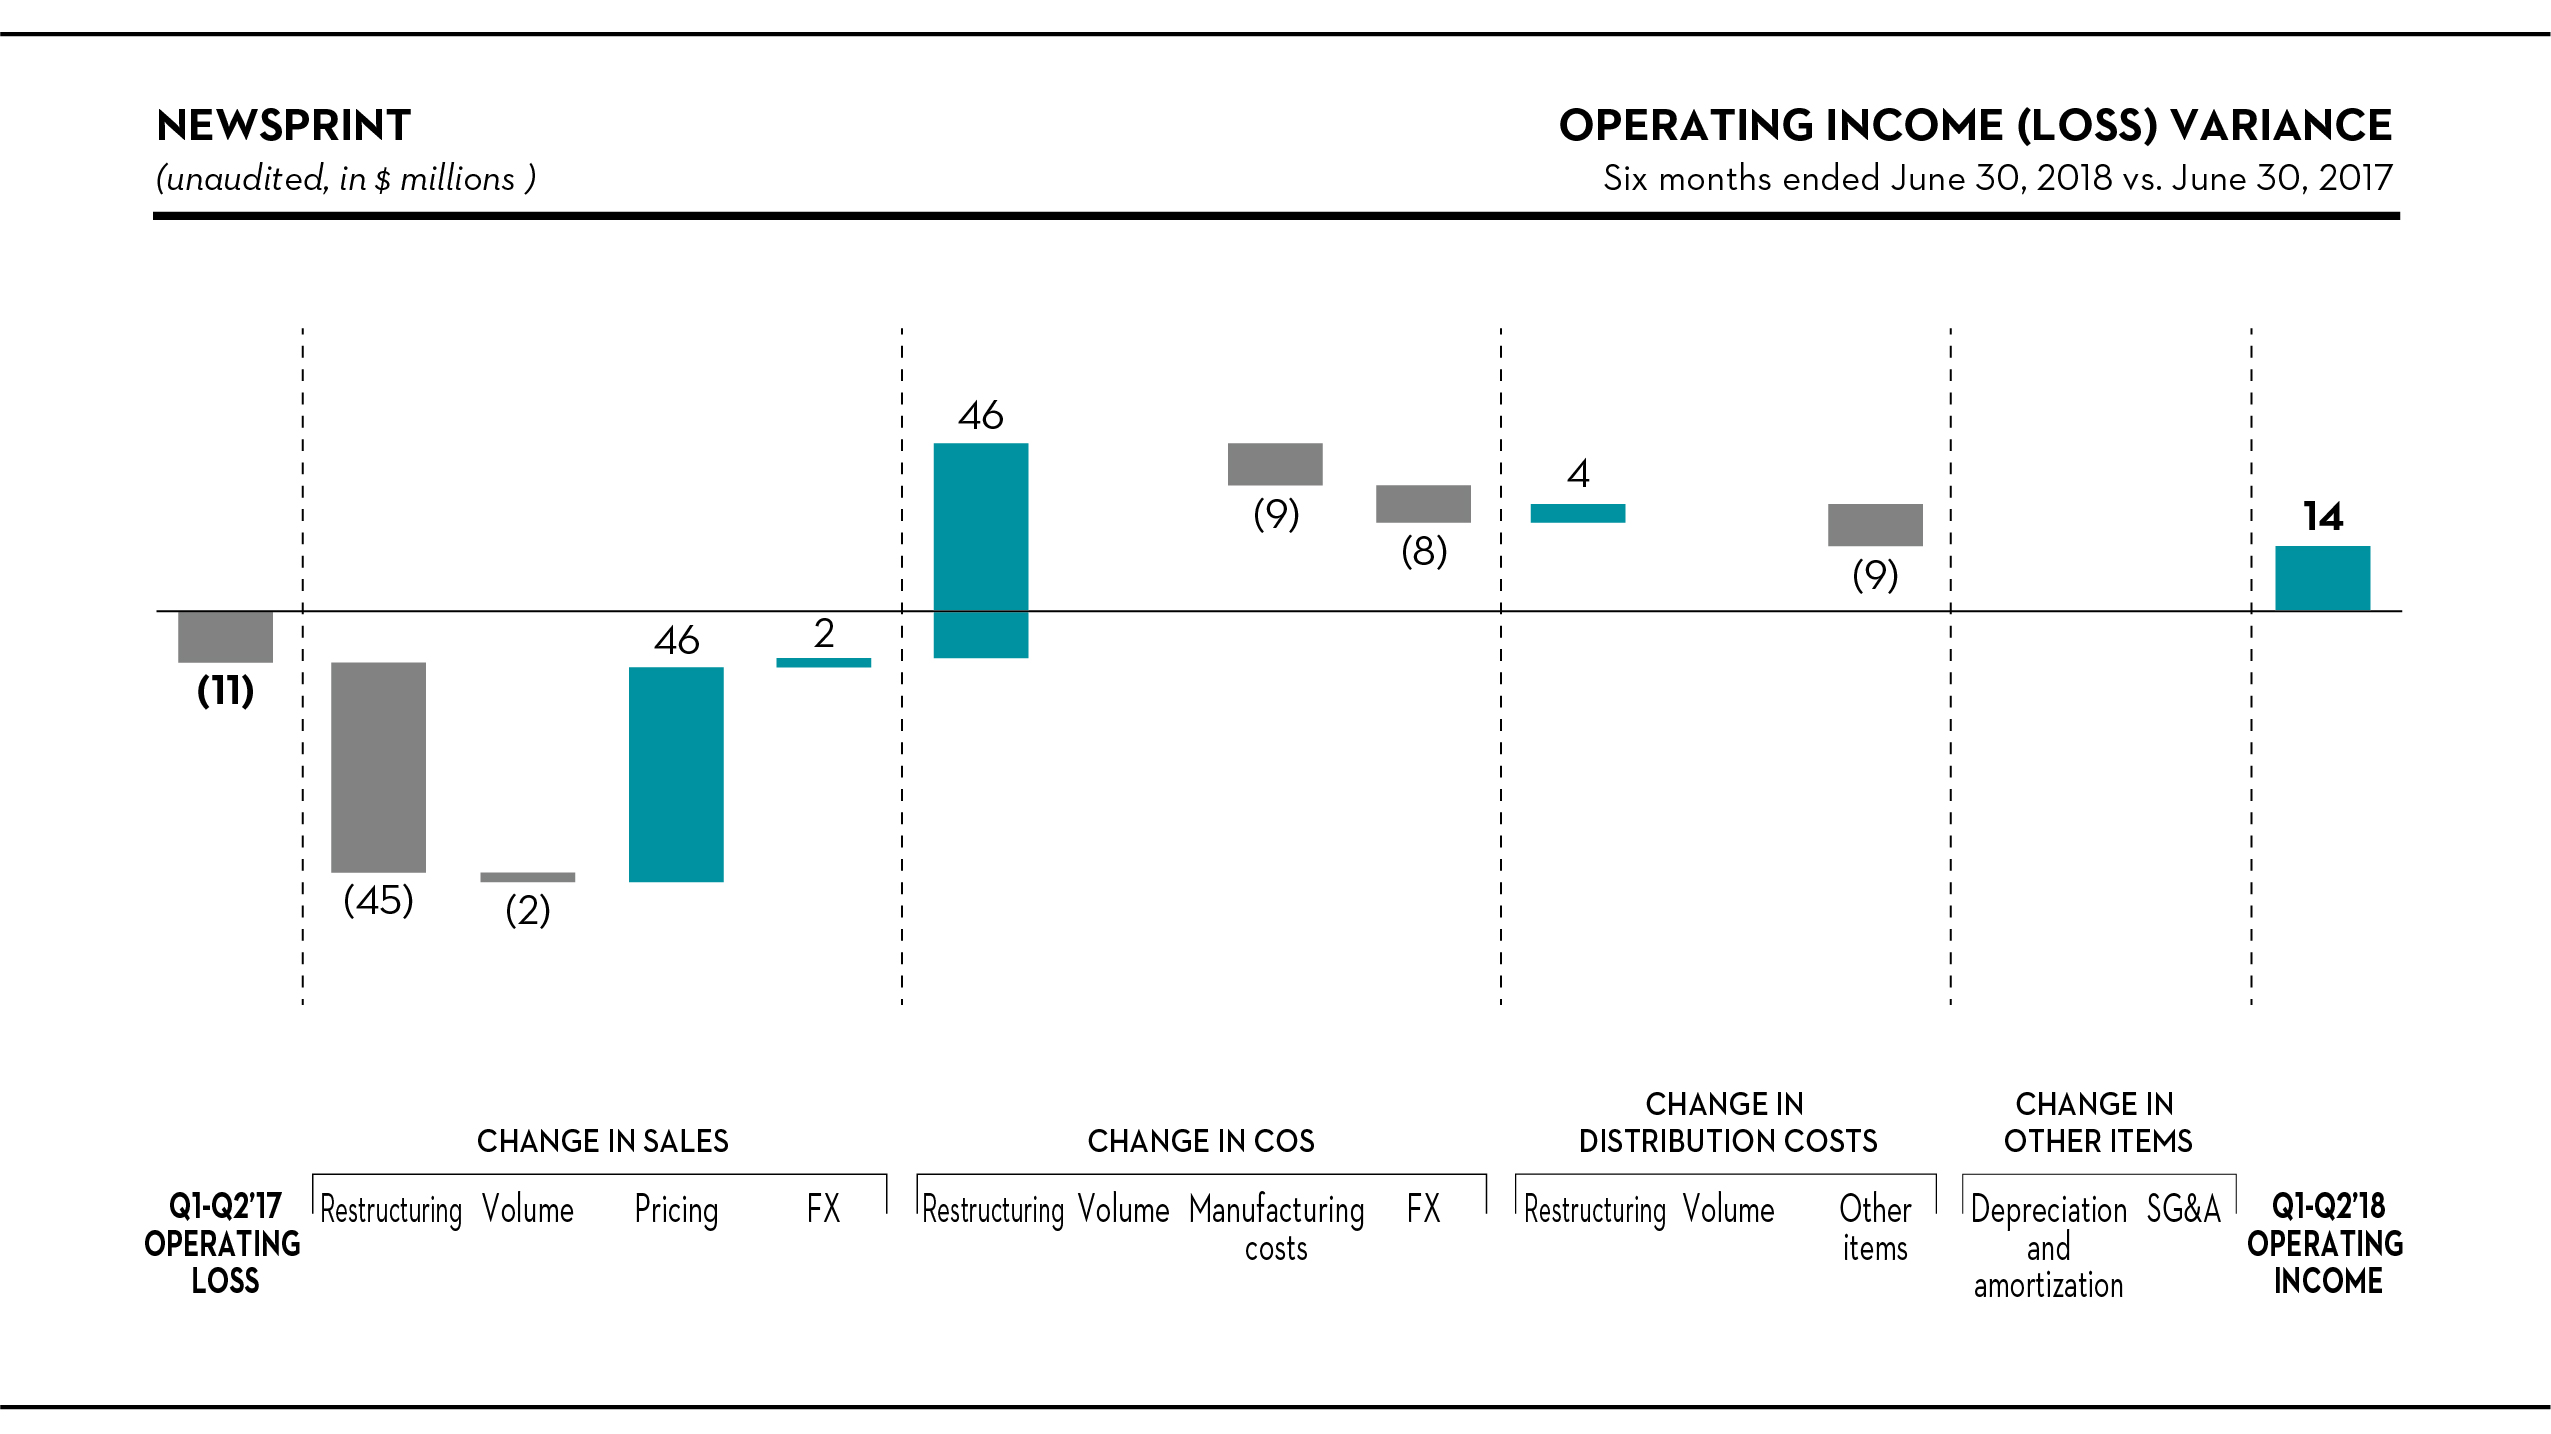
Sales
Newsprint sales remained largely unchanged at $428 million in the first half of the year, reflecting an increase of $62 per metric ton in the average transaction price, as price increases were realized in both North American and export markets. Shipments, however, were lower by 92,000 metric tons, or 11%, due to the lower production volumes following the paper machine closures in Calhoun, as well as the permanent closure of our Mokpo paper mill in the first quarter of 2017, partly offset by favorable export market conditions in 2018.
Compared to the first half of 2017, our domestic shipments fell by 14%, and our international shipments by 5%. Domestic shipments represented 60% of total newsprint shipments in the period, down by 3% from the year-ago period.
Cost of sales, excluding depreciation, amortization and distribution costs
COS was $29 million lower in the period. Restructuring initiatives reduced COS by $46 million, including the elimination of $14 million in fixed manufacturing costs. After removing the effects of the Canadian dollar fluctuation and the restructuring initiatives, manufacturing costs increased by $9 million compared to the same period last year, reflecting:
• | higher maintenance and related labor costs ($6 million); and |
• | unfavorable power and steam costs ($4 million); |
partly offset by lower wood chip prices ($5 million).
Distribution costs
After removing the effects of restructuring initiatives and the Canadian dollar fluctuation, distribution costs increased by $8 million in 2018, mainly due to higher truck and rail car rates, an increase in the average length of haul, and higher fuel surcharges.
51
SPECIALTY PAPERS
Highlights
Three Months Ended June 30, | Six Months Ended June 30, | ||||||||||||||||
(Unaudited, in millions, except where otherwise stated) | 2018 | 2017 | 2018 | 2017 | |||||||||||||
Sales | $ | 193 | $ | 227 | $ | 381 | $ | 467 | |||||||||
Operating income (loss) (1) | 4 | (7 | ) | (3 | ) | (3 | ) | ||||||||||
EBITDA (2) | 16 | 4 | 21 | 20 | |||||||||||||
(In thousands of short tons) | |||||||||||||||||
Shipments | 275 | 349 | 554 | 713 | |||||||||||||
Downtime | 12 | 17 | 15 | 23 | |||||||||||||
June 30, | ||||||||
(Unaudited, in thousands of short tons) | 2018 | 2017 | ||||||
Finished goods inventory | 70 | 93 | ||||||
(1) | Net income (loss) including noncontrolling interests is equal to operating income (loss) in this segment. |
(2) | EBITDA, a non-GAAP financial measure, is reconciled below. For more information on the calculation and reasons we include this measure, see note 1 under “Results of Operations – Consolidated Results – Selected Financial Information” above. |
Three Months Ended June 30, | Six Months Ended June 30, | ||||||||||||||||
(Unaudited, in millions) | 2018 | 2017 | 2018 | 2017 | |||||||||||||
Net income (loss) including noncontrolling interests | $ | 4 | $ | (7 | ) | $ | (3 | ) | $ | (3 | ) | ||||||
Depreciation and amortization | 12 | 11 | 24 | 23 | |||||||||||||
EBITDA | 16 | 4 | 21 | 20 | |||||||||||||
Industry trends
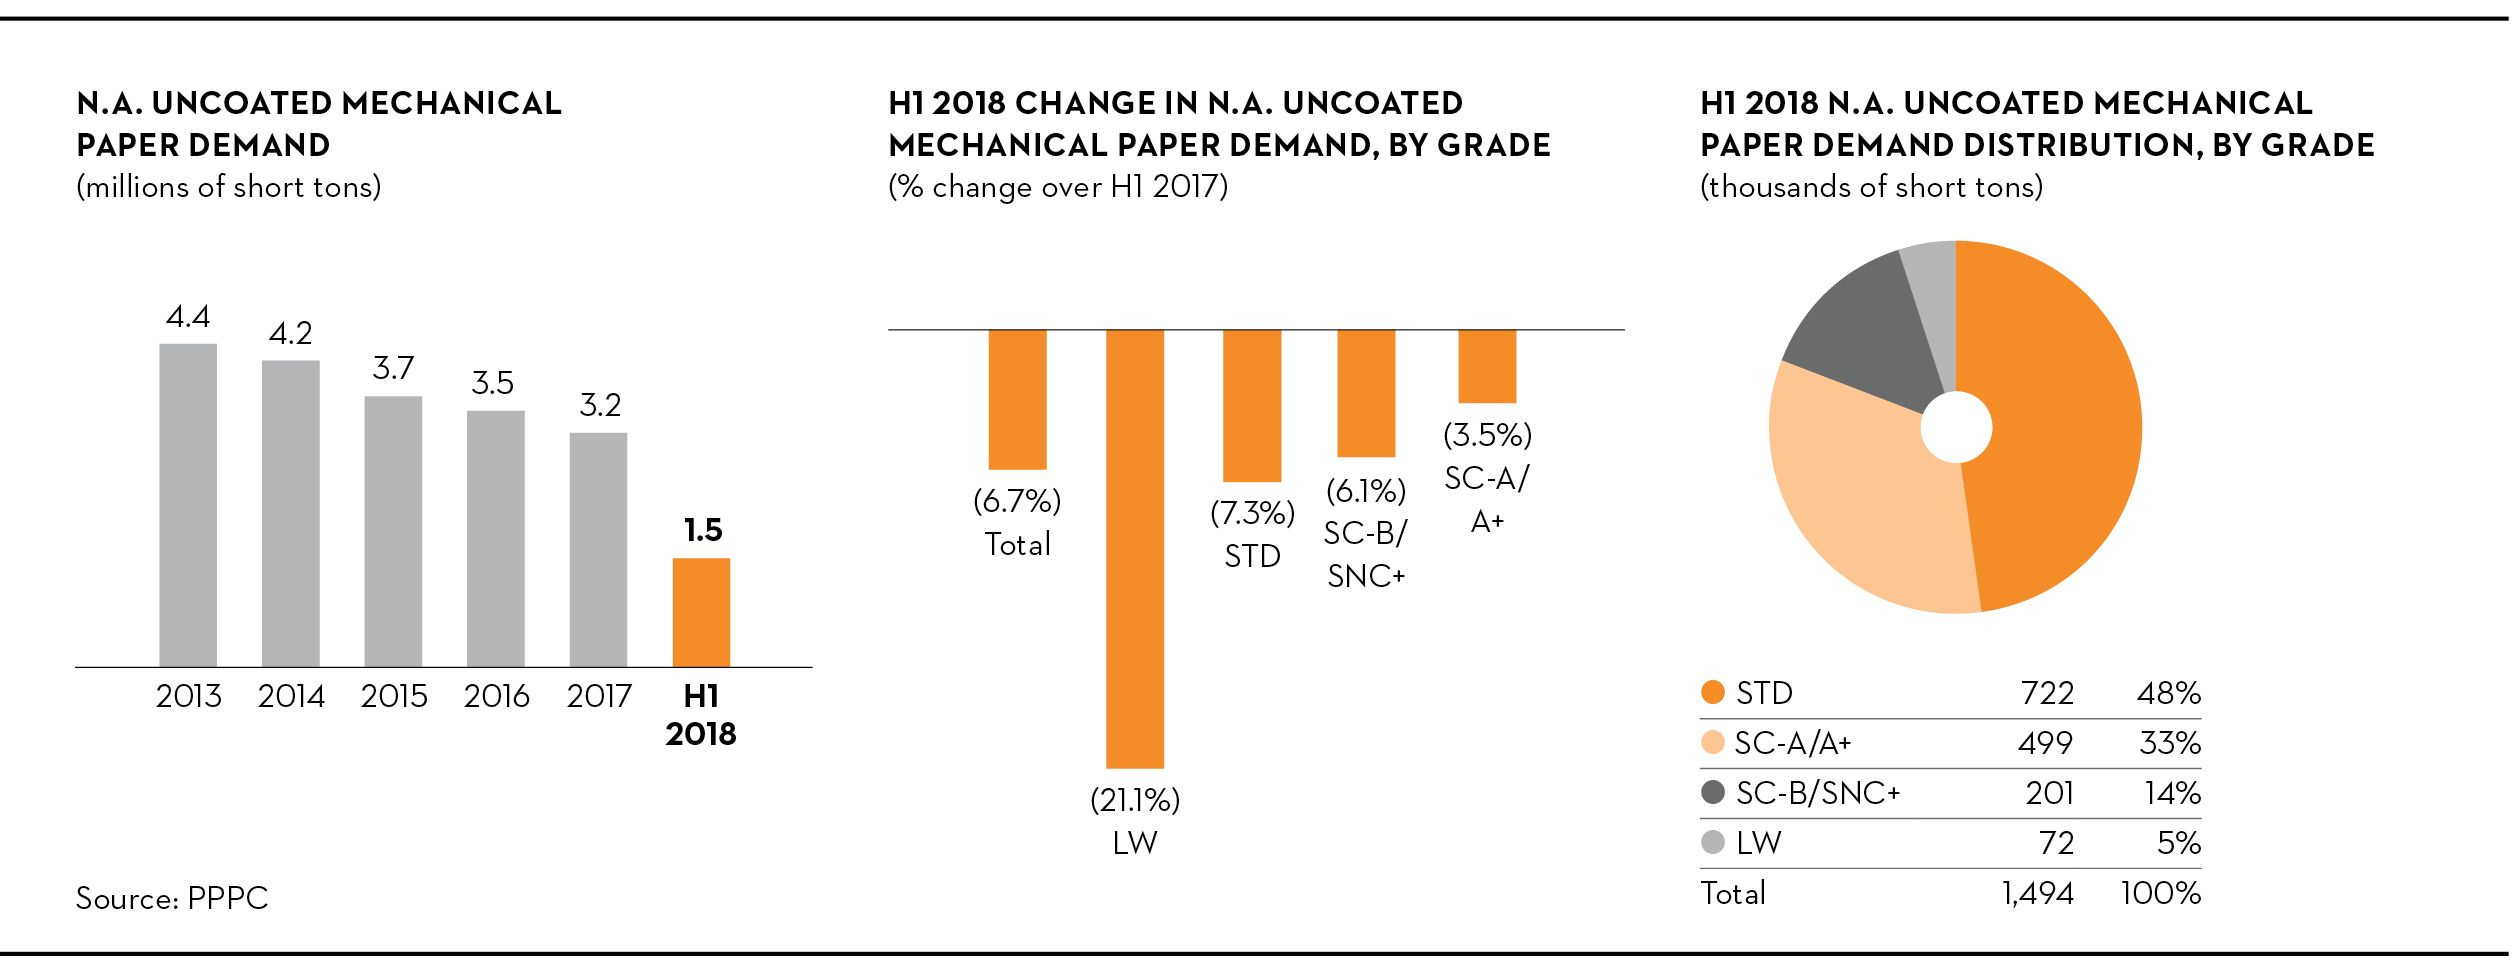
North American demand for uncoated mechanical papers was down by 6.7% in the first half of 2018 compared to the year-ago period. Lower demand for standard papers drove this decline, decreasing by 7.3%, while the demand for supercalendered (or “SC”) grades was down by 4.3%. Overall North American industry production for the period was flat, but imports dropped by 19.3%, mainly for SC papers. The operating rate increased to 91%, compared to 90% in the year-ago period.
52
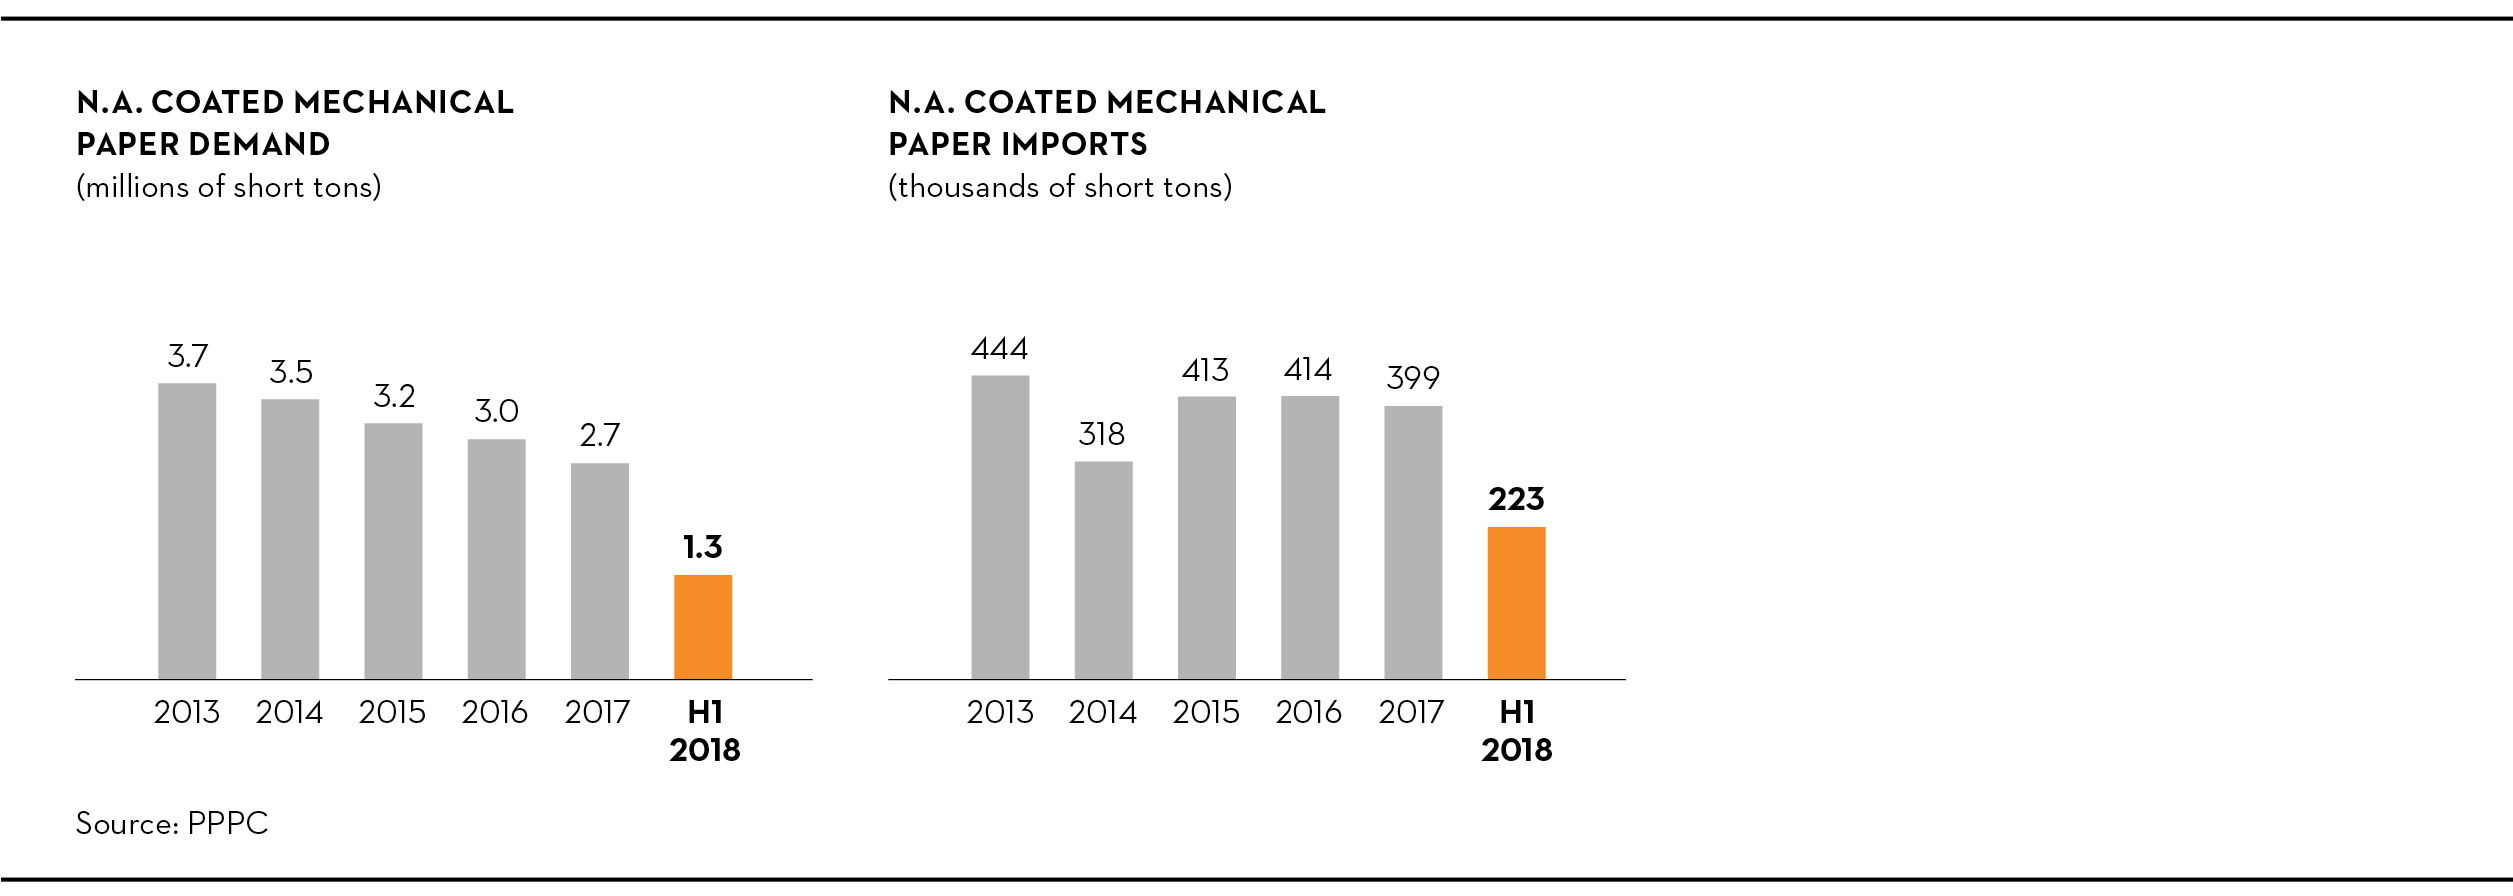
North American coated mechanical paper demand was down by 5.1% in the first half of 2018 compared to the year-ago period. Production, however, was significantly lower, down by 191,000 short tons (173,000 metric tons), or 15.8%, while imports rose by 49,000 short tons (44,000 metric tons), or 27.3%. With the North American capacity closures in 2017 and early 2018, operating rates in North America rose to 94% in the first half of 2018, compared to 91% in the year-ago period.
53
Three months ended June 30, 2018 vs. June 30, 2017
Operating income (loss) variance analysis
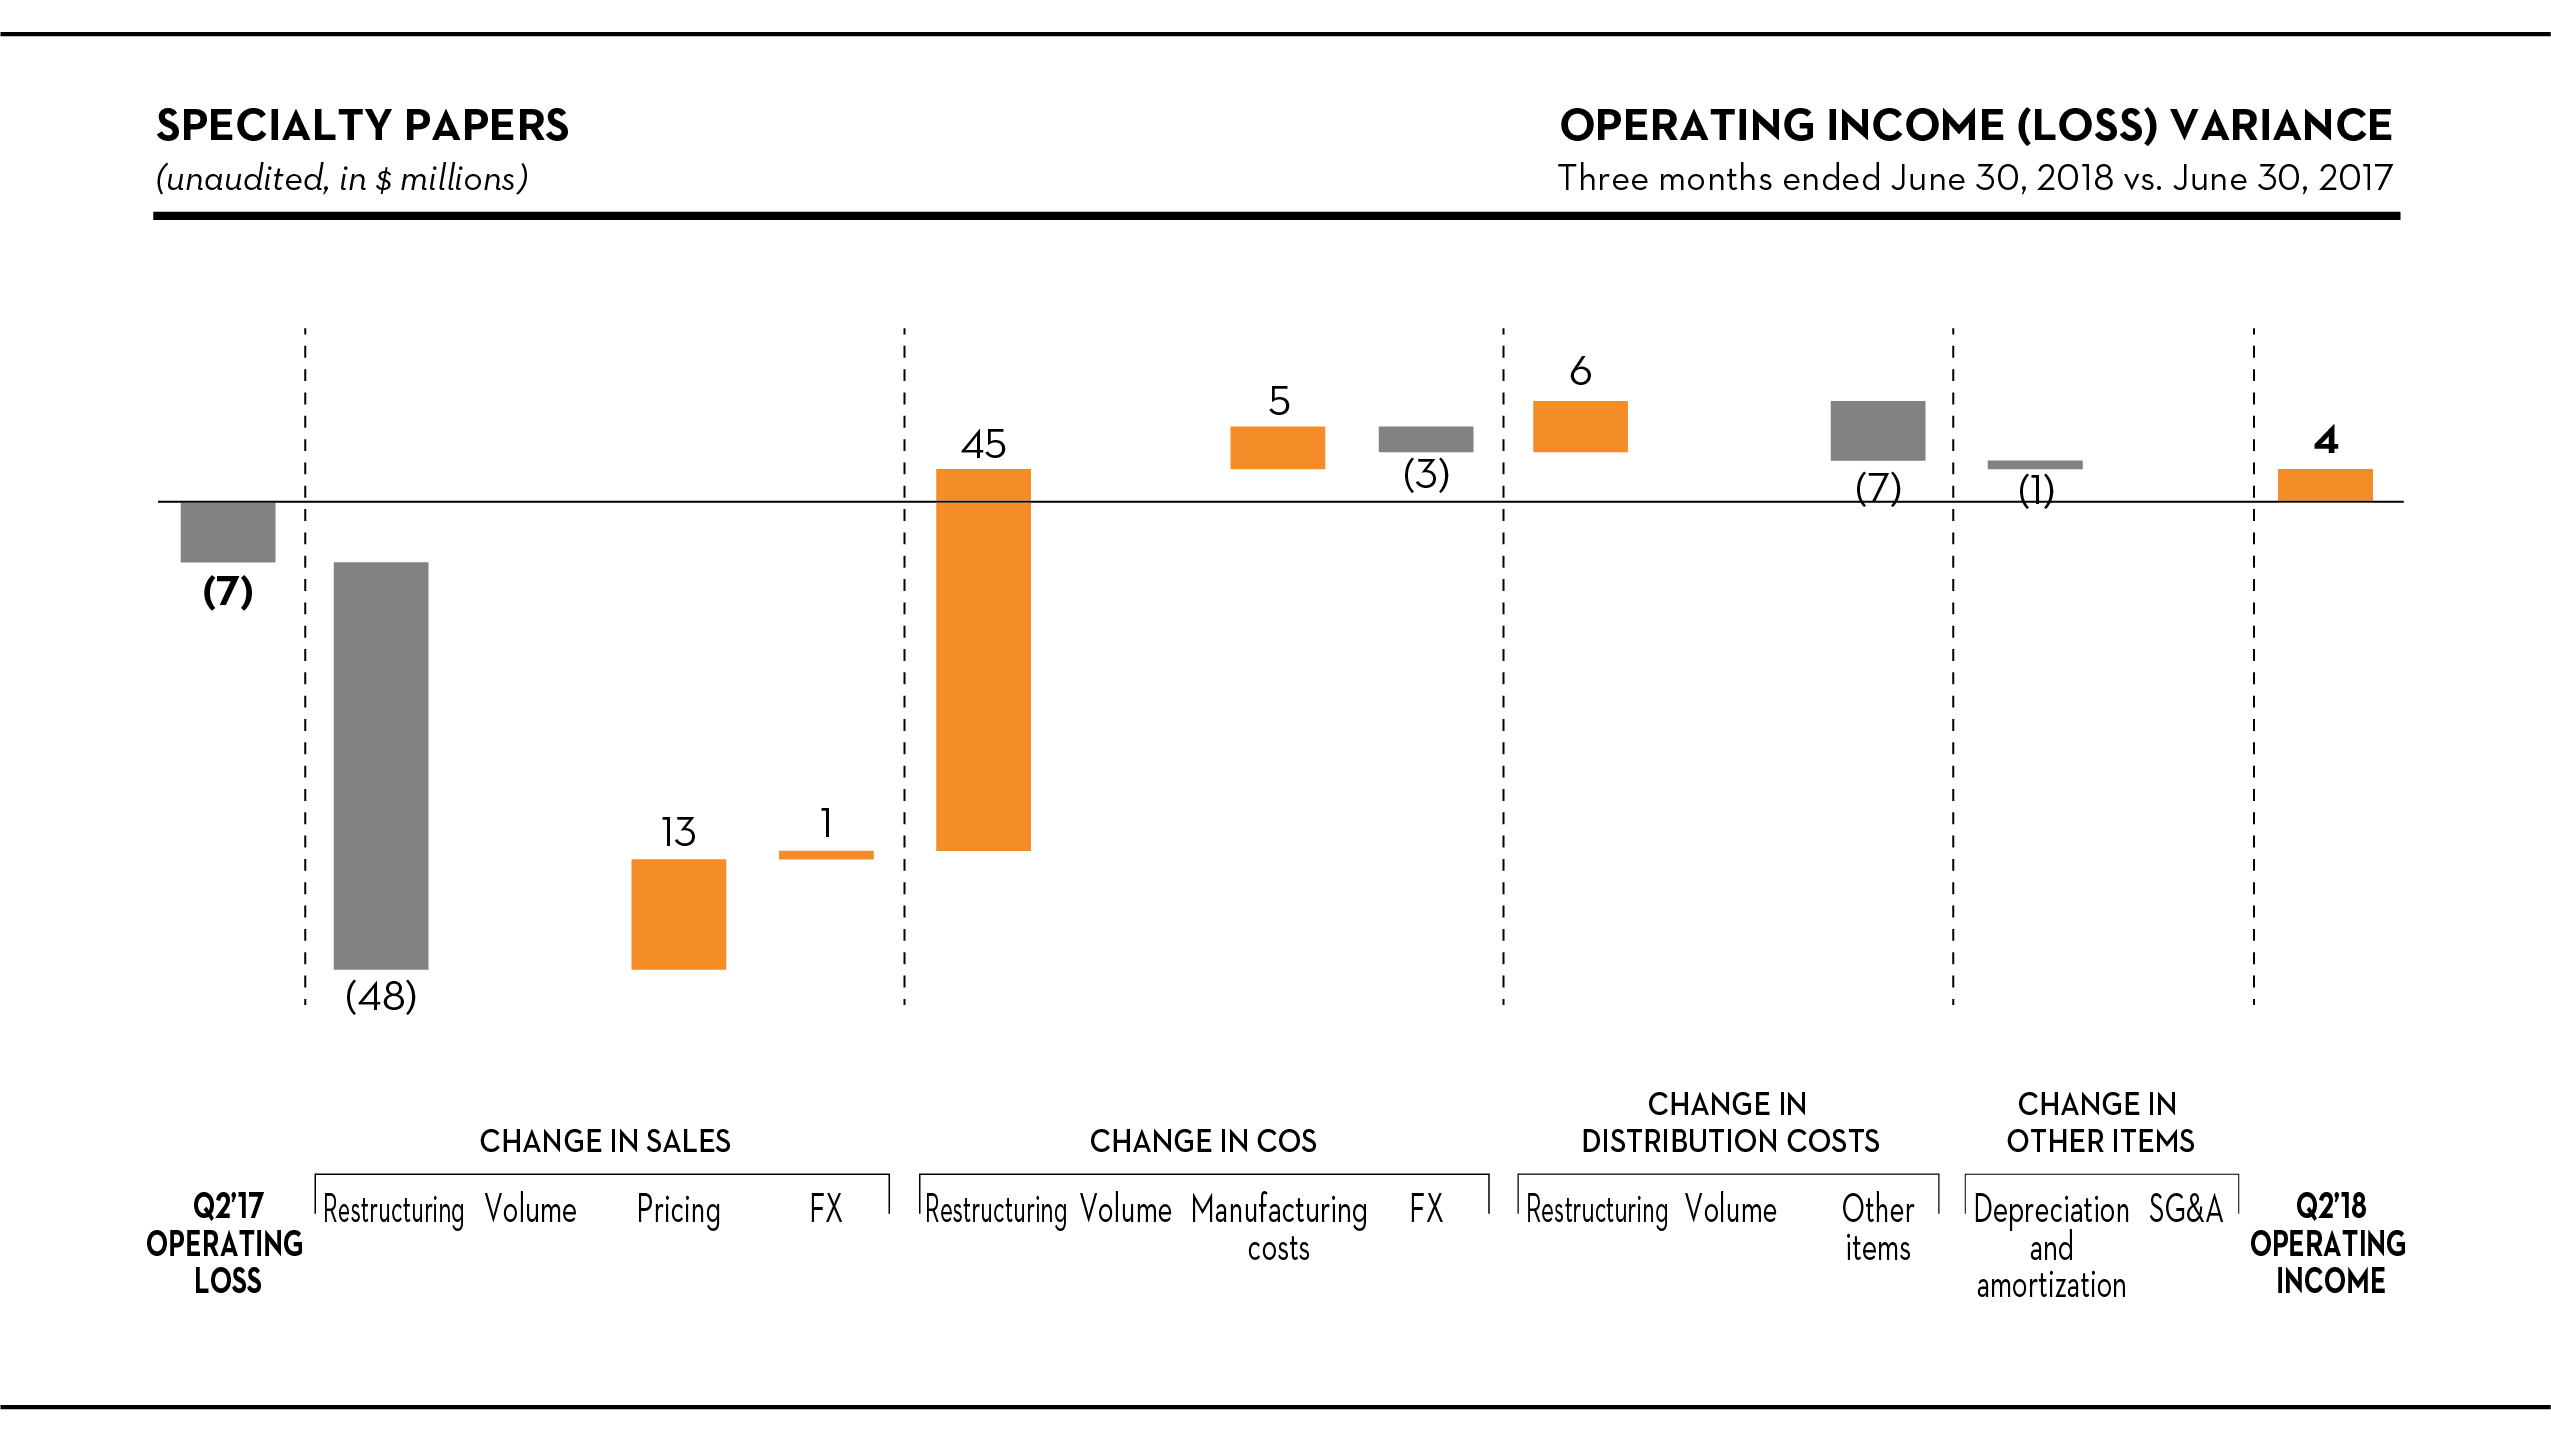
Sales
Specialty paper sales decreased by $34 million, or 15%, to $193 million in the second quarter of the year. Shipments were 74,000 short tons (67,000 metric tons) lower, or 21%, largely due to the permanent closure of two paper machines in Calhoun at the end of the third quarter of 2017, and one paper machine in Catawba at the end of the second quarter of 2017. Accordingly, finished goods inventory fell by 23,000 short tons (21,000 metric tons). The overall transaction price was $50 per short ton higher, reflecting price increases across all grades.
Cost of sales, excluding depreciation, amortization and distribution costs
COS was $47 million lower in the quarter. Restructuring initiatives reduced COS by $45 million, including the elimination of $16 million in fixed manufacturing costs. After removing the effects of the Canadian dollar fluctuation and the restructuring initiatives, manufacturing costs improved by $5 million in the quarter, primarily due to lower wood chip prices ($3 million).
Distribution costs
After removing the effects of restructuring initiatives and the Canadian dollar fluctuation, distribution costs increased by $6 million in the current period, reflecting higher truck and rail car rates, an increase in the average length of haul, and higher fuel surcharges.
54
Six months ended June 30, 2018 vs. June 30, 2017
Operating loss variance analysis
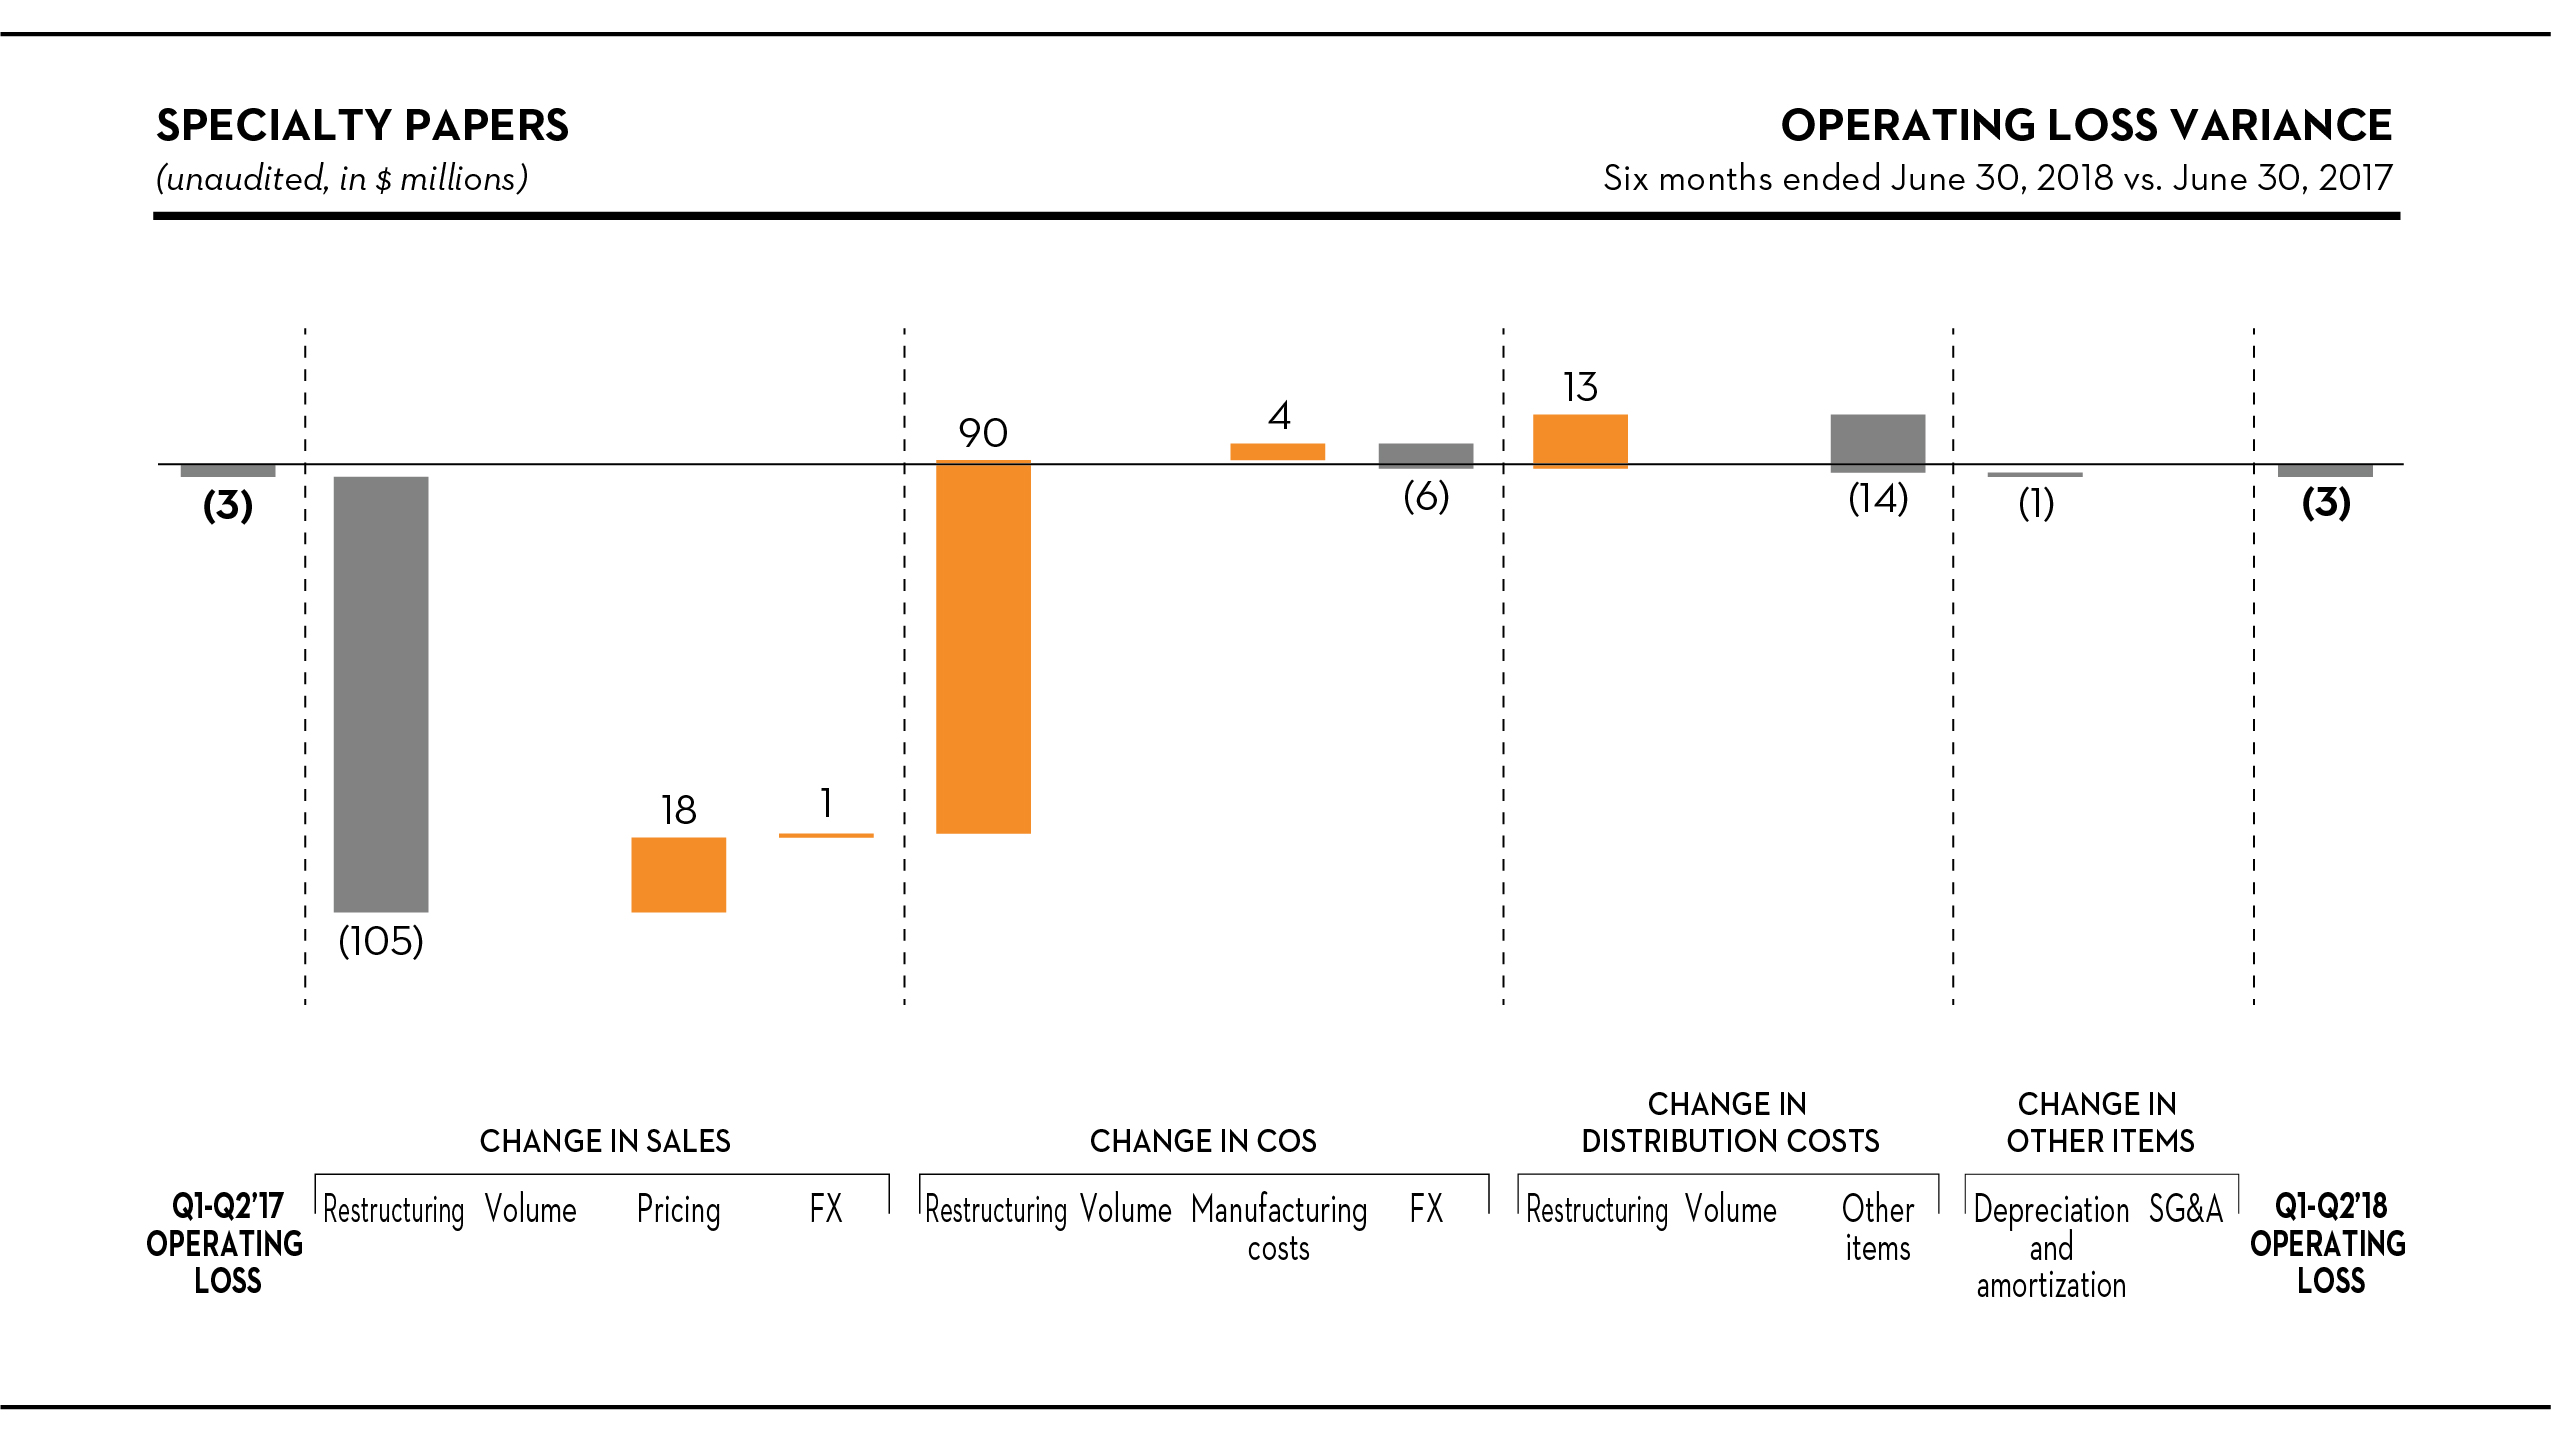
Sales
Specialty paper sales were lower by $86 million, or 18%, to $381 million in the first half of the year. Shipments decreased by 159,000 short tons (144,000 metric tons), or 22%, largely due to the permanent closure of two paper machines in Calhoun and one paper machine in Catawba. The overall transaction price rose by $33 per short ton, reflecting price increases across all grades.
Cost of sales, excluding depreciation, amortization and distribution costs
COS was $88 million lower in the period. Restructuring initiatives reduced COS by $90 million, including the elimination of $28 million in fixed manufacturing costs. After removing the effects of the Canadian dollar fluctuation and the restructuring initiatives, manufacturing costs improved by $4 million in the period, primarily due to:
• | lower wood chip prices ($5 million); and |
• | higher internal hydroelectric generation ($3 million); |
partly offset by:
• | unfavorable power and steam costs ($3 million); and |
• | higher maintenance costs ($2 million). |
Distribution costs
After removing the effects of restructuring initiatives and the Canadian dollar fluctuation, distribution costs rose by $13 million in the first half of 2018, mostly due to higher truck and rail car rates, an increase in the average length of haul, and higher fuel surcharges.
55
CORPORATE AND OTHER
Highlights
Three Months Ended June 30, | Six Months Ended June 30, | ||||||||||||||||
(Unaudited, in millions) | 2018 | 2017 | 2018 | 2017 | |||||||||||||
Cost of sales, excluding depreciation, amortization and distribution costs | $ | (2 | ) | $ | (16 | ) | $ | (9 | ) | $ | (31 | ) | |||||
Depreciation and amortization | (5 | ) | (6 | ) | (14 | ) | (11 | ) | |||||||||
Selling, general and administrative expenses | (7 | ) | (7 | ) | (17 | ) | (16 | ) | |||||||||
Closure costs, impairment and other related charges | (1 | ) | (65 | ) | (1 | ) | (72 | ) | |||||||||
Net gain on disposition of assets | 4 | — | 4 | — | |||||||||||||
Operating loss | $ | (11 | ) | $ | (94 | ) | $ | (37 | ) | $ | (130 | ) | |||||
Interest expense | (11 | ) | (12 | ) | (24 | ) | (23 | ) | |||||||||
Non-operating pension and other postretirement benefit credits | 12 | 1 | 25 | 4 | |||||||||||||
Other (expense) income, net | (3 | ) | 5 | (10 | ) | 5 | |||||||||||
Income tax provision | (47 | ) | (19 | ) | (78 | ) | (48 | ) | |||||||||
Net loss including noncontrolling interests | $ | (60 | ) | $ | (119 | ) | $ | (124 | ) | $ | (192 | ) | |||||
The table below shows the reconciliation of net loss including noncontrolling interests to EBITDA and adjusted EBITDA, which are non-GAAP financial measures. For more information on the calculation and reasons we include these measures, see note 1 under “Results of Operations – Consolidated Results – Selected Financial Information” above.
Three Months Ended June 30, | Six Months Ended June 30, | ||||||||||||||||
(Unaudited, in millions) | 2018 | 2017 | 2018 | 2017 | |||||||||||||
Net loss including noncontrolling interests | $ | (60 | ) | $ | (119 | ) | $ | (124 | ) | $ | (192 | ) | |||||
Interest expense | 11 | 12 | 24 | 23 | |||||||||||||
Income tax provision | 47 | 19 | 78 | 48 | |||||||||||||
Depreciation and amortization | 5 | 6 | 14 | 11 | |||||||||||||
EBITDA | $ | 3 | $ | (82 | ) | $ | (8 | ) | $ | (110 | ) | ||||||
Foreign exchange loss (gain) | 1 | (3 | ) | 2 | (3 | ) | |||||||||||
Closure costs, impairment and other related charges | 1 | 65 | 1 | 72 | |||||||||||||
Inventory write-downs (reversal) related to closures | — | 9 | (1 | ) | 13 | ||||||||||||
Start-up costs | — | 7 | 8 | 15 | |||||||||||||
Net gain on disposition of assets | (4 | ) | — | (4 | ) | — | |||||||||||
Non-operating pension and other postretirement benefit credits | (12 | ) | (1 | ) | (25 | ) | (4 | ) | |||||||||
Other expense (income), net | 2 | (2 | ) | 8 | (2 | ) | |||||||||||
Adjusted EBITDA | $ | (9 | ) | $ | (7 | ) | $ | (19 | ) | $ | (19 | ) | |||||
Three months ended June 30, 2018 vs. June 30, 2017
Cost of sales, excluding depreciation, amortization and distribution costs
We incurred COS of $2 million in the quarter representing asset preservation costs primarily related to the indefinite idling of our Thorold (Ontario) paper mill in the first quarter of 2017. COS of $16 million in the year-ago period were comprised of:
• | write-downs of mill stores and other supplies ($9 million), primarily related to the permanent closure of a paper machine at our Catawba paper mill in the second quarter of 2017, and the permanent closure of our Mokpo paper mill in the first quarter of 2017; and |
56
• | start-up costs ($5 million) for the Calhoun tissue manufacturing and converting facility. |
Closure costs, impairment and other related charges
We recorded closure costs, impairment and other related charges of $1 million in the quarter. In the same period last year, we recorded closure costs, impairment and other related charges of $65 million, which included:
• | a long-lived asset impairment charge related to our Coosa Pines pulp mill ($55 million); and |
• | a long-lived asset impairment charge ($5 million), and severance and other closure-related costs ($4 million) in connection with the permanent closure of a paper machine at our Catawba paper mill. |
Six months ended June 30, 2018 vs. June 30, 2017
Cost of sales, excluding depreciation, amortization and distribution costs
COS of $9 million in the first half of 2018 were primarily comprised of start-up costs ($7 million) for the Calhoun tissue manufacturing and converting facility. This compares to COS of $31 million in the year-ago period, including:
• | write-downs of mill stores and other supplies ($13 million), primarily related to the permanent closure of a paper machine at our Catawba paper mill and the permanent closure of our Mokpo paper mill; |
• | start-up costs ($12 million) for the Calhoun tissue manufacturing and converting facility; and |
• | asset preservation costs ($6 million), primarily related to the indefinite idling of our Thorold paper mill in the first quarter of 2017, and our permanently closed Fort Frances (Ontario) mill. |
Depreciation and amortization
Depreciation and amortization was $3 million greater in the first half of 2018, mainly explained by additional costs associated with the implementation of our integrated business management software.
Closure costs, impairment and other related charges
We incurred closure costs, impairment and other related charges of $1 million in the first half of the year, compared to $72 million in the year-ago period. The prior year included:
• | a long-lived asset impairment charge related to our Coosa Pines pulp mill ($55 million); |
• | a long-lived asset impairment charge ($5 million), and severance and other closure-related costs ($4 million) in connection with the permanent closure of a paper machine at our Catawba paper mill; and |
• | severance and other costs related to the permanent closure of our paper mill in Mokpo ($7 million). |
LIQUIDITY AND CAPITAL RESOURCES
Capital Resources
We rely on cash and cash equivalents, net cash provided by operations, and our revolving credit facilities to fund our operations, make pension contributions, and finance our working capital, capital expenditures, and cash duty deposits. In addition, from time to time we may use available cash to reduce debt. As of June 30, 2018, we had cash and cash equivalents of $6 million and availability of $511 million under our revolving credit facilities.
Based on our current projections, we expect to have sufficient financial resources available to finance our business plan, make pension contributions, meet working capital and cash duty deposit requirements, and maintain an appropriate level of capital spending.
From time to time, based on market conditions, we may seek to retire, repay or refinance our outstanding indebtedness, including our 5.875% senior unsecured notes due 2023 and credit facilities, through redemptions, prepayments, open market purchases or individually negotiated transactions, as we continue to focus on reducing costs and enhancing our financial flexibility.
57
Credit facilities
Interest rates under our credit facilities are based on an index, plus a spread which fluctuates based on availability and the Company’s leverage ratio, or the capitalization ratio, as applicable. Improvement in these ratios is expected to reduce the spread over the index by 0.25% during the third quarter of 2018. For more information on our credit facilities’ interest rates, see Part II – Item 8. Financial Statements and Supplementary Data – Note 10. Long-Term Debt – Debt instruments in our 2017 Annual Report.
Flow of Funds
Summary of cash flows
A summary of cash flows for the six months ended June 30, 2018 and 2017, was as follows:
Six Months Ended June 30, | ||||||||
(Unaudited, in millions) | 2018 | 2017 | ||||||
Net cash provided by operating activities | $ | 220 | $ | 60 | ||||
Net cash used in investing activities | (109 | ) | (132 | ) | ||||
Net cash (used in) provided by financing activities | (115 | ) | 77 | |||||
Effect of exchange rate changes on cash and cash equivalents, and restricted cash | (2 | ) | 3 | |||||
Net (decrease) increase in cash and cash equivalents, and restricted cash | $ | (6 | ) | $ | 8 | |||
Six months ended June 30, 2018 vs. June 30, 2017
Net cash provided by operating activities
We generated $220 million of cash from operating activities in the first half of 2018, compared to $60 million used in the year-ago period. The increase is almost all attributable to higher profitability. The year-ago period also included closure costs in connection with the permanent closure of a paper machine at our Catawba paper mill and the permanent closure of our paper mill in Mokpo, and higher timing-related pension contributions.
Net cash used in investing activities
We used $109 million of cash in investing activities in the current period, $23 million lower compared to the year-ago period. This reflects lower cash invested in fixed assets of $63 million, mainly due to the substantial completion of the tissue manufacturing and converting facility in Calhoun in the first quarter of 2017, offset in part by higher countervailing and anti-dumping duty cash deposits during the period of $37 million on imports of softwood lumber to the U.S.
Net cash (used in) provided by financing activities
We made net repayments of $114 million under our revolving credit facilities in the first half of 2018, reducing our outstanding borrowings on these facilities to $30 million as of June 30, 2018. This compares to a net increase in borrowings of $77 million in the year-ago period primarily to support the completion of the tissue project.
Countervailing duty and anti-dumping investigations
Since October 15, 2015, we were required to pay cash deposits at a subsidy rate of 17.87% for estimated countervailing duties on our U.S. imports of SC paper produced at our Canadian mills. On March 21, 2018, Verso Corporation, the sole remaining U.S. SC paper petitioner, filed a request with the U.S. Department of Commerce (or “Commerce”) for a changed circumstances review to revoke the countervailing duty order, retroactive to August 3, 2015, and for Commerce to refund all countervailing duty deposits with interest. On May 8, 2018, Commerce announced the initiation of a changed circumstances review, and on July 6, 2018, Commerce signed the revocation order. As a result, we will receive a refund of all outstanding cash deposits made on our U.S. imports of SC paper produced at our Canadian mills, plus interest, and no further cash deposits will be required going forward. The refund is expected to be received over the course of the second half of the year. Through June 30, 2018, our cumulative cash deposits, to be refunded, totaled $60 million.
We also became required to pay cash deposits for estimated countervailing duties and anti-dumping duties on our U.S. imports of softwood lumber produced at our Canadian sawmills, since April 28, 2017, and June 30, 2017, respectively. As of December
58
28, 2017, the rates for these estimated countervailing duties and anti-dumping duties were 14.7% and 3.2%, respectively. Based on these rates and our current operating parameters, the cash deposits could be as high as $80 million per year.
Additionally, from January 16, 2018 to May 15, 2018, we were required to make cash deposits at a preliminary subsidy rate of 4.42% for estimated countervailing duties on our U.S. imports of the uncoated groundwood (or “UGW”) paper produced at our Canadian mills, with the exception of SC paper, which was subject to distinct countervailing duties. On August 2, 2018, Commerce changed the rate to 9.81% in its final affirmative determination. The preliminary rate of 4.42% remained in effect until May 15, 2018, and we are not required to pay deposits for countervailing duties on the affected UGW paper imports until the U.S. International Trade Commission (or “ITC”) makes an affirmative material injury determination. Based on the 9.81% rate and our current operating parameters, the cash deposits could be as high as $40 million per year.
On March 13, 2018, Commerce announced its preliminary determination in the UGW anti-dumping investigation, whereby it determined that we did not sell Canadian-origin UGW paper exported to the U.S. for less than fair market value during the relevant period (from July 1, 2016 to June 30, 2017). Commerce confirmed this determination on August 2, 2018, in its final affirmative determination. As a result, we are not required to pay cash deposits to the U.S. Customs and Border Protection agency for anti-dumping duties and will not be subject to administrative review, regardless of the ITC’s outcome and whether Commerce issues an anti-dumping duty order.
See Item 1. Financial Statements – Note 10. Commitments and Contingencies – Legal matters – Countervailing duty and anti-dumping investigations on uncoated groundwood paper; Countervailing duty and anti-dumping investigations on softwood lumber; and Countervailing duty investigation on SC paper for more information.
59
ITEM 3. | QUANTITATIVE AND QUALITATIVE DISCLOSURES ABOUT MARKET RISK |
Information relating to quantitative and qualitative disclosures about market risk is disclosed in Part II, Item 7A, “Quantitative and Qualitative Disclosures About Market Risk,” in our 2017 Annual Report. There have been no material changes in our exposure to market risk as previously disclosed in our 2017 Annual Report.
ITEM 4. | CONTROLS AND PROCEDURES |
(a) Evaluation of Disclosure Controls and Procedures:
We have evaluated the effectiveness of the design and operation of our disclosure controls and procedures, as defined in Rules 13a–15(e) and 15d–15(e) of the Securities Exchange Act of 1934, as of June 30, 2018. Based on that evaluation, the President and Chief Executive Officer and the Senior Vice President and Chief Financial Officer concluded that our disclosure controls and procedures were effective as of such date in recording, processing, summarizing and timely reporting information required to be disclosed in our reports to the SEC.
(b) Changes in Internal Control over Financial Reporting:
In connection with the evaluation of internal control over financial reporting, there were no changes during the period covered by this report that have materially affected, or are reasonably likely to materially affect, our internal control over financial reporting.
60
PART II. | OTHER INFORMATION |
ITEM 1. | LEGAL PROCEEDINGS |
In addition to the legal proceedings presented under Part I, Item 3, “Legal Proceedings,” in our 2017 Annual Report, see the description of our material pending legal proceedings in Note 10, “Commitments and Contingencies – Legal matters,” to our Consolidated Financial Statements, which is incorporated in this “Item 1 – Legal Proceedings” by reference.
ITEM 1A. | RISK FACTORS |
In addition to the other information set forth in this Form 10-Q, you should carefully consider the risk factors set forth under Part I, Item 1A, “Risk Factors” in our 2017 Annual Report, which could materially affect our business, financial condition or future results. There have been no material changes to the risk factors previously disclosed in our 2017 Annual Report.
61
ITEM 6. | EXHIBITS |
Exhibit No. | Description | |
†10.1 | ||
†10.2 | ||
31.1 | ||
31.2 | ||
32.1 | ||
32.2 | ||
101.INS** | XBRL Instance Document. | |
101.SCH** | XBRL Taxonomy Extension Schema Document. | |
101.CAL** | XBRL Taxonomy Extension Calculation Linkbase Document. | |
101.LAB** | XBRL Taxonomy Extension Label Linkbase Document. | |
101.PRE** | XBRL Taxonomy Extension Presentation Linkbase Document. | |
101.DEF** | XBRL Taxonomy Extension Definition Linkbase Document. | |
† | This is a management contract or compensatory plan or arrangement. |
** | Interactive data files furnished with this Form 10-Q, which represent the following materials from this Form 10-Q formatted in XBRL (eXtensible Business Reporting Language): (i) the Consolidated Statements of Operations, (ii) the Consolidated Statements of Comprehensive Income (Loss), (iii) the Consolidated Balance Sheets, (iv) the Consolidated Statements of Changes in Equity, (v) the Consolidated Statements of Cash Flows and (vi) the Notes to Unaudited Interim Consolidated Financial Statements. |
62
SIGNATURES
Pursuant to the requirements of the Securities Exchange Act of 1934, the Registrant has duly caused this Report to be signed on its behalf by the undersigned thereunto duly authorized.
RESOLUTE FOREST PRODUCTS INC. | ||
By | /s/ Jo-Ann Longworth | |
Jo-Ann Longworth | ||
Senior Vice President and Chief Financial Officer | ||
By | /s/ Hugues Dorban | |
Hugues Dorban | ||
Vice President and Chief Accounting Officer | ||
Date: August 9, 2018
63