Attached files
| file | filename |
|---|---|
| EX-99.1 - EXHIBIT 99.1 - Lument Finance Trust, Inc. | tv500585_ex99-1.htm |
| 8-K - FORM 8-K - Lument Finance Trust, Inc. | tv500585_8k.htm |
Exhibit 99.2

Q2 2018 Earnings Supplemental August 2018 Hunt Companies Finance Trust

1 Disclaimer & Name Change This presentation contains forward - looking statements within the meaning of Section 27A of the Securities Act of 1933, as amended, an d Section 21E of the Securities Exchange Act of 1934, as amended, which reflect the current views of Hunt Companies Finance Trust, Inc. (NYSE: HCFT) (“HCFT” or the “Company”) with respect to, among other things, the Company’s operations and financial performance. You can identify these forward - looking statements by the use of words such as “outlook,” “indicator,” “believes,” “expects,” “potential,” “continues,” “may,” “will,” “should,” “seeks,” “approximately,” “predicts,” “in tends,” “plans,” “estimates,” “anticipates” or the negative version of these words or other comparable words. Such forward - looking statements are subject to various risks a nd uncertainties. Accordingly, there are or will be important factors that could cause actual outcomes or results to differ materially from those indicated in these s tat ements. The Company believes these factors include but are not limited to those described under the section entitled “Risk Factors” in its Annual Report on Form 10 - K for t he fiscal year ended December 31, 2017 and the factor described under the section entitled “Risk Factors” in its Quarterly Report on Form 10 - Q for the fiscal quarter e nded June 30, 2018, as such factors may be updated from time to time in its periodic filings with the Securities and Exchange Commission (“SEC”) which are accessible on the SEC’s website at www.sec.gov. These factors should not be construed as exhaustive and should be read in conjunction with the other cautionary statements th at are included in this presentation and in the filings. The Company assumes no obligation to update or supplement forward - looking statements that become untrue because of subsequent events or circumstances. Name Change On January 18, 2018, Hunt Investment Management, LLC assumed management of Five Oaks Investment Corp. ( NYSE : OAKS) ("Five Oaks" or the "Company "). Five Oaks changed its name to Hunt Companies Finance Trust, Inc. , effective May 25, 2018. In addition to the new name , the Company changed its ticker symbols on the NYSE to “HCFT” and “HCFT PR A” and began trading under the new name and ticker symbols on May 29, 2018. Hunt Companies, Inc. is the parent to several Hunt entities, including Hunt Investment Management, the company’s external manager. Collectively, Hunt, its affiliated entities, and underlying owned subsidiary entities shall be hereinafter referred to as “Hunt” unless specifically noted otherwise.

Strength of Ownership / Sponsorship 2 Company Overview Hunt Companies Finance Trust Access to Extensive Loan Origination Platform Experienced Management Team Real estate investment trust focused on transitional multi - family and other commercial real estate loans or securitizations Externally managed by Hunt Investment Management, part of Hunt, a diverse real estate organization Emphasis on floating rate investments which should be well suited for a rising interest rate environment Strong focus on middle - market multifamily sector Strategy Well Positioned for Rising Interest Rates KEY INVESTMENT HIGHLIGHTS Strong Credit and Asset Management Capabilities

3 Q2 2018 Key Highlights Hunt Companies Finance Trust FINANCIALS ▪ GAAP net loss attributable to common stockholders of $22.4 million or $0.94 loss per share for the quarter ▪ GAAP comprehensive income attributable to common stockholders of $1.1 million or $0.05 per share, up $0.07 per share quarter - over quarter ▪ Core earnings attributable to common stockholders of $2.0 million or $0.09 per share, up $0.05 per share quarter - over - quarter ▪ Adjusted Book Value Per Share (1) of $4.64, down $0.01 quarter - over - quarter PORTFOLIO HIGHLIGHTS ▪ During the quarter, the Company divested 100% of its legacy Agency RMBS portfolio, 100% of its Non - Agency RMBS portfolio, 100% of its derivative hedging portfolio, and the majority of its Agency Multifamily MBS positions ▪ In April, the Company purchased 100% of the equity interests of Hunt CMT Equity, LLC in a related party transaction which resulted in the Company acquiring: ▪ $339 million commercial mortgage loan portfolio financed through Hunt CRE 2017 - FL1 ▪ Eight CRE loan participations with an aggregate UPB of $6 million ▪ Lending licenses which enable the Company to originate CRE mortgage loan investments directly INVESTMENT PORTFOLIO OVERVIEW ▪ Total portfolio consisted of $327 million of floating - rate CRE loans, $4 million of Agency Multi - family MBS, and $4 million of residential MSRs ▪ The CRE loan portfolio has a weighted average remaining term of 16 months (2) and a weighted average note rate of L + 4.88% ▪ Hunt continues to evaluate opportunities to monetize its remaining legacy Agency Multifamily MBS position and residential MSRs CAPITALIZATION ▪ The floating - rate senior loan portfolio is financed with $291 million of investment - grade notes issued through the Hunt CRE 2017 - FL1 transaction ▪ As of 6/30/2018, the Company had $73 million of unrestricted cash available for operations and future investments SUBSEQUENT EVENTS ▪ On August 3, 2018, the Company announced the pricing of Hunt CRE 2018 - FL2, Ltd., a $285 million commercial real estate collateralized loan obligation which will be comprised of 20 first lien floating rate commercial real estate mortgage assets which, simultaneous with the closing of Hunt CRE 2018 - FL2, Ltd., will be acquired from an affiliate of our manager. The closing is expected to occur on or about August 20, 2018, subject to customary closing conditions . Note: (1) See Appendix for definition of Adjusted Book Value Per Share. Net book value based on GAAP common stockholders’ equity wa s $ 4.77 per share as of June 30, 2018. (2) If all extensions are exercised by the borrowers, the CRE loan portfolio will have a weighted average remaining term of 37 months.

4 Q2 2018 Earnings Summary Hunt Companies Finance Trust Summary Income Statement (thousands) Three Months Ended June 30, 2018 YTD Through June 30, 2018 Net interest income $4,570 $7,687 Total other income (loss) (1) (23,670) (12,260) Operating expenses (2,390) (5,602) Preferred dividends (871) (1,751) Net income attributable to common stockholders $(22,361) $(11,926) Reclassification adjustment for net gain (loss) included in net income (2) 23,483 12,618 Comprehensive income attributable to common stockholders $1,122 $692 Weighted average shares outstanding during the quarter 23,683,164 23,538,579 Net income per share $(0.94) $(0.51) Comprehensive income per share $0.05 $0.03 GAAP Comprehensive Income to Core Earnings Reconciliation (thousands) Three Months Ended June 30, 2018 YTD Through June 30, 2018 Comprehensive income attributable to common stockholders $1,122 $692 Adjustments: Net economic l osses (gains) attributable to divested legacy assets (3) $(859) $(2,784) Net economic losses (gains) attributable to retained legacy assets (4) 1,287 2,903 Recognized compensation expense related to restricted stock 5 10 Adjustment for consolidated securities 494 1,776 Adjustment for one - time charges (5) - 379 Core earnings (6) $2,049 $2,976 Weighted average shares outstanding during the quarter 23,683,164 23,538,579 Core earnings per share $0.09 $0.13 Dividends per share $0.06 $0.16 Note: (1) Total o ther income (loss) includes realized and unrealized gain (loss) activity for the period. See Appendix for a more detailed bre akd own of YTD gains and losses. (2) Reclassification adjustments for comprehensive income represent the reversal of previously recorded unrealized gains/losses on divested legacy investments that were held available - for - sale . (3) Net economic losses (gains) includes unrealized gains/losses, realized gains/losses, and adjustments to comprehensive inc ome attributable to divested legacy assets. A summary schedule of divested legacy assets is shown on Page 12. (4) Net economic losses (gains) includes unrealized gains/losses and realized gains/losses attributable to retained legacy assets. A summary schedule of retained legacy assets is shown on Page 12. (5) One - time charges relates to expenses incurred in connection with the Hunt transaction. (6) See Appendix for definition of Core E arnings per the Management Agreement .

YTD Through June 30, 2018 (thousands) Net Economic Gain (Loss) (1) Divested Legacy Assets Agency RMBS $(20,152) Agency Multifamily MBS 2,503 Non - Agency RMBS (202) Derivatives Contracts 20,635 Net Economic Gain Attributable to Divested Legacy Assets $2,784 5 Net Economic Gains (Losses) Attributable to Divested Legacy Assets Hunt Companies Finance Trust Note: (1) Net Economic Gain (Loss) reflects the realized gain (loss) on the disposition of the legacy assets net of previously accr ued unrealized gains and losses. A summary schedule of divested legacy assets is shown on Page 12. See Appendix for a more detailed breakdown of YTD gains and losses .
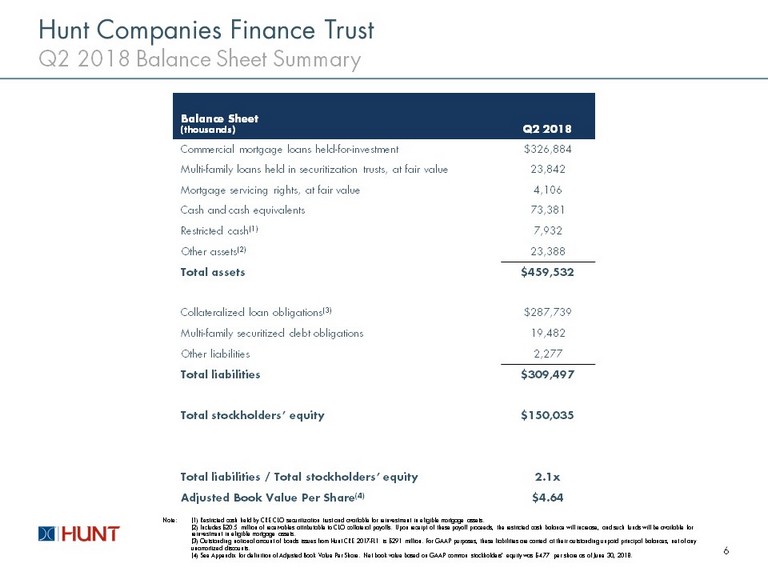
Balance Sheet (thousands) Q2 2018 Commercial mortgage loans held - for - investment $326,884 Multi - family loans held in securitization trusts, at fair value 23,842 Mortgage servicing rights, at fair value 4,106 Cash and cash equivalents 73,381 Restricted cash (1) 7,932 Other assets (2) 23,388 Total assets $459,532 Collateralized loan obligations (3) $287,739 Multi - family securitized debt obligations 19,482 Other liabilities 2,277 Total liabilities $309,497 Total stockholders’ equity $150,035 Total liabilities / Total stockholders’ equity 2.1x Adjusted Book Value Per Share (4) $4.64 6 Q2 2018 Balance Sheet Summary Hunt Companies Finance Trust Note: (1) Restricted cash held by CRE CLO securitization trust and available for reinvestment in eligible mortgage assets. (2) Includes $20.5 million of receivables attributable to CLO collateral payoffs. Upon receipt of these payoff proceeds, the res tricted cash balance will increase, and such funds will be available for reinvestment in eligible mortgage assets. (3) Outstanding notional amount of bonds issues from Hunt CRE 2017 - FL1 is $291 million . For GAAP purposes, these liabilities are carried at their outstanding unpaid principal balances, net of any unamortized discounts. (4) See Appendix for definition of Adjusted Book Value Per Share . Net book value based on GAAP common stockholders’ equity was $4.77 per share as of June 30, 2018.

7 Operating Performance Hunt Companies Finance Trust - $0.29 - $0.13 - $0.06 - $0.02 $0.05 $0.12 $0.11 $0.10 $0.04 $0.09 Q2 2017 Q3 2017 Q4 2017 Q1 2018 Q2 2018 Comprehensive Income/Share Core Earnings/Share $5.27 $4.98 $4.77 $4.65 $4.64 Q2 2017 Q3 2017 Q4 2017 Q1 2018 Q2 2018 The Company continues to reallocate capital into new investment opportunities in the commercial real estate debt space. Comprehensive Income & Core Earnings Per Share of Common Stock Adjusted Book Value Per Share (1) Transition Period Transition Period Note: (1) See Appendix for definition of Adjusted Book Value Per Share. Net book value based on GAAP common stockholders’ equity was $4 .77 per share as of June 30, 2018.

8 Q2 2018 Summary of Investment Portfolio Hunt Companies Finance Trust Investment Portfolio as of June 30, 2018 (thousands) UPB / Notional Net Carrying Value Weighted Average Coupon Weighted Average Remaining Term (months) Weighted Average Initial LTV Weighted Average Stabilized LTV First Mortgages (1) $326,884 $326,884 L + 4.88% 37 71.21% 65.11% Agency Multifamily MBS (2) $8,193 $4,388 L + 2.25% 12 Residential MSRs (3) $428,153 $4,106 0.25% 302 Total $763,230 $335,378 Floating 99% Fixed 1% Interest Rate Type First Mortgages 98% Agency Multifamily MBS 1% Residential MSRs 1% Investment Type $335 million $335 million Note: (1) If all extensions are exercised by the borrowers, the CRE loan portfolio will have a weighted average remaining term of 37 mo nth s. (2) Agency Multifamily MBS shown above on a non - GAAP net equity basis. For GAAP purposes, as of 6/30, the Company determined th at it was the primary beneficiary of the VIEs underlying the trusts and met the criteria for consolidation, and therefore consolidated the entire activity of the securitization trust. (3) The weighted average remaining term of the residential MSR portfolio is based on the maturity dates of the underlying res ide ntial loan pool and excludes the impact of potential borrower prepayments. We anticipate that the weighted average remaining life of the portfolio to be less than 302 months.

9 Q2 2018 CRE Loan Portfolio Activity Hunt Companies Finance Trust $0.0 $347.3 $( 20.4 ) $326.9 Q1 2018 Portfolio Fundings / Acquisitions Pay-offs Q2 2018 Portfolio Multifamily , $308.4 Retail , $22.1 Mixed Use , $12.2 Office , $4.5 Net Funding Activity Q2 2018 Originations/Acquisitions (1) In April, the Company purchased 100% of the equity interests of Hunt CMT Equity, LLC in a related party transaction which resulted in the Company acquiring: ▪ $339 million commercial mortgage loan portfolio financed through Hunt CRE 2017 - FL1 ▪ Eight CRE loan participations with an aggregate UPB of $6 million The Company also funded approximately $1.6 million future funding participation commitments during the period. Note: (1) Originations/Acquisitions includes loans acquired as part of the acquisition of the equity interests in Hunt CMT Equity, LLC $347 million

10 Q2 2018 CRE Loan Portfolio Snapshot Hunt Companies Finance Trust TX , $92.8 AZ , $49.6 CT , $28.1 FL , $26.8 CA , $24.8 Other States , $104.7 Geographic Concentration Multifamily , $288.0 Retail , $22.1 Mixed Use , $12.2 Office , $4.5 Property Type As of 6/30/2018, the Company owned a portfolio of transitional floating - rate commercial mortgage loans with an aggregate UPB of $327 million. As of 6/30, all loans were current. One asset (UPB of $32.8 million) was in Special Servicing as of 6/30 due to a pending maturity default. On July 3, 2018, the loan was paid down to $23.1 million and the maturity was extended for one year. $327 million $327 million

11 Q2 2018 CRE Loan Financing Summary Hunt Companies Finance Trust CRE Loans & Cash $349M Retained Notes / Preferred $58M Class D (BBB) $25M Class C (A) $22M Class B (AA) $23M Class AS (AAA) $17M Class A (AAA) $203M CLO Assets CLO Liabilities Attractive financing cost and effective advance rate Weighted average cost of offered notes is L+1.38%. Sold notes provide 83% leverage to the CLO asset portfolio Stable, long term source of non - recourse debt capital Offered notes are non - recourse and provide match - term financing against the CLO’s commercial real estate assets Managed structure allows for reinvestment of repayments 30 - month reinvestment period through February 2020 As of 6/30/2018, the CLO had reinvestment capacity of $28 million Highlights of Hunt CRE 2017 - FL1 Transaction 1 2 3 CLO ASSETS CLO LIABILITIES ▪ $ 291M Notes offered & sold ▪ Weighted average coupon of L+1.38% ▪ 83% advance rate

12 Q2 2018 Legacy Asset Portfolio Snapshot Hunt Companies Finance Trust During the quarter, the Company divested of 100% of its Agency RMBS portfolio and its Eurodollar futures contracts . The Company continues to evaluate opportunities to monetize its remaining legacy assets in transactions that are accretive to book value. Legacy Assets Divested Of During Q2 2018 (thousands) Notional / Portfolio UPB # of Securities / Contracts Sale Price Net Proceeds (1) Agency RMBS $1,299,711 51 99.05 $44,654 Agency Multifamily MBS 21,940 1 75.68 16,604 Non - Agency RMBS 389,210 4 69.33 1,418 Total $1,710,861 56 $62,676 Remaining Legacy Assets as of Q2 2018 (thousands) Notional / Portfolio UPB Net Carrying Value as of Q2 2018 Stated pay rate Agency Multifamily MBS (2) $8,193 $4,388 L + 2.25% Residential MSRs $428,153 $4,106 0.25% Total $436,346 $8,494 Note: (1) Net of repayments of borrowings under the Company’s repurchase agreements. (2) Agency Multifamily MBS shown above on a non - GAAP net equity basis. For GAAP purposes, as of 6/30, the Company determined that it was the primary beneficiary of the VIEs underlying the trusts and met the criteria for consolidation, and therefore consolidated the entire activity of the securitization trust.
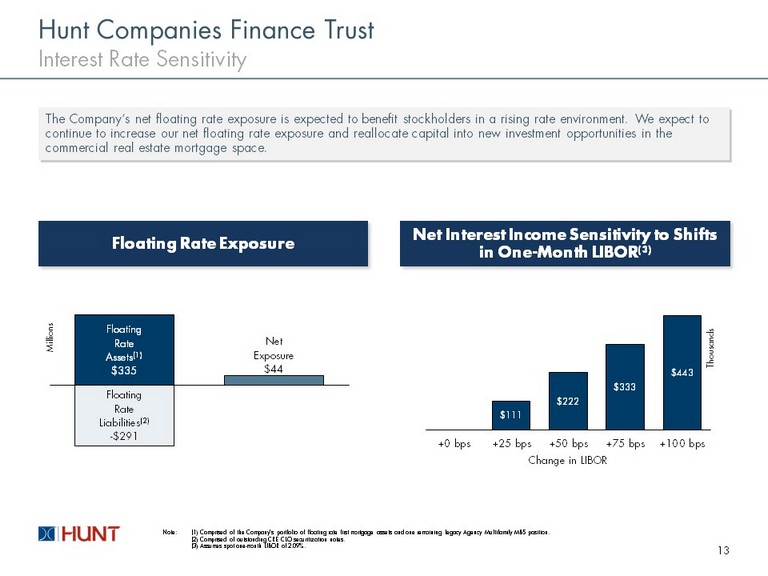
Floating Rate Assets (1) $335 Floating Rate Liabilities (2) - $291 Net Exposure $44 13 Interest Rate Sensitivity Hunt Companies Finance Trust The Company’s net floating rate exposure is expected to benefit stockholders in a rising rate environment. We expect to continue to increase our net floating rate exposure and reallocate capital into new investment opportunities in the commercial real estate mortgage space. $111 $222 $333 $443 +0 bps +25 bps +50 bps +75 bps +100 bps Thousands Change in LIBOR Note: (1) Comprised of the Company’s portfolio of floating rate first mortgage assets and one remaining legacy Agency Multifamily M BS position. (2) Comprised of outstanding CRE CLO securitization notes. (3) Assumes spot one - month LIBOR of 2.09%. Floating Rate Exposure Net Interest Income Sensitivity to Shifts in One - Month LIBOR (3) Millions

APPENDIX 14

15 Q2 2018 CRE Loan Portfolio Details Hunt Companies Finance Trust # Loan Name Closing Date Maturity Date Property Type City State Current Balance Note Spread (1) Initial Term (months) As - Is LTV at Origination Stabilized LTV 1 Loan 1 6/29/2016 7/5/2019 Multifamily Various TX $32,820,000 5.50% 18 70.60% 66.30% 2 Loan 2 11/15/2017 12/4/2020 Multifamily Phoenix AZ 30,505,000 3.75% 36 74.26% 64.36% 3 Loan 3 12/30/2016 1/4/2019 Multifamily Stamford CT 28,125,000 4.75% 24 64.50% 61.30% 4 Loan 4 9/1/2016 9/6/2018 Multifamily Tampa FL 26,800,000 5.50% 24 70.30% 62.30% 5 Loan 5 8/16/2017 9/6/2019 Multifamily League City TX 24,000,000 4.45% 24 76.40% 71.60% 6 Loan 6 4/17/2017 5/6/2020 Multifamily Brookhaven GA 23,488,000 4.75% 36 72.80% 72.70% 7 Loan 7 12/1/2017 12/6/2019 Student Housing Tucson AZ 19,110,000 4.50% 24 80.28% 73.50% 8 Loan 8 9/6/2017 3/6/2019 Multifamily Seattle WA 15,250,000 4.50% 18 54.10% 53.50% 9 Loan 9 10/13/2017 11/6/2020 Multifamily Hattiesburg MS 14,715,000 4.75% 36 78.40% 75.60% 10 Loan 10 11/17/2016 12/6/2019 Multifamily Stockton CA 15,871,183 5.10% 36 76.50% 68.60% 11 Loan 11 5/9/2017 6/6/2020 Retail Austin TX 13,437,757 7.25% 36 67.50% 70.20% 12 Loan 12 9/29/2017 10/6/2020 Multifamily Austell GA 11,658,308 4.15% 36 81.59% 71.88% 13 Loan 13 11/4/2016 11/6/2019 Multifamily Greensboro NC 10,250,000 5.25% 36 83.80% 75.00% 14 Loan 14 1/15/2016 2/6/2019 Mixed - Use Akron OH 12,226,810 5.25% 36 68.70% 37.00% 15 Loan 15 1/9/2018 2/6/2020 Multifamily North Highlands CA 8,960,684 3.95% 24 79.03% 65.26% 16 Loan 16 4/19/2017 5/6/2020 Retail Austin TX 8,691,382 5.15% 36 31.70% 32.80% 17 Loan 17 10/11/2017 11/6/2020 Multifamily New Orleans LA 6,370,000 4.05% 36 75.50% 62.80% 18 Loan 18 11/5/2015 11/5/2018 Multifamily Pascagoula MS 6,035,000 4.50% 36 70.70% 70.70% 19 Loan 19 6/16/2017 7/6/2019 Multifamily Dallas TX 5,625,170 4.75% 24 75.20% 68.40% 20 Loan 20 6/12/2017 7/6/2019 Multifamily Winston - Salem NC 4,675,000 5.95% 24 77.20% 71.40% 21 Loan 21 11/30/2016 12/6/2018 Office Stafford TX 4,526,252 5.50% 24 56.40% 61.00% 22 Loan 22 (2) 1/30/2017 8/6/2018 Multifamily Tyler TX 3,743,000 5.50% 18 58.30% 55.90% Total/Average $326,883,547 4.88% 29 71.21% 65.11% Note: (1 ) All note spreads are indexed to one - month LIBOR. (2) Subsequent to 6/30/2018, the loan’s maturity date was extended to 11/6/2018.
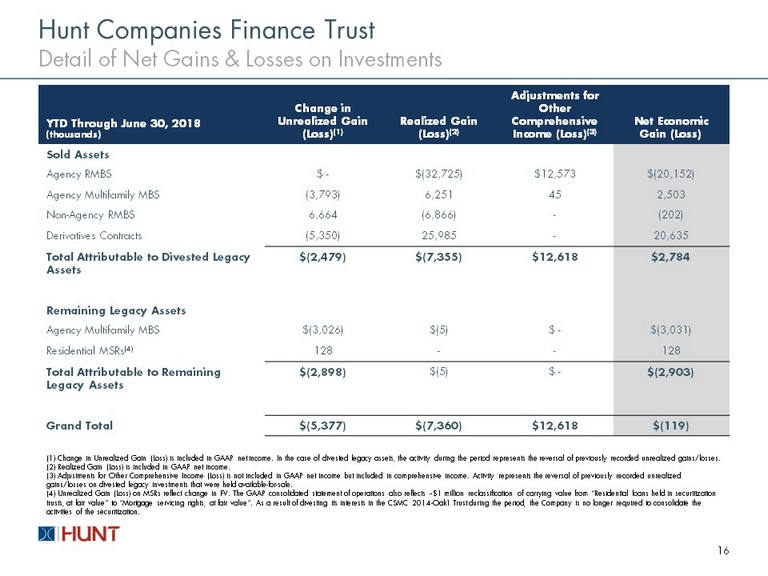
YTD Through June 30, 2018 (thousands) Change in Unrealized Gain (Loss) (1) Realized Gain (Loss) (2) Adjustments for O ther Comprehensive Income (Loss) (3) Net Economic Gain (Loss) Sold Assets Agency RMBS $ - $(32,725) $12,573 $(20,152) Agency Multifamily MBS (3,793) 6,251 45 2,503 Non - Agency RMBS 6,664 (6,866) - (202) Derivatives Contracts (5,350) 25,985 - 20,635 Total Attributable to Divested Legacy Assets $(2,479) $(7,355) $12,618 $2,784 Remaining Legacy Assets Agency Multifamily MBS $(3,026) $(5) $ - $(3,031) Residential MSRs (4) 128 - - 128 Total Attributable to Remaining Legacy Assets $(2,898) $(5) $ - $(2,903) Grand Total $(5,377) $(7,360) $12,618 $(119) 16 Detail of Net Gains & Losses on Investments Hunt Companies Finance Trust (1) Change in Unrealized Gain (Loss) is included in GAAP net income. In the case of divested legacy assets, the activity duri ng the period represents the reversal of previously recorded unrealized gains/losses. (2) Realized Gain (Loss) is included in GAAP net income. (3) Adjustments for Other Comprehensive Income (Loss) is not included in GAAP net income but included in comprehensive income . A ctivity represents the reversal of previously recorded unrealized gains/losses on divested legacy investments that were held available - for - sale. (4) Unrealized Gain (Loss) on MSRs reflect change in FV. The GAAP consolidated statement of operations also reflects ~$1 mill ion reclassification of carrying value from “Residential loans held in securitization trusts, at fair value” to “Mortgage servicing rights, at fair value”. As a result of divesting its interests in the CSMC 2014 - Oa k1 Trust during the period, the Company is no longer required to consolidate the activities of the securitization.

17 Consolidated Balance Sheets Hunt Companies Finance Trust
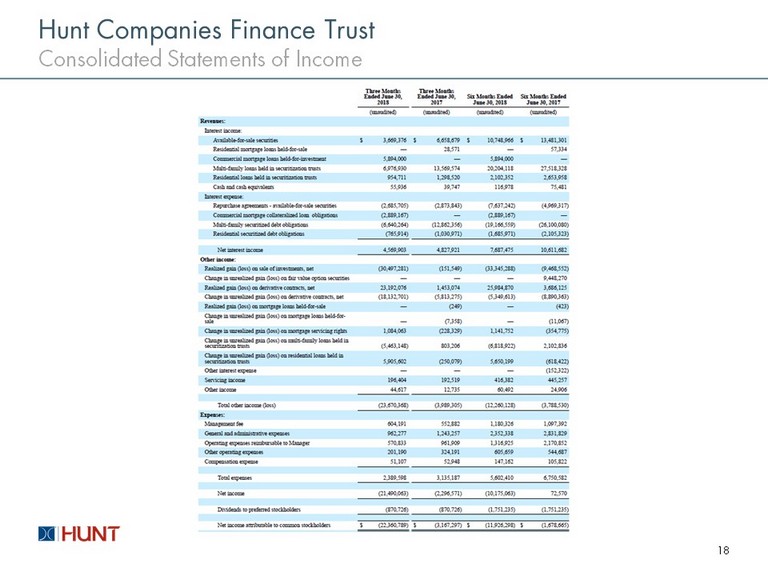
18 Consolidated Statements of Income Hunt Companies Finance Trust

19 Reconciliation of GAAP to Core Earnings Hunt Companies Finance Trust
20 Key Definitions Hunt Companies Finance Trust “ Adjusted Book Value Per Share ” means a non - GAAP metric of common stockholders’ equity per share calculated as: a) total stockholders’ equity computed in accordance with GAAP less the value of the issued and outstanding preferred stock at its stated liquidation preference of $25.00 per share, divided by b) the weighted average number of shares of common stock issued and outstanding during the period. “ Core Earnings ” means the net income (loss) attributable to the holders of Common Shares or, without duplication, owners of the Company’s Subsidiaries, computed in accordance with GAAP, including realized losses not otherwise included in GAAP net income (loss) and excluding (i) non - cash equity compensation expense, (ii) the Incentive Compensation (1) , ( iii) depreciation and amortization, (iv) any unrealized gains or losses or other similar non - cash items that are included in net income for the applicable reporting period, regardless of whether such items are included in other comprehensive income or loss, or in net income, and (v) one - time events pursuant to changes in GAAP and certain materia l non - cash income or expense items after discussions Hunt Investment Management, LLC and the Company’s board of directors and approval by a majority of the Company’s independent directors . “ Stockholder’s Equity ” means: (a) the sum of the net proceeds from any issuances of the Company’s equity securities (excluding preferred securities solely for purposes of Incentive Compensation but including preferred securities for all other purposes of this Ag ree ment) since inception (allocated on a pro rata daily basis for such issuances during the fiscal quarter of any such issuance; plus (b) the Company’ s r etained earnings at the end of such fiscal quarter (without taking into account any non - cash equity compensation expense or other non - cash items des cribed below incurred in current or prior periods); less (c) any amount that the Company pays for repurchases of its Common Shares; and (d ) e xcluding ( i ) any unrealized gains, losses or other non - cash items that have impacted the Company’s Stockholders’ Equity as reported in the Compan y’s financial statements prepared in accordance with GAAP, regardless of whether such items are included in other comprehensive income or l oss , or in net income, and (ii) adjustments relating to one - time events pursuant to changes in GAAP and certain other noncash charges after dis cussions between the Hunt Investment Management, LLC and the Company’s board of directors and approval by a majority of the Company’s ind ependent directors.

22 Case Studies Hunt Companies Finance Trust [Typically others have shown case studies on select recent originations – let’s discuss if we should omit for Q2] Portland, Oregon $14,500,000 MULTIFAMILY Stafford, Texas $4,400,000 OFFICE Dallas, Texas $9,405,000 MULTIFAMILY Akron, Ohio $13,500,000 MIXED USE Fort Worth, Texas $14,750,000 MULTIFAMILY Stamford, Connecticut $28,125,000 MULTIFAMILY Austin, Texas $11,200,000 Kalamazoo, Michigan $9,800,000 RETAIL STUDENT HOUSING