Attached files
| file | filename |
|---|---|
| 8-K - 8-K - FRANKLIN FINANCIAL SERVICES CORP /PA/ | fraf-20180809x8k.htm |

Investor Presentation August 2018 Franklin Financial Services Corporation F&M Trust 1
In order for you to better understand the business of the Company –where we have been and where we plan to go –our remarks today (those of the Company officers who will speak or respond to questions) will include forward-looking statements related to anticipated financial performance, future operating results, business prospects, new products, and similar matters. These statements represent our best judgment, based upon present circumstances and the information now available to us, of what we think may occur in the future –and, it is possible that actual results may differ materially from those we envision today. We assume no duty to update these forward-looking statements made today. For a more complete discussion on the subject of forward-looking statements, including a list of some of the risk factors that might adversely affect future operating results, we refer you to the risk factors and other cautionary statements regarding forward-looking information described in other documents we file from time to time with the Securities and Exchange Commission including our Annual Reports on Form 10-K, Quarterly Reports on Form 10-Q and other filings. Forward-Looking Statements Franklin Financial Services Corporation F&M Trust 2
Overview of Franklin Financial •F&M Trust founded in 1906 •Franklin Financial formed in 1983 •Headquartered in Chambersburg, PA •22 offices throughout Cumberland, Franklin, Fulton and Huntingdon Counties, PA •Total assets of the Company were $1.2 billion as of June 30, 2018 •As of June 30, 2018 Franklin Financial reported $830 million in brokerage and trust assets under management Franklin Financial Services Corporation F&M Trust 3
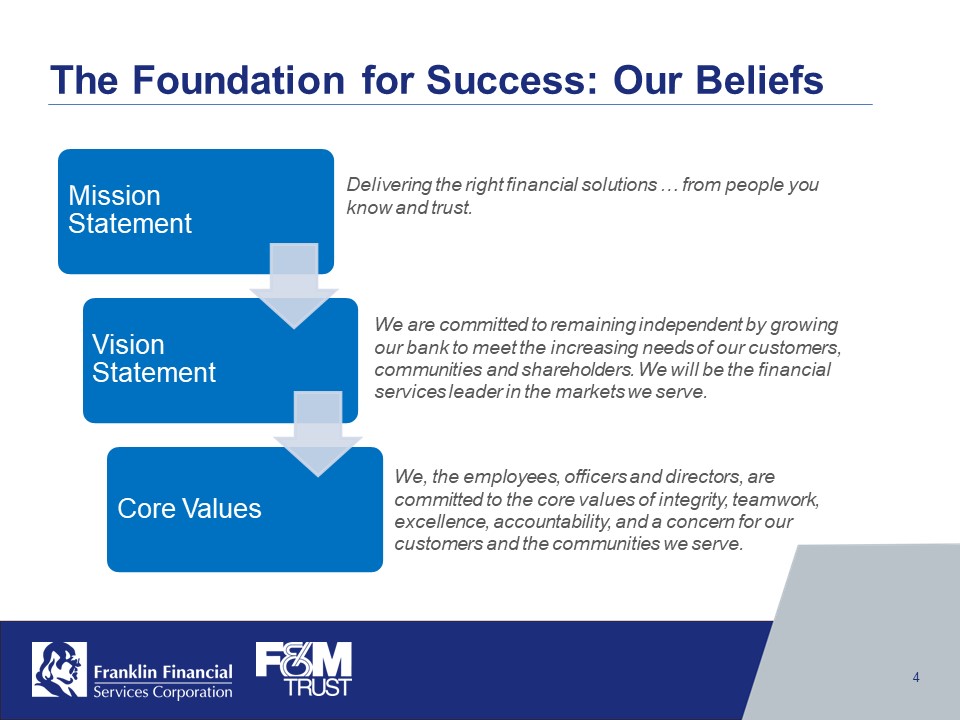
The Foundation for Success: Our Beliefs Mission Statement Delivering the right financial solutions … from people you know and trust. Vision Statement We are committed to remaining independent by growing our bank to meet the increasing needs of our customers, communities and shareholders. We will be the financial services leader in the markets we serve. Core Values We, the employees, officers and directors, are committed to the core values of integrity, teamwork, excellence, accountability, and a concern for our customers and the communities we serve. Franklin Financial Services Corporation F&M Trust 4
Why Franklin Financial? •A market share leader in core deposit, loan and asset management segments in economically strong and growing markets •Deep management team with extensive banking industry and local market knowledge •Consistently strong core operating fundamentals with a diverse revenue mix •Strong capital position, systemically sound risk management and well-positioned balance sheet for rising interest rates •Commitment to enhancing value to our key stakeholder groups Franklin Financial Services Corporation F&M Trust 5
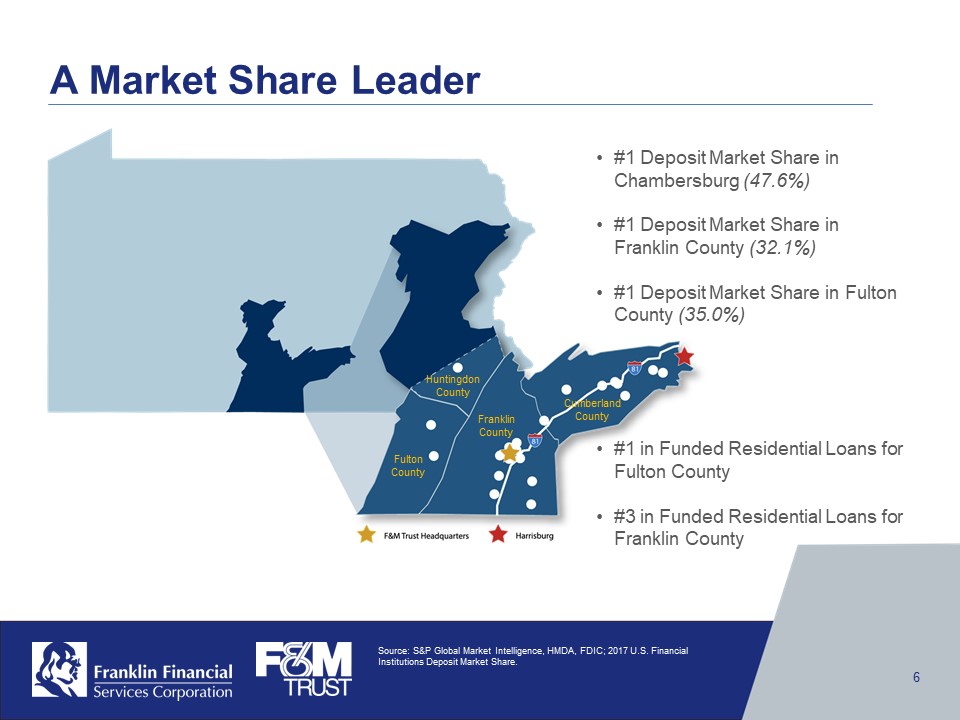
A Market Share Leader •#1 Deposit Market Share in Chambersburg (47.6%) •#1 Deposit Market Share in Franklin County (32.1%) •#1 Deposit Market Share in Fulton County (35.0%) •#1 in Funded Residential Loans for Fulton County •#3 in Funded Residential Loans for Franklin County Fulton County Franklin County Cumberland County Huntingdon County Source: S&P Global Market Intelligence, HMDA, FDIC; 2017 U.S. Financial Institutions Deposit Market Share. Franklin Financial Services Corporation F&M Trust 6
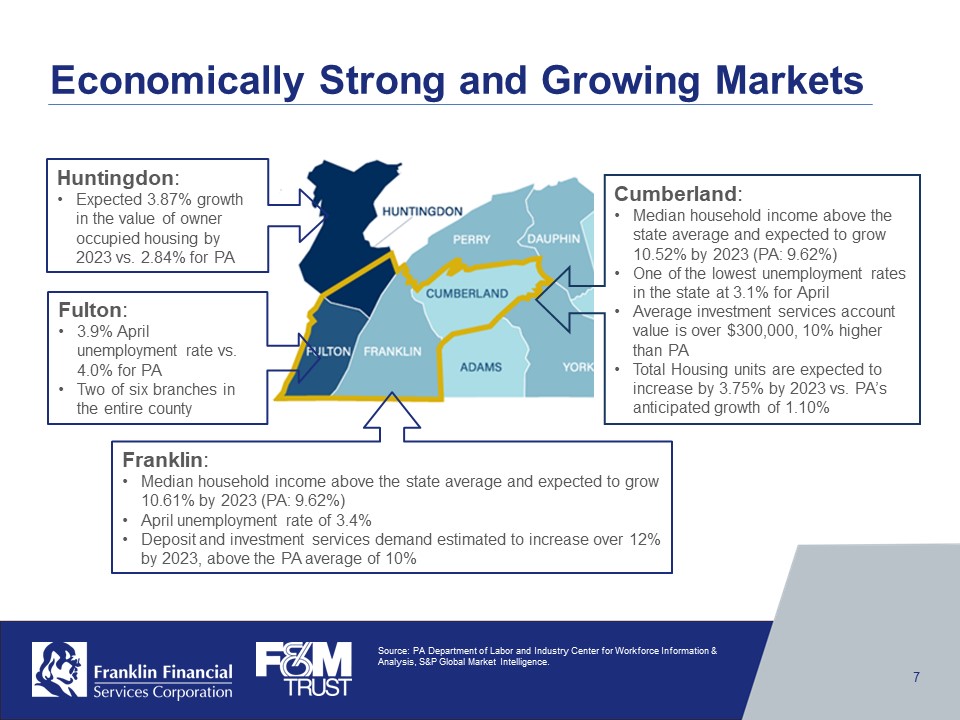
Economically Strong and Growing Markets Huntingdon: •Expected 3.87% growth in the value of owner occupied housing by 2023 vs. 2.84% for PA Fulton: •3.9% April unemployment rate vs. 4.0% for PA •Two of six branches in the entire county Cumberland: •Median household income above the state average and expected to grow 10.52% by 2023 (PA: 9.62%) •One of the lowest unemployment rates in the state at 3.1% for April •Average investment services account value is over $300,000, 10% higher than PA •Total Housing units are expected to increase by 3.75% by 2023 vs. PA’s anticipated growth of 1.10% Franklin: •Median household income above the state average and expected to grow 10.61% by 2023 (PA: 9.62%) •April unemployment rate of 3.4% •Deposit and investment services demand estimated to increase over 12% by 2023, above the PA average of 10% Source: PA Department of Labor and Industry Center for Workforce Information & Analysis, S&P Global Market Intelligence. Franklin Financial Services Corporation F&M Trust 7

A Deep and Cohesive Management Team Patricia A. Hanks Retail Services Timothy G. Henry President & CEO Mark R. Hollar CFO & Treasurer Steven D. Butz Commercial Services Lise M. Shehan Investment & Trust Services Ronald L. Cekovich Technology Services Karen K. Carmack Human Resources Matthew D. Weaver Marketing & Corp. Comm. Lorie Heckman Risk Management Franklin Financial Services Corporation F&M Trust 8
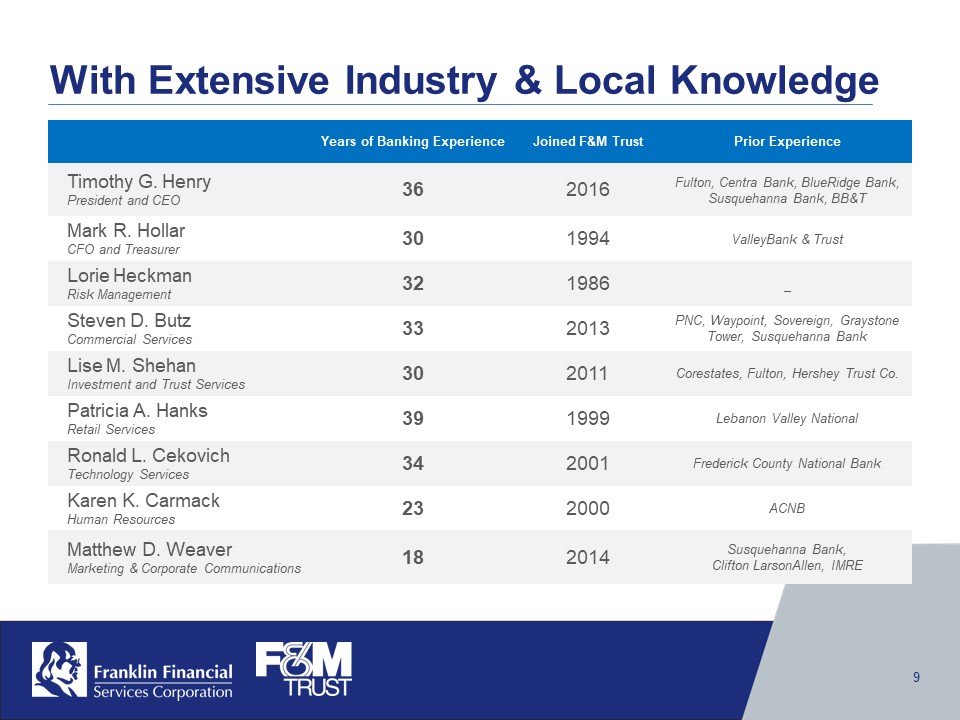
With Extensive Industry & Local Knowledge Years of Banking Experience Joined F&M Trust Prior Experience TimothyG. Henry President and CEO 36 2016 Fulton, CentraBank, BlueRidgeBank, Susquehanna Bank, BB&T Mark R. Hollar CFO and Treasurer 30 1994 Valley Bank& Trust Lorie Heckman Risk Management 32 1986 _ Steven D. Butz Commercial Services 33 2013 PNC, Waypoint,Sovereign, GraystoneTower,Susquehanna Bank Lise M. Shehan InvestmentandTrust Services 30 2011 Corestates, Fulton, Hershey Trust Co. Patricia A. Hanks Retail Services 39 1999 Lebanon Valley National Ronald L. Cekovich Technology Services 34 2001 FrederickCounty National Bank Karen K. Carmack Human Resources 23 2000 ACNB Matthew D. Weaver Marketing& Corporate Communications 18 2014 Susquehanna Bank, Clifton LarsonAllen, IMRE Franklin Financial Services Corporation F&M Trust 9
Financial Performance Themes •Balanced revenue business model •Stable, low cost funding mix and strong liquidity position •A well diversified loan portfolio with an increasing emphasis on small business •Strong core credit quality metrics •Operating efficiencies from ongoing investments in technology and people Franklin Financial Services Corporation F&M Trust 10
Review of Second Quarter 2018 •Earnings (Loss) for the three months ending June 30, 2018 were $(5.2) million and $(1.7) million for the year-to-date period ended June 30, 2018, primarily impacted by an $11.1 million loss due to fraudulent activity related to a loan participation. The activity is believed to be perpetuated by one or more executives and personnel employed by the borrower and its related entities. •Cash dividends per share up $0.03 to $0.27 per share during the second quarter; total cash dividends to be paid during the first three quarters of 2018 increased 13.0% compared to 2017. •The market value of assets under management and held at third-party brokers increased 3.3% to $830.2 million ($695.9 million and $134.4 million, respectively); Investment & Trust Services revenue represents 45% of noninterest income. •While the financial impact of the recent non-recurring events was significant, the Company and Bank remain well-capitalized. At quarter ended June 30, 2018, the total capital ratios are 14.51% and 14.39%, respectively. Franklin Financial Services Corporation F&M Trust 11
Non-Recurring Events Over LTM Ended 6/30/18 •$2.3 million revaluation of DTA as a result of change in tax code -Incurred during Q4 2017 -On going effective tax rate estimated at 12% to 14% •$10.0 million (pre-tax) settlement expense stemming from the 2008 acquisition of Community Trust Company. -Reserve established Q4 2017 -Expense incurred in Q4 2017 -Final settlement was approved by the courts on July 31, 2018 •$11.1 million (pre-tax) fraud expense from loan participation -Worley & Obetz(energy supply) -Fraud detected by lead institution Q2 2018 -$8.7 million of the Participation was charged-off resulting in an increase in the provision for loan loss expense to replenish the allowance for loan losses -In addition, a $2.4 million noninterest expense was recorded to establish a reserve for off balance sheet commitments to the borrower. Franklin Financial Services Corporation F&M Trust 12
Strategic Initiatives to Build Shareholder Value Strengthen Brand Recognition and Awareness Enhance Sales and Service Culture Extend Delivery Channels Deepen Customer Relationships Franklin Financial Services Corporation F&M Trust 13
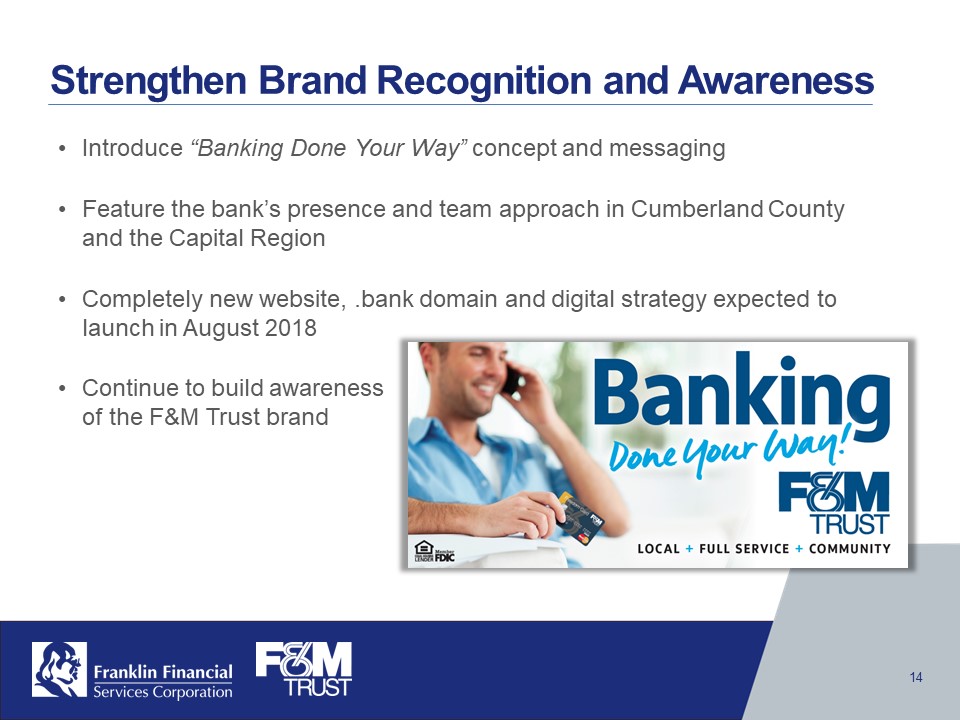
Strengthen Brand Recognition and Awareness •Introduce “Banking Done Your Way” concept and messaging •Feature the bank’s presence and team approach in Cumberland County and the Capital Region •Completely new website, .bank domain and digital strategy expected to launch in August 2018 •Continue to build awareness of the F&M Trust brand Banking Done Your Way! Franklin Financial Services Corporation F&M Trust F&M TRUST Local + Full Service + Community 14
Enhance Sales and Service Culture •Integrated process to continue building sales and service culture •Assessment of sales training program showing quantifiable results •Continuation of in-house “Reach for M.O.R.E.” initiative to improve service levels with external and internal customers •Working across organizational boundaries and breaking down “silos” between departments ANTHONY COLE TRAINING GROUP, LLC REACH FOR MORE Franklin Financial Services Corporation F&M Trust 15
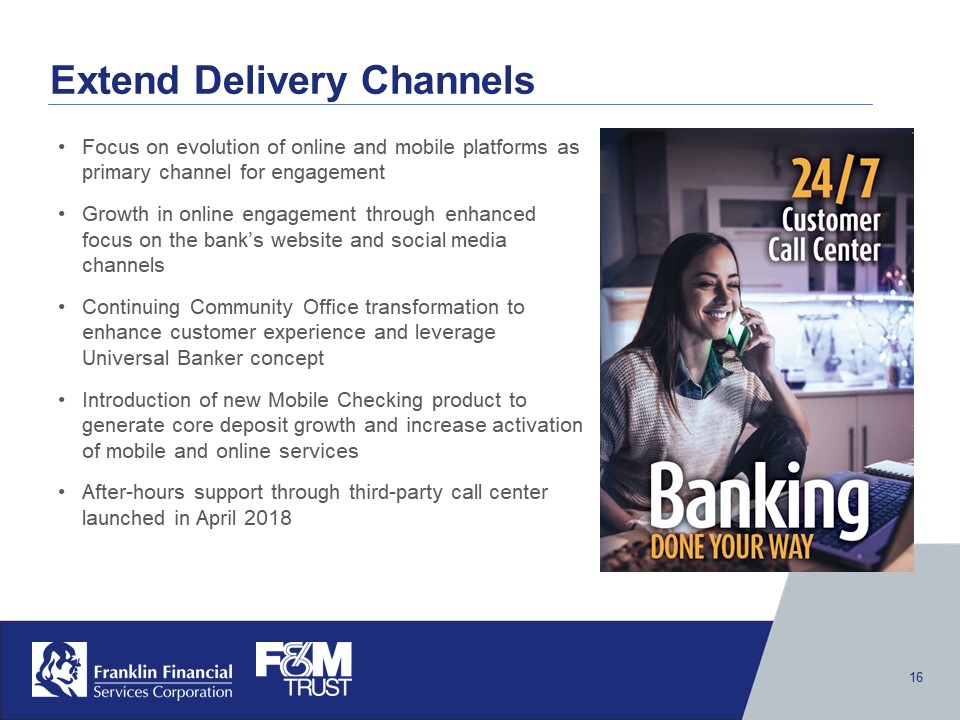
Extend Delivery Channels •Focus on evolution of online and mobile platforms as primary channel for engagement •Growth in online engagement through enhanced focus on the bank’s website and social media channels •Continuing Community Office transformation to enhance customer experience and leverage Universal Banker concept •Introduction of new Mobile Checking product to generate core deposit growth and increase activation of mobile and online services •After-hours support through third-party call center launched in April 2018 24/7 Customer Call Center Banking Done Your Way Franklin Financial Services Corporation F&M Trust 16
Deepen Customer Relationships •Additional resources across all markets to focus on client support and relationship expansion •Creation of Business Banking team to provide small business deposit and loan services •Restructured Treasury Management function to include additional resources in Cumberland County / Capital Region and Franklin County •Restructured Residential Mortgage and Consumer Lending department with new leadership and increased emphasis on originations •Restructured Marketing and Communications function to align resources for sales management and community activity support Franklin Financial Services Corporation F&M Trust 17
Outlook for the Remainder of 2018 •Anticipate core deposit growth in mid single digits, with loan demand to outstrip growth in deposits (increasing the loan/deposit ratio) •Net interest margin expansion of 5 to 8 basis points •Growth in non-interest income (excluding gain on the sale of securities) also in the mid single digits •Continued investment in infrastructure and people to grow the franchise •Strong capital levels and capital adequacy ratios will permit the Company to continue with shareholder value creation •Begin evaluation of Nasdaq listing Franklin Financial Services Corporation F&M Trust 18
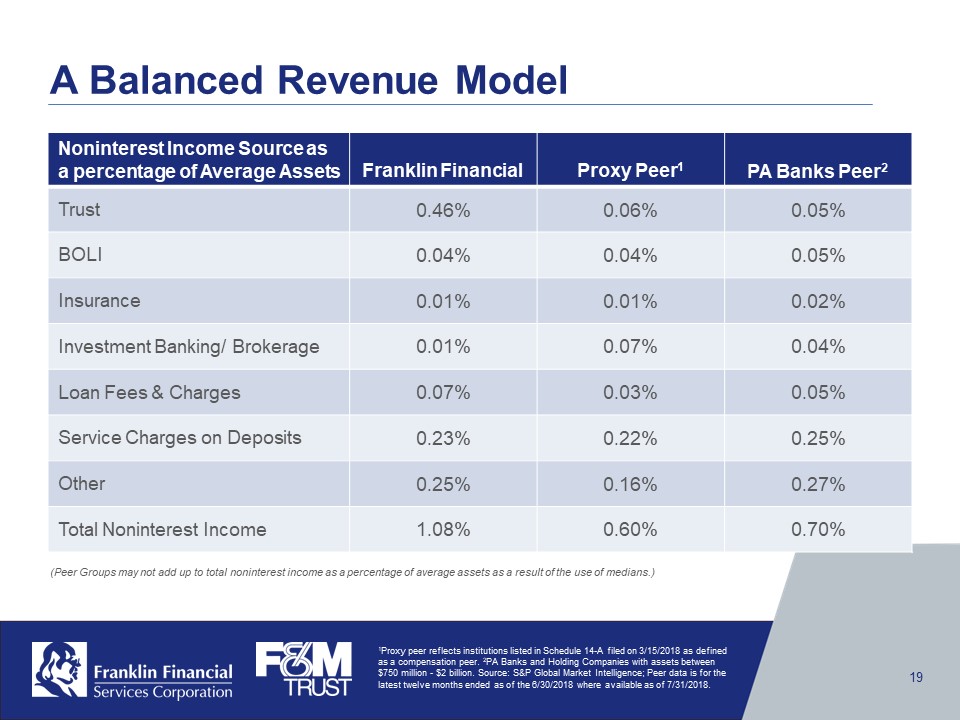
A Balanced Revenue Model Noninterest Income Source as a percentage of Average Assets Franklin Financial Proxy Peer 1 PA Banks Peer 2 Trust 0.46% 0.06% 0.05% BOLI 0.04% 0.04% 0.05% Insurance 0.01% 0.01% 0.02% Investment Banking/ Brokerage 0.01% 0.07% 0.04% Loan Fees & Charges 0.07% 0.03% 0.05% Service Charges on Deposits 0.23% 0.22% 0.25% Other 0.25% 0.16% 0.27% Total Noninterest Income 1.08% 0.60% 0.70% (Peer Groups may not add up to total noninterest income as a percentage of average assets as a result of the use of medians.) 1Proxy peer reflects institutions listed in Schedule 14-A filed on 3/15/2018 as defined as a compensation peer. 2 PA Banks and Holding Companies with assets between $750 million -$2 billion. Source: S&P Global Market Intelligence; Peer data is for the latest twelve months ended as of the 6/30/2018 where available as of 7/31/2018. Franklin Financial Services Corporation F&M Trust 19
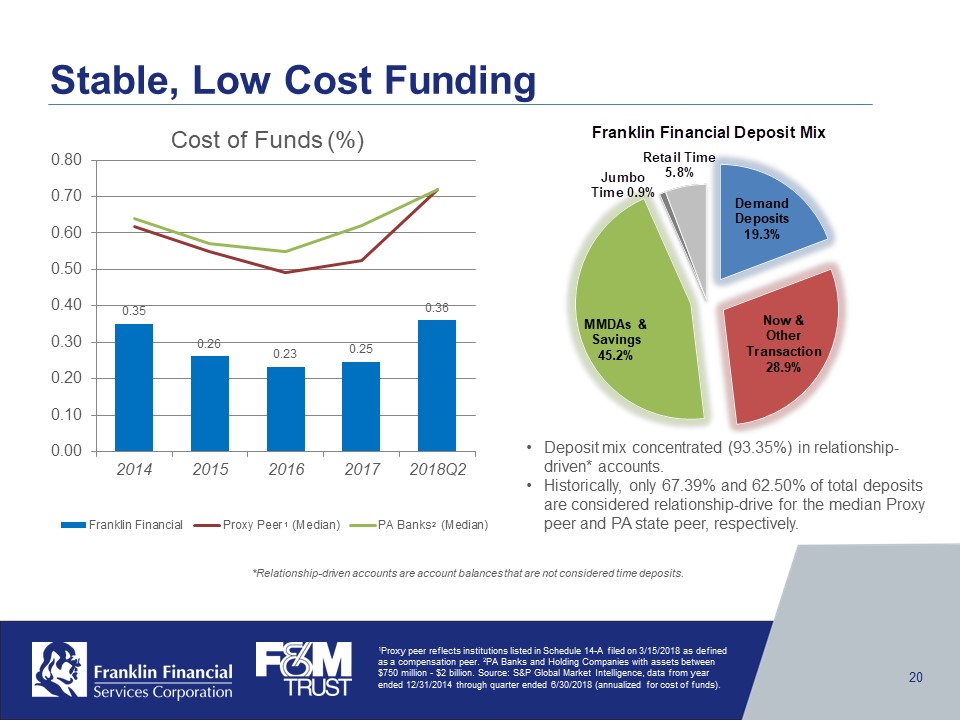
Stable, Low Cost Funding Cost of Funds (%) 0.35 2018 0.26 2015 0.23 2016 0.25 2017 0.36 2018Q2 0.00 0.10 0.20 0.30 0.40 0.50 0.60 0.70 0.80 Franklin Financial Proxy Peer (Median) PA Banks (Median) Franklin Financial Deposit Mix Demand Deposits 19.3% Now & Other Transaction 28.9% MMDAs & Savings 45.2% Jumbo Time 0.9% Retail Time 5.8% •Deposit mix concentrated (93.35%) in relationship- driven* accounts. •Historically, only 67.39% and 62.50% of total deposits are considered relationship-drive for the median Proxy peer and PA state peer, respectively. 1 Proxy peer reflects institutions listed in Schedule 14-A filed on 3/15/2018 as defined as a compensation peer. 2PA Banks and Holding Companies with assets between $750 million -$2 billion. Source: S&P Global Market Intelligence, data from year ended 12/31/2014 through quarter ended 6/30/2018 (annualized for cost of funds). *Relationship-driven accounts are account balances that are not considered time deposits. 1 2 Franklin Financial Services Corporation F&M Trust 20
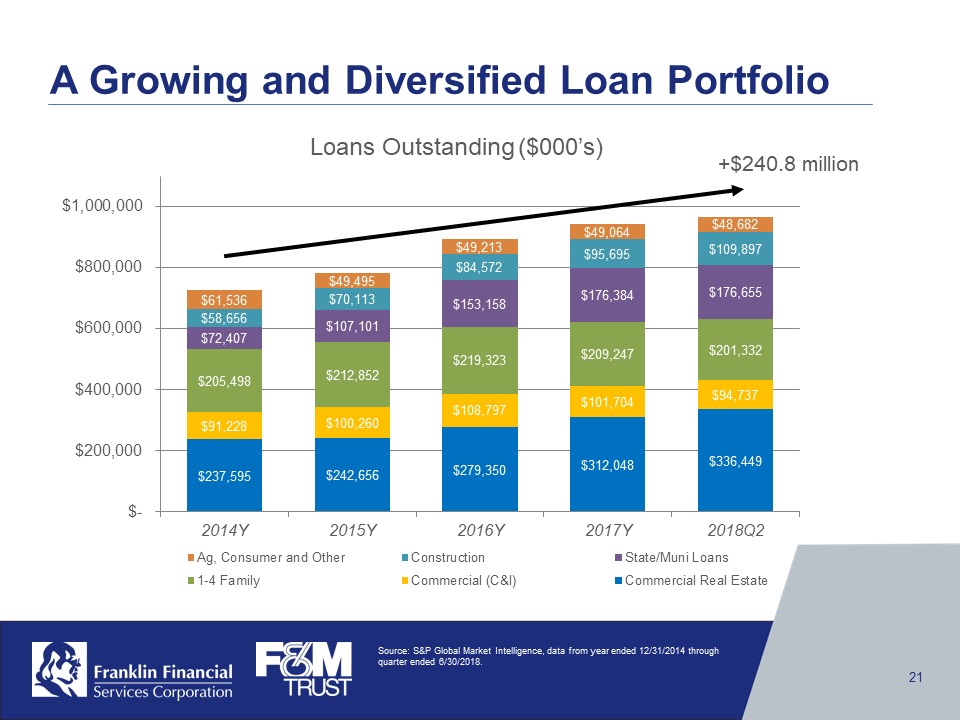
A Growing and Diversified Loan Portfolio Loans Outstanding ($000’s) 2014Y $237,595 $91,228 $205,498 $72,407 $58,656 $61,536 2015Y $242,656 $100,260 $212,852 $107,101 $70,113 $49,495 2016Y $279,350 $108,797 $219,323 $153,158 $84,572 $49,213 2017Y $312,048 $101,704 $209,247 $176,384 $95,695 $49,064 2018Q2 $ 336,449 $94,737 $201,332 $176,655 $109,897 $48,682 $- $200,000 $400,000 $600,000 $800,000 $1,000,000 Ag, Consumer and Other Construction State/Muni Loans 1-4 Family Commercial (C&I) Commercial Real Estate +$240.8 million Source: S&P Global Market Intelligence, data from year ended 12/31/2014 through quarter ended 6/30/2018. Franklin Financial Services Corporation F&M Trust 21
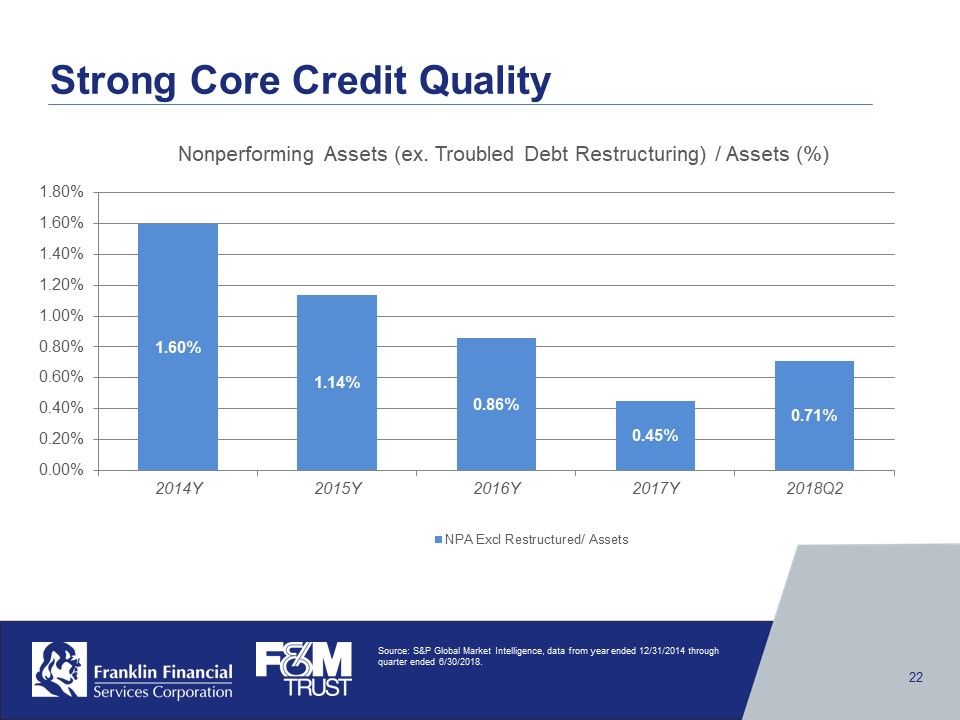
Strong Core Credit Quality Nonperforming Assets (ex. Troubled Debt Restructuring) / Assets (%) 1.60% 2014Y 1.14% 2015Y 0.86% 2016Y 0.45% 2017Y 0.71% 2018Q20.00% 0.20% 0.40% 0.60% 0.80% 1.00% 1.20% 1.40% 1.60% 1.80% NPA Excl Restructured/ Assets Source: S&P Global Market Intelligence, data from year ended 12/31/2014 through quarter ended 6/30/2018. Franklin Financial Services Corporation F&M Trust 22
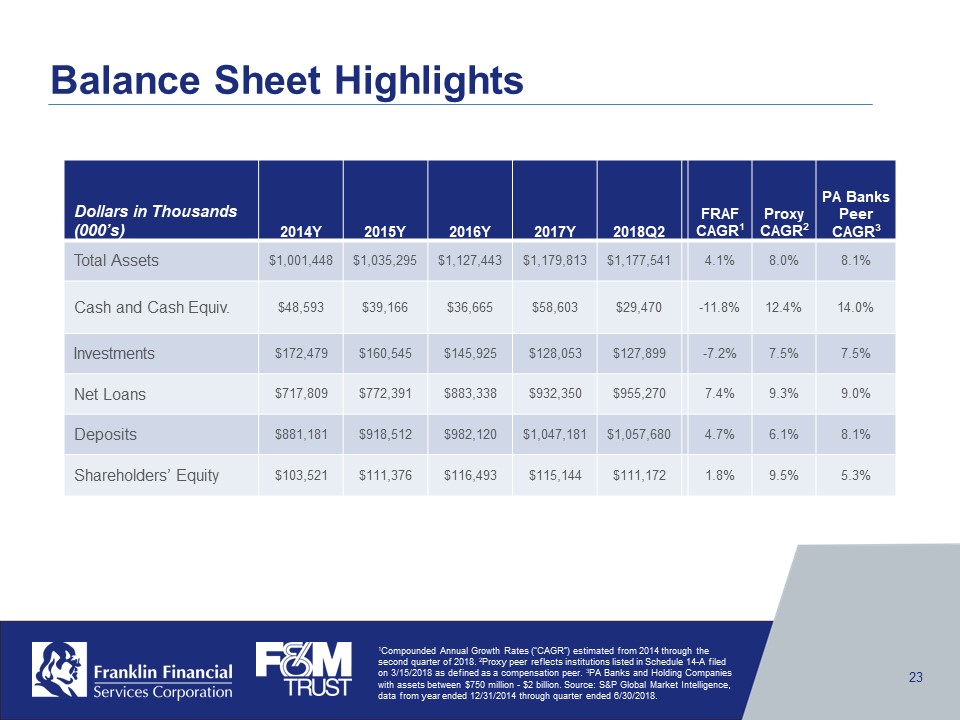
Balance Sheet Highlights Dollars in Thousands(000’s) 2014Y 2015Y 2016Y 2017Y 2018Q2 FRAF CAGR1 Proxy CAGR2 PA Banks Peer CAGR 3 Total Assets $1,001,448 $1,035,295 $1,127,443 $1,179,813 $1,177,541 4.1% 8.0% 8.1% Cash and Cash Equiv. $48,593 $39,166 $36,665 $58,603 $29,470 -11.8% 12.4% 14.0% Investments $172,479 $160,545 $145,925 $128,053 $127,899 -7.2% 7.5% 7.5% Net Loans $717,809 $772,391 $883,338 $932,350 $955,270 7.4% 9.3% 9.0% Deposits $881,181 $918,512 $982,120 $1,047,181 $1,057,680 4.7% 6.1% 8.1% Shareholders’ Equity $103,521 $111,376 $116,493 $115,144 $111,172 1.8% 9.5% 5.3% 1Compounded Annual Growth Rates (“CAGR”) estimated from 2014 through the second quarter of 2018. 2 Proxy peer reflects institutions listed in Schedule 14-A filed on 3/15/2018 as defined as a compensation peer. 3PA Banks and Holding Companies with assets between $750 million -$2 billion. Source: S&P Global Market Intelligence, data from year ended 12/31/2014 through quarter ended 6/30/2018. Franklin Financial Services Corporation F&M Trust 23
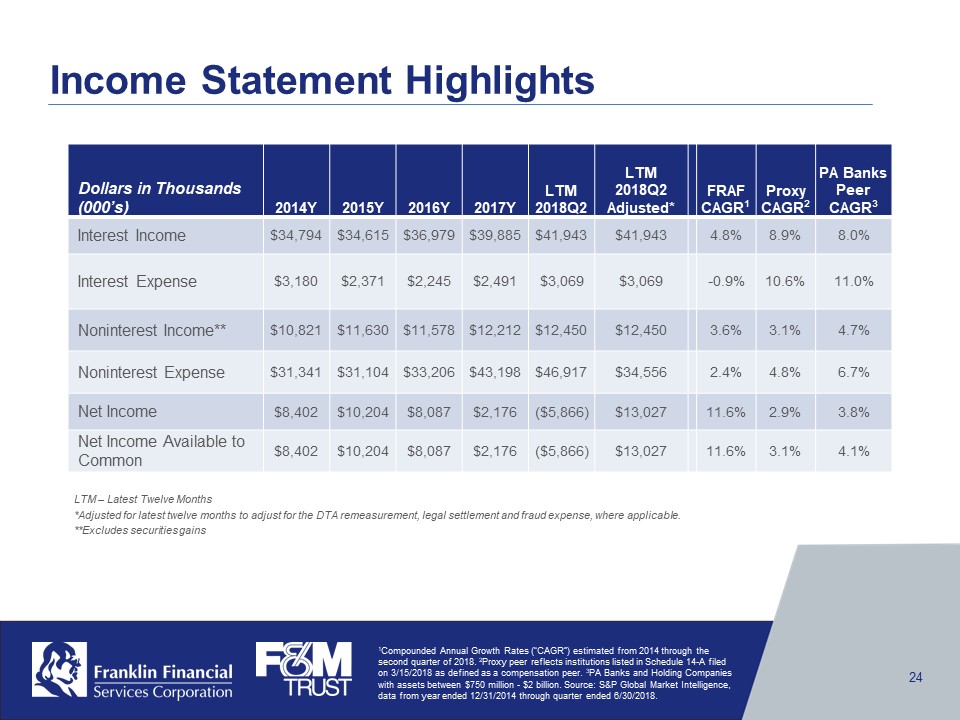
Income Statement Highlights Dollars in Thousands(000’s) 2014Y 2015Y 2016Y 2017Y LTM 2018Q2 LTM 2018Q2 Adjusted* FRAF CAGR 1 Proxy CAGR 2 PA Banks Peer CAGR 3 Interest Income $34,794 $34,615 $36,979 $39,885 $41,943 $41,943 4.8% 8.9% 8.0% Interest Expense $3,180 $2,371 $2,245 $2,491 $3,069 $3,069 -0.9% 10.6% 11.0% Noninterest Income** $10,821 $11,630 $11,578 $12,212 $12,450 $12,450 3.6% 3.1% 4.7% Noninterest Expense $31,341 $31,104 $33,206 $43,198 $46,917 $34,556 2.4% 4.8% 6.7% Net Income $8,402 $10,204 $8,087 $2,176 ($5,866) $13,027 11.6% 2.9% 3.8% Net Income Available to Common $8,402 $10,204 $8,087 $2,176 ($5,866) $13,027 11.6% 3.1% 4.1% 1 Compounded Annual Growth Rates (“CAGR”) estimated from 2014 through the second quarter of 2018. 2Proxy peer reflects institutions listed in Schedule 14-A filed on 3/15/2018 as defined as a compensation peer. 3PA Banks and Holding Companies with assets between $750 million -$2 billion. Source: S&P Global Market Intelligence, data from year ended 12/31/2014 through quarter ended 6/30/2018. LTM –Latest Twelve Months *Adjusted for latest twelve months to adjust for the DTA remeasurement, legal settlement and fraud expense, where applicable. **Excludes securities gains Franklin Financial Services Corporation F&M Trust 24
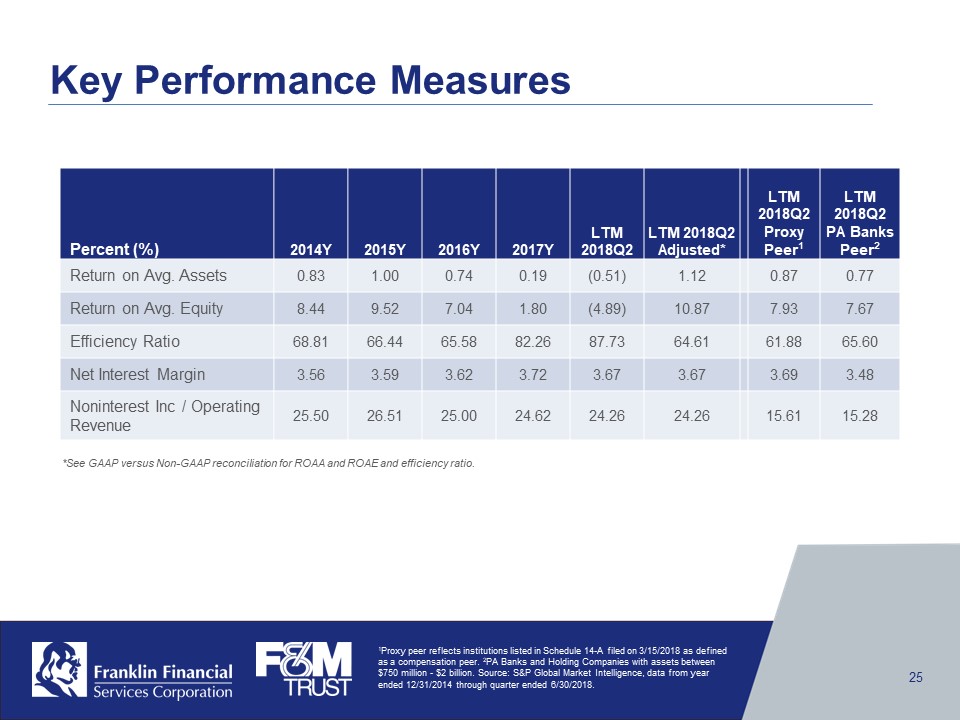
Key Performance Measures Percent (%) 2014Y 2015Y 2016Y 2017Y LTM 2018Q2 LTM 2018Q2 Adjusted* LTM 2018Q2 Proxy Peer 1 LTM 2018Q2 PA Banks Peer 2 Return on Avg. Assets 0.83 1.00 0.74 0.19 (0.51) 1.12 0.87 0.77 Return on Avg. Equity 8.44 9.52 7.04 1.80 (4.89) 10.87 7.93 7.67 Efficiency Ratio 68.81 66.44 65.58 82.26 87.73 64.61 61.88 65.60 Net Interest Margin 3.56 3.59 3.62 3.72 3.67 3.67 3.69 3.48 Noninterest Inc / Operating Revenue 25.50 26.51 25.00 24.62 24.26 24.26 15.61 15.28 1 Proxy peer reflects institutions listed in Schedule 14-A filed on 3/15/2018 as defined as a compensation peer. 2PA Banks and Holding Companies with assets between $750 million -$2 billion. Source: S&P Global Market Intelligence, data from year ended 12/31/2014 through quarter ended 6/30/2018. *See GAAP versus Non-GAAP reconciliation for ROAA and ROAE and efficiency ratio. Franklin Financial Services Corporation F&M Trust 25
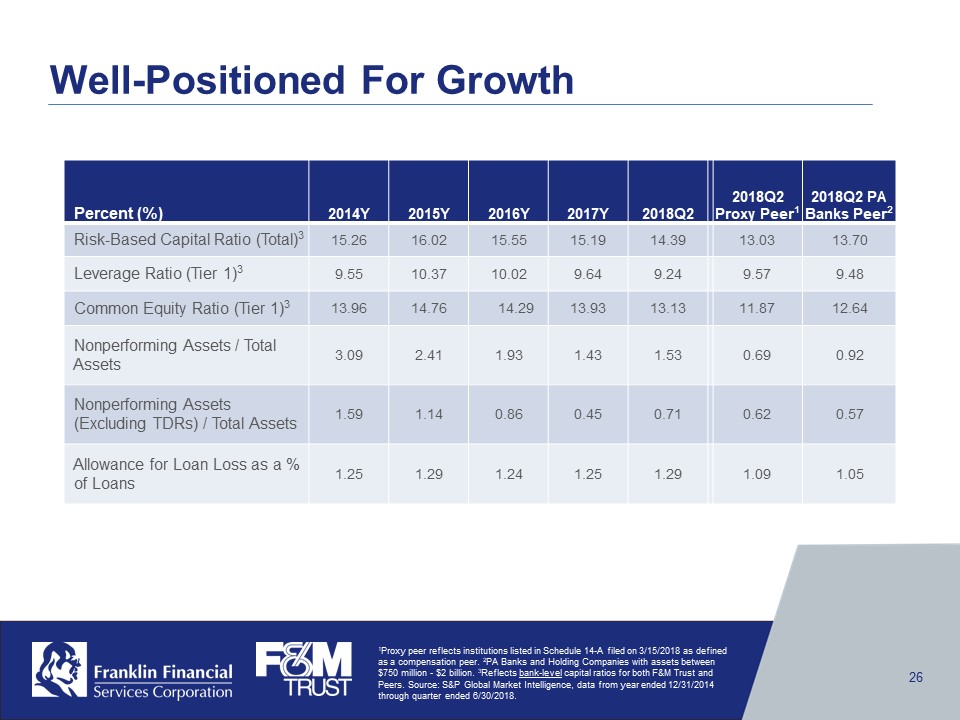
Well-Positioned For Growth Percent (%) 2014Y 2015Y 2016Y 2017Y 2018Q2 2018 Q2 Proxy Peer1 2018Q2 PA Banks Peer 2 Risk-Based Capital Ratio (Total) 3 15.26 16.02 15.55 15.19 14.39 13.03 13.70 Leverage Ratio (Tier 1) 3 9.55 10.37 10.02 9.64 9.24 9.57 9.48 Common Equity Ratio (Tier 1) 3 13.96 14.76 14.29 13.93 13.13 11.87 12.64 Nonperforming Assets / Total Assets 3.09 2.41 1.93 1.43 1.53 0.69 0.92 Nonperforming Assets(Excluding TDRs) / Total Assets 1.59 1.14 0.86 0.45 0.71 0.62 0.57 Allowance for Loan Loss as a % of Loans 1.25 1.29 1.24 1.25 1.29 1.09 1.05 1Proxy peer reflects institutions listed in Schedule 14-A filed on 3/15/2018 as defined as a compensation peer. 2PA Banks and Holding Companies with assets between $750 million -$2 billion.3Reflects bank-level capital ratios for both F&M Trust and Peers. Source: S&P Global Market Intelligence, data from year ended 12/31/2014 through quarter ended 6/30/2018. Franklin Financial Services Corporation F&M Trust 26
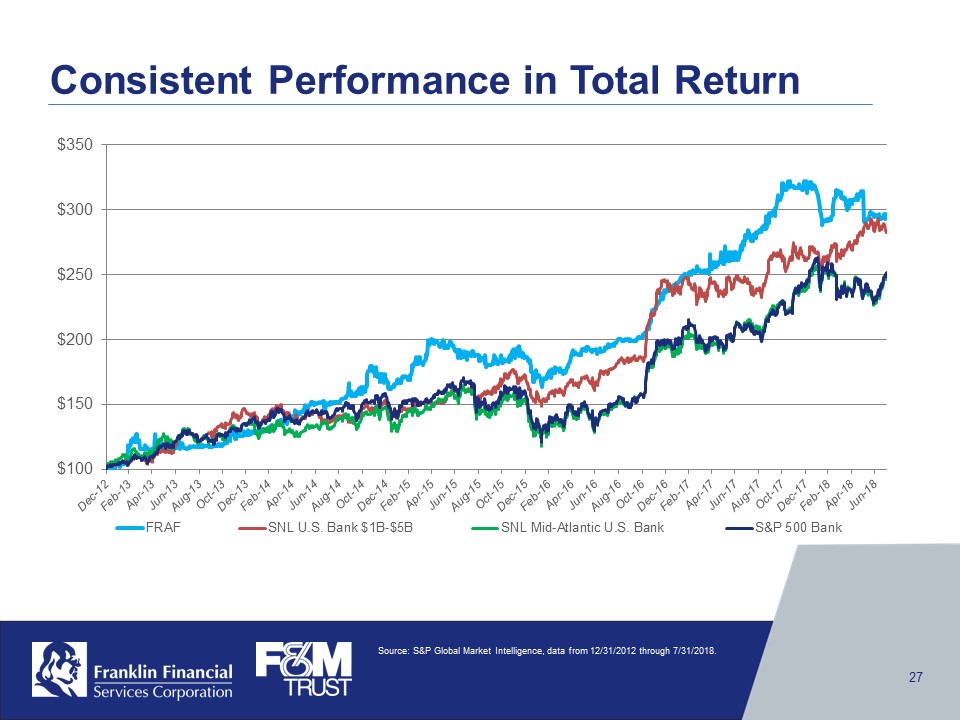
Consistent Performance in Total Return $100 $150 $200 $250 $300 $350 Dec-12 Feb-13 Apr-13 Aug-13 Oct-13 Dec-13 Feb-14 Apr-14 Jun-14 Aug-14 Oct-14 Dec-14 Feb-15 Apr-15 Jun-15 Aug-15 Oct-15 Dec-15 Feb-16 Apr-16 Jun-16 Aug-16 Oct-16 Dec-16 Feb-16 Apr-17 Jun-17 Aug-17 Oct-17 Dec-17 Feb-18 Apr-18 Jun-18 FRAF SNL U.S. Bank $1B-$5B SNL Mid-Atlantic U.S. Bank S&P 500 Bank Source: S&P Global Market Intelligence, data from 12/31/2012 through 7/31/2018. Franklin Financial Services Corporation F&M Trust 27
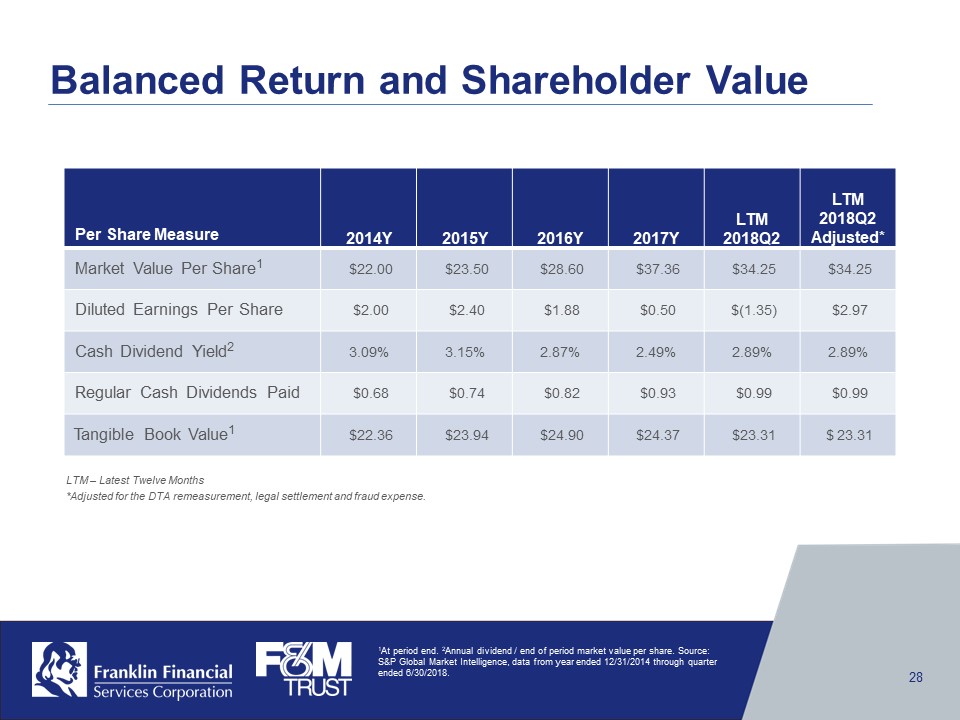
Balanced Return and Shareholder Value Per Share Measure 2014Y 2015Y 2016Y 2017Y LTM 2018Q2 LTM 2018Q2 Adjusted* Market Value Per Share1 $22.00 $23.50 $28.60 $37.36 $34.25 $34.25 Diluted Earnings Per Share $2.00 $2.40 $1.88 $0.50 $(1.35) $2.97 Cash Dividend Yield2 3.09% 3.15% 2.87% 2.49% 2.89% 2.89% Regular Cash Dividends Paid $0.68 $0.74 $0.82 $0.93 $0.99 $0.99 Tangible Book Value1 $22.36 $23.94 $24.90 $24.37 $23.31 $ 23.31 LTM –Latest Twelve Months *Adjusted for the DTA remeasurement, legal settlement and fraud expense. 1 At period end. 2 Annual dividend / end of period market value per share. Source: S&P Global Market Intelligence, data from year ended 12/31/2014 through quarter ended 6/30/2018. Franklin Financial Services Corporation F&M Trust 28
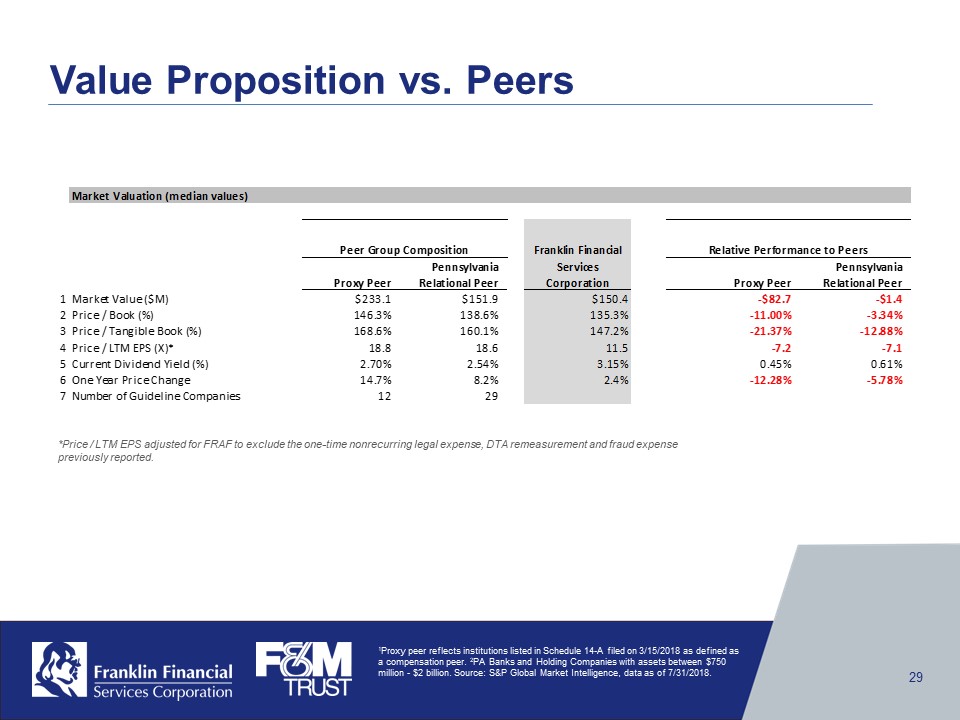
Value Proposition vs. Peers Market Valuation (median values) Proxy Peer Pennsylvania Relational Peer Proxy Peer Pennsylvania Relational Peer Franklin Financial Services Corporation Relative Performance to Peers Peer Group Composition 1 Market Value ($M) $233.1 $151.9 $150.4 -$82.7 -$1.4 2 Price / Book (%) 146.3% 138.6% 135.3% -11.00% -3.34% 3 Price / Tangible Book (%) 168.6% 160.1% 147.2% -21.37% -12.88% 4 Price / LTM EPS (X) * 18.8 18.6 11.5 -7.2 -7.15 Current Dividend Yield (%) 2.70% 2.54% 3.15% 0.45% 0.61% 6 One Year Price Change 14.7% 8.2% 2.4% -12.28% -5.78% 7 Number of Guideline Companies 12 29 *Price/ LTM EPS adjusted for FRAF to exclude the one-time nonrecurring legal expense, DTA remeasurement and fraud expense previously reported. 1 Proxy peer reflects institutions listed in Schedule 14-A filed on 3/15/2018 as defined as a compensation peer. 2PA Banks and Holding Companies with assets between $750 million -$2 billion. Source: S&P Global Market Intelligence, data as of 7/31/2018. Franklin Financial Services Corporation F&M Trust 29
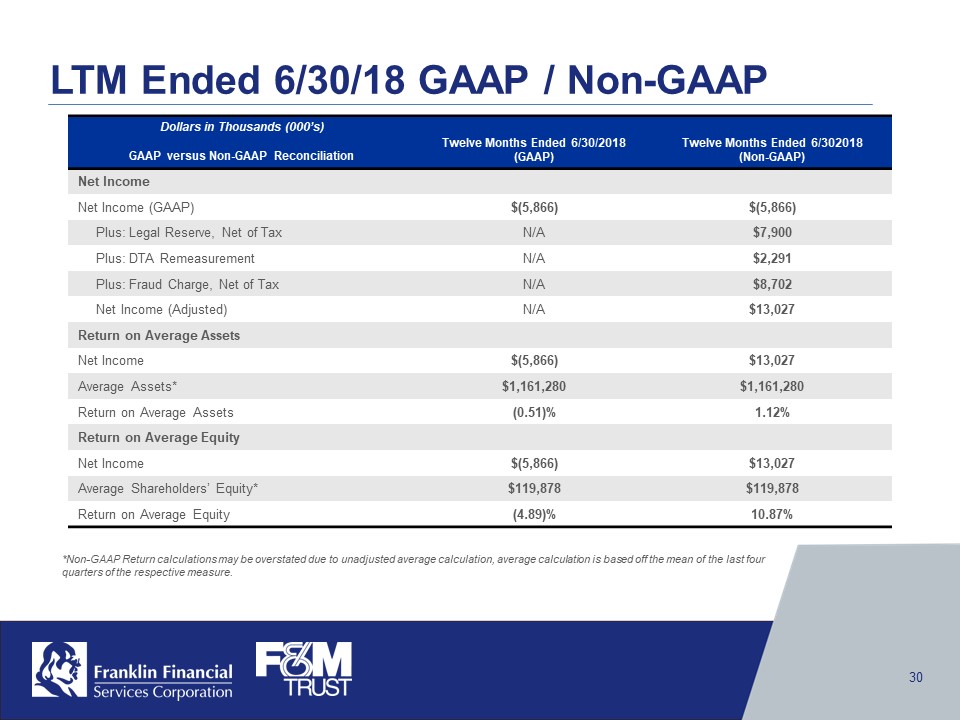
LTM Ended 6/30/18 GAAP / Non-GAAP Dollars in Thousands (000’s) GAAP versus Non-GAAP Reconciliation Twelve Months Ended 6/30/2018 (GAAP) Twelve Months Ended 6/302018 (Non-GAAP) Net Income Net Income (GAAP) $(5,866) $(5,866) Plus: Legal Reserve, Net of Tax N/A $7,900 Plus: DTA Remeasurement N/A $2,291 Plus: Fraud Charge, Net of Tax N/A $8,702 Net Income (Adjusted) N/A $13,027 Return on Average Assets Net Income $(5,866) $13,027 Average Assets* $1,161,280 $1,161,280 Return on Average Assets (0.51)% 1.12% Return on Average Equity Net Income $(5,866) $13,027 Average Shareholders’ Equity* $119,878 $119,878 Return on Average Equity (4.89)% 10.87% *Non-GAAP Return calculations may be overstated due to unadjusted average calculation, average calculation is based off the mean of the last four quarters of the respective measure. Franklin Financial Services Corporation F&M Trust 30
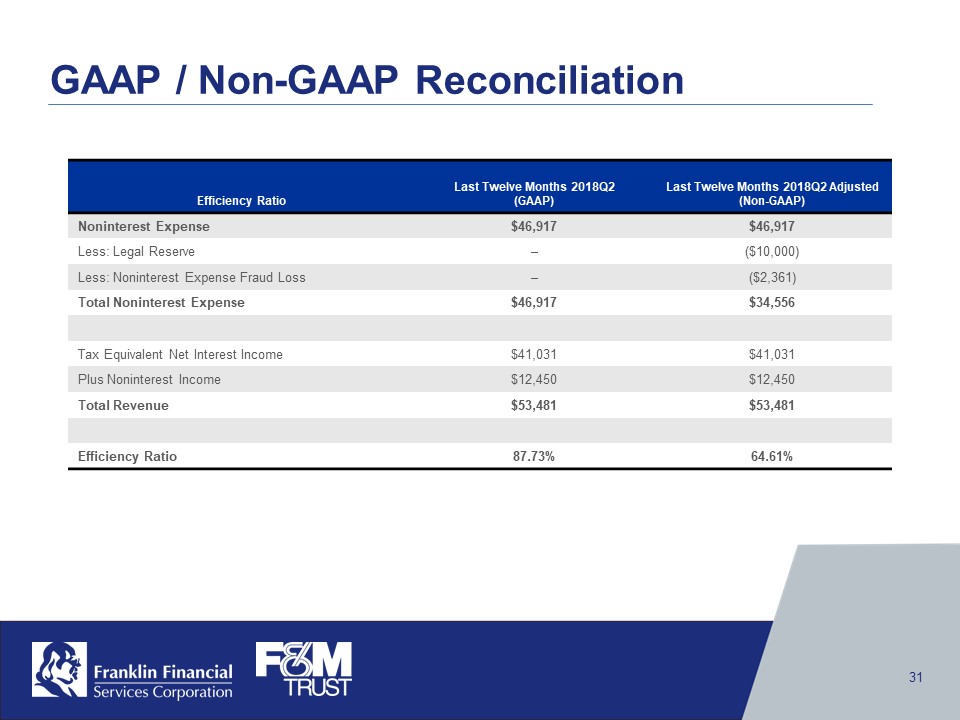
GAAP / Non-GAAP Reconciliation Efficiency Ratio Last Twelve Months 2018Q2 (GAAP) Last Twelve Months 2018Q2 Adjusted (Non-GAAP) Noninterest Expense $46,917 $46,917 Less: Legal Reserve – ($10,000) Less: Noninterest Expense Fraud Loss – ($2,361) Total Noninterest Expense $46,917 $34,556 Tax Equivalent Net Interest Income $41,031 $41,031 Plus Noninterest Income $12,450 $12,450 Total Revenue $53,481 $53,481 Efficiency Ratio 87.73% 64.61% Franklin Financial Services Corporation F&M Trust 31

Thank You Stock Symbol: FRAF(OTCQX) www.franklinfin.com www.fmtrustonline.com Franklin Financial Services Corporation F&M Trust 32