Attached files
| file | filename |
|---|---|
| 8-K - 8-K - FEDERAL AGRICULTURAL MORTGAGE CORP | a2018q2earningsrelease8-k.htm |
| EX-99.1 - EXHIBIT 99.1 - FEDERAL AGRICULTURAL MORTGAGE CORP | a2018q2pressrelease.htm |

Second Quarter Equity Investor Presentation 2018

FARMER MAC Forward-Looking Statements In addition to historical information, this presentation includes forward- NO OFFER OR SOLICITATION OF SECURITIES looking statements that reflect management’s current expectations for This presentation does not constitute an offer to sell or a solicitation of Farmer Mac’s future financial results, business prospects, and business an offer to buy any Farmer Mac security. Farmer Mac securities are developments. Forward-looking statements include, without limitation, offered only in jurisdictions where permissible by offering documents any statement that may predict, forecast, indicate, or imply future available through qualified securities dealers. Any investor who is results, performance, or achievements. Management’s expectations for considering purchasing a Farmer Mac security should consult the Farmer Mac’s future necessarily involve a number of assumptions and applicable offering documents for the security and their own financial estimates and the evaluation of risks and uncertainties. Various factors and legal advisors for information about and analysis of the security, the or events, both known and unknown, could cause Farmer Mac’s actual risks associated with the security, and the suitability of the investment results to differ materially from the expectations as expressed or implied for the investor’s particular circumstances. by the forward-looking statements. Some of these factors are identified and discussed in Farmer Mac’s Annual Report on Form 10-K for the Copyright © 2018 by Farmer Mac. No part of this document may be year ended December 31, 2017, filed with the U.S. Securities and duplicated, reproduced, distributed, or displayed in public in any manner Exchange Commission (“SEC”) on March 8, 2018, Quarterly Report on or by any means without the written permission of Farmer Mac. Form 10-Q for the quarter ended March 31, 2018, filed with the SEC on May 10, 2018, and Quarterly Report on Form 10-Q for the quarter ended June 30, 2018, filed with the SEC on August 9, 2018, which are also available on Farmer Mac’s website (www.farmermac.com). In light of these potential risks and uncertainties, no undue reliance should be placed on any forward-looking statements expressed in this presentation. Any forward-looking statements made in this presentation are current only as of June 30, 2018, except as otherwise indicated. Farmer Mac undertakes no obligation to release publicly the results of revisions to any such forward-looking statements that may be made to reflect new information or any future events or circumstances, except as otherwise mandated by the SEC. The information contained in this presentation is not necessarily indicative of future results. EQUITY INVESTOR PRESENTATION 02
FARMER MAC Use of Non-GAAP Financial Measures This presentation is for general informational purposes only, is current Core earnings and core earnings per share also differ from net income only as of June 30, 2018, and should be read in conjunction with attributable to common stockholders and earnings per common share, Farmer Mac’s Quarterly Report on Form 10-Q filed with the SEC on respectively, by excluding specified infrequent or unusual transactions August 9, 2018. In the accompanying analysis of its financial that Farmer Mac believes are not indicative of future operating results and information, Farmer Mac uses the following non-GAAP financial that may not reflect the trends and economic financial performance of measures: core earnings, core earnings per share, and net effective Farmer Mac's core business. spread. Farmer Mac uses these non-GAAP measures to measure Farmer Mac uses net effective spread to measure the net spread Farmer corporate economic performance and develop financial plans because, Mac earns between its interest-earning assets and the related net funding in management's view, they are useful alternative measures in costs of these assets. Net effective spread differs from net interest understanding Farmer Mac's economic performance, transaction income and net interest yield because it excludes: (1) the amortization of economics, and business trends. The non-GAAP financial measures premiums and discounts on assets consolidated at fair value that are that Farmer Mac uses may not be comparable to similarly labeled non- amortized as adjustments to yield in interest income over the contractual GAAP financial measures disclosed by other companies. Farmer Mac's or estimated remaining lives of the underlying assets; (2) interest income disclosure of these non-GAAP financial measures is intended to be and interest expense related to consolidated trusts with beneficial supplemental in nature, and is not meant to be considered in isolation interests owned by third parties, which are presented on Farmer Mac's from, as a substitute for, or as more important than, the related financial consolidated balance sheets as “Loans held for investment in information prepared in accordance with GAAP. consolidated trusts, at amortized cost;” and (3) beginning January 1, Core earnings and core earnings per share principally differ from net 2018, the fair value changes of financial derivatives and the corresponding income attributable to common stockholders and earnings per assets and liabilities designated in a fair value hedge relationship. Net common share, respectively, by excluding the effects of fair value effective spread also principally differs from net interest income and net fluctuations. These fluctuations are not expected to have a cumulative interest yield because it includes: (1) the accrual of income and expense net impact on Farmer Mac's financial condition or results of operations related to the contractual amounts due on financial derivatives that are not reported in accordance with GAAP if the related financial instruments designated in hedge relationships; and (2) effective in fourth quarter 2017, are held to maturity, as is expected. the net effects of terminations or net settlements on financial derivatives and hedging activities. EQUITY INVESTOR PRESENTATION 03

FARMER MAC Table of Contents 05 Executive Summary 13 Farmer Mac Overview 22 Appendix EQUITY INVESTOR PRESENTATION 04

Executive Summary

FARMER MAC Farmer Mac Overview Farmer Mac initially chartered Farmer Mac was created in response to the 1987 by Congress as an instrumentality agricultural credit crisis of the 1980s of the United States • Increases access to and reduces the cost of capital for the benefit of American agricultural and rural First major charter revision communities 1996 and expansion of authority • Provides financial solutions to a broad spectrum of the (direct loan purchases) agricultural community Lines of Business Outstanding business volume • Farm & Ranch 1998 reaches $1 billion • USDA Guarantees • Rural Utilities • Institutional Credit First listed 1999 on NYSE (AGM & AGM.A) Diverse Product Suite Second major charter revision • Loan purchases and expansion of authority • Wholesale financing 2008 (Rural Utilities) • Credit protection Outstanding business volume reaches $10 billion 2015 Outstanding business volume reaches $15 billion EXECUTIVE SUMMARY 06

FARMER MAC Agricultural Real Estate Mortgage Market Structure (1) (2) AS OF DECEMBER 31, 2017 NON-FCS FARM CREDIT SYSTEM (GSE) AG LENDERS Cooperative Secondary Market W HOLESALE FINANCING COMPANIES INSURANCE $14.3 Billion $8B (3) $20B {9.0% Eligible Market Share} COBANK Nationwide LOAN SALES CREDIT CREDIT PROTECTION s PROTECTION AG BANKS AG $8B $61B Southwest FCB OF TX Addressable $81 $81 Billion Agriculture Mortgage Market Mortgage Mortgage 73 RETAIL ACA Financing Financing $159 Billion(3) $35B Midwest AGRIBANK $71 Billion$71 NON LENDERS FCS FUNDING CORPORATION {Farmers & Ranchers} $13B - BANK $9B Southeast AGFIRST FINANCIAL INVESTORS (Developing Market) | various institutional investors investing in agricultural assets (and seeking leverage) (1) Eligible ag real estate mortgage market structure shown here includes the forecast for outstanding unpaid principal balance of first lien ag mortgage assets as of December 31, 2017 reduced by forty percent to estimate the outstanding unpaid principal balance of loans that would not be eligible under Farmer Mac’s lines of business. EXECUTIVE SUMMARY (2) Source: FDIC Call Reports (ag banks), FCA Call Report Data, and Federal Reserve Board of Governors (insurance companies and Farm Service Agency portion of non-bank lenders) data as of December 2017. USDA, Economic Research Service forecast for remaining non-bank lenders for year-end 2017 on a prorated basis. All non-FCS and FCS data adjusted for estimates of 07 eligibility under Farmer Mac’s lines of business. (3) Sum of FCS, non-FCS, and Farmer Mac first lien ag real estate mortgage assets does not add up to the total due to the nature of Farmer Mac’s business model.

FARMER MAC Agricultural Industry Dashboard Farm Income (1) Commodity Index(2)(3) $140 10-year Average 400 $120 $85 billion 300 $100 $80 200 $60 INDEX $ IN BILLIONS $ IN 100 $40 297 195 200 240 182 219 170 179 164 184 $20 $124 $92 $81 $61 $64 0 $0 2013 2014 2015 2016 2017 2013 2014 2015 2016 2017F Feed Grains Prices Received Index Livestock Prices Received Index Land Value (2)(4) 90-Day Delinquencies(5) 10-year Average 10-year Average $3,200 $2,602 1.60% 1.35% $3,100 1.40% $3,000 1.20% $2,900 1.00% $2,800 0.80% $2,700 0.60% $ PER ACRE $ PER $2,600 $2,500 0.40% $2,400 $2,730 $2,950 $3,020 $3,010 $3,080 0.20% 1.23% 0.90% 0.80% 1.08% 1.05% $2,300 0.00% 2013 2014 2015 2016 2017 2013 2014 2015 2016 2017 (1) Source: USDA, Economic Research Service, nominal dollars (as of February 2018). (2) Source: USDA, National Agricultural Statistics Service, nominal dollars (as of March 2018). EXECUTIVE SUMMARY (3) Commodity prices indexed according to 1999 base year as 100. (4) Land values per acre include all farm and pasture land, irrigated and non-irrigated, as well as building and improvement values. 08 (5) Source: FDIC Call Report Data & Farm Credit Funding Corp Annual Information Statements – Non-accrual real estate loans and accruing loans that are 90 days or more past due made by commercial and Farm Credit System banks (as of March 2018).

FARMER MAC Farmer Mac Dashboard Core Earnings(1) (2) Net Effective Spread (1) (2) $70 92 $60 90 $50 88 $40 86 $30 84 BASIS POINTS BASIS $ IN MILLIONS $ IN $20 $10 82 $47.0 $53.5 $65.6 $41.2 85 84 91 88 $0 80 2015 2016 2017 2Q18 YTD 2015 2016 2017 2Q18 YTD Outstanding Business Volume 90-Day Delinquencies (3) (Farm & Ranch Line of Business Only) $25 80 $20 60 $15 40 $10 BASIS POINTS BASIS $ IN BILLIONS $ IN 20 $5 $15.9 $17.4 $19.0 $19.5 56 34 71 61 $0 0 FY15 FY16 FY17 2Q18 FY15 FY16 FY17 2Q18 (1) Core earnings and net effective spread are non-GAAP measures. For more information on the use of these non-GAAP measures, please see page 3. For a reconciliation of core earnings to GAAP net income attributable to common stockholders and a reconciliation of net effective spread to GAAP net interest income, please refer to pages 37 and 39 of the Appendix, respectively. (2) Periods prior to fourth quarter 2017 have been recast to reflect the revised methodology for calculating net effective spread that became effective in fourth quarter 2017, as further described on page 3. EXECUTIVE SUMMARY (3) Delinquencies include loans held and loans underlying off-balance sheet Farm & Ranch Guaranteed Securities and Long-term Standby Purchase Commitments (LTSPCs) that are 90 days or more past due, in foreclosure, or in bankruptcy with at least one missed payment, excluding loans performing under either their original loan terms or a court-approved bankruptcy plan. 09
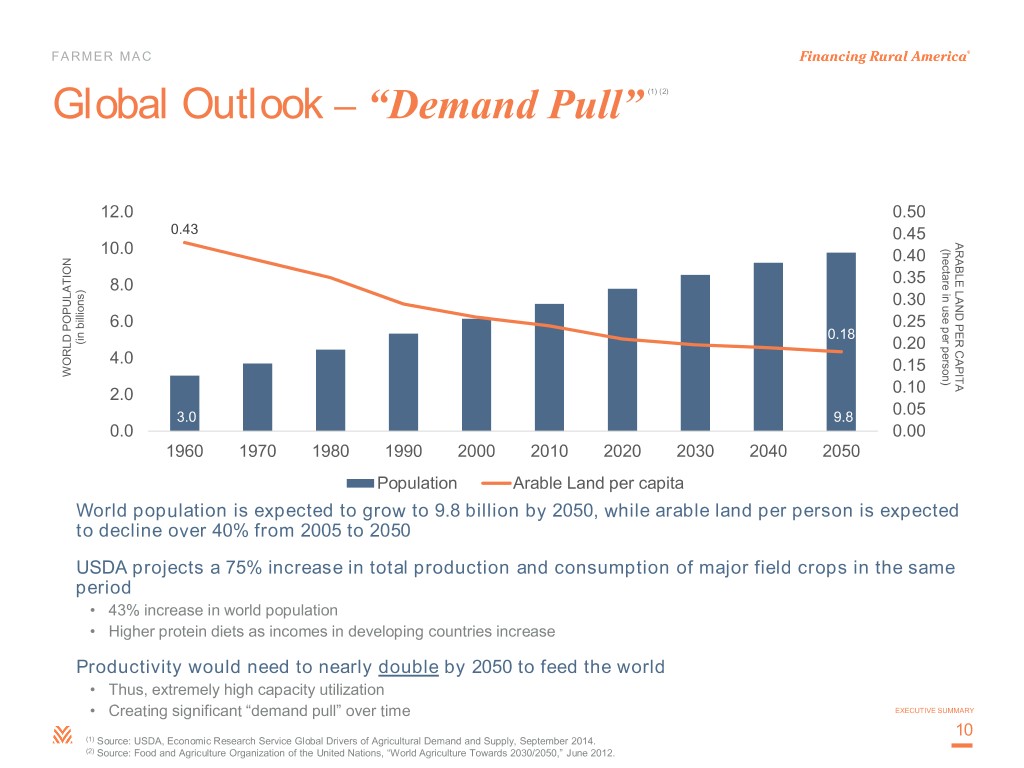
FARMER MAC Global Outlook – “Demand Pull” (1) (2) 12.0 0.50 0.43 0.45 ARABLE LAND PER CAPITA 10.0 0.40 (hectare use in perperson) 8.0 0.35 0.30 6.0 0.25 0.18 (in billions) (in 0.20 4.0 0.15 WORLD POPULATION WORLD 2.0 0.10 3.0 9.8 0.05 0.0 0.00 1960 1970 1980 1990 2000 2010 2020 2030 2040 2050 Population Arable Land per capita World population is expected to grow to 9.8 billion by 2050, while arable land per person is expected to decline over 40% from 2005 to 2050 USDA projects a 75% increase in total production and consumption of major field crops in the same period • 43% increase in world population • Higher protein diets as incomes in developing countries increase Productivity would need to nearly double by 2050 to feed the world • Thus, extremely high capacity utilization • Creating significant “demand pull” over time EXECUTIVE SUMMARY 10 (1) Source: USDA, Economic Research Service Global Drivers of Agricultural Demand and Supply, September 2014. (2) Source: Food and Agriculture Organization of the United Nations, “World Agriculture Towards 2030/2050,” June 2012.

FARMER MAC Historical Dividend Growth $0.70 $0.60 $0.58 $0.50 Initiated New Dividend Policy: Target ~30% Payout Ratio of Core $0.40 Earnings Over Time $0.36 $0.30 $ PER SHARE $ PER $0.26 $0.20 $0.16 $0.14 $0.12 $0.10 $0.10 $0.05 $0.00 2011 2012 2013 2014 2015 2016 2017 2018 Quarterly Dividend per Share per Year EXECUTIVE SUMMARY 11

FARMER MAC Farmer Mac’s Investment Highlights •Rigorous underwriting standards Quality Assets •Low delinquencies •Low cumulative historical credit losses •Finance assets through issuance of low-cost public debt Funding Advantage •Issue at narrow, GSE spreads to U.S. Treasuries •Robust worldwide demand for agricultural products Growth Prospects •Increase market share through business development efforts •Significant wholesale financing opportunities •Overhead / outstanding business volume ~ 20 bps Operational Efficiency •Outstanding business volume ~$200 million per employee (95 employees) •Core earnings growth Consistent Returns •Core earnings return on equity greater than 15% •Dividend policy targeted at growing payouts of core earnings to ~ 30% by end of 2018 EXECUTIVE SUMMARY 12

Farmer Mac Overview

FARMER MAC Farmer Mac’s Unique Market Position Farmer Mac enjoys a unique position, sharing in upside opportunity in strong markets and benefiting from downside protection and increased relative demand in weak markets Strong Market – Farmer Mac can participate in the upside • Situation: Credit is healthy, transaction volumes are high, and capital is plentiful • Impacts on Farmer Mac: – Farmer Mac can benefit from higher industry volumes and healthy credit – However, when farm income is high and capital is plentiful, the relative value of access to GSE capital may be marginally lower – Earnings can benefit from lower credit costs, but spreads may be tighter Weak Market – Farmer Mac can benefit from loss protection and increased demand due to tighter credit conditions • Situation: Declining farm income, land values, and credit quality; less access to capital • Impacts on Farmer Mac: – Farmer Mac can benefit from loss protection given its unique diversified geographic/commodity portfolio and its conservative underwriting standards – Farmer Mac can also benefit from the greater relative value of GSE capital in tighter credit market conditions – However, in bear markets, no entity will be immune to declining credit quality, although spreads may be more favorable FARMER MAC OVERVIEW 14

FARMER MAC Farmer Mac’s Downside Protection Conservative underwriting with significant focus on repayment strength and low LTVs • Total Debt Coverage (TDC) ratio of at least 1.25x • Generally maximum LTVs of 60% to 70%, but in practice average 40% to 45% on mortgages purchased • Require minimum borrower net equity of 50% across all agricultural assets • Significant scrutiny given to property access and access to water, among other items Farmer Mac credits less likely to default as compared to the broader industry • Farmer Mac is generally recognized as having the tightest credit requirements for ag mortgage loans • Primary focus on repayment capacity through stressed input assumptions during underwriting process • Farmer Mac is not a “lender of last resort” • Farm Credit Administration is a strong safety and soundness regulator Farmer Mac credits less likely to incur losses even when a default occurs • Given Farmer Mac’s portfolio average LTV of 45% as of June 30, 2018, average farm asset value losses would need to be in excess of 55% to begin to generate the first dollar of loss to Farmer Mac – Farmer Mac’s “stress scenario losses” of farm asset values range from 17% to 48% for various regions (1) – The 1980s agricultural credit crisis saw farm asset values decline approximately 23% from peak to trough FARMER MAC OVERVIEW (1) Source: USDA, National Agricultural Statistics Service (as of August 2015). 15

FARMER MAC Lines of Business and Products AS OF JUNE 30, 2018 Product Type Customers Lines of Business $ IN BILLIONS AND PERCENTAGE OF TOTAL VOLUME LOAN PURCHASES • Ag Banks F & R USDA RU IC Total • FCS Institutions $4.4 $2.4 $1.0 -- $7.8 • Insurance Companies 22% 12% 5% 40% • Rural Utilities Cooperatives WHOLESALE FINANCING • Ag Banks -- -- -- $8.4 $8.4 • Ag Investment Funds • AgVantage 43% 43% • Insurance Companies • Farm Equity AgVantage • Production and Agribusiness Companies • Rural Utilities Cooperatives CREDIT PROTECTION • FCS Institutions $2.6 -- $0.7 -- $3.3 • Ag Banks • Long-term Standby Purchase 14% 4% 17% Commitments (LTSPCs)/ • Insurance Companies AMBS Guarantees • Ag Investment Funds • Rural Utilities Cooperatives = Allowances and provisions recorded on these assets Total $7.0 $2.4 $1.7 $8.4 $19.5 Note: Table may not sum to total due to rounding FARMER MAC OVERVIEW 16

FARMER MAC Farm & Ranch Loan Portfolio Diversification(1) AS OF JUNE 30, 2018 By Commodity Type By Geographic Region Ag. Storage Southeast and Processing 8% Northwest 1% 12% Northeast Part-time 4% Farm 7% Mid- Livestock 19% South 13% Crops Southwest 53% Mid- 31% North Permanent Plantings 32% 20% FARMER MAC OVERVIEW (1) Farm & Ranch portfolio includes on-balance sheet loans held and loans underlying LTSPCs. 17

FARMER MAC Core Earnings(1) – Direct Function of Three Factors Factors Things to Consider BUSINESS VOLUME • Macro supply/demand for ag credit • Farmer Mac business development success • Impact of potential credit quality shocks • Impact of potential rate shocks NET EFFECTIVE SPREAD (1) • Macro supply/demand for ag credit • Absolute level of interest rates • Business mix • Delinquencies CREDIT QUALITY • Idiosyncratic borrower impacts: death in family, divorce, and disease • Commodity price volatility • Acts of nature: droughts, disease, etc. FARMER MAC OVERVIEW (1) Core earnings and net effective spread are non-GAAP measures. For more information on the use of hese non-GAAP measures, please see page 3. For a reconciliation of core 18 earnings to GAAP net income attributable to common stockholders and a reconciliation of net effective spread to GAAP net interest income, please refer to pages 36-39 of the Appendix.

FARMER MAC Farmer Mac Outstanding Business Volume $25 11.2% CAGR (2000 to 2017) $19.5 $20 $15 $ IN BILLIONS $ IN $10 $5 $0 2000 2001 2002 2003 2004 2005 2006 2007 2008 2009 2010 2011 2012 2013 2014 2015 2016 2017 2Q18 FARMER MAC OVERVIEW 19
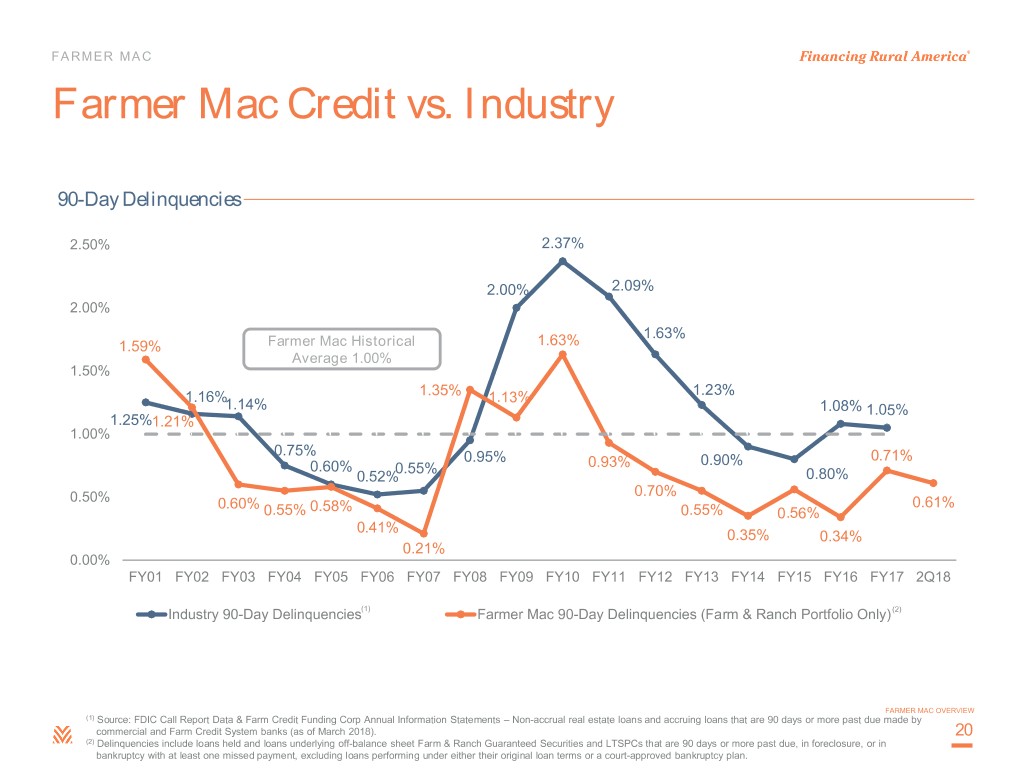
FARMER MAC Farmer Mac Credit vs. Industry 90-Day Delinquencies 2.50% 2.37% 2.00% 2.09% 2.00% 1.63% 1.59% Farmer Mac Historical 1.63% Average 1.00% 1.50% 1.16% 1.35% 1.13% 1.23% 1.14% 1.08% 1.05% 1.25%1.21% 1.00% 0.75% 0.95% 0.90% 0.71% 0.60% 0.55% 0.93% 0.52% 0.80% 0.70% 0.50% 0.60% 0.61% 0.55% 0.58% 0.55% 0.56% 0.41% 0.35% 0.34% 0.21% 0.00% FY01 FY02 FY03 FY04 FY05 FY06 FY07 FY08 FY09 FY10 FY11 FY12 FY13 FY14 FY15 FY16 FY17 2Q18 Industry 90-Day Delinquencies(1) Farmer Mac 90-Day Delinquencies (Farm & Ranch Portfolio Only) (2) FARMER MAC OVERVIEW (1) Source: FDIC Call Report Data & Farm Credit Funding Corp Annual Information Statements – Non-accrual real estate loans and accruing loans that are 90 days or more past due made by commercial and Farm Credit System banks (as of March 2018). 20 (2) Delinquencies include loans held and loans underlying off-balance sheet Farm & Ranch Guaranteed Securities and LTSPCs that are 90 days or more past due, in foreclosure, or in bankruptcy with at least one missed payment, excluding loans performing under either their original loan terms or a court-approved bankruptcy plan.
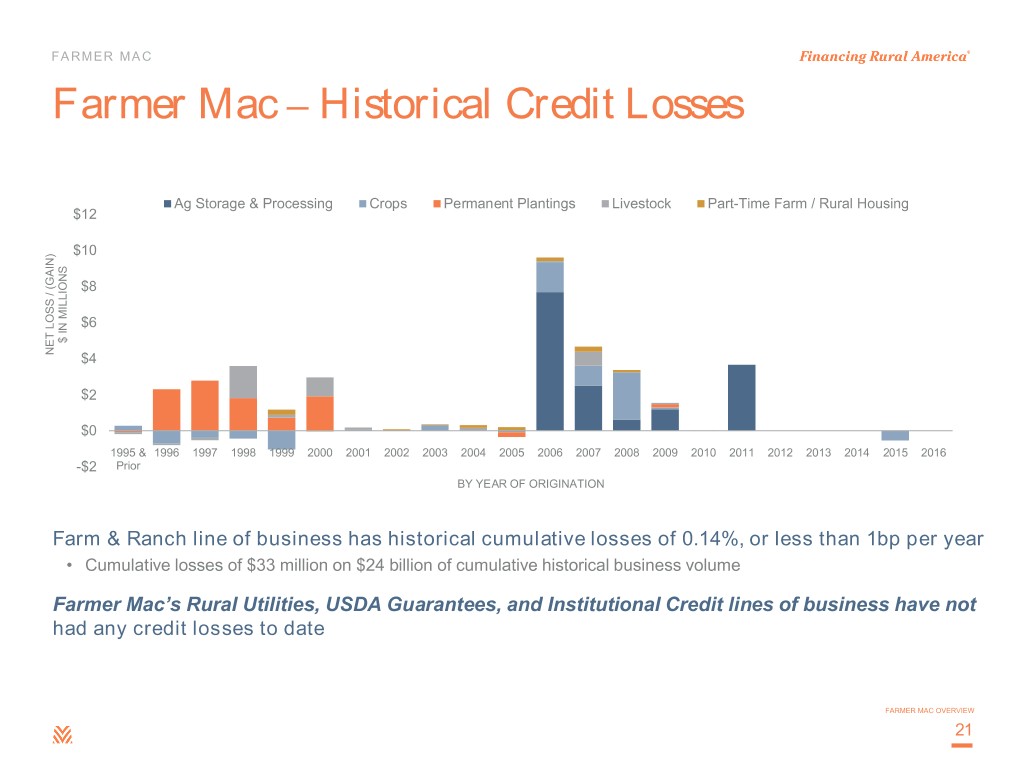
FARMER MAC Farmer Mac – Historical Credit Losses Ag Storage & Processing Crops Permanent Plantings Livestock Part-Time Farm / Rural Housing $12 $10 $8 $6 $ IN MILLIONS $ IN NET LOSS / (GAIN) / LOSS NET $4 $2 $0 1995 & 1996 1997 1998 1999 2000 2001 2002 2003 2004 2005 2006 2007 2008 2009 2010 2011 2012 2013 2014 2015 2016 -$2 Prior BY YEAR OF ORIGINATION Farm & Ranch line of business has historical cumulative losses of 0.14%, or less than 1bp per year • Cumulative losses of $33 million on $24 billion of cumulative historical business volume Farmer Mac’s Rural Utilities, USDA Guarantees, and Institutional Credit lines of business have not had any credit losses to date FARMER MAC OVERVIEW 21

Appendix

FARMER MAC Key Company Metrics ($ in thousands, except per share amounts) 2Q18 YTD 2017 2016 2015 Core Earnings(1) $41,207 $65,631 $53,481 $47,035 Core Earnings per Diluted Share(1) $3.84 $6.08 $4.98 $4.16 Net Effective Spread ($)(1) (2) $73,263 $141,303 $123,072 $117,428 Net Effective Spread (%)(1) (2) 0.88% 0.91% 0.84% 0.85% Guarantee & Commitment Fees $10,254 $20,350 $19,170 $17,155 Core Capital Above Statutory Minimum $149,600 $136,800 $143,200 $102,400 Common Stock Dividends per Share $1.16 $1.44 $1.04 $0.64 Outstanding Business Volume $19,524,837 $19,007,311 $17,399,475 $15,898,820 90-Day Delinquencies – Farm & Ranch 0.61% 0.71% 0.34% 0.56% Charge-Offs $0 $327 $130 $3,772 (3) Book Value per Share $45.75 $42.59 $38.42 $33.66 Core Earnings Return on Equity 17% 15% 13% 13% (1) Core earnings, core earnings per share, and net effective spread are non-GAAP measures. For more information on the use of these non-GAAP measures, please see page 3. For a reconciliation of core earnings to GAAP net income attributable to common stockholders and core earnings per share to earnings per common share, and a reconciliation of net effective spread to GAAP net interest income, please refer to pages 36-39 of the Appendix. (2) Periods prior to fourth quarter 2017 have been recast to reflect the revised methodology for calculating net effective spread that became effective in fourth quarter 2017, as further described on page 3. (3) Book Value per Share excludes accumulated other comprehensive income. APPENDIX 23

FARMER MAC Business Development Product Type Marketing Channel Target Customers AG LOAN PURCHASES • Regional relationship managers • Over 3,100 commercial banks with agricultural AND CREDIT loans on-balance sheet (nearly 700 are approved • Geographically dispersed nationwide (1) PROTECTION Farmer Mac lenders) • Cover ag banks and non-bank originators • Farm Credit System (FCS) • Industry thought leadership – media • Insurance company ag lenders interviews, speaking engagements, publications (The Feed) • Other non-bank lenders • Emerging digital marketing efforts WHOLESALE FINANCING • Institutional Business Development function • Insurance company ag lenders FOR RURAL LENDERS • C-suite outreach to target firms • Larger banks with ag mortgage portfolios • Sponsor/attend industry conferences • Rural utilities cooperative lenders WHOLESALE FINANCING • Same as “Wholesale Financing for Rural • Public or private ag investment funds (all FOR INVESTORS IN AG Lenders” above structures) ASSETS • Leverage capital markets relationships to • Agricultural companies – production ag and identify ag funds and ag companies seeking agribusiness (for profit and cooperative) low-cost wholesale financing RURAL UTILITIES LOAN • C-suite relationships • National Rural Utilities Cooperative Finance Corporation (non-GSE) PURCHASES AND CREDIT • Credit department contacts PROTECTION • CoBank (FCS GSE) • Capital markets relationship contacts APPENDIX (1) Source: FDIC Statistics on Depository Institutions datasets (https://www2.fdic.gov/sdi/index.asp) (as of March 2018). 24

FARMER MAC Core Earnings (Non-GAAP Measure)(1) (2) $70.0 $65.6 $60.0 $53.5 $17.9 $50.0 $47.0 $13.2 $41.2 $40.0 $13.1 $16.7 $14.6 $30.0 $19.4 $ IN MILLIONS $ IN $13.2 $16.0 $20.0 $13.1 $11.4 $10.0 $21.8 $15.0 $9.3 $12.6 $0.0 2015 2016 2017 2018 1Q 2Q 3Q 4Q Total APPENDIX (1) Core earnings is a non-GAAP measure. For a reconciliation of core earnings to GAAP net income attributable to common stockholders, please refer to pages 36-37 of the Appendix. (2) Periods prior to fourth quarter 2017 have been recast to reflect the revised methodology for calculating net effective spread that became effective in fourth quarter 25 2017, as further described on page 3.

FARMER MAC Business Volume(1) (2) AS OF YEAR-END AS OF QUARTER-END $22.0 $19.0 $19.5 $18.3 $17.4 $1.9 $1.7 $1.9 $17.0 $15.9 $2.4 $1.9 $2.3 $1.5 $2.3 $2.1 $1.9 $12.0 $8.4 $7.9 $7.7 $6.7 $7.3 $ IN BILLIONS $ IN $7.0 $5.8 $6.1 $6.9 $6.4 $7.0 $2.0 2015 2016 2017 2Q17 2Q18 -$3.0 Farm & Ranch Institutional Credit USDA Guarantees Rural Utilities APPENDIX (1) Includes on- and off-balance sheet outstanding business volume. (2) Periods may not sum to total due to rounding. 26
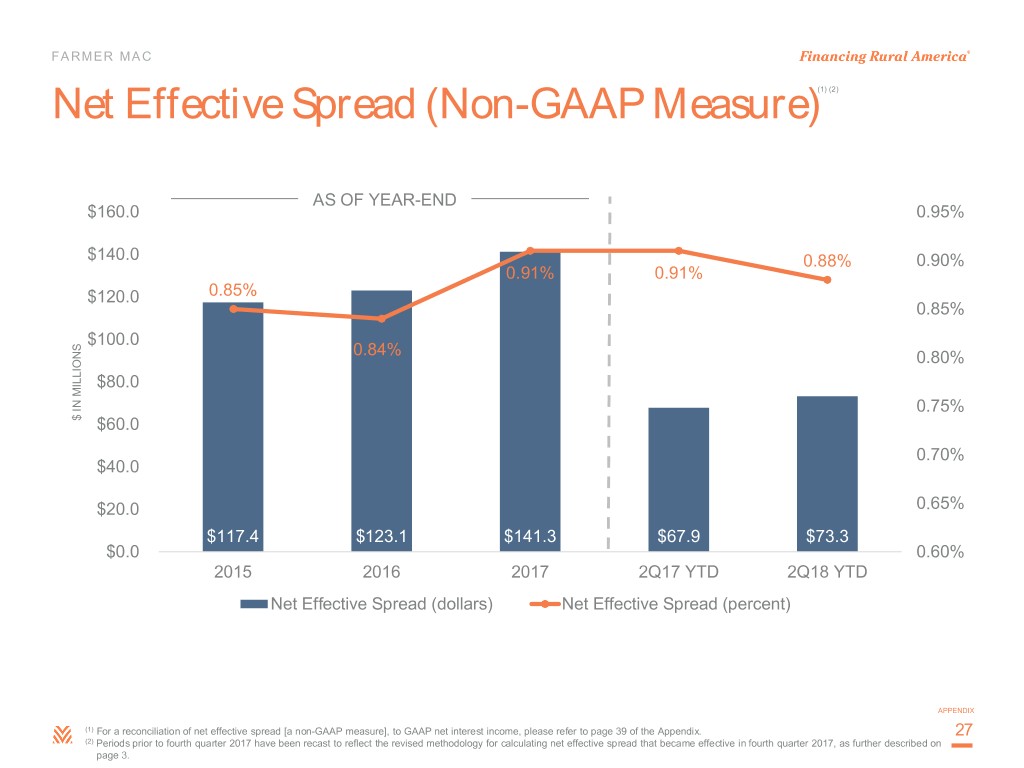
FARMER MAC Net Effective Spread (Non-GAAP Measure)(1) (2) AS OF YEAR-END $160.0 0.95% $140.0 0.88% 0.90% 0.91% 0.91% $120.0 0.85% 0.85% $100.0 0.84% 0.80% $80.0 0.75% $ IN MILLIONS $ IN $60.0 0.70% $40.0 $20.0 0.65% $117.4 $123.1 $141.3 $67.9 $73.3 $0.0 0.60% 2015 2016 2017 2Q17 YTD 2Q18 YTD Net Effective Spread (dollars) Net Effective Spread (percent) APPENDIX (1) For a reconciliation of net effective spread [a non-GAAP measure], to GAAP net interest income, please refer to page 39 of the Appendix. 27 (2) Periods prior to fourth quarter 2017 have been recast to reflect the revised methodology for calculating net effective spread that became effective in fourth quarter 2017, as further described on page 3.

FARMER MAC Farmer Mac Net Effective Spread (1) 120 3.5% 3.0% 2.8% 3.0% 100 2.5% MOODY’S CORPORATE 80 SPREAD SPREAD INDEX 2.0% 1.7% 60 1.6% 1.6% 1.4% 1.3% 1.4% 1.5% 1.2% BASIS POINTS BASIS 1.1% 1.1% 1.0% 40 0.9% NET EFFECTIVE SPREAD EFFECTIVE NET 1.0% 20 0.5% 69 78 106 97 106 106 104 96 90 85 84 91 88 0 0.0% 2006 2007 2008 2009 2010 2011 2012 2013 2014 2015 2016 2017 2Q18 YTD Farmer Mac Net Effective Spread (2) (3) US Treasury Department 10-Year High Quality Market Corporate Bond Spread (4) (1) Net effective spread is a non-GAAP measure. For more information on the use of this non-GAAP measure, please see page 3. For a reconciliation of net effective spread to GAAP net interest income, please refer to page 39 of the Appendix. (2) Beginning Jan. 1, 2015, Farmer Mac classified all of the income from Farmer Mac Guaranteed Securities that it holds in its portfolio as interest income. Periods prior to 2011 have not been restated. APPENDIX (3) Periods 2015 to 2017 have been recast to reflect the revised methodology for calculating net effective spread that became effective in fourth quarter 2017, as further described on page 3. 28 (4) Source: St. Louis Fed, Economic Database: Average 10-Year High Quality Market (HQM) Corporate Bond Par Yield – Average 10-Year Treasury CMT.

FARMER MAC Credit Metrics Total Allowance for Losses $12.0 0.3% $10.0 $8.0 0.2% $6.0 0.19% % $4.0 0.1% $ IN MILLIONS $ IN 0.12% 0.13% 0.13% $2.0 $10.6 $7.1 $8.1 $9.0 $0.0 0.0% 2Q15 2Q16 2Q17 2Q18 Total Allowance for Losses % of Farm & Ranch Portfolio 90-Day Delinquencies Substandard Assets Historical Historical (1) (1) $50.0 Average ~1.0% $250.0 Average ~4.0% 5.5% 1.20% $40.0 $200.0 1.00% 3.5% $30.0 0.58% 0.65% 0.61% 0.80% $150.0 0.38% % % 3.2% $20.0 0.60% $100.0 3.0% 2.5% 1.5% $ IN MILLIONS $ IN $ IN MILLIONS $ IN 0.40% 2.1% $10.0 $50.0 $31.9 $22.1 $41.9 $43.1 0.20% $136.4 $122.3 $192.1 $226.5 $0.0 0.00% $0.0 -0.5% 2Q15 2Q16 2Q17 2Q18 2Q15 2Q16 2Q17 2Q18 90-Day Delinquencies % of Farm & Ranch Portfolio Average Substandard Assets % of Farm & Ranch Portfolio Average APPENDIX (1) Farmer Mac’s historical averages are based on approximately 15 years of historical data for the Farm & Ranch line of business. 29
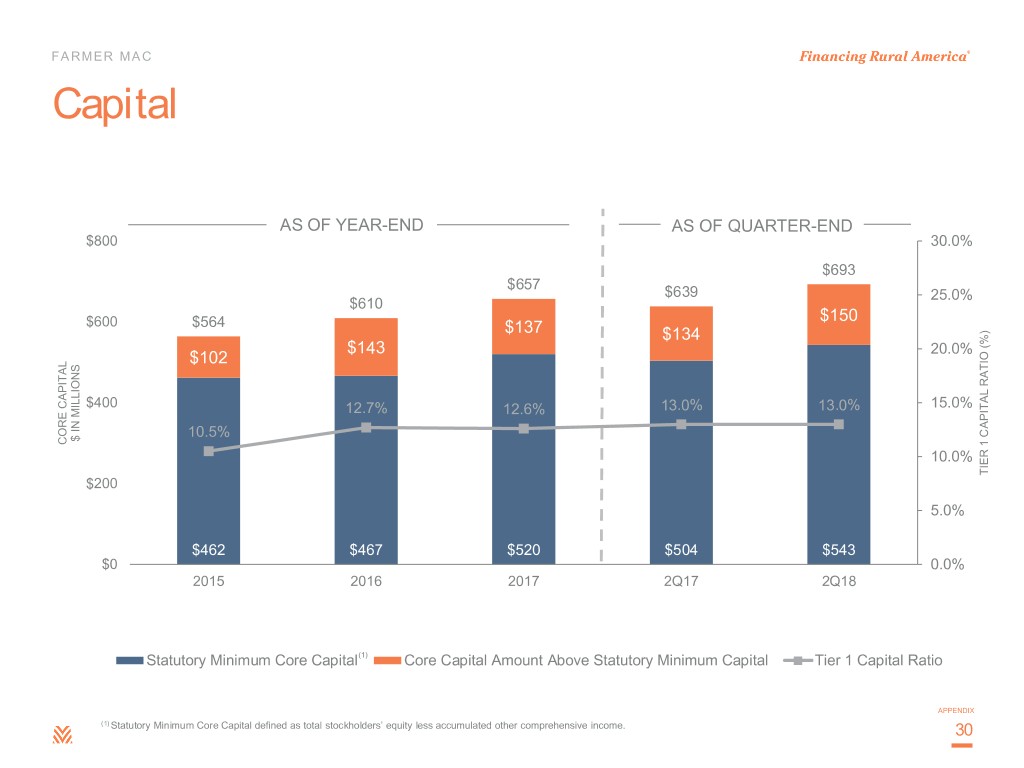
FARMER MAC Capital AS OF YEAR-END AS OF QUARTER-END $800 30.0% $693 $657 $639 25.0% $610 $600 $564 $150 $137 $134 $143 20.0% $102 $400 12.7% 12.6% 13.0% 13.0% 15.0% 10.5% $ IN MILLIONS $ IN CORE CAPITAL CORE 10.0% TIER 1 CAPITAL RATIO (%) RATIO 1 CAPITAL TIER $200 5.0% $462 $467 $520 $504 $543 $0 0.0% 2015 2016 2017 2Q17 2Q18 Statutory Minimum Core Capital(1) Core Capital Amount Above Statutory Minimum Capital Tier 1 Capital Ratio APPENDIX (1) Statutory Minimum Core Capital defined as total stockholders’ equity less accumulated other comprehensive income. 30

FARMER MAC Liquidity – Investment Portfolio AS OF JUNE 30, 2018 Farmer Mac maintains an investment portfolio to Liquidity Portfolio provide back-up source of liquidity in excess of Asset-Backed regulatory requirements Securities • Minimum of 90 days of liquidity required by regulation 1% $2.8 billion investment portfolio at June 30 • Cash and highly-rated investment securities Cash & • Conservative portfolio goals Equiv. 15% − Minimize exposure to market volatility − Preservation of capital − Ready access to cash Guar. by • Provided 180 days of liquidity as of June 30, 2018 GSEs and U.S. Farmer Mac also has $1.5 billion line of credit Gov't with U.S. Treasury Agencies • Supports Farmer Mac’s guarantee obligations 83% • Farmer Mac has never used this line of credit APPENDIX 31
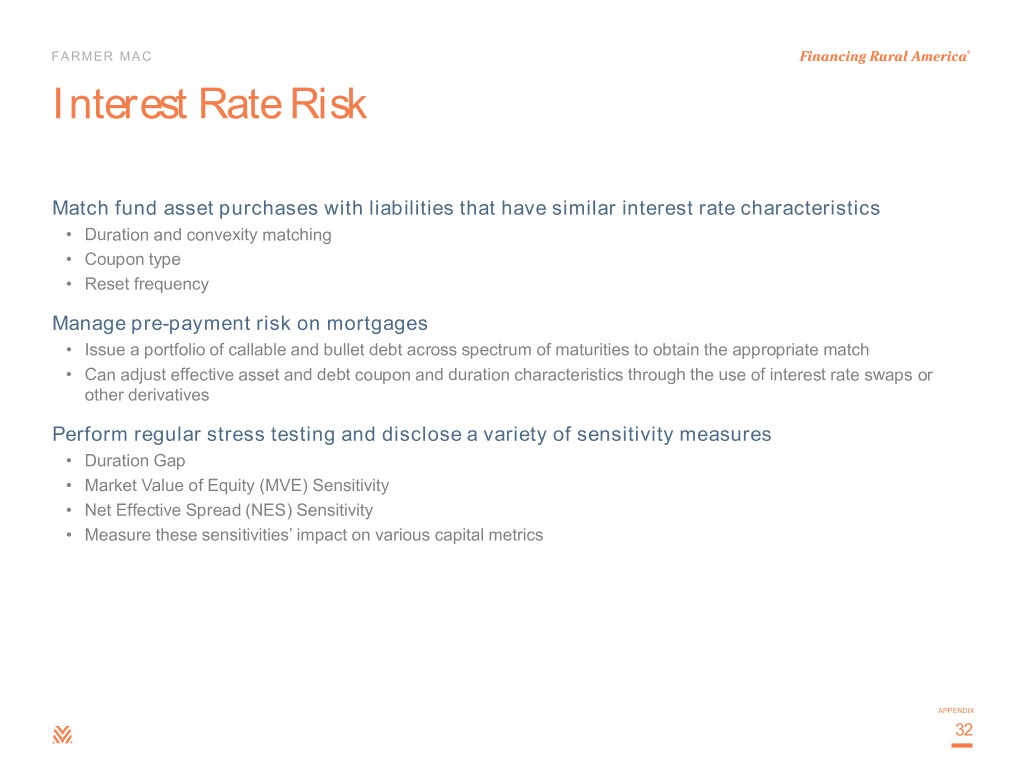
FARMER MAC Interest Rate Risk Match fund asset purchases with liabilities that have similar interest rate characteristics • Duration and convexity matching • Coupon type • Reset frequency Manage pre-payment risk on mortgages • Issue a portfolio of callable and bullet debt across spectrum of maturities to obtain the appropriate match • Can adjust effective asset and debt coupon and duration characteristics through the use of interest rate swaps or other derivatives Perform regular stress testing and disclose a variety of sensitivity measures • Duration Gap • Market Value of Equity (MVE) Sensitivity • Net Effective Spread (NES) Sensitivity • Measure these sensitivities’ impact on various capital metrics APPENDIX 32

FARMER MAC Funding Finance asset purchases with proceeds of debt issuances • 20+ dealers • Match-funding provides for stable net effective spread and immaterial interest rate risk Farmer Mac’s debt securities carry privileges for certain holders • 20% capital risk weighting • Eligible collateral for Fed advances • Legal investments for federally supervised financial institutions (banks, etc.) Debt Securities Trade at Narrow Spreads to Comparable Maturity Treasuries MATURITY (YEARS) 1 3 5 10 SPREAD TO TREASURY 6 bps 18 bps 20 bps 55 bps (AS OF JUNE 30, 2018) APPENDIX 33

FARMER MAC Equity Capital Structure NYSE Dividend Shares Ticker Yield Outstanding CLASS A VOTING COMMON STOCK AGM.A 2.86%(1) 1.0 million • Ownership restricted to non-Farm Credit System financial institutions STOCK CLASS B VOTING COMMON STOCK -- -- 0.5 million • Ownership restricted to Farm Credit System institutions CLASS C NON-VOTING COMMON STOCK AGM 2.59%(1) 9.1 million • No ownership restrictions COMMON SERIES A NON-CUMULATIVE PREFERRED STOCK AGM.PR.A 5.875%(2) 2.4 million • Option to redeem at any time on or after January 17, 2018 • Redemption Value: $25 per share (2) STOCK SERIES B NON-CUMULATIVE PREFERRED STOCK AGM.PR.B 6.875% 3.0 million • Option to redeem at any time on or after April 17, 2019 • Redemption Value: $25 per share SERIES C FIXED-TO-FLOATING RATE NON-CUMULATIVE AGM.PR.C 6.000%(2) 3.0 million PREFERRED STOCK PREFERRED • Option to redeem at any time on or after July 18, 2024 • Redemption Value: $25 per share APPENDIX (1) Common stock dividend annualized divided by quarter-end closing price (2) Par value of annual dividend 34

FARMER MAC Farmer Mac’s Net Effective Spread History(1) (2) Net Effective Spread by Business Segment Farm & Ranch USDA Guarantees Rural Utilities Institutional Credit Corporate Net Effective Spread ($ in thousands) Dollars Yield Dollars Yield Dollars Yield Dollars Yield Dollars Yield Dollars Yield For the quarter ended: June 30, 2018 $ 13,347 1.86% $ 4,398 0.83% $ 2,923 1.15% $ 15,220 0.76% $ 274 0.04% $ 36,162 0.86% March 31, 2018 12,540 1.80% 4,400 0.82% 2,950 1.12% 14,824 0.78% 2,387 0.36% 37,101 0.91% December 31, 2017 12,396 1.80% 4,979 0.93% 3,057 1.14% 14,800 0.78% 2,235 0.35% 37,467 0.93% September 30, 2017 11,303 1.73% 4,728 0.90% 2,765 1.07% 14,455 0.78% 2,725 0.41% 35,976 0.91% June 30, 2017 11,158 1.77% 4,551 0.87% 2,669 1.06% 14,467 0.81% 2,489 0.36% 35,334 0.91% March 31, 2017 10,511 1.77% 4,561 0.89% 2,568 1.04% 12,615 0.82% 2,271 0.32% 32,526 0.90% December 31, 2016 10,131 1.75% 5,152 1.04% 2,530 1.02% 11,636 0.78% 1,999 0.26% 31,448 0.88% September 30, 2016 10,476 1.86% 4,994 1.03% 2,541 1.01% 11,431 0.75% 2,239 0.24% 31,681 0.85% June 30, 2016 9,644 1.74% 4,392 0.92% 2,459 0.98% 11,412 0.77% 2,596 0.29% 30,503 0.83% (1) Net effective spread is a non-GAAP measure. For a reconciliation of net effective spread to GAAP net interest income to net effective spread, please refer to page 39 of the Appendix. APPENDIX (2) Periods prior to fourth quarter 2017 have been recast to reflect the revised methodology for calculating net effective spread that became effective in fourth quarter 2017, as further described on page 3. 35
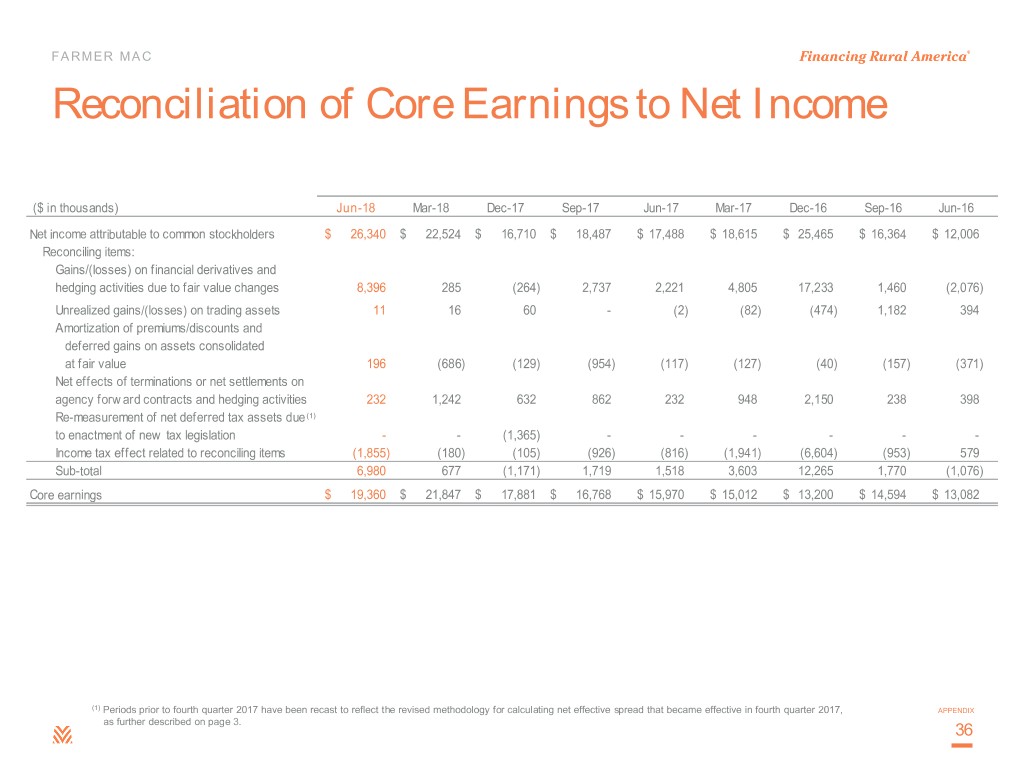
FARMER MAC Reconciliation of Core Earnings to Net Income ($ in thousands) Jun-18 Mar-18 Dec-17 Sep-17 Jun-17 Mar-17 Dec-16 Sep-16 Jun-16 Net income attributable to common stockholders $ 26,340 $ 22,524 $ 16,710 $ 18,487 $ 17,488 $ 18,615 $ 25,465 $ 16,364 $ 12,006 Reconciling items: Gains/(losses) on financial derivatives and hedging activities due to fair value changes 8,396 285 (264) 2,737 2,221 4,805 17,233 1,460 (2,076) Unrealized gains/(losses) on trading assets 11 16 60 - (2) (82) (474) 1,182 394 Amortization of premiums/discounts and deferred gains on assets consolidated at fair value 196 (686) (129) (954) (117) (127) (40) (157) (371) Net effects of terminations or net settlements on agency forw ard contracts and hedging activities 232 1,242 632 862 232 948 2,150 238 398 Re-measurement of net deferred tax assets due (1) to enactment of new tax legislation - - (1,365) - - - - - - Income tax effect related to reconciling items (1,855) (180) (105) (926) (816) (1,941) (6,604) (953) 579 Sub-total 6,980 677 (1,171) 1,719 1,518 3,603 12,265 1,770 (1,076) Core earnings $ 19,360 $ 21,847 $ 17,881 $ 16,768 $ 15,970 $ 15,012 $ 13,200 $ 14,594 $ 13,082 (1) Periods prior to fourth quarter 2017 have been recast to reflect the revised methodology for calculating net effective spread that became effective in fourth quarter 2017, APPENDIX as further described on page 3. 36

FARMER MAC Reconciliation of Core Earnings to Net Income Net income attributable to common stockholders $ 48,864 $ 71,300 $ 64,152 $ 47,371 Less reconciling items: Gains on financial derivatives and hedging activities due to fair value changes 8,681 9,499 13,628 10,924 Unrealized gains/(losses) on trading assets 27 (24) 1,460 1,220 Amortization of premiums/discounts and deferred gains on assets consolidated at fair value (490) (1,327) (849) (1,319) Net effects of terminations or net settlements on financial derivatives and hedging activities 1,474 2,674 2,178 (699) Loss on retirement(1) of Farmer Mac II LLC Preferred Stock - - - (8,147) Re-measurement of net deferred tax asset due to enactment of new tax (2) legislation - (1,365) - - Income tax effect related to reconciling items (2,035) (3,788) (5,746) (1,643) Sub-total 7,657 5,669 10,671 336 Core earnings $ 41,207 $ 65,631 $ 53,481 $ 47,035 (1) Periods prior to fourth quarter 2017 have been recast to reflect the revised methodology for calculating net effective spread that became effective in fourth quarter 2017, APPENDIX as further described on page 3. (2) Relates to the write-off of deferred issuance costs as a result of the retirement of Farmer Mac II LLC Preferred Stock. 37
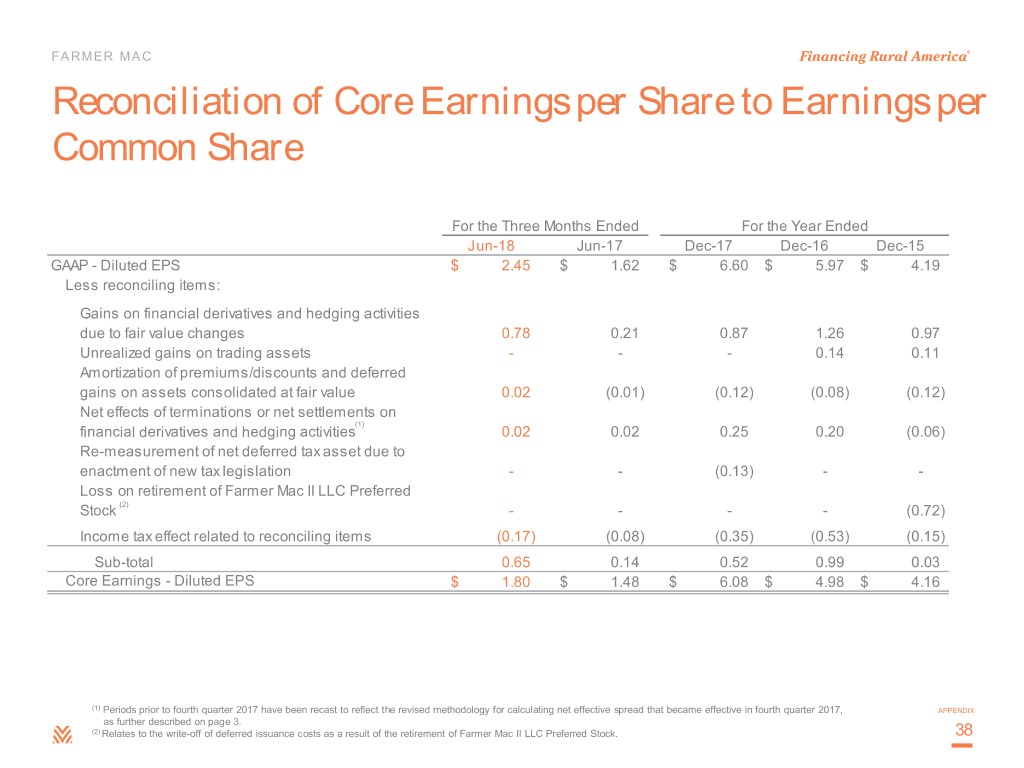
FARMER MAC Reconciliation of Core Earnings per Share to Earnings per Common Share For the Three Months Ended For the Year Ended Jun-18 Jun-17 Dec-17 Dec-16 Dec-15 GAAP - Diluted EPS $ 2.45 $ 1.62 $ 6.60 $ 5.97 $ 4.19 Less reconciling items: Gains on financial derivatives and hedging activities due to fair value changes 0.78 0.21 0.87 1.26 0.97 Unrealized gains on trading assets - - - 0.14 0.11 Amortization of premiums/discounts and deferred gains on assets consolidated at fair value 0.02 (0.01) (0.12) (0.08) (0.12) Net effects of terminations or net settlements on (1) financial derivatives and hedging activities 0.02 0.02 0.25 0.20 (0.06) Re-measurement of net deferred tax asset due to enactment of new tax legislation - - (0.13) - - Loss on retirement of Farmer Mac II LLC Preferred Stock (2) - - - - (0.72) Income tax effect related to reconciling items (0.17) (0.08) (0.35) (0.53) (0.15) Sub-total 0.65 0.14 0.52 0.99 0.03 Core Earnings - Diluted EPS $ 1.80 $ 1.48 $ 6.08 $ 4.98 $ 4.16 (1) Periods prior to fourth quarter 2017 have been recast to reflect the revised methodology for calculating net effective spread that became effective in fourth quarter 2017, APPENDIX as further described on page 3. (2) Relates to the write-off of deferred issuance costs as a result of the retirement of Farmer Mac II LLC Preferred Stock. 38

FARMER MAC Reconciliation of Net Effective Spread to Net Interest Income Net Effective Spread by Period Ended (in thousands) 2Q18 YTD 2017 2016 2015 2014 2013 2012 2011 2010 2009 2008 2007 2006 Net interest yield 0.97% 0.94% 0.90% 0.88% 0.51% 0.89% 1.14% 1.30% 1.30% 1.68% 1.62% 0.85% 0.85% Net effect of consolidated trusts 0.04% 0.04% 0.03% 0.01% 0.01% 0.00% 0.02% 0.06% 0.15% 0.00% 0.00% 0.00% 0.00% Net effect of securities purchased under agreement to resell and securities sold, not yet purchased 0.00% 0.00% 0.00% 0.00% 0.35% 0.00% 0.00% 0.00% 0.00% 0.00% 0.00% 0.00% 0.00% Expense related to undesignated financial derivatives -0.08% -0.07% -0.07% -0.04% -0.08% -0.10% -0.23% -0.41% -0.54% -0.70% -0.49% 0.00% -0.07% Amortization of premiums/discounts on assets consolidated at fair value 0.01% 0.01% 0.00% 0.02% 0.13% 0.17% 0.12% 0.12% 0.19% 0.00% 0.00% 0.00% 0.00% Amortization of losses due to terminations or net settlements on financial derivatives and hedging activities (1) 0.00% -0.01% -0.02% -0.02% -0.02% 0.00% 0.00% 0.00% 0.00% 0.00% 0.00% 0.00% 0.00% Fair value changes on fair value hedge relationships -0.06% 0.00% 0.00% 0.00% 0.00% 0.00% 0.00% 0.00% 0.00% 0.00% 0.00% 0.00% 0.00% Yield maintenance payments (2) 0.00% 0.00% 0.00% 0.00% 0.00% 0.00% -0.01% -0.01% -0.04% -0.01% -0.07% -0.07% -0.09% Net Effective Spread 0.88% 0.91% 0.84% 0.85% 0.90% 0.96% 1.04% 1.06% 1.06% 0.97% 1.06% 0.78% 0.69% (1) Periods prior to fourth quarter 2017 have been recast to reflect the revised methodology for calculating net effective spread that became effective in fourth quarter 2017, APPENDIX as further described on page 3. (2) Beginning in 2013, Farmer Mac no longer excluded yield maintenance payments. 39
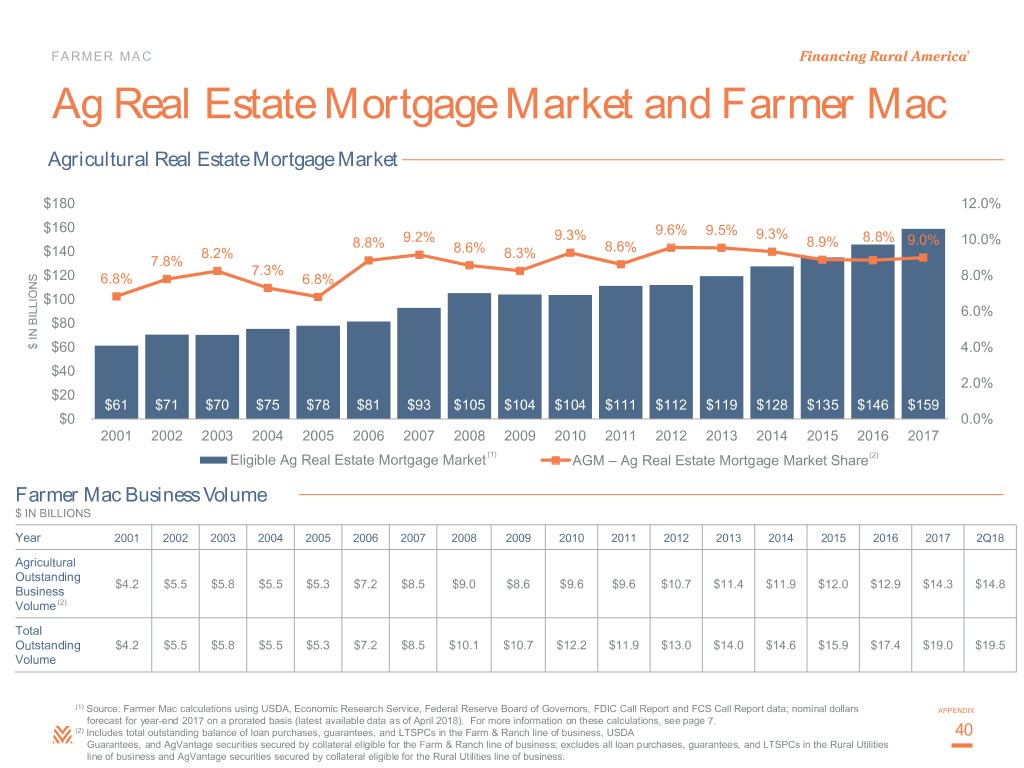
FARMER MAC Ag Real Estate Mortgage Market and Farmer Mac Agricultural Real Estate Mortgage Market $180 12.0% $160 9.3% 9.6% 9.5% 9.3% 8.8% 9.2% 8.9% 8.8% 9.0% 10.0% $140 8.2% 8.6% 8.3% 8.6% 7.8% 7.3% $120 6.8% 6.8% 8.0% $100 6.0% $80 $ IN BILLIONS $ IN $60 4.0% $40 2.0% $20 $61 $71 $70 $75 $78 $81 $93 $105 $104 $104 $111 $112 $119 $128 $135 $146 $159 $0 0.0% 2001 2002 2003 2004 2005 2006 2007 2008 2009 2010 2011 2012 2013 2014 2015 2016 2017 Eligible Ag Real Estate Mortgage Market (1) AGM – Ag Real Estate Mortgage Market Share(2) Farmer Mac Business Volume $ IN BILLIONS Year 2001 2002 2003 2004 2005 2006 2007 2008 2009 2010 2011 2012 2013 2014 2015 2016 2017 2Q18 Agricultural Outstanding $4.2 $5.5 $5.8 $5.5 $5.3 $7.2 $8.5 $9.0 $8.6 $9.6 $9.6 $10.7 $11.4 $11.9 $12.0 $12.9 $14.3 $14.8 Business Volume (2) Total Outstanding $4.2 $5.5 $5.8 $5.5 $5.3 $7.2 $8.5 $10.1 $10.7 $12.2 $11.9 $13.0 $14.0 $14.6 $15.9 $17.4 $19.0 $19.5 Volume (1) Source: Farmer Mac calculations using USDA, Economic Research Service, Federal Reserve Board of Governors, FDIC Call Report and FCS Call Report data; nominal dollars APPENDIX forecast for year-end 2017 on a prorated basis (latest available data as of April 2018). For more information on these calculations, see page 7. (2) Includes total outstanding balance of loan purchases, guarantees, and LTSPCs in the Farm & Ranch line of business, USDA 40 Guarantees, and AgVantage securities secured by collateral eligible for the Farm & Ranch line of business; excludes all loan purchases, guarantees, and LTSPCs in the Rural Utilities line of business and AgVantage securities secured by collateral eligible for the Rural Utilities line of business.

FARMER MAC Rural Utilities (RU) Cooperative Mortgage Market (1) (2) FARM CREDIT SYSTEM (GSE) NON-GSE RU LENDERS (3) Secondary Market W HOLESALE FINANCING NATIONAL RURAL UTILITIES RURAL NATIONAL COOPERATIVE FINANCE FINANCE COOPERATIVE $4.7 Billion (“CFC”) CORPORATION {13.4% Market Share}(4) LOAN SALES $23 Billion Rural Utilities CREDIT Cooperative PROTECTION (1) COBANK Mortgage Market (4) $12 Billion$12 Mortgage $36 Billion Mortgage Financing Financing {900+ Cooperatives in Utilities Distribution, Generation and Transmission} (5) Market Opportunity Industry dynamics may lead to Farmer Mac growth opportunities • Ongoing high level of competition between rural utilities cooperative lenders • As a result, CFC from time to time partners with Farmer Mac to provide competitive pricing for rural borrowers • Opportunity for Farmer Mac to provide a competitive source of debt funding through Institutional Credit line of business (1) RU cooperative mortgage market structure includes only the outstanding unpaid principal balance of first lien RU cooperative real estate mortgage assets. (2) Source: CoBank 2017Q4 Financial Information, Electric Distribution and Generation & Transmission nominal dollars as of December 31, 2017. APPENDIX (3) Source: CFC 10-Q, nominal dollars as of November 30, 2017, Long-term Loans Table 6. (4) Nominal dollars for 2016; Sum of FCS, non-GSE and Farmer Mac first lien RU cooperative real estate mortgage assets does not add up to the total due to the nature of Farmer Mac’s secondary 41 market business model. (5) Source: National Rural Electric Cooperative Association.
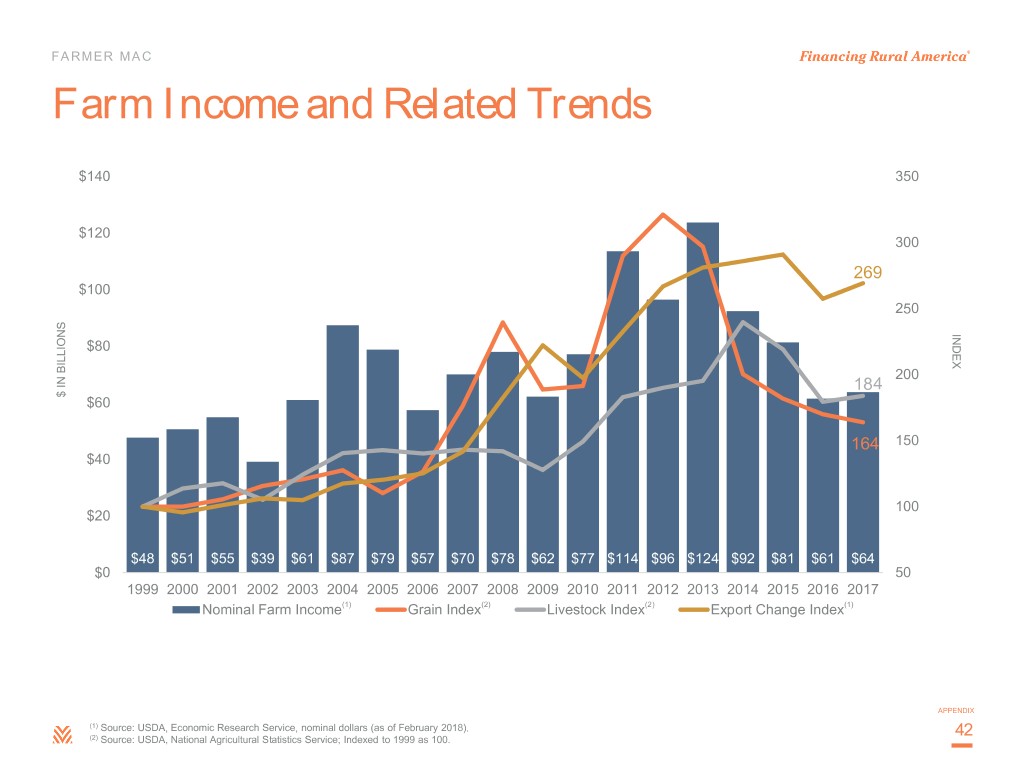
FARMER MAC Farm Income and Related Trends $140 350 $120 300 269 $100 250 INDEX $80 200 184 $ IN BILLIONS $ IN $60 164 150 $40 100 $20 $48 $51 $55 $39 $61 $87 $79 $57 $70 $78 $62 $77 $114 $96 $124 $92 $81 $61 $64 $0 50 1999 2000 2001 2002 2003 2004 2005 2006 2007 2008 2009 2010 2011 2012 2013 2014 2015 2016 2017 Nominal Farm Income(1) Grain Index(2) Livestock Index(2) Export Change Index(1) APPENDIX (1) Source: USDA, Economic Research Service, nominal dollars (as of February 2018). 42 (2) Source: USDA, National Agricultural Statistics Service; Indexed to 1999 as 100.

FARMER MAC Ag Land Value and Leverage Trends Ag Land Values $3.5 $124 $140 $114 $3.0 $120 $96 $2.5 $87 $100 IN $ BILLIONS $79 $78 $81 $70 $2.0 $61 $62 $92 $61 $64 $80 $55 $1.5 $48 $51 $77 $60 $39 $1.0 $57 $40 AVERAGE LAND VALUE LAND AVERAGE $ IN THOUSANDS/ACRE $ IN $0.5 $20 $1.0 $1.1 $1.2 $1.2 $1.3 $1.3 $1.6 $1.8 $2.0 $2.2 $2.1 $2.2 $2.3 $2.5 $2.7 $3.0 $3.0 $3.0 $3.1 $0.0 $0 1999 2000 2001 2002 2003 2004 2005 2006 2007 2008 2009 2010 2011 2012 2013 2014 2015 2016 2017F Land Value(1) Nominal Farm Income(2) Leverage 16% 15% Average 14% 12.8% 13% 12% Peak Leverage 12.7% 11% 22% in 1985 10% DEBT TO ASSET RATIO (%) RATIO ASSET TO DEBT 9% 1999 2000 2001 2002 2003 2004 2005 2006 2007 2008 2009 2010 2011 2012 2013 2014 2015 2016 2017F Debt to Asset Ratio(2) Average APPENDIX (1) Source: USDA, National Agricultural Statistics Service, nominals dollars, (as of August 2017); includes all farm and pasture land, irrigated and non-irrigated. 43 (2) Source: USDA, Economic Research Service, nominal dollars (as of February 2018).

FARMER MAC Agricultural Risk Management Tools Farmers today use a broad array of risk management tools, many of which were not available or not accepted during the ag credit crisis of the 1980s • Many now view costs of hedging simply as a cost of doing business • Have learned from their parents’ experiences in the 1980s • Risk management includes revenue and cost protection and more sophisticated asset liability management Revenue Hedging • Crop insurance – more than 90% of planted acres to principal crops carry some form of crop insurance (1) • Crop insurance premiums still federally subsidized and losses shared by the federal government • Futures/forward sales – many producers use hedging instruments to sell grain crops forward at planting stage Cost Hedging • Feed costs hedged with futures/forwards • Fertilizer and fuel costs can be similarly hedged • Water availability can be provided via “water banks” and secondary sources of water, e.g. wells • Water costs can also be hedged with forward purchase agreements Debt service is better managed with low absolute leverage levels and better rate options APPENDIX (1) Source: USDA, Risk Management Agency 2016 Summary of Business, Net Acres Insured and USDA NASS 2017 Acreage Report. 44

FARMER MAC USDA – Key 2018 Forecasts (1) (2) (3) (4) Demand for U.S. agricultural products to increase • Demographic trends and a growing global economy contributing to growth • Lower commodity prices stimulating quantity demanded • USDA predicts total U.S. export values to remain high at $142.5 billion led by continued strength in protein exports and increases in corn exports due to weather issues in South America – USDA’s forecast was made in May and trade uncertainty has grown – U.S. dollar weakened in 2017 and USDA projects agricultural trade weighted dollar index to rise some in 2018 U.S. farm income to fall 6.7% to $59.5 billion in 2018 • Grain prices remain range-bound at lower levels, but prices showed improvement in first half of 2018 • Livestock prices were higher than USDA originally expected in 2017, small pullback in prices expected in 2018 • Input costs are stable to modestly increasing – Increasing labor, interest, fuel, property tax, and fertilizer costs partially offset by declines in feed, animal, seed, pesticides, and rent costs Average U.S. ag land values expected to stay flat to slightly higher • Declining land values in the Corn Belt have moderated slightly in 2017 – USDA data shows year-over-year increases in Iowa and Wisconsin • Rest of U.S. remains stable to increasing – demand steady in non-grain producing regions – Quickest growth seen in Pacific and Southern states • USDA projects 2.1% increase in year-end farm real estate asset values in 2018 U.S. agricultural mortgage market forecast to grow 1.2% in 2018 APPENDIX (1) Source: USDA, National Agricultural Statistics Service, nominal dollars (as of August 2017). (2) Source: USDA, Economic Research Service, nominal dollars (as of February 2018). 45 (3) Source: USDA, World Agricultural Supply and Demand Estimates Report, nominal dollars (as of February 2018). (4) Source: USDA, Economic Research Service Trade Outlook (as of July 2018).
