Attached files
| file | filename |
|---|---|
| EX-32.1 - EXHIBIT 32.1-CEO CERTIFICATION - Delek US Holdings, Inc. | dk-ex321xceocertificationx.htm |
| EX-32.2 - EXHIBIT 32.2-CFO CERTIFICATION - Delek US Holdings, Inc. | dk-ex322xcfocertificationx.htm |
| EX-31.2 - EXHIBIT 31.2-CFO CERTIFICATION - Delek US Holdings, Inc. | dk-ex312xcfocertificationx.htm |
| EX-31.1 - EXHIBIT 31.1-CEO CERTIFICATION - Delek US Holdings, Inc. | dk-ex311xceocertificationx.htm |
UNITED STATES
SECURITIES AND EXCHANGE COMMISSION
Washington, D.C. 20549
Form 10-Q
(Mark One)
þ | QUARTERLY REPORT PURSUANT TO SECTION 13 OR 15(d) OF THE SECURITIES EXCHANGE ACT OF 1934 | |||
For the quarterly period ended June 30, 2018 | ||||
or
o | TRANSITION REPORT PURSUANT TO SECTION 13 OR 15(d) OF THE SECURITIES EXCHANGE ACT OF 1934 | |
For the transition period from to | ||
Commission file number 001-38142
DELEK US HOLDINGS, INC.
(Exact name of registrant as specified in its charter)
Delaware | 35-2581557 | |
(State or other jurisdiction of | (I.R.S. Employer | |
incorporation or organization) | Identification No.) | |
7102 Commerce Way | ||
Brentwood, Tennessee | 37027 | |
(Address of principal executive offices) | (Zip Code) | |
(615) 771-6701
(Registrant’s telephone number, including area code)
Not Applicable
(Former name, former address and former fiscal year, if changed since last report)
Indicate by check mark whether the registrant: (1) has filed all reports required to be filed by Section 13 or 15(d) of the Securities Exchange Act of 1934 during the preceding 12 months (or for such shorter period that the registrant was required to file such reports), and (2) has been subject to such filing requirements for the past 90 days. Yes þ No o
Indicate by check mark whether the registrant has submitted electronically every Interactive Data File required to be submitted pursuant to Rule 405 of Regulation S-T during the preceding 12 months (or for such shorter period that the registrant was required to submit such files). Yes þ No o
Indicate by check mark whether the registrant is a large accelerated filer, an accelerated filer, a non-accelerated filer, a smaller reporting company or an emerging growth company. See the definitions of "large accelerated filer," "accelerated filer," "smaller reporting company" and "emerging growth company" in Rule 12b-2 of the Exchange Act.
Large accelerated filer þ | Accelerated filer o | Non-accelerated filer o | Smaller reporting company o | Emerging growth company o | ||||
If an emerging growth company, indicate by check mark if the registrant has elected not to use the extended transition period for complying with any new or revised financial accounting standards provided pursuant to Section 13(a) of the Exchange Act. o
Indicate by check mark whether the registrant is a shell company (as defined in Rule 12b-2 of the Exchange Act). Yes o No þ
At August 3, 2018, there were 83,946,302 shares of common stock, $0.01 par value, outstanding (excluding securities held by, or for the account of, the Company or its subsidiaries).
TABLE OF CONTENTS
2
Part I.
FINANCIAL INFORMATION
Item 1. | Financial Statements |
Delek US Holdings, Inc.
Condensed Consolidated Balance Sheets (Unaudited)
(In millions, except share and per share data)
June 30, 2018 | December 31, 2017 | |||||||
ASSETS | ||||||||
Current assets: | ||||||||
Cash and cash equivalents | $ | 1,132.8 | $ | 931.8 | ||||
Accounts receivable, net | 785.1 | 579.6 | ||||||
Accounts receivable from related parties | 17.0 | 2.1 | ||||||
Inventories, net of inventory valuation reserves | 881.5 | 808.4 | ||||||
Assets held for sale | 25.2 | 160.0 | ||||||
Other current assets | 107.7 | 129.9 | ||||||
Total current assets | 2,949.3 | 2,611.8 | ||||||
Property, plant and equipment: | ||||||||
Property, plant and equipment | 2,812.4 | 2,772.5 | ||||||
Less: accumulated depreciation | (708.8 | ) | (631.7 | ) | ||||
Property, plant and equipment, net | 2,103.6 | 2,140.8 | ||||||
Goodwill | 857.8 | 816.6 | ||||||
Other intangibles, net | 106.1 | 101.1 | ||||||
Equity method investments | 130.5 | 138.1 | ||||||
Other non-current assets | 64.5 | 126.8 | ||||||
Total assets | $ | 6,211.8 | $ | 5,935.2 | ||||
LIABILITIES AND STOCKHOLDERS’ EQUITY | ||||||||
Current liabilities: | ||||||||
Accounts payable | $ | 1,050.6 | $ | 973.4 | ||||
Accounts payable to related parties | 1.8 | 1.7 | ||||||
Current portion of long-term debt | 180.8 | 590.2 | ||||||
Obligation under Supply and Offtake Agreements | 471.2 | 435.6 | ||||||
Liabilities associated with assets held for sale | 12.0 | 105.9 | ||||||
Accrued expenses and other current liabilities | 445.0 | 564.9 | ||||||
Total current liabilities | 2,161.4 | 2,671.7 | ||||||
Non-current liabilities: | ||||||||
Long-term debt, net of current portion | 1,861.7 | 875.4 | ||||||
Environmental liabilities, net of current portion | 135.7 | 68.9 | ||||||
Asset retirement obligations | 71.8 | 72.1 | ||||||
Deferred tax liabilities | 127.2 | 199.9 | ||||||
Other non-current liabilities | 74.7 | 83.0 | ||||||
Total non-current liabilities | 2,271.1 | 1,299.3 | ||||||
Stockholders’ equity: | ||||||||
Preferred stock, $0.01 par value, 10,000,000 shares authorized, no shares issued and outstanding | — | — | ||||||
Common stock, $0.01 par value, 110,000,000 shares authorized, 87,631,115 shares and 81,533,548 shares issued at June 30, 2018 and December 31, 2017, respectively | 0.9 | 0.8 | ||||||
Additional paid-in capital | 1,041.8 | 900.1 | ||||||
Accumulated other comprehensive (loss) income | (42.4 | ) | 6.9 | |||||
Treasury stock, 3,703,826 shares and 762,623 shares, at cost, as of June 30, 2018 and December 31, 2017, respectively | (140.3 | ) | (25.0 | ) | ||||
Retained earnings | 742.8 | 767.8 | ||||||
Non-controlling interests in subsidiaries | 176.5 | 313.6 | ||||||
Total stockholders’ equity | 1,779.3 | 1,964.2 | ||||||
Total liabilities and stockholders’ equity | $ | 6,211.8 | $ | 5,935.2 | ||||
See accompanying notes to condensed consolidated financial statements
3
Delek US Holdings, Inc.
Condensed Consolidated Statements of Income (Unaudited)
(In millions, except share and per share data)
Three Months Ended | Six Months Ended | |||||||||||||||
June 30, | June 30, | |||||||||||||||
2018 | 2017 | 2018 | 2017 | |||||||||||||
Net revenues | $ | 2,563.5 | $ | 1,230.7 | $ | 4,916.7 | $ | 2,412.8 | ||||||||
Operating costs and expenses: | ||||||||||||||||
Cost of goods sold | 2,176.8 | 1,157.8 | 4,219.6 | 2,193.5 | ||||||||||||
Operating expenses | 157.5 | 62.1 | 315.6 | 123.3 | ||||||||||||
General and administrative expenses | 52.9 | 27.5 | 118.1 | 54.0 | ||||||||||||
Depreciation and amortization | 49.2 | 29.5 | 97.2 | 58.5 | ||||||||||||
Other operating (income) expense, net | (8.0 | ) | 0.3 | (7.7 | ) | 0.3 | ||||||||||
Total operating costs and expenses | 2,428.4 | 1,277.2 | 4,742.8 | 2,429.6 | ||||||||||||
Operating income (loss) | 135.1 | (46.5 | ) | 173.9 | (16.8 | ) | ||||||||||
Interest expense | 31.5 | 14.9 | 64.0 | 28.4 | ||||||||||||
Interest income | (0.9 | ) | (0.8 | ) | (1.6 | ) | (1.8 | ) | ||||||||
Income from equity method investments | (2.9 | ) | (1.5 | ) | (2.9 | ) | (4.6 | ) | ||||||||
Gain on sale of business | (13.2 | ) | — | (13.2 | ) | — | ||||||||||
Impairment loss on assets held for sale | — | — | 27.5 | — | ||||||||||||
Loss on extinguishment of debt | — | — | 9.0 | — | ||||||||||||
Other expense (income), net | 0.3 | 0.1 | (0.4 | ) | 0.1 | |||||||||||
Total non-operating expenses, net | 14.8 | 12.7 | 82.4 | 22.1 | ||||||||||||
Income (loss) from continuing operations before income tax expense (benefit) | 120.3 | (59.2 | ) | 91.5 | (38.9 | ) | ||||||||||
Income tax expense (benefit) | 32.8 | (27.0 | ) | 15.8 | (22.0 | ) | ||||||||||
Income (loss) from continuing operations, net of tax | 87.5 | (32.2 | ) | 75.7 | (16.9 | ) | ||||||||||
Discontinued operations: | ||||||||||||||||
Loss from discontinued operations, including loss on sale of discontinued operations | (1.0 | ) | — | (11.5 | ) | — | ||||||||||
Income tax benefit | (0.2 | ) | — | (2.5 | ) | — | ||||||||||
Loss from discontinued operations, net of tax | (0.8 | ) | — | (9.0 | ) | — | ||||||||||
Net income (loss) | 86.7 | (32.2 | ) | 66.7 | (16.9 | ) | ||||||||||
Net income attributed to non-controlling interests | 7.6 | 5.7 | 22.5 | 9.8 | ||||||||||||
Net income (loss) attributable to Delek | $ | 79.1 | $ | (37.9 | ) | $ | 44.2 | $ | (26.7 | ) | ||||||
Basic income (loss) per share: | ||||||||||||||||
Income (loss) from continuing operations | $ | 0.95 | $ | (0.61 | ) | $ | 0.74 | $ | (0.43 | ) | ||||||
Loss from discontinued operations | $ | (0.01 | ) | $ | — | $ | (0.21 | ) | $ | — | ||||||
Total basic income (loss) per share | $ | 0.94 | $ | (0.61 | ) | $ | 0.53 | $ | (0.43 | ) | ||||||
Diluted income (loss) per share: | ||||||||||||||||
Income (loss) from continuing operations | $ | 0.90 | $ | (0.61 | ) | $ | 0.71 | $ | (0.43 | ) | ||||||
Loss from discontinued operations | $ | (0.01 | ) | $ | — | $ | (0.20 | ) | $ | — | ||||||
Total diluted income (loss) per share | $ | 0.89 | $ | (0.61 | ) | $ | 0.51 | $ | (0.43 | ) | ||||||
Weighted average common shares outstanding: | ||||||||||||||||
Basic | 84,041,358 | 62,054,485 | 83,151,823 | 62,016,489 | ||||||||||||
Diluted | 90,244,357 | 62,054,485 | 85,773,587 | 62,016,489 | ||||||||||||
Dividends declared per common share outstanding | $ | 0.25 | $ | 0.15 | $ | 0.45 | $ | 0.30 | ||||||||
See accompanying notes to condensed consolidated financial statements
4
Delek US Holdings, Inc.
Condensed Consolidated Statements of Comprehensive Income (Unaudited)
(In millions)
Three Months Ended June 30, | Six Months Ended June 30, | |||||||||||||||
2018 | 2017 | 2018 | 2017 | |||||||||||||
Net income (loss) attributable to Delek | $ | 79.1 | $ | (37.9 | ) | $ | 44.2 | $ | (26.7 | ) | ||||||
Other comprehensive (loss) income: | ||||||||||||||||
Commodity contracts designated as cash flow hedges: | ||||||||||||||||
Unrealized losses, net of ineffectiveness gains of $0.7 million for both the three months and six months ended June 30, 2018 and $0.2 million and $0.4 million for the three and six months ended June 30, 2017, respectively | (74.7 | ) | (3.8 | ) | (72.0 | ) | (9.8 | ) | ||||||||
Realized losses reclassified to cost of goods sold | 8.8 | 31.7 | 8.8 | 39.5 | ||||||||||||
(Decrease) increase related to commodity cash flow hedges, net | (65.9 | ) | 27.9 | (63.2 | ) | 29.7 | ||||||||||
Income tax benefit (expense) | 13.9 | (9.8 | ) | 13.3 | (10.4 | ) | ||||||||||
Net comprehensive (loss) income on commodity contracts designated as cash flow hedges | (52.0 | ) | 18.1 | (49.9 | ) | 19.3 | ||||||||||
Interest rate contracts designated as cash flow hedges: | ||||||||||||||||
Unrealized losses | — | — | (1.3 | ) | — | |||||||||||
Realized losses reclassified to interest expense | — | — | 0.7 | — | ||||||||||||
Decrease related to interest rate cash flow hedges, net | — | — | (0.6 | ) | — | |||||||||||
Income tax benefit | — | — | 0.1 | — | ||||||||||||
Net comprehensive loss on interest rate contracts designated as cash flow hedges | — | — | (0.5 | ) | — | |||||||||||
Foreign currency translation (loss) gain | (0.2 | ) | 0.1 | (0.6 | ) | 0.1 | ||||||||||
Other comprehensive income from equity method investments, net of tax expense of a nominal amount for the six months ended June 30, 2017 | — | — | — | 0.1 | ||||||||||||
Postretirement benefit plans: | ||||||||||||||||
Unrealized gain arising during the year related to: | ||||||||||||||||
Net actuarial gain | — | — | 0.2 | — | ||||||||||||
Gain reclassified to earnings: | ||||||||||||||||
Recognized due to settlement | — | — | (0.1 | ) | — | |||||||||||
Increase related to postretirement benefit plans, net | — | — | 0.1 | — | ||||||||||||
Income tax expense | — | — | — | — | ||||||||||||
Net comprehensive income on postretirement benefit plans | — | — | 0.1 | — | ||||||||||||
Total other comprehensive (loss) income | (52.2 | ) | 18.2 | (50.9 | ) | 19.5 | ||||||||||
Comprehensive income (loss) attributable to Delek | $ | 26.9 | $ | (19.7 | ) | $ | (6.7 | ) | $ | (7.2 | ) | |||||
See accompanying notes to condensed consolidated financial statements
5
Delek US Holdings, Inc.
Condensed Consolidated Statements of Cash Flows (Unaudited)
(In millions)
Six Months Ended June 30, | ||||||||
2018 | 2017 | |||||||
Cash flows from operating activities: | ||||||||
Net income (loss) | $ | 66.7 | $ | (16.9 | ) | |||
Adjustments to reconcile net income (loss) to net cash used in operating activities: | ||||||||
Depreciation and amortization | 97.2 | 58.5 | ||||||
Amortization of deferred financing costs and debt discount | 4.8 | 2.0 | ||||||
Accretion of environmental liabilities and asset retirement obligations | 1.8 | 0.2 | ||||||
Amortization of unfavorable contract liability | (2.2 | ) | (2.9 | ) | ||||
Deferred income taxes | (70.8 | ) | (12.4 | ) | ||||
Income from equity method investments | (2.9 | ) | (4.6 | ) | ||||
Dividends from equity method investments | 2.3 | 0.2 | ||||||
Loss on disposal of assets | 1.3 | 0.3 | ||||||
Loss on extinguishment of debt | 9.0 | — | ||||||
Gain on sale of business | (13.2 | ) | — | |||||
Impairment of assets held for sale | 27.5 | — | ||||||
Equity-based compensation expense | 10.4 | 7.9 | ||||||
Loss from discontinued operations | 9.0 | — | ||||||
Changes in assets and liabilities, net of acquisitions: | ||||||||
Accounts receivable | (177.7 | ) | (22.0 | ) | ||||
Inventories and other current assets | (46.2 | ) | (4.9 | ) | ||||
Fair value of derivatives | (112.6 | ) | 10.5 | |||||
Accounts payable and other current liabilities | 43.6 | (72.4 | ) | |||||
Obligation under Supply and Offtake Agreement | 24.7 | 20.8 | ||||||
Non-current assets and liabilities, net | 6.5 | (11.2 | ) | |||||
Cash used in operating activities - continuing operations | (120.8 | ) | (46.9 | ) | ||||
Cash used in operating activities - discontinued operations | (15.6 | ) | — | |||||
Net cash used in operating activities | (136.4 | ) | (46.9 | ) | ||||
Cash flows from investing activities: | ||||||||
Business combinations, net of cash acquired | — | (4.8 | ) | |||||
Equity method investment contributions | (0.2 | ) | (2.9 | ) | ||||
Distributions from equity method investments | 0.7 | 10.6 | ||||||
Purchases of property, plant and equipment | (142.5 | ) | (35.0 | ) | ||||
Purchase of intangible assets | (0.5 | ) | — | |||||
Proceeds from sale of property, plant and equipment | 0.3 | — | ||||||
Proceeds from sale of business | 110.8 | — | ||||||
Proceeds from sales of discontinued operations | 39.7 | — | ||||||
Cash provided by (used in) investing activities - continuing operations | 8.3 | (32.1 | ) | |||||
Cash provided by investing activities - discontinued operations | 5.5 | — | ||||||
Net cash provided by (used in) investing activities | 13.8 | (32.1 | ) | |||||
Cash flows from financing activities: | ||||||||
Proceeds from long-term revolvers | 1,569.6 | 434.5 | ||||||
Payments on long-term revolvers | (1,017.6 | ) | (627.6 | ) | ||||
Proceeds from term debt | 690.6 | 248.1 | ||||||
Payments on term debt | (672.9 | ) | (60.4 | ) | ||||
Proceeds from product financing agreements | — | 21.0 | ||||||
Repayments of product financing agreements | (72.4 | ) | (6.0 | ) | ||||
Taxes paid due to the net settlement of equity-based compensation | (8.8 | ) | (2.2 | ) | ||||
Repurchase of common stock | (115.3 | ) | — | |||||
Repurchase of non-controlling interest | — | (7.3 | ) | |||||
Distribution to non-controlling interest | (14.1 | ) | (13.2 | ) | ||||
Dividends paid | (37.8 | ) | (19.0 | ) | ||||
Deferred financing costs paid | (7.8 | ) | (5.8 | ) | ||||
Cash provided by (used in) financing activities - continuing operations | 313.5 | (37.9 | ) | |||||
Cash used in financing activities - discontinued operations | — | — | ||||||
Net cash provided by (used in) financing activities | 313.5 | (37.9 | ) | |||||
Net increase (decrease) in cash and cash equivalents | 190.9 | (116.9 | ) | |||||
Cash and cash equivalents at the beginning of the period | 941.9 | 689.2 | ||||||
Cash and cash equivalents at the end of the period | 1,132.8 | 572.3 | ||||||
Less cash and cash equivalents of discontinued operations at the end of the period | — | — | ||||||
Cash and cash equivalents of continuing operations at the end of the period | $ | 1,132.8 | $ | 572.3 | ||||
Delek US Holdings, Inc.
Condensed Consolidated Statements of Cash Flows (Unaudited)(Continued)
(In millions)
Six Months Ended June 30, | ||||||||
2018 | 2017 | |||||||
Supplemental disclosures of cash flow information: | ||||||||
Cash paid during the period for: | ||||||||
Interest, net of capitalized interest of $0.4 million and $0.1 million in the 2018 and 2017 periods, respectively | $ | 62.7 | $ | 28.3 | ||||
Income taxes | $ | 5.7 | $ | 59.3 | ||||
Non-cash investing activities: | ||||||||
Common stock issued in connection with the buyout of Alon Partnership non-controlling interest | $ | 127.0 | $ | — | ||||
Decrease in accrued capital expenditures | $ | (17.9 | ) | $ | (4.8 | ) | ||
See accompanying notes to condensed consolidated financial statements
6
Delek US Holdings, Inc.
Notes to Condensed Consolidated Financial Statements (Unaudited)
1. Organization and Basis of Presentation
Delek US Holdings, Inc. operates through its consolidated subsidiaries, which include Delek US Energy, Inc. (and its subsidiaries) and Alon USA Energy, Inc. ("Alon") (and its subsidiaries).
Effective July 1, 2017 (the "Effective Time"), we acquired the outstanding common stock of Alon (previously listed under NYSE: ALJ) (the "Delek/Alon Merger", as further discussed in Note 2), resulting in a new post-combination consolidated registrant renamed as Delek US Holdings, Inc. (“New Delek”), with Alon and the previous Delek US Holdings, Inc. (“Old Delek”) surviving as wholly-owned subsidiaries. New Delek is the successor issuer to Old Delek and Alon pursuant to Rule 12g-3(c) under the Securities Exchange Act of 1934, as amended (the "Exchange Act"). In addition, as a result of the Delek/Alon Merger, the shares of common stock of Old Delek and Alon were delisted from the New York Stock Exchange ("NYSE") in July 2017, and their respective reporting obligations under the Exchange Act were terminated.
Unless otherwise indicated or the context requires otherwise, the disclosures and financial information included in this report for the periods prior to July 1, 2017 reflect that of Old Delek, and the disclosures and financial information included in this report for the periods beginning July 1, 2017 reflect that of New Delek. The terms "we," "our," "us," "Delek" and the "Company" are used in this report to refer to Old Delek and its consolidated subsidiaries for the periods prior to July 1, 2017, and New Delek and its consolidated subsidiaries for the periods on or after July 1, 2017, unless otherwise noted. New Delek's Common Stock is listed on the NYSE under the symbol "DK."
During the third quarter 2017, we committed to a plan to sell certain assets associated with our Paramount and Long Beach, California refineries and Alon's California renewable fuels facility (collectively, the "California Discontinued Entities"), which were acquired as part of the Delek/Alon Merger. As a result of this decision and commitment to a plan, and because it was made within three months of the Delek/Alon Merger, we met the requirements under Accounting Standards Codification ("ASC") 205-20, Presentation of Financial Statements - Discontinued Operations ("ASC 205-20") and ASC 360, Property, Plant and Equipment ("ASC 360") to report the results of the California Discontinued Entities as discontinued operations and to classify the California Discontinued Entities as a group of assets held for sale. On March 16, 2018, Delek sold to World Energy, LLC (i) all of Delek’s membership interests in AltAir Paramount, LLC (Alon's California renewable fuels facility), (ii) certain refining assets and other related assets located in Paramount, California and (iii) certain associated tank farm and pipeline assets and other related assets located in California. The transaction to dispose of certain assets and liabilities associated with our Long Beach, California refinery, to Bridge Point Long Beach, LLC, closed July 17, 2018. The assets and liabilities and results of operations related to the Long Beach refinery remained classified as held for sale and discontinued operations as of June 30, 2018. See Note 5 for further information regarding the California Discontinued Entities.
On February 12, 2018, Delek announced it had reached a definitive agreement to sell certain assets and operations of four asphalt terminals (included in Delek's corporate/other segment), as well as an equity method investment in an additional asphalt terminal, to an affiliate of Andeavor. This transaction includes asphalt terminal assets in Bakersfield, Mojave and Elk Grove, California and Phoenix, Arizona, as well as Delek’s 50 percent equity interest in the Paramount-Nevada Asphalt Company, LLC joint venture that operates an asphalt terminal located in Fernley, Nevada. On May 21, 2018, Delek completed the transaction and received net proceeds of approximately $110.8 million, inclusive of the $75.0 million base proceeds as well as certain preliminary working capital adjustments. These associated assets did not meet the definition of held for sale pursuant to ASC 360 as of December 31, 2017, and therefore were not reflected as held for sale nor as discontinued operations in the consolidated financial statements as of and for the year ended December 31, 2017. See Note 5 for further information regarding the disposal of these assets held for sale.
Our condensed consolidated financial statements include the accounts of Delek and its subsidiaries. Certain information and footnote disclosures normally included in annual financial statements prepared in accordance with U.S. Generally Accepted Accounting Principles ("GAAP") have been condensed or omitted, although management believes that the disclosures herein are adequate to make the financial information presented not misleading. Our unaudited condensed consolidated financial statements have been prepared in conformity with GAAP applied on a consistent basis with those of the annual audited financial statements included in our Annual Report on Form 10-K filed with the Securities and Exchange Commission ("SEC") on March 1, 2018 (the "Annual Report on Form 10-K") and in accordance with the rules and regulations of the SEC. These unaudited condensed consolidated financial statements should be read in conjunction with the audited consolidated financial statements and the notes thereto for the year ended December 31, 2017 included in our Annual Report on Form 10-K.
Our condensed consolidated financial statements include Delek Logistics Partners, LP ("Delek Logistics"), Alon USA Partners, LP (the "Alon Partnership") and AltAir Paramount LLC ("AltAir"), all variable interest entities as of December 31, 2017. However, Delek acquired the non-controlling interest in the Alon Partnership on February 7, 2018 and sold AltAir on March 16, 2018. Thus, Delek Logistics is Delek's only remaining variable interest entity as of June 30, 2018. As the indirect owner of the general partner of Delek Logistics, we have the ability to direct the activities of this entity that most significantly impact its economic performance. We are also considered to be the primary beneficiary for accounting purposes for this entity and are Delek Logistics' primary customer. As Delek Logistics does not derive an amount of gross margin
7
material to us from third parties, there is limited risk to Delek associated with Delek Logistics' operations. However, in the event that Delek Logistics incurs a loss, our operating results will reflect such loss, net of intercompany eliminations, to the extent of our ownership interest in this entity.
In the opinion of management, all adjustments necessary for a fair presentation of the financial condition and the results of operations for the interim periods have been included. All significant intercompany transactions and account balances have been eliminated in consolidation. All adjustments are of a normal, recurring nature. Operating results for the interim period should not be viewed as representative of results that may be expected for any future interim period or for the full year.
Certain prior period amounts have been reclassified in order to conform to the current year presentation.
New Accounting Pronouncements
In February 2018, the Financial Accounting Standards Board (the "FASB") issued guidance that allows a reclassification from accumulated other comprehensive income ("AOCI") to retained earnings for stranded tax effects resulting from the Tax Cuts and Jobs Act (the "Tax Reform Act"), which was signed into law on December 22, 2017. Consequently, the amendments eliminate the stranded tax effects related to items in accumulated other comprehensive income resulting from the Tax Reform Act. The new guidance may be applied retrospectively to each period in which the effect of the Tax Reform Act is recognized, or in the period of adoption. This guidance is effective for fiscal years beginning after December 15, 2018, including interim periods within those fiscal years. Early adoption is permitted. We elected to early adopt this guidance effective January 1, 2018. As a result of adopting this guidance, we reclassified $1.6 million from AOCI to retained earnings. The effect of the Tax Reform Act on temporary differences related to amounts initially recorded in AOCI are provisional. As we finalize the accounting for tax effects of the Tax Reform Act on the related temporary differences, additional reclassification adjustments may be recorded in future periods.
In August 2017, the FASB issued guidance to better align financial reporting for hedging activities with the economic objectives of those activities for both financial (e.g., interest rate) and commodity risks. The guidance was intended to create more transparency in the presentation of financial results, both on the face of the financial statements and in the footnotes, and simplify the application of hedge accounting guidance. This guidance is effective for fiscal years beginning after December 15, 2018, and interim periods within those fiscal years. Companies are required to apply the guidance on a modified retrospective transition method in which the cumulative effect of the change will be recognized within equity in the consolidated balance sheet as of the date of adoption. Early adoption is permitted, including in an interim period. If a company early adopts in an interim period, any adjustments should be reflected as of the beginning of the fiscal year that includes the interim period. We expect to adopt this guidance on or before the effective date and are currently evaluating the impact that adopting this new guidance will have on our business, financial condition and results of operations.
In May 2017, the FASB issued guidance that clarifies when changes to the terms or conditions of a share-based payment award must be accounted for as modifications. The modification accounting guidance applies if the value, vesting conditions or classification of the award changes. This guidance is effective for fiscal years beginning after December 15, 2017, and interim periods within those fiscal years. This guidance should be applied prospectively to an award modified on or after the adoption date. We adopted this guidance on January 1, 2018 and the adoption did not have a material impact on our business, financial condition or results of operations.
In March 2017, the FASB issued guidance that will require that an employer disaggregate the service cost component from the other components of net benefit cost with respect to defined benefit postretirement employee benefit plans. Service cost is required to be reported in the same line item or items as other compensation costs arising from services rendered by the pertinent employees during the period. The other components of net periodic benefit cost are required to be reported outside the subtotal for operating income. Additionally, only the service cost component of net benefit costs are eligible for capitalization. The guidance became effective January 1, 2018. We adopted this guidance on January 1, 2018, which will retrospectively impact the presentation of our third and fourth quarter 2017 statements of income as a result of the pension and postretirement obligations assumed in the Delek/Alon Merger. As further discussed in Note 18, only the service cost component of net periodic benefit costs are included as part of general and administrative expenses in the accompanying condensed consolidated statements of income. The other components of net periodic benefit costs are included as part of other non-operating expenses (income), net. As a practical expedient, we will use the amounts disclosed regarding our pension and other postretirement benefit plans for the prior comparative periods as the estimation basis for applying the retrospective presentation requirements in our third quarter 2018 Quarterly Report on Form 10-Q and in our 2018 Annual Report on Form 10-K. This will require recasting of prior periods subsequent to the Delek/Alon Merger.
In February 2017, the FASB issued guidance clarifying the scope of asset derecognition guidance and accounting for partial sales of nonfinancial assets. The amendments in this guidance should be applied using either i) a modified retrospective basis through a cumulative-effect adjustment directly to retained earnings as of the beginning of the period of adoption or ii) a retrospective basis to each period presented in the financial statements. This guidance is effective for annual reporting periods beginning after December 15, 2017, including interim reporting periods within that reporting period. We adopted this guidance on January 1, 2018, and the adoption did not have a material impact on our business, financial condition or results of operations.
In January 2017, the FASB issued guidance concerning the goodwill impairment test that eliminates Step 2, which required a comparison of the implied fair value of goodwill of the reporting unit with the carrying amount of that goodwill for that reporting unit. It also eliminates the requirements for any reporting unit with a zero or negative carrying amount to perform a qualitative assessment and, if it fails that qualitative assessment, to perform Step 2 of the goodwill impairment test. An entity still has the option to perform the qualitative assessment for a reporting
8
unit to determine if the quantitative impairment test is necessary. This guidance is effective for annual or any interim goodwill impairment tests in fiscal years beginning after December 15, 2019. Early adoption is permitted for interim or annual goodwill impairment tests performed on testing dates after January 1, 2017. We expect to adopt this guidance on or before the effective date and we do not anticipate that the adoption will have a material impact on our business, financial condition or results of operations.
In October 2016, the FASB issued guidance that requires an entity to recognize the income tax consequences of an intra-entity transfer of an asset other than inventory when the transfer occurs. This guidance is effective for fiscal years beginning after December 15, 2017, and interim periods within those fiscal years. We adopted this guidance on January 1, 2018. As a result of adopting this guidance, we decreased retained earnings by $29.9 million for the cumulative effect as of January 1, 2018.
In August 2016, the FASB issued guidance that clarifies eight cash flow classification issues pertaining to cash receipts and cash payments. This guidance is effective for fiscal years beginning after December 15, 2017, and interim periods within those fiscal years. We adopted this guidance on January 1, 2018 and the adoption did not have a material impact on our business, financial condition or results of operations, except for reclassifications of certain distributions received from equity method investees, due to Delek making an accounting policy election to classify distributions received from equity method investees using the cumulative earnings approach. Under this approach, distributions received are considered returns on investment and classified as cash inflows from operating activities, unless the investor’s cumulative distributions received less distributions received in prior periods that were determined to be returns of investment exceed cumulative equity in earnings (as adjusted for amortization of basis differences) recognized by the investor. When such an excess occurs, the current-period distribution up to this excess should be considered a return of investment and classified as cash inflows from investing activities. This resulted in a reclassification of $10.6 million of distributions received in the six months ended June 30, 2017 from the line item entitled dividends from equity method investments in net cash provided by (used in) operating activities to the line item entitled distributions from equity method investments in net cash provided by (used in) investing activities in the condensed consolidated statements of cash flows.
In June 2016, the FASB issued guidance requiring the measurement of all expected credit losses for financial assets held at the reporting date based on historical experience, current conditions, and reasonable and supportable forecasts. Financial institutions and other organizations will now use forward-looking information to better inform their credit loss estimates. This guidance is effective for interim and annual periods beginning after December 15, 2019. We expect to adopt this guidance on or before the effective date and are currently evaluating the impact that adopting this new guidance will have on our business, financial condition and results of operations.
In February 2016, the FASB issued guidance that requires the recognition of a lease liability and a right-of-use asset, initially measured at the present value of the lease payments, in the statement of financial condition for all leases with terms longer than one year. This guidance is effective for fiscal years beginning after December 15, 2018, including interim periods within those fiscal years. Early adoption is permitted. In January 2018, the FASB amended the guidance to provide an optional practical expedient to rights of way. The practical expedient permits an entity to not evaluate under the new lease accounting guidance existing or expired rights of way that were not previously accounted for as leases. However, any new or modified rights of way should be evaluated under the new lease accounting guidance. If not elected, an entity should evaluate all existing or expired rights of way in connection with the adoption of the new lease requirement to assess whether they meet the definition of a lease. In July 2018, the FASB amended the guidance to provide a practical expedient regarding the requirement to recast prior periods for the new lease guidance. If elected, comparative periods in transition are not required to be recast, and a cumulative effect of initially applying the guidance will be recognized to the opening balance of retained earnings in the period of adoption. If not elected, we are required to use the modified retrospective adoption method to apply this guidance, under which the cumulative effect of initially applying the guidance will be recognized as an adjustment to the opening balance of retained earnings in the earliest period presented as of the adoption period. We expect to adopt the new lease standard on January 1, 2019 and elect the practical expedient regarding transition. We are currently evaluating the impact adopting this new guidance will have on our business, financial condition and results of operations. As part of our efforts to prepare for adoption, beginning in 2018, we formed a project implementation team, as well as a project timeline, to evaluate this guidance. We have also reviewed and gained an understanding of the new lease accounting guidance and substantially completed lease classification analysis for existing leases. We continue to perform scoping to identify and evaluate arrangements that will qualify as leases under the new standard, as well as to review industry specific implementation guidance. We are continuing to evaluate the impact of the guidance on our business processes, accounting systems, controls and financial statement disclosures, and expect to implement any changes to accommodate the new accounting and disclosure requirements prior to adoption on January 1, 2019.
In January 2016, the FASB issued guidance that affects the accounting for equity investments, financial liabilities accounted for under the fair value option and the presentation and disclosure requirements for financial instruments. Under the new guidance, all equity investments in unconsolidated entities (other than those accounted for using the equity method of accounting) will generally be measured at fair value through earnings. There will no longer be an available-for-sale classification for equity securities with readily determinable fair values. For financial liabilities when the fair value option has been elected, changes in fair value due to instrument-specific credit risk will be recognized separately in other comprehensive income. It will require public business entities to use the exit price notion when measuring the fair value of financial instruments for disclosure purposes and separate presentation of financial assets and financial liabilities by measurement category and form of financial asset, and will eliminate the requirement for public business entities to disclose the method and significant assumptions used to estimate the fair value that is required to be disclosed for financial instruments measured at amortized cost. The new guidance is effective for
9
annual reporting periods beginning after December 15, 2017, including interim reporting periods within that reporting period. We adopted this guidance on January 1, 2018 and the adoption did not have a material impact on our business, financial condition or results of operations.
In May 2014, the FASB issued guidance as codified in Accounting Standards Codification ("ASC") 606, “Revenue from Contracts with Customers ("ASC 606),” to clarify the principles for recognizing revenue. The core principle of the new guidance is that an entity should recognize revenue to depict the transfer of promised goods or services to customers in an amount that reflects the consideration to which the entity expects to be entitled in exchange for those goods or services. The guidance also requires improved interim and annual disclosures that enable the users of financial statements to better understand the nature, amount, timing, and uncertainty of revenues and cash flows arising from contracts with customers. The new guidance is effective for annual reporting periods beginning after December 15, 2017, including interim reporting periods within that reporting period, and can be adopted retrospectively. We adopted this guidance on January 1, 2018, using the modified retrospective transition method applied to contracts which were not completed as of January 1, 2018, and the adoption did not have a material impact on our business, financial condition or results of operations.
The Company has updated its policies as it relates to revenue recognition. Revenue is measured based on consideration specified in a contract with a customer. The Company recognizes revenue when it satisfies a performance obligation by transferring control over a product or by providing services to a customer. The adoption of ASC 606 did not materially change our revenue recognition patterns, which are described below by reportable segment:
Refining. Revenues for products sold are recorded at the point of sale upon delivery of product, which is the point at which title to the product is transferred, the customer has accepted the product and the customer has significant risks and rewards of owning the product. We typically have a right to payment once control of the product is transferred to the customer. Transaction prices for these products are typically at market rates for the product at the time of delivery. Payment terms require customers to pay shortly after delivery and do not contain significant financing components.
Logistics. Revenues for products sold are generally recognized upon delivery of the product, which is when title and control of the product is transferred. Transaction prices for these products are typically at market rates for the product at the time of delivery. Service revenues are recognized as crude oil, intermediate and refined product are shipped through, delivered by or stored in our pipelines, trucks, terminals and storage facility assets, as applicable. We do not recognize product revenues for these services as the product does not represent a promised good in the context of ASC 606. All service revenues are based on regulated tariff rates or contractual rates. Payment terms require customers to pay shortly after delivery and do not contain significant financing components.
Retail. Fuel and merchandise revenue is recognized at the point of sale, which is when control of the product is transferred to the customer. Payments from customers are received at the time sales occur in cash or by credit or debit card. We derive service revenues from the sale of lottery tickets, money orders, car washes and other ancillary product and service offerings. Service revenue and related costs are recorded at gross amounts and net amounts, as appropriate, in accordance with the principal versus agent provisions in ASC 606.
Refer to Note 14 for disclosure of our revenue disaggregated by segment, as well as a description of our reportable segment operations.
Upon the adoption of ASC 606, we made the accounting policy election to exclude from revenue all taxes assessed by a governmental authority, including sales, use and excise taxes, that are both imposed on and concurrent with a specific revenue-producing transaction and collected from a customer. Sales, use and excise taxes were also excluded from revenue historically in accordance with the applicable guidance in ASC 605, Revenue Recognition.
2. Acquisitions
In January 2017, we announced that Old Delek (and various related entities) entered into a merger agreement with Alon, as amended (the "Merger Agreement"). The related Merger (the "Merger" or the "Delek/Alon Merger") was effective July 1, 2017 (as previously defined, the “Effective Time”), resulting in a new post-combination consolidated registrant renamed as Delek US Holdings, Inc. (as previously defined, “New Delek”), with Alon and Old Delek surviving as wholly-owned subsidiaries of New Delek. New Delek is the successor issuer to Old Delek and Alon pursuant to Rule 12g-3(c) under the Exchange Act, as amended. In addition, as a result of the Delek/Alon Merger, the shares of common stock of Old Delek and Alon were delisted from the NYSE in July 2017, and their respective reporting obligations under the Exchange Act were terminated. Prior to the Merger, Old Delek owned a non-controlling equity interest of approximately 47% of the outstanding shares of Alon, which was accounted for under the equity method of accounting (See Note 4).
Subject to the terms and conditions of the Merger Agreement, at the Effective Time, each issued and outstanding share of Alon Common Stock, other than shares owned by Old Delek and its subsidiaries or held in the treasury of Alon, was converted into the right to receive 0.504 of a share of New Delek Common Stock, or, in the case of fractional shares of New Delek Common Stock, cash (without interest) in an amount equal to the product of (i) such fractional part of a share of New Delek Common Stock multiplied by (ii) $25.96 per share, which was the volume weighted average price of the Old Delek Common Stock, par value $0.01 per share as reported on the NYSE Composite Transactions Reporting System for the twenty consecutive NYSE full trading days ending on June 30, 2017. Each outstanding share of restricted Alon Common Stock
10
was assumed by New Delek and converted into restricted stock denominated in shares of New Delek Common Stock, using the conversion rate applicable to the Merger. Committed but unissued share-based awards were exchanged and converted into rights to receive share-based awards indexed to New Delek Common Stock.
In addition, subject to the terms and conditions of the Merger Agreement, each share of Old Delek Common Stock or fraction thereof issued and outstanding immediately prior to the Effective Time (other than Old Delek Common Stock held in the treasury of Old Delek, which was retired in connection with the Merger) was converted at the Effective Time into the right to receive one validly issued, fully paid and non‑assessable share of New Delek Common Stock or such fraction thereof equal to the fractional share of New Delek Common Stock. All existing Old Delek stock options, restricted stock awards and stock appreciation rights were converted into equivalent rights with respect to New Delek Common Stock.
In connection with the Merger, Alon, New Delek and U.S. Bank National Association, as trustee (the “Trustee”) entered into a First Supplemental Indenture (the “Supplemental Indenture”), effective as of July 1, 2017, supplementing the Indenture, dated as of September 16, 2013 (the “Original Indenture”; the Original Indenture, as amended by the Supplemental Indenture, is referred to as the "Indenture"), pursuant to which Alon issued its 3.00% Convertible Senior Notes due 2018 (the “Convertible Notes”), which were convertible into shares of Alon’s Common Stock, par value $0.01 per share or cash or a combination of cash and Alon Common Stock, all as provided in the Indenture. The Supplemental Indenture provides that, as of the Effective Time, the right to convert each $1,000 principal amount of the Convertible Notes based on a number of shares of Alon Common Stock equal to the Conversion Rate (as defined in the Indenture) in effect immediately prior to the Merger was changed into a right to convert each $1,000 principal amount of Convertible Notes into or based on a number of shares of New Delek Common Stock (at the exchange rate of 0.504), par value $0.01 per share, equal to the Conversion Rate in effect immediately prior to the Merger. In addition, the Supplemental Indenture provides that, as of the Effective Time, New Delek fully and unconditionally guaranteed, on a senior basis, Alon’s obligations under the Convertible Notes.
In connection with the Indenture, Alon also entered into equity instruments, including Call Options and Warrants, designed, in combination, to hedge a portion of the risk associated with the potential exercise of the conversion feature of the Convertible Notes and to mitigate the dilutive effect of such potential conversion. These equity instruments, in addition to the conversion feature, represent equity instruments originally indexed to Alon Common Stock that were exchanged for instruments with terms designed to preserve the original economic intent of such instruments and indexed to New Delek Common Stock in connection with the Merger. See Note 8 for further discussion.
Alon is a refiner and marketer of petroleum products, operating primarily in the south central, southwestern and western regions of the United States. As of December 31, 2017, Alon owned 100% of the general partner and 81.6% of the limited partner interests in the Alon Partnership, which owns a crude oil refinery in Big Spring, Texas with a crude oil throughput capacity of 73,000 bpd and an integrated wholesale marketing business. Delek acquired the non-controlling interest in the Alon Partnership on February 7, 2018. In addition, Alon directly owns a crude oil refinery in Krotz Springs, Louisiana with a crude oil throughput capacity of 74,000 barrels per day ("bpd"). As of December 31, 2017, Alon also owned crude oil refineries in California, which have not processed crude oil since 2012. On March 16, 2018, Delek sold to World Energy, LLC the Paramount, California refinery and our California renewables facility (AltAir). The transaction to dispose of certain assets and liabilities associated with the Long Beach, California refinery, to Bridge Point Long Beach, LLC, closed July 17, 2018. The assets and liabilities and results of operations related to the Long Beach refinery remained classified as held for sale and discontinued operations as of June 30, 2018. Alon is a marketer of asphalt, which it distributes through asphalt terminals located predominantly in the southwestern and western United States. On May 21, 2018, Delek sold four asphalt terminals (included in Delek's corporate/other segment) and its 50% interest in an asphalt joint venture to an affiliate of Andeavor. See further discussion in Notes 1 and 5. Alon is the largest 7-Eleven licensee in the United States and operates approximately 300 convenience stores which market motor fuels in central and west Texas and New Mexico.
Transaction costs incurred by the Company in connection with the Delek/Alon Merger totaled $1.8 million and $6.6 million for the three and six months ended June 30, 2018, respectively. Such costs were included in general and administrative expenses in the accompanying condensed consolidated statements of income.
The Merger is accounted for using the acquisition method of accounting, which requires, among other things, that assets acquired at their fair values and liabilities assumed be recognized on the balance sheet as of the acquisition date.
11
The components of the consideration transferred were as follows (dollars in millions, except per share amounts):
Delek common stock issued | 19,250,795 | |||||||
Ending price per share of Delek Common Stock immediately before the Effective Time | $ | 26.44 | ||||||
Total value of common stock consideration | $ | 509.0 | ||||||
Additional consideration (1) | 21.7 | |||||||
Fair value of Delek's pre-existing equity method investment in Alon (2) | 449.0 | |||||||
$ | 979.7 | |||||||
The final allocation of the aggregate purchase price as of June 30, 2018 is summarized as follows (in millions), and is inclusive of the California Discontinued Entities discussed in Note 5:
Cash | $ | 215.3 | ||
Receivables | 176.8 | |||
Inventories | 266.3 | |||
Prepaids and other current assets | 38.7 | |||
Property, plant and equipment (3) | 1,130.3 | |||
Equity method investments | 31.0 | |||
Acquired intangible assets (4) | 86.7 | |||
Goodwill (5) | 870.7 | |||
Other non-current assets | 37.0 | |||
Accounts payable | (263.4 | ) | ||
Obligation under Supply & Offtake Agreements | (208.9 | ) | ||
Current portion of environmental liabilities | (7.9 | ) | ||
Other current liabilities | (308.6 | ) | ||
Environmental liabilities and asset retirement obligations, net of current portion | (226.7 | ) | ||
Deferred income taxes | (194.0 | ) | ||
Debt | (568.0 | ) | ||
Other non-current liabilities (6) | (95.6 | ) | ||
Fair value of net assets acquired | $ | 979.7 | ||
(1) Additional consideration includes the fair value of certain equity instruments originally indexed to Alon stock that were exchanged for instruments indexed to New Delek's stock, as well as the fair value of certain share-based payments that were required to be exchanged for awards indexed to New Delek's stock in connection with the Delek/Alon Merger.
(2) The fair value of Delek's pre-existing equity method investment in Alon was based on the quoted market price of shares of Alon.
(3) This fair value of property, plant and equipment is based on a valuation using a combination of the income, cost and market approaches. The useful lives are based upon guidelines for similar equipment, chronological age since installation and consideration of costs spent on upgrades, repairs, turnarounds and rebuilds.
(4) The acquired intangible assets amount includes the following identified intangibles:
• | Third-party fuel supply agreement intangible that is subject to amortization with a fair value of $49.0 million, which will be amortized over a 10-year useful life. We recognized amortization expense for the three and six months ended June 30, 2018 of $1.2 million and $2.4 million, respectively. The estimated annual amortization is $4.9 million for the current and the four succeeding fiscal years. |
12
• | Fuel trade name intangible valued at $4.0 million, which will be amortized over 5 years. We recognized amortization expense for the three and six months ended June 30, 2018 of $0.2 million and $0.4 million, respectively. The estimated annual amortization is $0.8 million for the current and the three succeeding fiscal years, with $0.4 million in the fourth succeeding year. |
• | License agreements intangible valued at $2.6 million, which will be amortized over 8.7 years. We recognized amortization expense for the three and six months ended June 30, 2018 of $0.1 million and $0.2 million, respectively. The estimated annual amortization is $0.3 million for the current and the four succeeding fiscal years. |
• | Rights-of-way intangible valued at $9.5 million, which has an indefinite life. |
• | Liquor license intangible valued at $8.5 million, which has an indefinite life. |
• | Colonial Pipeline shipping rights intangible valued at $1.7 million, which has an indefinite life. |
• | Refinery permits valued at $3.1 million, which have an indefinite life. |
• | Below-market lease intangibles valued at $8.3 million, which will be amortized over the remaining lease term. |
(5) Goodwill generated as a result of the Delek/Alon Merger consists of the value of expected synergies from combining operations, the acquisition of an existing integrated refining, marketing and retail business located in areas with access to cost–advantaged feedstocks with an assembled workforce that cannot be duplicated at the same costs by a new entrant, and the strategic advantages of having a larger market presence. The total amount of goodwill that is expected to be deductible for tax purposes is $15.5 million. Goodwill has been allocated to reportable segments based on various relevant factors. The updated allocation of goodwill to reportable segments in connection with the purchase price allocation is as follows: Refining - $801.3 million and Retail- $44.3 million. The remainder relates to the asphalt operations, which is included in the corporate, other and eliminations segment, and which was subsequently written off as part of the impairment on assets held for sale during the six months ended June 30, 2018.
(6) The assumed other non-current liabilities include liabilities related to above-market leases fair valued at $15.8 million, which will be amortized over the remaining lease term.
The following unaudited pro forma financial information presents the condensed combined results of operations of Delek and Alon for the three and six months ended June 30, 2017 as if the Delek/Alon Merger had occurred on January 1, 2017. The unaudited pro forma financial information is not intended to represent or be indicative of the consolidated results of operations that would have been reported had the Delek/Alon merger been completed as of January 1, 2017, and should not be taken as indicative of New Delek's future consolidated results of operations. In addition, the unaudited pro forma condensed combined results of operations do not reflect any cost savings or associated costs to achieve such savings from operating efficiencies, synergies, debt refinancing or other restructuring that may result from the Delek/Alon Merger. The pro forma financial information also does not reflect certain non-recurring adjustments that have been or are expected to be recorded in connection with the Delek/Alon Merger, including any accrual for integration costs or transaction costs or additional transactions costs related to the Merger, nor any retrospective adjustments related to the conforming of Alon's accounting policies to Delek's accounting policies, as such adjustments are impracticable to determine, and such adjustments are not expected to be indicative of on-going operations of the combined company. Finally, the pro forma presentation of net revenues and net income is inclusive of the revenue and net income (loss) attributable to the California Discontinued Entities (which are generally not material as the majority of the California Discontinued Entities were non-operating during the pro forma period). Pro forma adjustments are tax-effected at the Company's estimated statutory tax rates.
(in millions, except per share data) | Three Months Ended June 30, 2017 | Six Months Ended June 30, 2017 | |||||
Net revenues | $ | 2,303.3 | $ | 4,623.5 | |||
Net (loss) income attributable to Delek | (17.9 | ) | $ | 15.5 | |||
(Loss) earnings per share: | |||||||
Basic | $ | (0.22 | ) | $ | 0.19 | ||
Diluted | $ | (0.22 | ) | $ | 0.19 | ||
13
The unaudited pro forma statements of operations reflect the following adjustments:
• | To eliminate transactions between Delek and Alon for purchases and sales of refined products, reducing revenue and the associated cost of goods sold. Such pro forma eliminations resulted in a decrease to combined pro forma revenue by $46.5 million and $59.0 million for the three and six months ended June 30, 2017, respectively. |
• | To eliminate the non-recurring transaction costs incurred during the historical periods. Such adjustments to general and administrative expense have been estimated to result in an increase to pro forma pre-tax income attributable to Delek totaling $5.8 million and $11.5 million for the three and six months ended June 30, 2017, respectively. |
• | To retrospectively reflect depreciation of property, plant and equipment and amortization of intangibles based on the fair value of the assets as of the acquisition date, as if that fair value had been reflected beginning January 1, 2017, and to retrospectively eliminate the amortization of any previously recorded intangibles. Such adjustments to depreciation and amortization have been estimated to result in an increase to pro forma pre-tax income attributable to Delek totaling $16.9 million and $34.7 million for the three and six months ended June 30, 2017, respectively. |
• | To retrospectively reflect the accretion of asset retirement obligations and certain environmental liabilities. Such adjustments to general and administrative expense have been estimated to result in a decrease to pro forma pre-tax income attributable to Delek totaling $0.4 million and $0.8 million for the three and six months ended June 30, 2017. |
• | To retrospectively reflect adjustments to interest expense, including the impact of discounts or premiums created by the difference in fair value and outstanding amounts as of the acquisition date (collectively, the “new effective yield”), by applying the new effective yield to historical outstanding amounts in the pro forma period and reversing previously recognized interest expense. Such net adjustments to interest expense have been estimated to result in an increase to pro forma pre-tax income attributable to Delek totaling $6.2 million and $9.4 million for the three and six months ended June 30, 2017, respectively. |
• | To eliminate Delek’s equity income previously recorded on its equity method investment in Alon, prior to the Merger. Such pro forma elimination resulted in a decrease to pro forma pre-tax income attributable to Delek totaling $0.4 million and $3.2 million for the three and six months ended June 30, 2017, respectively. |
• | To record the tax effect on pro forma adjustments and additional tax benefit associated with dividends received from Alon at a combined U.S. (federal and state) income tax statutory blended rate of approximately 37% for both the three and six months ended June 30, 2017. |
• | To adjust the weighted average number of shares outstanding based on 0.504 of a share of Delek common stock for each share of Alon common stock outstanding as of June 30, 2018, reflecting the elimination of Alon historical weighted average shares outstanding and the addition of the estimated New Delek incremental shares issued. |
Delek began consolidating Alon's results of operations on July 1, 2017. Alon operations contributed $833.5 million and $1,612.6 million to net revenues and $104.2 million and $57.3 million to pre-tax income for the three and six months ended June 30, 2018, respectively, inclusive of the contribution of the California Discontinued Entities.
14
Updates to the Preliminary Purchase Price Allocation
During the three months ended June 30, 2018, we finalized our procedures to determine the fair value of assets and liabilities assumed in the Delek/Alon Merger, as anticipated and disclosed in our Annual Report on Form 10-K. As a result, the following changes were made to the preliminary purchase price allocation disclosed in our Annual Report on Form 10-K:
Subsequent increases (decreases) to initial allocation of fair value of net assets acquired: | ||||
Receivables (1) | $ | 10.7 | ||
Inventories | (0.5 | ) | ||
Prepaids and other current assets (2) | 9.7 | |||
Property, plant and equipment | (0.2 | ) | ||
Acquired intangible assets (3) | 7.7 | |||
Accounts payable (4) | 6.0 | |||
Obligation under Supply & Offtake Agreements (5) | 10.9 | |||
Current portion of environmental liabilities | 0.4 | |||
Other current liabilities (6) | 22.3 | |||
Environmental liabilities and asset retirement obligations, net of current portion (7) | 65.3 | |||
Deferred income taxes (8) | (8.4 | ) | ||
Other non-current liabilities (9) | (2.8 | ) | ||
Resulting increase to goodwill | $ | 66.3 | ||
(1) Change primarily relates to the recognition of a receivable associated with a third-party indemnification agreement for asset retirement obligations for one of the acquired refineries that was previously under review, and finalization of an accrued receivable estimate.
(2) Change primarily relates to a reclassification of Renewable Identification Numbers ("RINs") assets from other current liabilities to other current assets.
(3) Change is primarily due to the addition of an intangible asset for certain below-market leases that had previously been identified but for which the evaluation and determination of fair value was not complete at December 31, 2017.
(4) Change is primarily due to the elimination of amounts in accounts payable in the retail segment that were determined not to have value combined with reclassifications of amounts to accounts receivable.
(5) Change relates to true-up of certain accounts related to one of the acquired supply and offtake agreements for contractual terms that were previously under review.
(6) Change is primarily due to an increase related to the reclassification of RINs assets from other current liabilities to other current assets and an increase related to the accrual of certain executive bonuses that were required under existing Alon employment agreements and related to service provided prior to the Delek/Alon Merger, net of adjustments to current income taxes payable to true up income taxes related to the acquired net assets.
(7) Change is to record the long-term portion of additional asset retirement obligations and environmental liabilities identified and/or to update preliminary estimates based on additional information.
(8) Change is related to adjustments to net deferred tax liabilities based on the updated purchase price allocation and revisions of preliminary tax estimates.
(9) Change is related to the reversal of an accrual established in the purchase price allocation related to a pre-acquisition legal contingency that was resolved during the first quarter 2018 in our favor.
During the three and six months ended June 30, 2018, certain immaterial catch-up adjustments were recorded related to accretion of environmental liabilities and amortization of leasehold intangibles identified and valued during those periods.
15
3. Delek Logistics and the Alon Partnership
Delek Logistics
Delek Logistics is a publicly traded limited partnership that was formed by Delek in 2012 to own, operate, acquire and construct crude oil and refined products logistics and marketing assets. A substantial majority of Delek Logistics' assets are integral to Delek’s refining and marketing operations. As of June 30, 2018, we owned a 61.4% limited partner interest in Delek Logistics, consisting of 15,294,046 common units, and a 94.6% interest in Delek Logistics GP, LLC, which owns the entire 2.0% general partner interest, consisting of 497,861 general partner units, in Delek Logistics and all of the incentive distribution rights.
The limited partner interests in Delek Logistics not owned by us are reflected in net income attributable to non-controlling interest in the accompanying condensed consolidated statements of income and in non-controlling interest in subsidiaries in the accompanying condensed consolidated balance sheets.
In March 2018, a subsidiary of Delek Logistics completed the acquisition from a subsidiary of Delek ( the Alon Partnership) of storage tanks and terminals that support our Big Spring, Texas refinery (the "Big Spring Logistic Assets Acquisition"), which included the execution of related commercial agreements. In addition, a new marketing agreement was entered into between the subsidiary of Delek Logistics and the Alon Partnership pursuant to which the subsidiary of Delek Logistics will provide marketing services for product sales from Big Spring. The cash paid for the transferred assets was $170.8 million, subject to certain post-closing adjustments, and the cash paid for the marketing agreement was $144.2 million. The transactions were financed with borrowings under the DKL Revolver (as defined in Note 8 of the condensed consolidated financial statements in Item 1, Financial Statements). Prior periods have not been recast in our Segment Data Note 14, as these assets do not constitute a business in accordance with the Accounting Standard Update, "Clarifying the Definition of a Business" and were accounted for as acquisitions of assets between entities under common control.
We have agreements with Delek Logistics that, among other things, establish fees for certain administrative and operational services provided by us and our subsidiaries to Delek Logistics, provide certain indemnification obligations and establish terms for fee-based commercial logistics and marketing services provided by Delek Logistics and its subsidiaries to us, including new agreements related to the Big Spring Logistic Assets Acquisition. The revenues and expenses associated with these agreements are eliminated in consolidation.
Delek Logistics is a variable interest entity, as defined under GAAP, and is consolidated into our condensed consolidated financial statements, representing our logistics segment. With the exception of intercompany balances and the marketing agreement intangible and related deferred revenue which are eliminated in consolidation, the Delek Logistics condensed consolidated balance sheets as of June 30, 2018 and December 31, 2017, as presented below, are included in the consolidated balance sheets of Delek (unaudited, in millions).
June 30, 2018 | December 31, 2017 | |||||||
ASSETS | ||||||||
Cash and cash equivalents | $ | 5.2 | $ | 4.7 | ||||
Accounts receivable | 21.9 | 23.0 | ||||||
Accounts receivable from related parties | 9.7 | 1.1 | ||||||
Inventory | 12.7 | 20.9 | ||||||
Other current assets | 0.7 | 0.7 | ||||||
Property, plant and equipment, net | 319.3 | 255.1 | ||||||
Equity method investments | 106.4 | 106.5 | ||||||
Goodwill | 12.2 | 12.2 | ||||||
Intangible assets, net | 157.6 | 15.9 | ||||||
Other non-current assets | 4.6 | 3.4 | ||||||
Total assets | $ | 650.3 | $ | 443.5 | ||||
LIABILITIES AND DEFICIT | ||||||||
Accounts payable | $ | 9.3 | $ | 19.1 | ||||
Accrued expenses and other current liabilities | 11.9 | 12.6 | ||||||
Long-term debt | 737.1 | 422.6 | ||||||
Asset retirement obligations | 5.0 | 4.1 | ||||||
Other non-current liabilities | 16.0 | 14.3 | ||||||
Deficit | (129.0 | ) | (29.2 | ) | ||||
Total liabilities and deficit | $ | 650.3 | $ | 443.5 | ||||
16
Alon Partnership
The Alon Partnership owns the assets and conducts the operations of the Big Spring refinery and the associated integrated wholesale marketing operations. On November 8, 2017, Delek and the Alon Partnership entered into a definitive merger agreement under which Delek agreed to acquire all of the outstanding limited partner units which Delek did not already own in an all-equity transaction (the "Alon Partnership Merger"). This transaction closed on February 7, 2018 (the "Merger Date"). Delek owned approximately 51.0 million limited partner units of the Alon Partnership, or approximately 81.6% of the outstanding units, immediately prior to the Merger Date. Under terms of the merger agreement, the owners of the remaining outstanding units in the Alon Partnership that Delek did not own immediately prior to the Merger Date received a fixed exchange ratio of 0.49 shares of New Delek common stock for each limited partner unit of the Alon Partnership, resulting in the issuance of approximately 5.6 million shares of New Delek common stock to the public unitholders of the Alon Partnership. Because the transaction represented a combination of ownership interests under common control, the transfer of equity from non-controlling interest to owned interest (additional paid-in capital) was recorded at carrying value and no gain or loss was recognized in connection with the transaction. Additionally, book-tax basis difference was created as a result of the transaction that resulted in a deferred tax asset of approximately $13.5 million, net of a valuation allowance on certain state income tax components, that also increased additional paid-in capital.
The limited partner interests of the Alon Partnership prior to this acquisition were represented as common units outstanding. As of December 31, 2017, the 11,492,800 common units held by the public represented approximately 18.4% of the Alon Partnership’s common units outstanding. Alon USA Partners GP, LLC (the “Alon General Partner”), our wholly-owned subsidiary, owns 100% of the general partner interest in the Alon Partnership, which is a non-economic interest.
The limited partner interests in the Alon Partnership not owned by us as of December 31, 2017 are reflected in non-controlling interest in subsidiaries in the accompanying condensed consolidated balance sheet.
Prior to the Alon Partnership Merger, we had agreements with the Alon Partnership, under which the Alon Partnership agreed to reimburse us for certain administrative and operational services provided by us and our subsidiaries to the Alon Partnership, indemnify us with respect to certain matters and establish terms for the supply of products by the Alon Partnership to us.
Prior to the Merger Date, the Alon Partnership was a variable interest entity, as defined under GAAP, and was consolidated into our condensed consolidated financial statements as part of the refining segment. We have elected to push down purchase accounting to the Alon Partnership, which resulted in the push-down of the preliminary fair value of equity as purchase price consideration based on the market value of the Alon Partnership units as of the Merger Date, and the fair valuing of assets and liabilities as of the Merger Date. Such push-down purchase accounting also resulted in a determination of the fair value of our non-controlling interest in the Alon Partnership, which was estimated to be $120.6 million. With the exception of intercompany balances, which are eliminated in consolidation, the Alon Partnership condensed consolidated balance sheet as of December 31, 2017 (required disclosure for a consolidated variable interest entity), as presented below, is included in the consolidated balance sheet of Delek (unaudited, in millions).
December 31, 2017 | ||||
ASSETS | ||||
Cash and cash equivalents | $ | 252.8 | ||
Accounts receivable | 96.7 | |||
Accounts receivable from related parties | 640.0 | |||
Inventories | 133.2 | |||
Prepaid expenses and other current assets | 5.9 | |||
Property, plant and equipment, net | 413.3 | |||
Goodwill | 576.6 | |||
Other non-current assets | 59.2 | |||
Total assets | $ | 2,177.7 | ||
LIABILITIES AND EQUITY | ||||
Accounts payable | $ | 44.5 | ||
Accounts payable to related parties | 794.2 | |||
Accrued expenses and other current liabilities | 161.9 | |||
Current portion of long-term debt | 337.4 | |||
Obligation under Supply and Offtake Agreement | 120.1 | |||
Deferred income tax liability | 1.3 | |||
Other non-current liabilities | 34.5 | |||
Equity | 683.8 | |||
Total liabilities and deficit | $ | 2,177.7 | ||
17
Transaction costs incurred by the Company in connection with the Alon Partnership Merger totaled approximately $3 million for the six months ended June 30, 2018. Such costs were included in general and administrative expenses in the accompanying condensed consolidated statements of income.
As of June 30, 2018, the Alon Partnership is included in Delek's condensed consolidated balance sheet as a wholly-owned subsidiary.
4. Equity Method Investments
On May 14, 2015, Delek acquired from Alon Israel Oil Company, Ltd. ("Alon Israel") approximately 33.7 million shares of common stock (the "ALJ Shares") of Alon pursuant to the terms of a stock purchase agreement with Alon Israel dated April 14, 2015 (the "Alon Acquisition"). The ALJ Shares represented an equity interest in Alon of approximately 48% at the time of acquisition. Effective July 1, 2017, Alon became a wholly-owned subsidiary of New Delek in connection with the Delek/Alon Merger. See Note 2 for further discussion.
Below are the summarized results of operations of Alon (in millions) for the previous periods when Alon was accounted for as an equity method investment:
Income Statement Information | Three Months Ended June 30, 2017 | Six Months Ended June 30, 2017 | ||||||
Revenue | $ | 1,119.1 | $ | 2,269.7 | ||||
Gross profit | 173.5 | 351.2 | ||||||
Pre-tax income | 7.1 | 20.0 | ||||||
Net income | 4.8 | 15.0 | ||||||
Net income attributable to Alon | 2.2 | 9.5 | ||||||
Delek Logistics has two joint ventures that own and operate logistics assets, and which serve third parties and subsidiaries of Delek. As of June 30, 2018 and December 31, 2017, Delek Logistics' investment balance in these joint ventures was $106.4 million and $106.5 million, respectively, and was accounted for using the equity method.
In February, 2018, Delek Logistics and an affiliate of Green Plains Partners LP (NYSE: GPP, "Green Plains") entered into a joint venture engaging in the light products terminalling business. The companies formed DKGP Energy Terminals, LLC ("DKGP Energy"). Delek Logistics and Green Plains each own a 50% membership interest in DKGP Energy. DKGP Energy signed a membership interest purchase agreement (the "Membership Interest Purchase Agreement") to acquire two light products terminals located in Caddo Mills, Texas and North Little Rock, Arkansas from an affiliate of American Midstream Partners, L.P. ("American Midstream"), subject to certain closing conditions and regulatory approvals (the "DKGP Transaction"). The Membership Interest Purchase Agreement expired on August 1, 2018 pursuant to its terms (primarily due to delays in receiving federal regulatory approval for the acquisition), and the contemplated DKGP Transaction terminated (the "DKGP Termination"). As a result of the DKGP Termination, the contemplated contribution of certain Delek Logistics terminals to DKGP Energy, in connection with the DKGP Transaction, terminated. At this time, Delek Logistics and Green Plains do not have any further transaction or development plans with respect to DKGP Energy.
In July 2017, Delek Renewables, LLC invested in a joint venture with an unrelated third party that was formed to plan, develop, construct, own, operate and maintain a terminal consisting of an ethanol unit train facility with an ethanol tank in North Little Rock, Arkansas. This investment was financed through cash from operations. As of both June 30, 2018 and December 31, 2017, Delek Renewables, LLC's investment balance in this joint venture was $2.2 million and was accounted for using the equity method. The investment in this joint venture is reflected in the refining segment.
Effective with the Delek/Alon Merger, we acquired a 50% interest in two joint ventures that own asphalt terminals located in Fernley, Nevada, and Brownwood, Texas. On May 21, 2018, Delek sold its 50% interest in the asphalt terminal located in Fernley, Nevada (see Note 5 for further discussion). As of June 30, 2018, Delek's investment balance in the Brownwood, Texas joint venture was $21.9 million and as of December 31, 2017, Delek's investment balance in both joint ventures was $29.4 million. These investments are accounted for using the equity method and are included as part of total assets in the corporate, other and eliminations segment.
18
5. Discontinued Operations and Assets Held for Sale
California Discontinued Entities
During the third quarter 2017, we committed to a plan to sell certain assets associated with our Paramount and Long Beach, California refineries and our California renewable fuels facility (AltAir), which were acquired as part of the Delek/Alon Merger. As a result of this decision and commitment to a plan, and because it was made within three months of the Delek/Alon Merger, we met the requirements under ASC 205-20 and ASC 360 to report the results of the California Discontinued Entities as discontinued operations and to classify the California Discontinued Entities as a group of assets held for sale as of July 1, 2017. The property, plant and equipment of the California Discontinued Entities were recorded at fair value as part of the Delek/Alon Merger, and we have not recorded any depreciation of these assets since the Delek/Alon Merger.
On March 16, 2018, Delek sold to World Energy, LLC (i) all of Delek’s membership interests in AltAir (ii) certain refining assets and other related assets located in Paramount, California and (iii) certain associated tank farm and pipeline assets and other related assets located in California. Upon final settlement, Delek expects to receive net cash proceeds of approximately $85.9 million, subject to a post-closing working capital settlement, Delek’s portion of the expected biodiesel tax credit for 2017 and certain customary adjustments. The sale resulted in a loss on sale of discontinued operations totaling approximately $41.2 million during the six months ended June 30, 2018 (none during the three months ended June 30, 2018). Of the total expected proceeds, $54.6 million was received in March 2018 ($14.9 million of which proceeds were included in net cash flows from investing activities in discontinued operations), with the remainder expected to be collected in the third quarter of 2018. In connection with the sale, the remaining assets and liabilities associated with the sold operations that were not included in the assets and liabilities acquired/assumed by the buyer were reclassified into assets and liabilities held and used (relating to continuing operations) and are presented as such in our June 30, 2018 balance sheet.
The transaction to dispose of certain assets and liabilities associated with our Long Beach, California refinery to Bridge Point Long Beach, LLC closed July 17, 2018 resulting in initial cash proceeds of approximately $14.9 million. The assets and liabilities and results of operations related to the Long Beach refinery remained classified as held for sale and discontinued operations as of June 30, 2018.
The carrying amount of the major classes of assets and liabilities of the California Discontinued Entities included in assets held for sale and liabilities associated with assets held for sale are as follows (in millions):
June 30, 2018 | December 31, 2017 | |||||||
Assets held for sale: | ||||||||
Cash and cash equivalents | $ | — | $ | 10.1 | ||||
Accounts receivable | — | 7.9 | ||||||
Inventory | — | 1.9 | ||||||
Other current assets | — | 1.3 | ||||||
Property, plant & equipment, net | 23.7 | 130.0 | ||||||
Deferred tax assets | 1.5 | — | ||||||
Other intangibles, net | — | 6.6 | ||||||
Other non-current assets | — | 2.2 | ||||||
Assets held for sale | $ | 25.2 | $ | 160.0 | ||||
Liabilities associated with assets held for sale: | ||||||||
Accrued expenses and other current liabilities | $ | 0.2 | $ | 9.5 | ||||
Deferred tax liabilities | — | 63.9 | ||||||
Other non-current liabilities | 11.8 | 32.5 | ||||||
Liabilities associated with assets held for sale | $ | 12.0 | $ | 105.9 | ||||
19
Once the operating assets of the California Discontinued Entities met the criteria to be classified as assets held for sale, the operations associated with these properties qualified for reporting as discontinued operations. Accordingly, the operating results, net of tax, from discontinued operations are presented separately in Delek’s condensed consolidated statements of income and the notes to the condensed consolidated financial statements have been adjusted to exclude the discontinued operations. Classification as discontinued operations requires retrospective reclassification of the associated assets, liabilities and results of operations for all periods presented, beginning (in this case) as of the date of acquisition, which was July 1, 2017. Components of amounts reflected in income from discontinued operations are as follows (in millions):
Three Months Ended | Six Months Ended | |||||||
June 30, 2018 | June 30, 2018 | |||||||
Net revenues | $ | — | 32.5 | |||||
Cost of goods sold | — | 3.8 | ||||||
Operating expenses | (1.0 | ) | (8.8 | ) | ||||
General and administrative expenses | — | (1.1 | ) | |||||
Other operating expense, net | — | 0.3 | ||||||
Interest income | — | 3.0 | ||||||
Loss on sale of California Discontinued Entities | — | (41.2 | ) | |||||
Loss from discontinued operations before taxes | (1.0 | ) | (11.5 | ) | ||||
Income tax benefit | (0.2 | ) | (2.5 | ) | ||||
Loss from discontinued operations, net of tax | $ | (0.8 | ) | $ | (9.0 | ) | ||
The net assets of the California Discontinued Entities include a non-controlling interest totaling $10.5 million as of December 31, 2017, related to AltAir. Net income attributable to non-controlling interest included $8.1 million related to AltAir for the six months ended June 30, 2018 (none for the three months ended June 30, 2018).
Asphalt Terminals Held for Sale
On February 12, 2018, Delek announced it had reached a definitive agreement to sell certain assets and operations of four asphalt terminals (included in Delek's corporate/other segment), as well as an equity method investment in an additional asphalt terminal, to an affiliate of Andeavor. This transaction includes asphalt terminal assets in Bakersfield, Mojave and Elk Grove, California and Phoenix, Arizona, as well as Delek’s 50 percent equity interest in the Paramount-Nevada Asphalt Company, LLC joint venture that operates an asphalt terminal located in Fernley, Nevada. On May 21, 2018, Delek completed the transaction and received net proceeds of approximately $110.8 million, inclusive of the $75.0 million base proceeds as well as certain preliminary working capital adjustments. The assets associated with the owned terminals met the definition of held for sale pursuant to ASC 360 as of February 1, 2018, but did not meet the definition of discontinued operations pursuant to ASC 205-20, as the sale of these asphalt assets does not represent a strategic shift that will have a major effect on the entity's operations and financial results. Accordingly, depreciation ceased as of February 1, 2018, and the assets to be sold were reclassified to assets held for sale as of that date and were written down to the estimated fair value less costs to sell, resulting in an impairment loss on assets held for sale of $27.5 million for the six months ended June 30, 2018 (none for the three months ended June 30, 2018). All goodwill associated with the asphalt operations sold was written off in connection with the impairment charge discussed above. In connection with the completion of the sale transaction, we recognized a gain of approximately $13.2 million, resulting primarily from the recognition of certain additional proceeds at closing associated with the asphalt terminals which were not previously determinable/probable and the recognition of the gain on the sale of the joint venture which was not previously recognized as held for sale (as it did not meet the criteria). Such gain on sale of the asphalt assets is reflected in results of continuing operations on the accompanying consolidated income statement.
These associated assets did not meet the definition of held for sale pursuant to ASC 360 as of December 31, 2017, and therefore were not reflected as held for sale nor as discontinued operations in the consolidated financial statements as of and for the year ended December 31, 2017.
6. Inventory
Crude oil, work in process, refined products, blendstocks and asphalt inventory for all of our operations, excluding the Tyler, Texas refinery (the "Tyler refinery") and merchandise inventory in our Retail segment, are stated at the lower of cost determined using the FIFO basis or net realizable value. Cost of all inventory at the Tyler refinery is determined using the LIFO inventory valuation method and inventory is stated at the lower of cost or market. Retail merchandise inventory consists of cigarettes, beer, convenience merchandise and food service merchandise and is stated at estimated cost as determined by the retail inventory method.
20
Carrying value of inventories consisted of the following (in millions):
June 30, 2018 | December 31, 2017 | |||||||
Refinery raw materials and supplies | $ | 385.1 | $ | 308.0 | ||||
Refinery work in process | 92.8 | 79.2 | ||||||
Refinery finished goods | 355.7 | 366.4 | ||||||
Retail fuel | 8.3 | 8.3 | ||||||
Retail merchandise | 26.9 | 25.6 | ||||||
Logistics refined products | 12.7 | 20.9 | ||||||
Total inventories | $ | 881.5 | $ | 808.4 | ||||
At June 30, 2018, we recorded a pre-tax inventory valuation reserve of $0.8 million, $0.5 million of which related to LIFO inventory due to a market price decline below our average cost of certain inventory products, which is subject to reversal in subsequent periods, not to exceed LIFO cost, should market prices recover. At December 31, 2017, we recorded a pre-tax inventory valuation reserve of $2.4 million, $1.5 million of which related to LIFO inventory, which reversed in the first quarter of 2018, as the inventories associated with the valuation adjustment at the end of 2017 were sold or used. We recognized net LIFO inventory valuation gains (losses) of $0.3 million and $0.7 million for the three and six months ended June 30, 2018, respectively, and $(10.8) million and $(13.5) million for the three and six months ended June 30, 2017, respectively. These gains (losses) were recorded as a component of cost of goods sold in the accompanying condensed consolidated statements of income.
At June 30, 2018 and December 31, 2017, the excess of replacement cost over the carrying value (LIFO) of the Tyler refinery inventories was $7.4 million and $9.0 million, respectively.
Permanent Liquidations
We incurred a permanent reduction in a LIFO layer resulting in liquidation loss in our refinery inventory of $1.0 million and $0.2 million during the three and six months ended June 30, 2018, respectively, and $0.2 million during the three and six months ended June 30, 2017. These liquidation losses were recognized as a component of cost of goods sold in the accompanying condensed consolidated statements of income.
7. Crude Oil Supply and Inventory Purchase Agreements
Delek has Master Supply and Offtake Agreements (the "Supply and Offtake Agreements") with J. Aron & Company ("J. Aron").
El Dorado refinery operations
Throughout the term of the Supply and Offtake Agreement that supports the operations of our refinery located in El Dorado, Arkansas (the "El Dorado Supply and Offtake Agreement"), which was amended on February 27, 2017 to change, among other things, certain terms related to pricing and an extension of the maturity date to April 30, 2020, Lion Oil Company ("Lion Oil") (as the primary legal entity associated with the El Dorado refinery for purposes of this Agreement) and J. Aron will identify mutually acceptable contracts for the purchase of crude oil from third parties and J. Aron will supply up to 100,000 bpd of crude oil to the El Dorado refinery. Crude oil supplied to the El Dorado refinery by J. Aron will be purchased daily at an estimated average monthly market price by Lion Oil. J. Aron will also purchase all refined products from the El Dorado refinery at an estimated daily market price, as they are produced. These daily purchases and sales are trued-up on a monthly basis in order to reflect actual average monthly prices. We have recorded a (payable) receivable related to this monthly settlement of $(6.9) million and $0.3 million as of June 30, 2018 and December 31, 2017, respectively. Also pursuant to the El Dorado Supply and Offtake Agreement and other related agreements, Lion Oil will endeavor to arrange potential sales by either Lion Oil or J. Aron to third parties of the products produced at the El Dorado refinery or purchased from third parties. In instances where Lion Oil is the seller to such third parties, J. Aron will first transfer title to the applicable products to Lion Oil.
This arrangement is accounted for as a product financing arrangement. Delek incurred fees payable to J. Aron under the El Dorado Supply and Offtake Agreement of $2.9 million and $5.6 million during the three and six months ended June 30, 2018, respectively, and $2.5 million and $4.9 million during the three and six months ended June 30, 2017, respectively. These amounts are included as a component of interest expense in the condensed consolidated statements of income. Upon any termination of the El Dorado Supply and Offtake Agreement, including in connection with a force majeure event, the parties are required to negotiate with third parties for the assignment to us of certain contracts, commitments and arrangements, including procurement contracts, commitments for the sale of product, and pipeline, terminalling, storage and shipping arrangements.
Upon the expiration of the El Dorado Supply and Offtake Agreement on April 30, 2020, or upon any earlier termination, Delek will be required to repurchase the consigned crude oil and refined products from J. Aron at then prevailing market prices. At June 30, 2018 and December 31,
21
2017, Delek had 2.9 million barrels and 3.0 million barrels, respectively, of inventory consigned from J. Aron under the El Dorado Supply and Offtake Agreement, and we have recorded liabilities associated with this consigned inventory of $202.6 million and $181.9 million, respectively, in the condensed consolidated balance sheets.
Alon refinery operations
Effective with the Delek/Alon Merger, we assumed Alon's existing Supply and Offtake Agreements and other associated agreements with J. Aron, to support the operations of our Big Spring, Krotz Springs and California refineries (as further defined in Note 14) and certain of our asphalt terminals (together, the “Alon Supply and Offtake Agreements”). Pursuant to the Alon Supply and Offtake Agreements, (i) J. Aron agreed to sell to us, and we agreed to buy from J. Aron, at market prices, crude oil for processing at these refineries and (ii) we agreed to sell, and J. Aron agreed to buy, at market prices, certain refined products produced at these refineries. The Alon Supply and Offtake Agreements also provide for the sale, at market prices, of our crude oil and certain refined product inventories to J. Aron, the lease to J. Aron of crude oil and refined product storage facilities and the identification of prospective purchasers of refined products on J. Aron’s behalf. The Supply and Offtake Agreements for the Big Spring and Krotz Springs refineries have initial terms that expire in May 2021. The Supply and Offtake Agreement for the California refineries, which had an initial expiration date in May 2019, contained early termination provisions, and we elected to terminate the Supply and Offtake Agreement at the California refineries effective on May 31, 2018. J. Aron may elect to terminate the Supply and Offtake Agreements for the Big Spring and Krotz Springs refineries prior to the expiration of the initial term beginning in May 2019 and upon each anniversary thereafter, on six months' prior notice. We may elect to terminate the agreements at the Big Spring and Krotz Springs refineries in May 2020 on six months' prior notice.
These daily purchases and sales are trued-up on a monthly basis in order to reflect actual average monthly prices. We have recorded a net payable related to this monthly settlement of $(17.9) million and $(4.4) million as of June 30, 2018 and December 31, 2017, respectively.
These arrangements are accounted for as product financing arrangements. Delek incurred fees payable to J. Aron of $3.6 million and $6.9 million during the three and six months ended June 30, 2018, respectively. These amounts are included as a component of interest expense in the condensed consolidated statements of income. Upon any termination of the Alon Supply and Offtake Agreements, including in connection with a force majeure event, the parties are required to negotiate with third parties for the assignment to us of certain contracts, commitments and arrangements, including procurement contracts, commitments for the sale of product, and pipeline, terminalling, storage and shipping arrangements.
Upon the expiration of the Alon Supply and Offtake Agreements, or upon any earlier termination, Delek will be required to repurchase the consigned crude oil and refined products from J. Aron at then prevailing market prices. At June 30, 2018 and December 31, 2017, Delek had 3.2 million barrels and 3.5 million barrels, respectively, of inventory consigned from J. Aron under the Alon Supply and Offtake Agreements, and we have recorded liabilities associated with this consigned inventory of $268.6 million and $253.7 million, respectively, in the condensed consolidated balance sheet.
In connection with the Alon Supply and Offtake Agreement for our Krotz Springs refinery, we have granted a security interest to J. Aron in certain assets (including all of its accounts receivable and inventory) to secure its obligations to J. Aron.
22
8. Long-Term Obligations and Notes Payable
Outstanding borrowings, net of unamortized debt discounts and certain deferred financing costs, under Delek’s existing debt instruments are as follows (in millions):
June 30, 2018 | December 31, 2017 | |||||||
Revolving Credit Facility | $ | 370.0 | $ | — | ||||
Term Loan Credit Facility (1) | 686.5 | — | ||||||
DKL Revolver | 493.9 | 179.9 | ||||||
DKL Notes (2) | 243.3 | 242.7 | ||||||
Wells Term Loan(3) | — | 40.5 | ||||||
Wells Revolving Loan | — | 45.0 | ||||||
Reliant Bank Revolver | 30.0 | 17.0 | ||||||
Promissory Notes | 70.0 | 95.1 | ||||||
Lion Term Loan Facility(4) | — | 203.4 | ||||||
Alon Partnership Credit Facility | — | 100.0 | ||||||
Alon Partnership Term Loan | — | 237.5 | ||||||
Convertible Notes (5) | 148.8 | 146.0 | ||||||
Alon Term Loan Credit Facilities (6) | — | 72.4 | ||||||
Alon Retail Credit Facilities (7) | — | 86.1 | ||||||
2,042.5 | 1,465.6 | |||||||
Less: Current portion of long-term debt and notes payable | 180.8 | 590.2 | ||||||
$ | 1,861.7 | $ | 875.4 | |||||
(1) | The Term Loan Credit Facility is net of deferred financing costs of $2.6 million and debt discount of $9.2 million at June 30, 2018. |
(2) | The DKL Notes are net of deferred financing costs of $5.1 million and $5.6 million, respectively, and debt discount of $1.6 million and $1.7 million, respectively, at June 30, 2018 and December 31, 2017. |
(3) | The Wells Term Loan was extinguished on March 30, 2018, as further discussed below, and was net of deferred financing costs of a nominal amount and debt discount $0.3 million at December 31, 2017. |
(4) | The Lion Term Loan Facility was extinguished on March 30, 2018, as further discussed below, and was net of deferred financing costs of $2.1 million and debt discount of $0.8 million at December 31, 2017. |
(5) | The Convertible Notes are net of debt discount of $1.2 million and $4.0 million at June 30, 2018 and December 31, 2017, respectively. |
(6) | The Alon Term Loan Credit Facilities were extinguished on March 30, 2018, as further discussed below, and were net of debt discount of $0.6 million at December 31, 2017. |
(7) | The Alon Retail Credit Facilities were extinguished on March 30, 2018, as further discussed below, and were net of debt discount of $2.4 million at December 31, 2017. |
23
Delek Revolver and Term Loan
On March 30, 2018, (the "Closing Date"), Delek entered into (i) a new term loan credit agreement with Wells Fargo Bank, National Association, as administrative agent (the "Term Administrative Agent"), Delek, as borrower, and the lenders from time to time party thereto, providing for a senior secured term loan facility in an amount of $700 million (the "Term Loan Credit Facility") and (ii) a second amended and restated credit agreement with Wells Fargo Bank, National Association, as administrative agent (the "Revolver Administrative Agent"), Delek, as borrower, certain subsidiaries of Delek, as guarantors, and the other lenders party thereto, providing for a senior secured asset-based revolving credit facility with commitments of $1.0 billion (the "Revolving Credit Facility" and, together with the "Term Loan Credit Facility," the "New Credit Facilities").
The Revolving Credit Facility permits borrowings in Canadian dollars of up to $50.0 million. The Revolving Credit Facility also permits the issuance of letters of credit of up to $300.0 million, including letters of credit denominated in Canadian dollars of up to $10.0 million. Delek may designate restricted subsidiaries as additional borrowers under the Revolving Credit Facility.
The Term Loan Credit Facility was drawn in full for $700.0 million on the Closing Date at an original issue discount of 0.50%. Proceeds under the Term Loan Credit Facility, as well as proceeds of approximately $300.0 million in borrowings under the Revolving Credit Facility on the Closing Date, were used to repay certain indebtedness of Delek and its subsidiaries (the “Refinancing”), as well as certain fees, costs and expenses in connection with the closing of the New Credit Facilities, with any remaining proceeds held in cash. Proceeds of future borrowings under the Revolving Credit Facility will be used for working capital and general corporate purposes of Delek and its subsidiaries.
We recorded a loss on extinguishment of debt totaling approximately $9.0 million during the six months ended June 30, 2018 in connection with the Refinancing.
Interest and Unused Line Fees
The interest rates applicable to borrowings under the Term Loan Credit Facility and the Revolving Credit Facility are based on a fluctuating rate of interest measured by reference to either, at Delek’s option, (i) a base rate, plus an applicable margin, or (ii) a reserve-adjusted London Interbank Offered Rate ("LIBOR"), plus an applicable margin (or, in the case of Revolving Credit Facility borrowings denominated in Canadian dollars, the Canadian dollar bankers' acceptances rate ("CDOR")). The applicable margin for all Term Loan Credit Facility borrowings is 1.50% per annum with respect to base rate borrowings and 2.50% per annum with respect to LIBOR borrowings. The initial applicable margin for Revolving Credit Facility borrowings is 0.25% per annum with respect to base rate borrowings and 1.25% per annum with respect to LIBOR and CDOR borrowings, and the applicable margin for such borrowings after September 30, 2018 will be based on Delek’s excess availability as determined by reference to a borrowing base, ranging from 0.25% to 0.75% per annum with respect to base rate borrowings and from 1.25% to 1.75% per annum with respect to LIBOR and CDOR borrowings.
In addition, the Revolving Credit Facility will require Delek to pay an unused line fee on the average amount of unused commitments thereunder in each quarter, which fee will be at a rate of 0.250% or 0.375% per annum, depending on average commitment usage for such quarter. The initial unused line fee is set at 0.375% per annum through September 30, 2018.
Maturity and Repayments
The Revolving Credit Facility will mature and the commitments thereunder will terminate on March 30, 2023. The Term Loan Credit Facility requires scheduled quarterly principal payments of $1.75 million, with the balance of the principal due on March 30, 2025. Additionally, the Term Loan Credit Facility requires prepayments by Delek with the net cash proceeds from certain debt incurrences, asset dispositions and insurance or condemnation events with respect to Delek’s assets, subject to certain exceptions, thresholds and reinvestment rights. The Term Loan Credit Facility also requires prepayments with a variable percentage of Delek’s excess cash flow, ranging from 50% to 0% depending on Delek’s consolidated secured net leverage ratio from time to time. Delek may also make voluntarily prepayments under the Term Loan Credit Facility at any time, subject to a prepayment premium of 1.00% in connection with certain customary repricing events that may occur within six months after the Closing Date, with no premium applied after six months.
Guarantee and Security
The obligations of the borrowers under the New Credit Facilities are guaranteed by Delek and each of its direct and indirect, existing and future, wholly-owned domestic subsidiaries, subject to customary exceptions and limitations, and excluding Delek Logistics Partners, LP, Delek Logistics GP, LLC, and each subsidiary of the foregoing (collectively, the "MLP Subsidiaries"). Borrowings under the New Credit Facilities are also guaranteed by DK Canada Energy ULC, a British Columbia unlimited liability company and a wholly-owned restricted subsidiary of Delek.
24
The Revolving Credit Facility is secured by a first priority lien over substantially all of Delek’s and each guarantor's receivables, inventory, renewable identification numbers, instruments, intercompany loan receivables, deposit and securities accounts and related books and records and certain other personal property, subject to certain customary exceptions (the "Revolving Priority Collateral"), and a second priority lien over substantially all of the Delek's and each guarantor's other assets, including all of the equity interests of any subsidiary held by Delek or any guarantor (other than equity interests in certain MLP Subsidiaries) subject to certain customary exceptions, but excluding real property (such real property and equity interests, the "Term Priority Collateral").
The Term Loan Credit Facility is secured by a first priority lien on the Term Priority Collateral and a second priority lien on the Revolving Priority Collateral, all in accordance with an intercreditor agreement between the Term Administrative Agent and the Revolver Administrative Agent and acknowledged by Delek and the subsidiary guarantors. Certain excluded assets are not included in the Term Priority Collateral and the Revolving Priority Collateral.
Additional Information
At June 30, 2018, the weighted average borrowing rate under the Revolving Credit Facility was 5.25% and was comprised entirely of a base rate borrowing, and the principal amount outstanding thereunder was $370.0 million. Additionally, there were letters of credit issued of approximately $133.3 million as of June 30, 2018 under the Revolving Credit Facility. Unused credit commitments under the Revolving Credit Facility, as of June 30, 2018, were approximately $496.7 million
At June 30, 2018, the weighted average borrowing rate under the Term Loan Credit Facility was approximately 4.59% comprised entirely of a LIBOR base borrowing and the principal amount outstanding thereunder was approximately $698.3 million.
DKL Revolver
Delek Logistics has a $700.0 million senior secured revolving credit agreement with Fifth Third Bank, as administrative agent, and a syndicate of lenders (the "DKL Revolver"). Delek Logistics and all of its existing wholly-owned subsidiaries are borrowers or guarantors under the DKL Revolver. The DKL Revolver contains a dual currency borrowing tranche that permits draw downs in U.S. or Canadian dollars and an accordion feature whereby Delek Logistics may increase the size of the credit facility to an aggregate of $800.0 million, subject to receiving increased or new commitments from lenders and the satisfaction of certain other conditions precedent.
The obligations under the DKL Revolver are secured by a first priority lien on substantially all of Delek Logistics' tangible and intangible assets. Additionally, a subsidiary of Delek provides a limited guaranty of Delek Logistics' obligations under the DKL Revolver. The guaranty is (i) limited to an amount equal to the principal amount, plus unpaid and accrued interest, of a promissory note made by Delek in favor of the subsidiary guarantor (the "Holdings Note") and (ii) secured by the subsidiary guarantor's pledge of the Holdings Note to the DKL Revolver lenders. As of both June 30, 2018 and December 31, 2017, the principal amount of the Holdings Note was $102.0 million.
The DKL Revolver will mature on December 30, 2019. Borrowings under the DKL Revolver bear interest at either a U.S. base rate, Canadian prime rate, LIBOR, or a Canadian Dealer Offered Rate, in each case plus applicable margins, at the election of the borrowers and as a function of draw down currency. The applicable margin, in each case, varies based upon Delek Logistics' leverage ratio for the most recently ended four fiscal quarters. At June 30, 2018, the weighted average borrowing rate was approximately 4.94%. Additionally, the DKL Revolver requires Delek Logistics to pay a leverage ratio dependent quarterly fee on the average unused revolving commitment. As of June 30, 2018, this fee was 0.50% per year. As of June 30, 2018, Delek Logistics had $493.9 million of outstanding borrowings under the DKL Revolver, with no letters of credit in place. Unused credit commitments under the DKL Revolver, as of June 30, 2018, were $206.1 million.
DKL Notes
On May 23, 2017, Delek Logistics and Delek Logistics Finance Corp. (collectively, the “Issuers”), issued $250.0 million in aggregate principal amount of 6.75% senior notes due 2025 (the “DKL Notes”) at a discount. The DKL Notes are general unsecured senior obligations of the Issuers. The DKL Notes are unconditionally guaranteed jointly and severally on a senior unsecured basis by Delek Logistics' existing subsidiaries (other than Delek Logistics Finance Corp., the "Guarantors") and will be unconditionally guaranteed on the same basis by certain of Delek Logistics' future subsidiaries. The DKL Notes rank equal in right of payment with all existing and future senior indebtedness of the Issuers, and senior in right of payment to any future subordinated indebtedness of the Issuers. Interest on the DKL Notes is payable semi-annually in arrears on each May 15 and November 15, commencing November 15, 2017.
At any time prior to May 15, 2020, the Issuers may redeem up to 35% of the aggregate principal amount of the DKL Notes with the net cash proceeds of one or more equity offerings by Delek Logistics at a redemption price of 106.750% of the redeemed principal amount, plus accrued and unpaid interest, if any, subject to certain conditions and limitations. Prior to May 15, 2020, the Issuers may redeem all or part of the DKL Notes at a redemption price of the principal amount plus accrued and unpaid interest, if any, plus a "make whole" premium, subject to certain conditions and limitations. In addition, beginning on May 15, 2020, the Issuers may, subject to certain conditions and limitations, redeem
25
all or part of the DKL Notes, at a redemption price of 105.063% of the redeemed principal for the twelve-month period beginning on May 15, 2020, 103.375% for the twelve-month period beginning on May 15, 2021, 101.688% for the twelve-month period beginning on May 15, 2022 and 100.00% beginning on May 15, 2023 and thereafter, plus accrued and unpaid interest, if any.
In the event of a change of control, accompanied or followed by a ratings downgrade within a certain period of time, subject to certain conditions and limitations, the Issuers will be obligated to make an offer for the purchase of the DKL Notes from holders at a price equal to 101% of the principal amount thereof, plus accrued and unpaid interest.
In connection with the issuance of the DKL Notes, the Issuers and the Guarantors entered into a registration rights agreement, whereby the Issuers and the Guarantors were required to exchange the DKL Notes for new notes with terms substantially identical in all material respects with the DKL Notes (except the new notes do not contain terms with respect to transfer restrictions). On April 25, 2018, Delek Logistics made an offer to exchange the DKL Notes and the related guarantees that were validly tendered and not validly withdrawn for an equal principal amount of exchange notes that are freely tradeable, as required under the terms of the original indenture (the “Exchange Offer”). The Exchange Offer expired on May 23, 2018 (the "Expiration Date"). The terms of the exchange notes that were issued as a result of the Exchange Offer are substantially identical to the terms of the original DKL Notes.
As of June 30, 2018, we had $250.0 million in outstanding principal amount under the DKL Notes.
Wells ABL
Our subsidiary, Delek Refining, Ltd., had an asset-based loan credit facility with Wells Fargo Bank, National Association, as administrative agent, and a syndicate of lenders, which was previously amended and restated on September 29, 2016 and on May 17, 2017 (the "Wells ABL"). This facility was amended and restated on March 30, 2018 in connection with the Refinancing. The Wells ABL consisted of (i) a $450.0 million revolving loan (the "Wells Revolving Loan"), which included a $45.0 million swing line loan sub-limit and a $200.0 million letter of credit sub-limit, (ii) a $70.0 million term loan (the "Wells Term Loan"), and (iii) an accordion feature that permitted an increase in the size of the revolving credit facility to an aggregate of $725.0 million, subject to additional lender commitments and the satisfaction of certain other conditions precedent. The Wells Revolving Loan was to mature on September 29, 2021 and the Wells Term Loan was to mature on September 29, 2019. The Wells Term Loan was subject to repayment in level principal installments of approximately $5.8 million per quarter, with the final installment due on September 29, 2019. The obligations under the Wells ABL were secured by (i) substantially all the assets of Refining and its subsidiaries, with certain limitations, (ii) guaranties provided by the general partner of Delek Refining, Ltd., as well as by the parent of Delek Refining, Ltd., Delek Refining, Inc. (iii) a limited guarantee provided jointly and severally by Old and New Delek in an amount up to $15.0 million in the aggregate and (iv) a limited guarantee provided by Lion Oil in an amount equal to the sum of the face amount of all letters of credit issued on behalf of Lion Oil under the Wells ABL and any loans made by Refining or its subsidiaries to Lion Oil. Under the facility, revolving loans and letters of credit were provided subject to availability requirements which were determined pursuant to a borrowing base calculation as defined in the credit agreement. The borrowing base, as calculated, was primarily supported by cash, certain accounts receivable and certain inventory. Borrowings under the Wells Revolving Loan and Wells Term Loan bore interest based on separate predetermined pricing grids that allowed us to choose between base rate loans or LIBOR rate loans. Additionally, the Wells ABL required us to pay a quarterly unused credit commitment fee.
Reliant Bank Revolver
Delek has an unsecured revolving credit agreement with Reliant Bank (the "Reliant Bank Revolver"), which was amended on June 20, 2018 to extend the maturity by two years to June 28, 2020, reduce the fixed interest rate from 5.25% to 4.75% per annum and increase the maximum borrowing amount for loans from $17.0 million to $30.0 million. The Reliant Bank Revolver requires us to pay a quarterly fee of 0.50% per year on the average available revolving commitment. As of June 30, 2018, we had $30.0 million outstanding and had no unused credit commitments under the Reliant Bank Revolver.
Promissory Notes
Delek had a $50.0 million promissory note with Ergon, Inc. that required Delek to make annual amortization payments of $10.0 million each, commencing April 29, 2013, and with interest computed at a fixed rate equal to 4.0% per annum. The Ergon Note matured on April 29, 2017 and was paid in full.
On May 14, 2015, in connection with the Company’s closing of the Alon Acquisition, the Company issued the Alon Israel Note in the amount of $145.0 million, which was payable to Alon Israel. The Alon Israel Note bears interest at a fixed rate of 5.5% per annum and requires five annual principal amortization payments of $25.0 million beginning in January 2016 followed by a final principal amortization payment of $20.0 million at maturity on January 4, 2021. In October 2015, we prepaid the first annual principal amortization payment in the amount of $25.0 million, along with all interest due on the prepaid amount. On December 22, 2015, Alon Israel assigned the remaining $120.0 million of principal and all accrued interest due under the Alon Israel Note to assignees under four new notes in substantially the same form and on the same terms as the Alon Israel Note (collectively, the "Alon Successor Notes"). The $120.0 million total principal of the four Alon Successor Notes collectively require the same principal amortization payments and schedule as under the Alon Israel Note, with payments due under each Alon Successor
26
Note commensurate to such note's pro rata share of $120.0 million in assigned principal. As of June 30, 2018, a total principal amount of $70.0 million was outstanding under the Alon Successor Notes.
As of December 31, 2017, one of our retail companies had a loan that was to mature in 2019 with an outstanding balance of $0.1 million and the interest rate was fixed at 9.70%. This loan was extinguished in connection with the Refinancing on March 30, 2018.
Lion Term Loan
Our subsidiary, Lion Oil, had a term loan credit facility with Fifth Third Bank, as administrative agent, and a syndicate of lenders, which was amended and restated on May 14, 2015 in connection with the Company’s closing of the Alon Acquisition to, among other things, increase the total loan size from $99.0 million to $275.0 million (the "Lion Term Loan"), and was amended on April 13, 2017 to incorporate technical modifications related to the Delek/Alon Merger. This facility was extinguished in connection with the Refinancing on March 30, 2018. The Lion Term Loan required Lion Oil to make quarterly principal amortization payments of approximately $6.9 million each, commencing on September 30, 2015, with a final balloon payment due at maturity on May 14, 2020. The Lion Term Loan was secured by, among other things, (i) substantially all the assets of Lion Oil and its subsidiaries (excluding inventory and accounts receivable), (ii) all shares in Lion Oil, (iii) any subordinated and common units of Delek Logistics held by Lion Oil, and (iv) the ALJ Shares. Additionally, the Lion Term Loan was guaranteed by Old and New Delek and the subsidiaries of Lion Oil. Interest on the unpaid balance of the Lion Term Loan was computed at a rate per annum equal to LIBOR or a base rate, at our election, plus the applicable margins, subject in each case to an all-in interest rate floor of 5.50% per annum.
Alon Partnership
Revolving Credit Facility
Alon USA, LP, a wholly-owned subsidiary of the Alon Partnership had a $240.0 million asset-based revolving credit facility with Israel Discount Bank of New York, as administrative agent (the “Alon Partnership Credit Facility”) that was to mature on May 26, 2018. This facility was extinguished in connection with the Refinancing on March 30, 2018. The Alon Partnership Credit Facility could be used both for borrowings and the issuance of letters of credit subject to a limit of the lesser of the facility amount or the borrowing base amount under the facility. Borrowings under the Alon Partnership Credit Facility bore interest at LIBOR or base rate, at our election, plus the applicable margins. The Alon Partnership Credit Facility was secured by a first priority lien on the Alon Partnership’s cash, accounts receivables, inventories and related assets and a second priority lien on the Alon Partnership’s fixed assets and other specified property. Additionally, the Alon Partnership Credit Facility required the payment of a quarterly fee on the average unused revolving commitment.
Partnership Term Loan Credit Facility
The Alon Partnership had a $250.0 million term loan with Credit Suisse AG, as administrative agent (the “Alon Partnership Term Loan”). This term loan was extinguished in connection with the Refinancing on March 30, 2018. The Alon Partnership Term Loan required principal payments of $2.5 million per annum paid in equal quarterly installments until maturity in November 2018, at which time a balloon payment was to be due for any remaining principal outstanding. The Alon Partnership Term Loan bore interest at a rate equal to the sum of (i) the Eurodollar rate (with a floor of 1.25% per annum) plus (ii) a margin of 8.0% per annum. The Alon Partnership Term Loan was guaranteed by Alon USA Partners GP, LLC, Alon Assets, Inc. and certain subsidiaries of the Alon Partnership, and was secured by a first priority lien on all of the Alon Partnership’s fixed assets and other specified property, as well as on the general partner interest in the Alon Partnership held by the Alon General Partner, and a second priority lien on the Alon Partnership’s cash, accounts receivables, inventories and related assets.
Alon Convertible Senior Notes (share values in dollars)
In connection with the Delek/Alon Merger, Alon, New Delek and U.S. Bank National Association, as trustee (the “Trustee”) entered into a First Supplemental Indenture (the “Supplemental Indenture”), effective as of July 1, 2017, supplementing the Indenture, dated as of September 16, 2013 (the “Original Indenture”; the Original Indenture, as amended by the Supplemental Indenture, is referred to as the "Indenture"), pursuant to which Alon issued its 3.00% Convertible Senior Notes due 2018 (the “ Convertible Notes”) in the aggregate principal amount of $150.0 million, which were convertible into shares of Alon’s Common Stock, par value $0.01 per share or cash or a combination of cash and Alon Common Stock, at Alon's election, all as provided in the Indenture. The Supplemental Indenture provides that, as of the Effective Time, the right to convert each $1,000 principal amount of the Notes based on a number of shares of Alon Common Stock equal to the Conversion Rate (as defined in the Indenture) in effect immediately prior to the Merger was changed into a right to convert each $1,000 principal amount of Notes into or based on a number of shares of New Delek Common Stock (at the exchange rate of 0.504), par value $0.01 per share, equal to the Conversion Rate in effect immediately prior to the Merger. In addition, the Supplemental Indenture provides that, as of the Effective Time, New Delek fully and unconditionally guarantees, on a senior basis, Alon’s obligations under the Convertible Notes.
Interest on the Convertible Notes is payable in arrears in March and September of each year. The Convertible Notes are not redeemable at our option prior to maturity. Under the terms of the Convertible Notes, the holders of the Convertible Notes cannot require us to repurchase all or part of the notes except for instances of a fundamental change, as defined in the indenture.
27
The holders of the Convertible Notes may convert their notes at any time after June 15, 2018 into a settlement amount determined in accordance with the terms of the Indenture.
Prior to June 15, 2018, holders may convert their Convertible Notes only upon the occurrence of certain triggering events described in the Indenture. The Convertible Notes may be converted into shares of New Delek Common Stock, into cash, or into a combination of cash and shares of New Delek Common Stock, at our election. In May 2018, we made the election and notified holders of our intention to satisfy the principal amount outstanding with cash and the incremental value of the conversion options with shares at maturity.
The conversion rate of the Convertible Notes is subject to adjustment upon the occurrence of certain events, including cash dividend adjustments, but will not be adjusted for any accrued and unpaid interest. As of June 30, 2018, the adjusted conversion rate was 74.8635 shares of Alon Common Stock per each $1,000 principal amount of Convertible Notes, equivalent to a per share conversion price for New Delek Common Stock of approximately $27, to reflect cash dividend adjustments and the merger stock exchange rate of 0.504 (for a post-Merger conversion ratio of approximately 37.73). As of June 30, 2018, there have been no conversions of the Convertible Notes.
The fair value of the conversion feature met the definition for recognition as a bifurcated equity instrument. As of both June 30, 2018 and December 31, 2017, the conversion feature equity instrument totals $26.6 million and is included in additional paid-in capital on the accompanying condensed consolidated balance sheets. The total value of the Convertible Notes on an if-converted basis exceeds the outstanding principal amount by $133.9 million as of June 30, 2018.
Convertible Note Hedge Transactions
In connection with the Convertible Notes offering, Alon entered into convertible note hedge transactions with respect to Alon Common Stock (the “Call Options”) with the initial purchasers of the Convertible Notes (the “Hedge Counterparties”). In connection with the Delek/Alon Merger, Alon, Delek and the Hedge Counterparties entered into amended and restated Call Options permitting us to purchase up to approximately 5.7 million shares of New Delek Common Stock, subject to customary anti-dilution adjustments, that underlie the Convertible Notes sold in the offering. As of June 30, 2018, the Call Options had an adjusted strike price of approximately $27 per share of New Delek Common Stock. The Call Options will expire in September 2018.
The Call Options are intended to reduce the potential dilution with respect to our common stock upon conversion of the Convertible Notes or upon settlement of the incremental value of the conversion options associated with the convertible debt in shares, as well as offset any potential cash payments we are required to make in excess of the principal amount upon any conversion of the notes. As of both June 30, 2018 and December 31, 2017, the Call Options totaling $23.3 million have been included as a reduction of additional paid-in capital on the condensed consolidated balance sheets.
The Call Options are separate transactions and are not part of the terms of the Convertible Notes and are excluded from classification as a derivative as the amount could be settled in our stock. Holders of the Convertible Notes do not have any rights with respect to the Call Options.
Warrant Transactions
In connection with the Convertible Notes offering, Alon also entered into warrant transactions (the “Warrants”) whereby warrants to acquire Alon common stock were sold to the Hedge Counterparties. In connection with the Delek/Alon Merger, Alon, Delek and the Hedge Counterparties entered into amended and restated Warrants which allow the Hedge Counterparties to purchase up to approximately 5.7 million shares of New Delek Common Stock, subject to customary anti-dilution adjustments. As of June 30, 2018, the Warrants had an adjusted strike price of approximately $35 per share of New Delek Common Stock. The Warrants require settlement on a net-share basis and will expire in April 2019. As of both June 30, 2018 and December 31, 2017, Warrants totaling $14.3 million have been included in additional paid-in capital on the condensed consolidated balance sheets.
The Warrants are separate transactions and are not part of the terms of the Convertible Notes and are excluded from classification as a derivative as the amount could be settled in our stock. Holders of the Convertible Notes do not have any rights with respect to the Warrants.
Alon Term Loan Credit Facilities
Alon Energy Term Loan
On March 27, 2014, Alon issued a promissory note to Bank Hapoalim B.M. in an original principal amount of $25.0 million (“Alon Energy Term Loan”), that was to mature in March 2019, but was refinanced on December 29, 2017 with the proceeds of a new promissory note to Bank Hapoalim in an original principal amount of $38.0 million ("New Alon Energy Term Loan"), maturing on December 29, 2022. The New Alon Energy Term Loan was extinguished in connection with the Refinancing on March 30, 2018. The New Alon Energy Term Loan required quarterly principal amortization payments of approximately $1.4 million each, commencing on March 30, 2018, and incurred interest at an annual rate equal to LIBOR plus a margin of 3.75%. Additionally, Delek guaranteed all obligations under the New Alon Energy Term Loan.
28
Alon Asphalt Term Loan
Alon had a term loan owed to Export Development Canada secured by liens on certain of our asphalt terminals (“Alon Asphalt Term Loan”) in an original principal amount of $35.0 million. This loan was prepaid on March 29, 2018 in connection with the Refinancing on March 30, 2018. The Alon Asphalt Term Loan was guaranteed by Delek and certain subsidiaries of Alon and was also secured by pledges of equity of certain subsidiaries of Alon. The Alon Asphalt Term Loan required quarterly principal amortization payments of $3.9 million, commencing December 2018 until maturity in December 2020. The Alon Asphalt Term Loan bore interest at a rate equal to LIBOR plus a margin of 3.75% per annum.
Alon Energy Letter of Credit Facility
Alon had a Letter of Credit Facility with Israel Discount Bank of New York (the “Alon Energy Letter of Credit Facility”) that was used for the issuance of standby letters of credit. The facility was amended on November 30, 2017, to, among other things, extend the maturity date of the facility to February 28, 2018 and to reduce the maximum commitment under the facility from $60.0 million to $45.0 million effective December 31, 2017, and was again amended on February 27, 2018 to extend the maturity date to March 29, 2018 when it expired. As collateral for the Alon Energy Letter of Credit Facility, we were required to pledge sufficient Alon Partnership common units with an initial collateral value of at least $100.0 million. Alon Assets, Inc. (“Alon Assets”) was a guarantor under the Alon Energy Letter of Credit Facility. Additionally, the Alon Energy Letter of Credit Facility required the payment of a quarterly fee on the average unused commitment.
Alon Retail Credit Agreement
Alon wholly-owned subsidiaries Southwest Convenience Stores, LLC and Skinny’s LLC, (collectively, “Alon Retail”), had a credit agreement (“Alon Retail Credit Agreement”), that was to mature in March 2019, with Wells Fargo Bank, National Association, as administrative agent. This credit agreement was extinguished in connection with the Refinancing on March 30, 2018. The Alon Retail Credit Agreement included a term loan in an original principal amount of $110.0 million and a $10.0 million revolving credit facility. The Alon Retail Credit Agreement also included an accordion feature that provided for incremental term loans up to $30.0 million. In August 2015, Alon borrowed $11.0 million using the accordion feature and amended the Alon Retail Credit Agreement to restore the undrawn amount of the accordion feature back to $30.0 million. Borrowings under the Alon Retail Credit Agreement bore interest at LIBOR or base rate, at our election, plus an applicable margin, determined quarterly based upon Alon Retail’s leverage ratio. Principal payments on the term loan borrowings were made in quarterly installments based on a 15-year amortization schedule. Obligations under the Alon Retail Credit Agreement were secured by a first priority lien on substantially all of the assets of Alon Retail and its subsidiaries. The Alon Retail Credit Agreement required us to pay a leverage ratio dependent quarterly fee on the average unused revolving commitment. As of and during the period from the Delek/Alon Merger through the extinguishment date of March 30, 2018, Alon had no outstanding borrowings under the revolving portion of the credit facility.
Restrictive Covenants
Under the terms of our Revolving Credit Facility, Term Loan Credit Facility, DKL Revolver, DKL Notes and Reliant Bank Revolver, we are required to comply with certain usual and customary financial and non-financial covenants. The terms and conditions of the Revolving Credit Facility include periodic compliance with a springing minimum fixed charge coverage ratio financial covenant if excess availability under the revolver borrowing base is below certain thresholds, as defined in the credit agreement. The Term Loan Credit Facility does not have any financial maintenance covenants. The Convertible Notes do not contain any maintenance financial covenants. We believe we were in compliance with all covenant requirements under each of our credit facilities as of June 30, 2018.
Certain of our debt facilities contain limitations on the incurrence of additional indebtedness, making of investments, creation of liens, dispositions and acquisitions of assets, and making of restricted payments and transactions with affiliates. Specifically, these covenants may limit the payment, in the form of cash or other assets, of dividends or other distributions, or the repurchase of shares with respect to the equity of certain of our subsidiaries. Additionally, certain of our debt facilities limit our ability to make investments, including extensions of loans or advances to, or acquisitions of equity interests in, or guarantees of obligations of, any other entities.
29
Principal maturities of Delek's existing third-party debt instruments for the next five years and thereafter are as follows as of June 30, 2018 (in millions):
July1 to December 31, 2018 | 2019 | 2020 | 2021 | 2022 | Thereafter | Total | ||||||||||||||||||||||
Revolving Credit Facility | $ | — | $ | — | $ | — | $ | — | $ | — | $ | 370.0 | $ | 370.0 | ||||||||||||||
Term Loan Credit Facility | 5.3 | 7.0 | 7.0 | 7.0 | 7.0 | 665.0 | 698.3 | |||||||||||||||||||||
DKL Revolver | — | 493.9 | — | — | — | — | 493.9 | |||||||||||||||||||||
DKL Notes | — | — | — | — | — | 250.0 | 250.0 | |||||||||||||||||||||
Reliant Bank Revolver | — | — | 30.0 | — | — | — | 30.0 | |||||||||||||||||||||
Promissory Notes | — | 25.0 | 25.0 | 20.0 | — | — | 70.0 | |||||||||||||||||||||
Convertible Notes | 150.0 | — | — | — | — | — | 150.0 | |||||||||||||||||||||
Total | $ | 155.3 | $ | 525.9 | $ | 62.0 | $ | 27.0 | $ | 7.0 | $ | 1,285.0 | $ | 2,062.2 | ||||||||||||||
Interest-Rate Derivative Instruments
Effective with the Delek/Alon Merger, we assumed Alon's interest rate swap agreements, that were to mature in March 2019, which effectively fixed the variable LIBOR interest component of the term loans within the Alon Retail Credit Agreement. These interest rate swap agreements were terminated in connection with the Refinancing on March 30, 2018. These interest rate swaps were accounted for as cash flow hedges. See Note 16 for further information regarding the interest rate swap agreements.
9. Other Assets and Liabilities
The detail of other current assets is as follows (in millions):
Other Current Assets | June 30, 2018 | December 31, 2017 | |||||
Prepaid expenses | $ | 13.5 | $ | 17.6 | |||
Short-term derivative assets (see Note 16) | 39.9 | 15.9 | |||||
Income and other tax receivables | 15.5 | 75.7 | |||||
RINs Obligation surplus (see Note 15) | 4.1 | 1.1 | |||||
Commodity investments | 18.1 | — | |||||
Other | 16.6 | 19.6 | |||||
Total | $ | 107.7 | $ | 129.9 | |||
The detail of other non-current assets is as follows (in millions):
Other Non-Current Assets | June 30, 2018 | December 31, 2017 | |||||
Prepaid tax asset | $ | — | $ | 56.2 | |||
Deferred financing costs | 7.0 | 5.9 | |||||
Long-term income tax receivables | 14.0 | 2.1 | |||||
Supply and Offtake receivable | 32.7 | 46.3 | |||||
Long-term derivative assets (see Note 16) | 0.7 | — | |||||
Other | 10.1 | 16.3 | |||||
Total | $ | 64.5 | $ | 126.8 | |||
30
The detail of accrued expenses and other current liabilities is as follows (in millions):
Accrued Expenses and Other Current Liabilities | June 30, 2018 | December 31, 2017 | |||||
Income and other taxes payable | $ | 221.4 | $ | 154.1 | |||
Short-term derivative liabilities (see Note 16) | 31.0 | 54.4 | |||||
Interest payable | 9.3 | 13.0 | |||||
Employee costs | 33.3 | 46.6 | |||||
Environmental liabilities (see Note 17) | 7.6 | 7.2 | |||||
Product financing agreements | — | 72.3 | |||||
RINs Obligation deficit (see Note 15) | 6.4 | 130.8 | |||||
Accrued utilities | 7.4 | 9.4 | |||||
Tank inspection liabilities | 8.7 | 10.7 | |||||
Crude liabilities | 87.7 | 34.5 | |||||
Other | 32.2 | 31.9 | |||||
Total | $ | 445.0 | $ | 564.9 | |||
The detail of other non-current liabilities is as follows (in millions):
Other Non-Current Liabilities | June 30, 2018 | December 31, 2017 | |||||
Pension and other postemployment benefit liabilities, net (see Note 18) | $ | 37.0 | $ | 37.0 | |||
Long-term derivative liabilities (see Note 16) | 0.2 | 0.9 | |||||
Liability for unrecognized tax benefits | 7.2 | 6.1 | |||||
Above-market lease | 10.1 | 11.2 | |||||
Tank inspection liabilities | 10.1 | 11.7 | |||||
Other | 10.1 | 16.1 | |||||
Total | $ | 74.7 | $ | 83.0 | |||
31
10. Stockholders' Equity
Changes to equity during the six months ended June 30, 2018 are presented below (in millions, except per share amounts):
Delek Stockholders' Equity | Non-Controlling Interest in Subsidiaries | Total Stockholders' Equity | ||||||||||
Balance at December 31, 2017 | $ | 1,650.6 | $ | 313.6 | $ | 1,964.2 | ||||||
Net income | 44.2 | 22.5 | 66.7 | |||||||||
Net unrealized loss on cash flow hedges, net of income tax benefit of $13.3 million and ineffectiveness gain of $0.7 million | (49.9 | ) | — | (49.9 | ) | |||||||
Foreign currency translation loss | (0.6 | ) | — | (0.6 | ) | |||||||
Other comprehensive income related to postretirement benefit plans | 0.1 | — | 0.1 | |||||||||
Other comprehensive income related to interest rate contracts | (0.5 | ) | — | (0.5 | ) | |||||||
Common stock dividends ($0.45 per share) | (37.8 | ) | — | (37.8 | ) | |||||||
Distributions to non-controlling interests | — | (14.1 | ) | (14.1 | ) | |||||||
Equity-based compensation expense | 10.2 | 0.2 | 10.4 | |||||||||
Issuance of stock for non-controlling interest repurchase, net of tax | 140.5 | (127.0 | ) | 13.5 | ||||||||
De-recognition of non-controlling interest | — | (18.7 | ) | (18.7 | ) | |||||||
Cumulative effect of adopting accounting principle regarding income tax effect of intra-equity transfers (see Note 1) | (29.9 | ) | — | (29.9 | ) | |||||||
Repurchase of common stock | (115.3 | ) | — | (115.3 | ) | |||||||
Taxes due to the net settlement of equity-based compensation | (8.8 | ) | — | (8.8 | ) | |||||||
Balance at June 30, 2018 | $ | 1,602.8 | $ | 176.5 | $ | 1,779.3 | ||||||
Dividends
During the six months ended June 30, 2018, our Board of Directors declared the following dividends:
Date Declared | Dividend Amount Per Share | Record Date | Payment Date | |||
February 26, 2018 | $0.20 | March 12, 2018 | March 26, 2018 | |||
May 7, 2018 | $0.25 | May 21, 2018 | June 4, 2018 | |||
32
Stock Repurchase Program
In December 2016, our Board of Directors authorized a share repurchase program for up to $150.0 million of Delek common stock. Any share repurchases under the repurchase program may be implemented through open market transactions or in privately negotiated transactions, in accordance with applicable securities laws. The timing, price and size of repurchases will be made at the discretion of management and will depend on prevailing market prices, general economic and market conditions and other considerations. The repurchase program does not obligate us to acquire any particular amount of stock and does not expire. 762,623 shares were repurchased, for a total of $25.0 million, pursuant to this repurchase program in December 2017.
During the three and six months ended June 30, 2018, 371,271 and 2,941,203 shares of our common stock were repurchased, for a total of $20.0 million and $115.3 million, respectively. The six months ended June 30, 2018 includes the 2.0 million shares of our common stock from Alon Israel in connection with Delek’s rights pursuant to a Stock Purchase Agreement dated April 14, 2015, by and between Delek and Alon Israel. Alon Israel delivered a right of first offer notice to Delek on January 16, 2018, informing Delek of Alon Israel’s intention to sell the 2.0 million shares, and Delek accepted such offer on January 17, 2018. The total purchase price for the 2.0 million shares was approximately $75.3 million, or $37.64 per share.
On February 26, 2018, the Board of Directors approved a new $150.0 million authorization to repurchase Delek common stock, which was announced on February 26, 2018. This amount has no expiration date and is in addition to any remaining amounts previously authorized. As of June 30, 2018, there was approximately $159.7 million of authorization remaining under Delek's aggregate stock repurchase program.
11. Income Taxes
Under ASC 740, Income Taxes (“ASC 740”), companies are required to apply an estimated annual tax rate to interim period results on a year-to-date basis; however, the estimated annual tax rate should not be applied to interim financial results if a reliable estimate cannot be made. In this situation, the interim tax rate should be based on actual year-to-date results. We used an estimated annual tax rate to record income taxes for the three and six months ended June 30, 2018, and an actual year-to-date effective tax rate to record income taxes for the three and six months ended June 30, 2017.
On December 22, 2017, the US government enacted the Tax Reform Act, which makes broad and complex changes to the US tax code, including a permanent reduction in the US federal corporate tax rate from 35% to 21% (“Rate Reduction”). The Tax Reform Act also puts into place new tax laws that will apply prospectively, which include, but are not limited to, modifying the rules governing the deductibility of certain executive compensation; extending and modifying the additional first-year depreciation deduction to accelerate expensing of certain qualified property; creating a limitation on deductible interest expense; and, changing rules related to uses and limitations of net operating loss carryforwards.
We are applying the guidance in Staff Accounting Bulletin 118 (“SAB 118”), when accounting for the effects of the Tax Reform Act. SAB 118 provides a measurement period that should not extend beyond one year from the Tax Reform Act enactment date for companies to complete the accounting under ASC 740. In accordance with SAB 118, a company must reflect the income tax effects of those aspects of the Tax Reform Act for which the accounting under ASC 740 is complete. To the extent that a company’s accounting for certain income tax effects of the Tax Reform Act is incomplete but it is able to determine a reasonable estimate, it must record a provisional estimate to be included in the financial statements. If a company cannot determine a provisional estimate to be included in the financial statements, it should continue to apply ASC 740 on the basis of the provision of the tax laws that were in effect immediately before the enactment of the Tax Reform Act.
The Company has not completed the accounting for the income tax effects of the Tax Reform Act. At December 31, 2017, the Company recorded a discrete net tax benefit of $166.9 million primarily related to provisional amounts under SAB 118 for the remeasurement of US deferred tax assets and liabilities due to the Rate Reduction. Upon further analyses of certain aspects of the Act and refinement of our calculations during the three and six months ended June 30, 2018, we adjusted our provisional amounts by an additional expense of $10.0 million and $2.6 million, respectively, which is included as a component of income tax expense from continuing operations. We also had a reclassification of $1.6 million from accumulated other comprehensive income to retained earnings for stranded tax effects as of June 30, 2018 resulting from the Tax Reform Act. See Note 1 for further information. We will continue to analyze and refine our calculations related to the measurement of these balances as supplemental legislation, regulatory guidance or evolving technical interpretations become available.
On January 1, 2018, we decreased prepaid income taxes by $59.4 million, increased income taxes payable by $3.0 million, decreased deferred tax liabilities by $32.5 million and decreased retained earnings by $29.9 million for the cumulative effect related to new guidance that requires recognizing the income tax consequences of an intra-entity transfer of an asset other than inventory when the transfer occurs - see Note 1 for further information.
Our effective tax rate was 27.3% and 17.3% for the three and six months ended June 30, 2018, respectively, compared to 45.6% and 56.6% for the three and six months ended June 30, 2017, respectively. The change in our effective tax rate was primarily due to the following:
33
reduction to Federal tax rate attributable to continued adjustments to properly consider the impact of the Tax Reform Act (which reduced the US federal corporate tax rate from 35% to 21%) on previously recorded deferred taxes (as discussed above), combined with income tax benefit for federal tax credits attributable to the Company’s biodiesel blending operations for 2017, partially offset by tax expense associated with the impairment of assets held for sale.
12. Equity-Based Compensation
Delek US Holdings, Inc. 2006 and 2016 and Alon USA Energy, Inc. 2005 Long-Term Incentive Plans (the "Incentive Plans")
On May 8, 2018, the Company’s stockholders approved an amendment to the Delek US Holdings, Inc. 2016 Long-Term Incentive Plan that increased the number of shares of Common Stock available for issuance under this plan by 4,500,000 shares to 8,900,000 shares.
Compensation expense related to equity-based awards granted under the Incentive Plans amounted to $5.6 million ($4.4 million, net of taxes) and $10.1 million ($8.0 million, net of taxes) for the three and six months ended June 30, 2018, respectively, and $3.7 million ($2.4 million, net of taxes) and $7.0 million ($4.5 million, net of taxes) for the three and six months ended June 30, 2017, respectively. These amounts are included in general and administrative expenses in the accompanying condensed consolidated statements of income.
As of June 30, 2018, there was $51.8 million of total unrecognized compensation cost related to non-vested share-based compensation arrangements, which is expected to be recognized over a weighted-average period of 2.7 years.
We issued 324,658 and 445,061 shares of common stock as a result of exercised or vested equity-based awards during the three and six months ended June 30, 2018, respectively, and 126,342 and 200,453 during the three and six months ended June 30, 2017, respectively. These amounts are net of 580,037 and 834,761 shares withheld to satisfy employee tax obligations related to the exercises and vestings during the three and six months ended June 30, 2018, respectively, and 89,895 and 151,740 shares during the three and six months ended June 30, 2017, respectively.
Delek Logistics GP, LLC 2012 Long-Term Incentive Plan
Compensation expense for Delek Logistics GP equity-based awards was $0.2 million ($0.1 million, net of taxes) and $0.3 million ($0.2 million, net of taxes) for the three and six months ended June 30, 2018, respectively, and $0.5 million ($0.3 million, net of taxes) and $0.9 million ($0.6 million, net of taxes) for the three and six months ended June 30, 2017, respectively. These amounts are included in general and administrative expenses in the accompanying condensed consolidated statements of income.
As of June 30, 2018, there was $0.6 million of total unrecognized compensation cost related to non-vested share-based compensation arrangements, which is expected to be recognized over a weighted-average period of 0.9 years.
13. Earnings (Loss) Per Share
Basic earnings per share (or "EPS") is computed by dividing net income (loss) by the weighted average common shares outstanding. Diluted earnings per share is computed by dividing net income (loss), as adjusted for changes to income that would result from the assumed settlement of the dilutive equity instruments included in diluted weighted average common shares outstanding, by the diluted weighted average common shares outstanding. For all periods presented, we have outstanding various equity-based compensation awards that are considered in our diluted EPS calculation when to do so would not be anti-dilutive, and is inclusive of awards disclosed in Note 12 to these condensed consolidated financial statements. For those instruments that are indexed to our common stock, they are generally dilutive when the market price of the underlying indexed share of common stock is in excess of the exercise price. Additionally, in connection with the Delek/Alon Merger (disclosed in Note 2), we assumed certain equity instruments, including conversion options (associated with Convertible Debt) and Warrants, that may be dilutive (see discussion of these instruments in Note 8). The Convertible Debt conversion options are dilutive when the incremental EPS calculated by dividing the increase in income associated with the elimination of interest expense on the convertible debt, net of tax, by the number of shares that would be issued upon conversion using the treasury stock method (which is applicable because of the cash settlement feature associated with the underlying principal) is dilutive to the overall diluted EPS calculation. The Warrants are generally dilutive when the market price of the underlying indexed share of common stock is in excess of the exercise price. All such instruments that may otherwise be dilutive may not be dilutive when there is net loss for the period. We also assumed Call Options in connection with the Delek/Alon Merger which are not reflected in the diluted weighted average common shares outstanding because to do so would be antidilutive.
34
The following table sets forth the computation of basic and diluted earnings per share.
Three Months Ended | Six Months Ended | |||||||||||||||
June 30, | June 30, | |||||||||||||||
2018 | 2017 | 2018 | 2017 | |||||||||||||
Numerator: | ||||||||||||||||
Numerator for EPS - continuing operations | ||||||||||||||||
Income (loss) from continuing operations | $ | 87.5 | $ | (32.2 | ) | $ | 75.7 | $ | (16.9 | ) | ||||||
Less: Income from continuing operations attributed to non-controlling interest | 7.6 | 5.7 | 14.4 | 9.8 | ||||||||||||
Income (loss) from continuing operations attributable to Delek (numerator for basic EPS - continuing operations attributable to Delek) | 79.9 | (37.9 | ) | 61.3 | (26.7 | ) | ||||||||||
Interest on convertible debt, net of tax | 0.9 | — | — | — | ||||||||||||
Numerator for diluted EPS - continuing operations attributable to Delek | $ | 80.8 | $ | (37.9 | ) | $ | 61.3 | $ | (26.7 | ) | ||||||
Numerator for EPS - discontinued operations | ||||||||||||||||
Income (loss) from discontinued operations | $ | (0.8 | ) | $ | — | $ | (9.0 | ) | $ | — | ||||||
Less: Income from discontinued operations attributed to non-controlling interest | — | — | 8.1 | — | ||||||||||||
Income (loss) from discontinued operations attributable to Delek | $ | (0.8 | ) | $ | — | $ | (17.1 | ) | $ | — | ||||||
Weighted average common shares outstanding (denominator for basic EPS) | 84,041,358 | 62,054,485 | 83,151,823 | 62,016,489 | ||||||||||||
Dilutive effect of convertible debt | 2,635,399 | — | — | — | ||||||||||||
Dilutive effect of warrants | 1,685,053 | — | 1,061,053 | — | ||||||||||||
Dilutive effect of stock-based awards | 1,882,547 | — | 1,560,711 | — | ||||||||||||
Weighted average common shares outstanding, assuming dilution | 90,244,357 | 62,054,485 | 85,773,587 | 62,016,489 | ||||||||||||
EPS: | ||||||||||||||||
Basic income (loss) per share: | ||||||||||||||||
Income (loss) from continuing operations | $ | 0.95 | $ | (0.61 | ) | $ | 0.74 | $ | (0.43 | ) | ||||||
Loss from discontinued operations | $ | (0.01 | ) | — | $ | (0.21 | ) | — | ||||||||
Total basic income (loss) per share | $ | 0.94 | $ | (0.61 | ) | $ | 0.53 | $ | (0.43 | ) | ||||||
Diluted income (loss) per share: | ||||||||||||||||
Income (loss) from continuing operations | $ | 0.90 | $ | (0.61 | ) | $ | 0.71 | $ | (0.43 | ) | ||||||
Loss from discontinued operations | $ | (0.01 | ) | — | $ | (0.20 | ) | — | ||||||||
Total diluted income (loss) per share | $ | 0.89 | $ | (0.61 | ) | $ | 0.51 | $ | (0.43 | ) | ||||||
The following equity instruments were excluded from the diluted weighted average common shares outstanding because their effect would be antidilutive: | ||||||||||||||||
Antidilutive stock-based compensation (because average share price is less than exercise price) | 670,206 | 2,496,129 | 837,206 | 2,508,129 | ||||||||||||
Antidilutive due to loss | — | 699,700 | — | 697,235 | ||||||||||||
Total antidilutive stock-based compensation | 670,206 | 3,195,829 | 837,206 | 3,205,364 | ||||||||||||
Antidilutive because incremental EPS impact is antidilutive (higher than the basic EPS calculation) | — | — | 2,154,934 | |||||||||||||
Total antidilutive convertible debt instruments | — | — | 2,154,934 | — | ||||||||||||
35
14. Segment Data
We aggregate our operating units into three reportable segments: refining, logistics and retail.
Our corporate activities, results of certain immaterial operating segments, including our Canadian crude trading operations, Alon's asphalt terminal operations effective with the Delek/Alon Merger, our equity method investment in Alon prior to the Delek/Alon Merger, as well as our discontinued Paramount and Long Beach, California refinery and California renewable fuels facility operations (acquired as part of the Delek/Alon Merger - see Note 5 for further discussion), and intercompany eliminations are reported in the corporate, other and eliminations segment. On March 16, 2018, Delek sold to World Energy, LLC (i) all of Delek’s membership interests in the California renewable fuels facility, (ii) certain refining assets and other related assets located in Paramount, California and (iii) certain associated tank farm and pipeline assets and other related assets located in California, as further discussed in Note 5. On May 21, 2018, Delek sold certain assets and operations of four asphalt terminals (included in Delek's corporate/other segment), as well as an equity method investment in an additional asphalt terminal, to an affiliate of Andeavor, as further discussed in Note 5.
Decisions concerning the allocation of resources and assessment of operating performance are made based on this segmentation. Management measures the operating performance of each of the reportable segments based on the segment contribution margin. Segment contribution margin is defined as net revenues less cost of goods sold and operating expenses, excluding depreciation and amortization. Operations which are not specifically included in the reportable segments are included in the corporate and other category, which primarily consists of net revenues, operating costs and expenses, depreciation and amortization expense and interest income and expense associated with our discontinued operations (see Note 5 for further discussion) and with our corporate headquarters.
The refining segment processes crude oil and other purchased feedstocks for the manufacture of transportation motor fuels, including various grades of gasoline, diesel fuel, aviation fuel, asphalt and other petroleum-based products that are distributed through owned and third-party product terminals. Prior to the Delek/Alon Merger, the refining segment had a combined nameplate capacity of 155,000 bpd, including the 75,000 bpd Tyler refinery and the 80,000 bpd El Dorado, Arkansas refinery (the "El Dorado refinery"). The refining segment also owns and operates two biodiesel facilities involved in the production of biodiesel fuels and related activities, located in Crossett, Arkansas and Cleburn, Texas. Effective with the Delek/Alon Merger, our refining segment now also includes the operations of a refinery located in Big Spring, Texas with a nameplate capacity of 73,000 bpd (the "Big Spring refinery"), a refinery located in Krotz Springs, Louisiana with a nameplate capacity of 74,000 bpd (the "Krotz Springs refinery) and a refinery located in Bakersfield, California. The Bakersfield, California refinery has not processed crude oil since 2012 due to the high cost of crude oil relative to product yield and low asphalt demand. Alon's petroleum-based products are marketed primarily in the south central, southwestern and western regions of the United States and also ships and sells gasoline into wholesale markets in the Southern and Eastern United States. Motor fuels are sold under the Alon brand through various terminals to supply Alon branded retail sites, including our retail segment convenience stores. In addition, Alon sells motor fuels through its wholesale distribution network on an unbranded basis.
Our refining segment has service agreements with our logistics segment, which, among other things, requires the refining segment to pay service fees based on the number of gallons sold and a sharing of a portion of the margin achieved in return for providing marketing, sales and customer services at the Tyler refinery, and effective March 1, 2018 at the Big Spring refinery (see Note 3 for further discussion regarding the new marketing agreement). These intercompany transaction fees in regards to the Tyler refinery were $5.5 million and $10.5 million during the three and six months ended June 30, 2018, respectively, and $5.3 million and $9.6 million during the three and six months ended June 30, 2017, respectively. The intercompany transaction fees in regards to the Big Spring refinery for the three and six months ended June 30, 2018 were $3.2 million and $4.3 million, respectively. Additionally, the refining segment pays crude transportation, terminalling and storage fees to the logistics segment for the utilization of pipeline, terminal and storage assets, including effective March 1, 2018, those related to the Big Spring Logistic Assets Acquisition discussed further in Note 3. These fees were $43.6 million and $97.9 million during the three and six months ended June 30, 2018, respectively, and $33.1 million and $64.3 million during the three and six months ended June 30, 2017, respectively. The logistics segment also sold $0.7 million and $2.0 million of Renewable Identification Numbers ("RINs") to the refining segment during the three and six months ended June 30, 2018, respectively, and $1.2 million and $2.3 million during the three and six months ended June 30, 2017, respectively. The refining segment recorded sales revenues from the retail segment of $118.9 million and $218.4 million and from sales of asphalt to our other segment of $7.7 million and $11.1 million during the three and six months ended June 30, 2018, respectively, and sales revenues from the logistics segment of $99.5 million and $181.8 million during the three and six months ended June 30, 2018, respectively, and $8.2 million and $17.2 million during the three and six months ended June 30, 2017, respectively. All inter-segment transactions have been eliminated in consolidation.
Our logistics segment owns and operates crude oil and refined products logistics and marketing assets. The logistics segment generates revenue by charging fees for gathering, transporting and storing crude oil and for marketing, distributing, transporting and storing intermediate and refined products in select regions of the southeastern United States and west Texas for our refining segment and third parties, and sales of wholesale product in the west Texas market.
36
Effective with the Delek/Alon Merger July 1, 2017 (see Note 2), Delek's retail segment includes the operations of Alon's approximately 300 owned and leased convenience store sites located primarily in central and west Texas and New Mexico. These convenience stores typically offer various grades of gasoline and diesel under the Alon brand name and food products, food service, tobacco products, non-alcoholic and alcoholic beverages, general merchandise as well as money orders to the public, primarily under the 7-Eleven and Alon brand names. Substantially all of the motor fuel sold through our retail segment is supplied by our Big Spring refinery, which is transferred to the retail segment at prices substantially determined by reference to published commodity pricing information.
The following is a summary of business segment operating performance as measured by contribution margin for the period indicated (in millions):
Three Months Ended June 30, 2018 | ||||||||||||||||||||
(In millions) | Refining | Logistics | Retail | Corporate, Other and Eliminations | Consolidated | |||||||||||||||
Net revenues (excluding intercompany fees and sales) | $ | 2,243.7 | $ | 113.3 | $ | 244.8 | $ | (38.3 | ) | $ | 2,563.5 | |||||||||
Intercompany fees and sales | 226.1 | 53.0 | — | (279.1 | ) | — | ||||||||||||||
Operating costs and expenses: | ||||||||||||||||||||
Cost of goods sold | 2,179.6 | 106.0 | 200.9 | (309.7 | ) | 2,176.8 | ||||||||||||||
Operating expenses | 113.2 | 14.9 | 25.3 | 4.1 | 157.5 | |||||||||||||||
Segment contribution margin | $ | 177.0 | $ | 45.4 | $ | 18.6 | $ | (11.8 | ) | 229.2 | ||||||||||
General and administrative expenses | 52.9 | |||||||||||||||||||
Depreciation and amortization | 49.2 | |||||||||||||||||||
Other operating income, net | (8.0 | ) | ||||||||||||||||||
Operating income | $ | 135.1 | ||||||||||||||||||
Total assets (1) | $ | 5,101.7 | $ | 650.3 | $ | 332.8 | $ | 127.0 | $ | 6,211.8 | ||||||||||
Capital spending (excluding business combinations) (2) | $ | 33.7 | $ | 2.3 | $ | 2.1 | $ | 16.6 | $ | 54.7 | ||||||||||
Six Months Ended June 30, 2018 | ||||||||||||||||||||
Refining (3) | Logistics | Retail | Corporate, Other and Eliminations (3) | Consolidated | ||||||||||||||||
Net revenues (excluding intercompany fees and sales) | $ | 4,184.4 | $ | 219.5 | $ | 454.4 | $ | 58.4 | $ | 4,916.7 | ||||||||||
Intercompany fees and sales | 411.3 | 114.7 | — | (526.0 | ) | — | ||||||||||||||
Operating costs and expenses: | ||||||||||||||||||||
Cost of goods sold | 4,057.5 | 225.0 | 374.1 | (437.0 | ) | 4,219.6 | ||||||||||||||
Operating expenses | 227.9 | 27.5 | 49.8 | 10.4 | 315.6 | |||||||||||||||
Segment contribution margin | $ | 310.3 | $ | 81.7 | $ | 30.5 | $ | (41.0 | ) | 381.5 | ||||||||||
General and administrative expenses | 118.1 | |||||||||||||||||||
Depreciation and amortization | 97.2 | |||||||||||||||||||
Other operating income, net | (7.7 | ) | ||||||||||||||||||
Operating income | $ | 173.9 | ||||||||||||||||||
Capital spending (excluding business combinations) (2) | $ | 85.2 | $ | 4.5 | $ | 4.1 | $ | 31.0 | $ | 124.8 | ||||||||||
37
Three Months Ended June 30, 2017 | ||||||||||||||||
Refining | Logistics | Corporate, Other and Eliminations | Consolidated | |||||||||||||
Net revenues (excluding intercompany fees and sales) | $ | 1,144.8 | $ | 87.1 | $ | (1.2 | ) | $ | 1,230.7 | |||||||
Intercompany fees and sales | 8.2 | 39.6 | (47.8 | ) | — | |||||||||||
Operating costs and expenses: | ||||||||||||||||
Cost of goods sold | 1,084.5 | 85.0 | (11.7 | ) | 1,157.8 | |||||||||||
Operating expenses | 51.6 | 10.0 | 0.5 | 62.1 | ||||||||||||
Segment contribution margin | $ | 16.9 | $ | 31.7 | $ | (37.8 | ) | 10.8 | ||||||||
General and administrative expenses | 27.5 | |||||||||||||||
Depreciation and amortization | 29.5 | |||||||||||||||
Other operating expense, net | 0.3 | |||||||||||||||
Operating loss | $ | (46.5 | ) | |||||||||||||
Total assets | $ | 1,949.6 | $ | 415.5 | $ | 511.4 | $ | 2,876.5 | ||||||||
Capital spending (excluding business combinations) | $ | 11.2 | $ | 2.1 | $ | 1.7 | $ | 15.0 | ||||||||
Six Months Ended June 30, 2017 | ||||||||||||||||
Refining | Logistics | Corporate, Other and Eliminations | Consolidated | |||||||||||||
Net revenues (excluding intercompany fees and sales) | $ | 2,235.3 | $ | 180.0 | $ | (2.5 | ) | $ | 2,412.8 | |||||||
Intercompany fees and sales | 17.2 | 76.2 | (93.4 | ) | — | |||||||||||
Operating costs and expenses: | ||||||||||||||||
Cost of goods sold | 2,065.3 | 177.6 | (49.4 | ) | 2,193.5 | |||||||||||
Operating expenses | 102.4 | 20.3 | 0.6 | 123.3 | ||||||||||||
Segment contribution margin | $ | 84.8 | $ | 58.3 | $ | (47.1 | ) | 96.0 | ||||||||
General and administrative expenses | 54.0 | |||||||||||||||
Depreciation and amortization | 58.5 | |||||||||||||||
Other operating expense, net | 0.3 | |||||||||||||||
Operating loss | $ | (16.8 | ) | |||||||||||||
Capital spending (excluding business combinations) | $ | 22.0 | $ | 4.9 | $ | 3.3 | $ | 30.2 | ||||||||
(1) | Assets held for sale of $25.2 million are included in the corporate, other and eliminations segment as of June 30, 2018. |
(2) | Capital spending excludes transaction costs capitalized in the amount of $0.4 million during the six months ended June 30, 2018, that relate to the Big Spring Logistic Assets Acquisition. |
(3) | The corporate, other and eliminations segment results of operations for the six months ended June 30, 2018 includes Canada trading activity which was previously included and reported in the refining segment for the three months ended March 31, 2018. |
38
Property, plant and equipment and accumulated depreciation as of June 30, 2018 and depreciation expense by reporting segment for the three and six months ended June 30, 2018 are as follows (in millions):
Refining | Logistics | Retail | Corporate, Other and Eliminations | Consolidated | ||||||||||||||||
Property, plant and equipment | $ | 2,112.3 | $ | 447.0 | $ | 143.4 | $ | 109.7 | $ | 2,812.4 | ||||||||||
Less: Accumulated depreciation | (521.0 | ) | (127.6 | ) | (16.8 | ) | (43.4 | ) | (708.8 | ) | ||||||||||
Property, plant and equipment, net | $ | 1,591.3 | $ | 319.4 | $ | 126.6 | $ | 66.3 | $ | 2,103.6 | ||||||||||
Depreciation expense for the three months ended June 30, 2018 | $ | 31.2 | $ | 7.0 | $ | 4.6 | $ | 4.5 | $ | 47.3 | ||||||||||
Depreciation expense for the six months ended June 30, 2018 | $ | 60.3 | $ | 12.9 | $ | 11.1 | $ | 7.4 | $ | 91.7 | ||||||||||
In accordance with ASC 360, Delek evaluates the realizability of property, plant and equipment as events occur that might indicate potential impairment. There were no indicators of impairment of our property, plant and equipment as of June 30, 2018.
15. Fair Value Measurements
The fair values of financial instruments are estimated based upon current market conditions and quoted market prices for the same or similar instruments. Management estimates that the carrying value approximates fair value for all of Delek’s assets and liabilities that fall under the scope of ASC 825, Financial Instruments ("ASC 825").
Delek applies the provisions of ASC 820, Fair Value Measurements ("ASC 820"), which defines fair value, establishes a framework for its measurement and expands disclosures about fair value measurements. ASC 820 applies to our commodity and interest rate derivatives that are measured at fair value on a recurring basis. The standard also requires that we assess the impact of nonperformance risk on our derivatives. Nonperformance risk is not considered material to our financial statements as of June 30, 2018.
ASC 820 requires disclosures that categorize assets and liabilities measured at fair value into one of three different levels depending on the observability of the inputs employed in the measurement. Level 1 inputs are quoted prices in active markets for identical assets or liabilities. Level 2 inputs are observable inputs other than quoted prices included within Level 1 for the asset or liability, either directly or indirectly through market-corroborated inputs. Level 3 inputs are unobservable inputs for the asset or liability reflecting our assumptions about pricing by market participants.
Commodity swaps, exchange-traded futures, options, physical commodity forward purchase and sale contracts (that do qualify as normal purchases or normal sales), and interest rate swaps are generally valued using industry-standard models that consider various assumptions, including quoted forward prices, spot prices, interest rates, time value, volatility factors and contractual prices for the underlying instruments, as well as other relevant economic measures. The degree to which these inputs are observable in the forward markets determines the classification as Level 2 or 3. Our contracts are valued based on exchange pricing and/or price index developers such as Platts or Argus and are, therefore, classified as Level 2. Commodity investments are valued using published market prices of the commodity on the applicable exchange and are, therefore, classified as Level 1.
The U.S. Environmental Protection Agency ("EPA") requires certain refiners to blend biofuels into the fuel products they produce pursuant to the EPA’s Renewable Fuel Standard - 2. Alternatively, credits called RINs, which may be generated and/or purchased, can be used to satisfy this obligation instead of physically blending biofuels ("RINs Obligation"). Our RINs Obligation surplus or deficit is based on the amount of RINs we must purchase, net of amounts internally generated and purchased and the price of those RINs as of the balance sheet date. The RINs Obligation surplus or deficit is categorized as Level 2, and is measured at fair value based on quoted prices from an independent pricing service.
In both March 2018 and March 2017, the El Dorado refinery received approval from the EPA for a small refinery exemption from the requirements of the renewable fuel standard for the 2017 and 2016 calendar years, respectively, which resulted in a reduction of our RINs Obligation and related cost of goods sold of approximately $59.3 million and $47.5 million for the six months ended June 30, 2018 and June 30, 2017, respectively. In March 2018, the Krotz Springs refinery received such approval as well, which resulted in a reduction of our RINs Obligation and related cost of goods sold of approximately $31.6 million for the six months ended June 30, 2018.
Our RIN commitment contracts are future commitments to purchase or sell RINs at fixed prices and quantities, which are used to manage the costs associated with our RINs Obligation. These RIN commitment contracts are categorized as Level 2, and are measured at fair value based on quoted prices from an independent pricing service. Changes in the fair value of these future RIN commitment contracts are recorded in cost of goods sold on the condensed consolidated statements of income.
39
We have elected to account for our J. Aron step-out liability at fair value in accordance with ASC 825, as it pertains to the fair value option. This standard permits the election to carry financial instruments and certain other items similar to financial instruments at fair value on the balance sheet, with all changes in fair value reported in earnings. Our J. Aron step-out liability is categorized as Level 2, and is measured at fair value using market prices for the consigned crude oil and refined products we are required to repurchase from J. Aron at the end of the term of the Supply and Offtake Agreement. The J. Aron step-out liability is presented in the Obligation under Supply and Offtake Agreement line item of our condensed consolidated balance sheets. Gains (losses) related to the change in fair value are recorded as a component of cost of goods sold in the condensed consolidated statements of income.
The fair value hierarchy for our financial assets and liabilities accounted for at fair value on a recurring basis at June 30, 2018 and December 31, 2017, was as follows (in millions):
As of June 30, 2018 | ||||||||||||||||
Level 1 | Level 2 | Level 3 | Total | |||||||||||||
Assets | ||||||||||||||||
Commodity derivatives | $ | — | $ | 474.4 | $ | — | $ | 474.4 | ||||||||
Commodity investments | 18.1 | — | — | 18.1 | ||||||||||||
RIN commitment contracts | — | 8.0 | — | 8.0 | ||||||||||||
RINs Obligation surplus | — | 4.1 | — | 4.1 | ||||||||||||
Total assets | 18.1 | 486.5 | — | 504.6 | ||||||||||||
Liabilities | ||||||||||||||||
Commodity derivatives | — | (570.9 | ) | — | (570.9 | ) | ||||||||||
RIN commitment contracts | — | (12.0 | ) | — | (12.0 | ) | ||||||||||
RINs Obligation deficit | — | (6.4 | ) | — | (6.4 | ) | ||||||||||
J. Aron step-out liability | — | (471.2 | ) | — | (471.2 | ) | ||||||||||
Total liabilities | — | (1,060.5 | ) | — | (1,060.5 | ) | ||||||||||
Net liabilities | $ | 18.1 | $ | (574.0 | ) | $ | — | $ | (555.9 | ) | ||||||
As of December 31, 2017 | ||||||||||||||||
Level 1 | Level 2 | Level 3 | Total | |||||||||||||
Assets | ||||||||||||||||
Commodity derivatives | $ | — | $ | 178.0 | $ | — | $ | 178.0 | ||||||||
RIN commitment contracts | — | 1.4 | — | 1.4 | ||||||||||||
RINs Obligation surplus | — | 1.1 | — | 1.1 | ||||||||||||
Total assets | — | 180.5 | — | 180.5 | ||||||||||||
Liabilities | ||||||||||||||||
Interest rate derivatives | — | (0.9 | ) | — | (0.9 | ) | ||||||||||
Commodity derivatives | — | (203.9 | ) | — | (203.9 | ) | ||||||||||
RIN commitment contracts | — | (24.0 | ) | — | (24.0 | ) | ||||||||||
RINs Obligation deficit | — | (130.8 | ) | — | (130.8 | ) | ||||||||||
J. Aron step-out liability | — | (435.6 | ) | — | (435.6 | ) | ||||||||||
Total liabilities | — | (795.2 | ) | — | (795.2 | ) | ||||||||||
Net liabilities | $ | — | $ | (614.7 | ) | $ | — | $ | (614.7 | ) | ||||||
The derivative values above are based on analysis of each contract as the fundamental unit of account as required by ASC 820. In the table above, derivative assets and liabilities with the same counterparty are not netted where the legal right of offset exists. This differs from the presentation in the financial statements which reflects our policy, wherein we have elected to offset the fair value amounts recognized for multiple derivative instruments executed with the same counterparty and where the legal right of offset exists. As of June 30, 2018 and December 31, 2017, $109.9 million and $10.0 million, respectively, of cash collateral was held by counterparty brokerage firms and has been netted with the net derivative positions with each counterparty. See Note 16 for further information regarding derivative instruments.
40
16. Derivative Instruments
We use derivatives to reduce normal operating and market risks with the primary objective of reducing the impact of market price volatility on our results of operations. As such, our use of derivative contracts is aimed at:
• | limiting the exposure to price fluctuations of commodity inventory above or below target levels at each of our segments; |
• | managing our exposure to commodity price risk associated with the purchase or sale of crude oil, feedstocks and finished grade fuel products at each of our segments; |
• | managing the cost of our RINs Obligation using future commitments to purchase or sell RINs at fixed prices and quantities; and |
• | limiting the exposure to interest rate fluctuations on our floating rate borrowings. |
We primarily utilize commodity swaps, futures, and options contracts, generally with maturity dates of three years or less, and from time to time interest rate swap agreements to achieve these objectives. Futures contracts are standardized agreements, traded on a futures exchange, to buy or sell the commodity at a predetermined price at a specified future date. Options provide the right, but not the obligation to buy or sell the commodity at a specified price in the future. Commodity swap and futures contracts require cash settlement for the commodity based on the difference between a fixed or floating price and the market price on the settlement date. Options require payment of an upfront premium. Interest rate swap agreements economically hedge floating rate debt by exchanging interest rate cash flows, based on a notional amount from a floating rate to a fixed rate. Effective with the Delek/Alon Merger, we had four interest rate swap agreements, that were to mature March 2019, that effectively fixed the variable LIBOR interest component of the term loans within the Alon Retail Credit Agreement. The aggregate notional amount under these agreements were to cover approximately 77% of the outstanding principal of these term loans throughout the duration of the interest rate swaps. These interest rate swap agreements were terminated due to the extinguishment of the Alon Retail Credit Agreement in connection with the Refinancing on March 30, 2018, resulting in a reclassification of unrealized loss of $0.6 million from accumulated other comprehensive income to interest expense on the condensed consolidated income statement during the three months ended March 31, 2018 - see Note 8 for further information. Because these derivatives are entered into to achieve objectives specifically related to our inventory and production risks, such gains and losses (to the extent not hedged and recognized, at least initially, in other comprehensive income) are recognized in cost of goods sold.
Forward contracts are agreements to buy or sell a commodity at a predetermined price at a specified future date, and for our transactions, generally require physical delivery. Forward contracts where the underlying commodity will be used or sold in the normal course of business qualify as normal purchases and normal sales pursuant to ASC 815 Derivatives and Hedging ("ASC 815") and are not accounted for as derivative instruments. Rather, such forward contracts are accounted for under other applicable GAAP. Forward contracts that do not meet the normal purchases, normal sales exception are accounted for as derivative instruments. As of and for the three and six months ended June 30, 2018, all of our forward contracts that were accounted for as derivative instruments consisted of contracts related to our Canadian crude trading operations. Since Canadian crude trading activity is not related to managing supply or pricing risk of inventory that will be used in production, such unrealized and realized gains and losses are recognized in other operating income (expense), net rather than cost of goods sold on the accompanying condensed consolidated incomes statement. There were no forward contract transactions that were accounted for as derivatives during the three and six months ended June 30, 2017, and there were no forward contract derivative assets or liabilities outstanding as of December 31, 2017.
Futures, swaps or other commodity related derivative instruments that are utilized to specifically hedge our Canadian forward contract or investment positions are recognized in other operating income (expense), net because that is where the related underlying transactions are reflected.
At this time, we do not believe there is any material credit risk with respect to the counterparties to any of our derivative contracts.
From time to time, we also enter into future commitments to purchase or sell RINs at fixed prices and quantities, which are used to manage the costs associated with our RINs Obligation. These future RIN commitment contracts meet the definition of derivative instruments under ASC 815, and are recorded at estimated fair value in accordance with the provisions of ASC 815. Changes in the fair value of these future RIN commitment contracts are recorded in cost of goods sold on the condensed consolidated statements of income.
In accordance with ASC 815, certain of our commodity swap contracts and our interest rate agreements have been designated as cash flow hedges and the effective portion of the change in fair value between the execution date and the end of period (or early termination date in regards to the four Alon Retail interest rate swaps discussed above) has been recorded in other comprehensive income. The effective portion of the fair value of these contracts is recognized in income at the time the positions are closed and the hedged transactions are recognized in income. In regards to our interest rate swap agreements, the amount of losses in other comprehensive income were reclassified into earnings
41
as a result of the discontinuance of cash flow hedges since the originally forecasted Alon Retail Credit Agreement interest payments will not occur by the end of the originally specified time period due to the Refinancing on March 30, 2018, as discussed above.
The following table presents the fair value of our derivative instruments as of June 30, 2018 and December 31, 2017. The fair value amounts below are presented on a gross basis and do not reflect the netting of asset and liability positions permitted under our master netting arrangements, including cash collateral on deposit with our counterparties. We have elected to offset the recognized fair value amounts for multiple derivative instruments executed with the same counterparty in our financial statements. As a result, the asset and liability amounts below differ from the amounts presented in our condensed consolidated balance sheets. See Note 15 for further information regarding the fair value of derivative instruments (in millions):
June 30, 2018 | December 31, 2017 | ||||||||||||||||
Derivative Type | Balance Sheet Location | Assets | Liabilities | Assets | Liabilities | ||||||||||||
Derivatives not designated as hedging instruments: | |||||||||||||||||
Commodity derivatives(1) | Other current assets | $ | 402.2 | $ | (425.6 | ) | $ | 164.6 | $ | (162.0 | ) | ||||||
Commodity derivatives(1) | Other current liabilities | 13.1 | (27.8 | ) | 13.4 | (28.3 | ) | ||||||||||
Commodity derivatives(1) | Other long-term assets | 24.2 | (26.1 | ) | — | — | |||||||||||
Commodity derivatives(1) | Other long-term liabilities | 0.1 | (0.3 | ) | — | — | |||||||||||
RIN commitment contracts(2) | Other current assets | 8.0 | — | 1.4 | — | ||||||||||||
RIN commitment contracts(2) | Other current liabilities | — | (12.0 | ) | — | (24.0 | ) | ||||||||||
Derivatives designated as hedging instruments: | |||||||||||||||||
Commodity derivatives (1) | Other current assets | 18.7 | (72.8 | ) | — | — | |||||||||||
Commodity derivatives (1) | Other current liabilities | 0.1 | (4.9 | ) | — | (13.6 | ) | ||||||||||
Commodity derivatives (1) | Other long-term assets | 16.0 | (13.4 | ) | — | — | |||||||||||
Interest rate derivatives | Other long term-liabilities | — | — | — | (0.9 | ) | |||||||||||
Total gross fair value of derivatives | $ | 482.4 | $ | (582.9 | ) | $ | 179.4 | $ | (228.8 | ) | |||||||
Less: Counterparty netting and cash collateral(3) | 441.8 | (551.6 | ) | 163.5 | (173.6 | ) | |||||||||||
Total net fair value of derivatives | $ | 40.6 | $ | (31.3 | ) | $ | 15.9 | $ | (55.2 | ) | |||||||
(1) | As of June 30, 2018 and December 31, 2017, we had open derivative positions representing 108,416,649 and 35,978,000 barrels, respectively, of crude oil and refined petroleum products. Of these open positions, contracts representing 15,547,000 and 575,000 barrels were designated as cash flow hedging instruments as of June 30, 2018 and December 31, 2017, respectively. |
(2) | As of June 30, 2018 and December 31, 2017, we had open RIN commitment contracts representing 117,375,000 and 163,361,320 RINs, respectively. |
(3) | As of June 30, 2018 and December 31, 2017, $109.9 million and $10.0 million, respectively, of cash collateral held by counterparties has been netted with the derivatives with each counterparty. |
42
Total losses on our hedging derivatives and RIN commitment contracts recognized in the condensed consolidated statements of income are as follows (in millions):
Three Months Ended June 30, | Six Months Ended June 30, | |||||||||||||||
2018 | 2017 | 2018 | 2017 | |||||||||||||
(Losses) gains on commodity derivatives not designated as hedging instruments recognized in cost of goods sold | $ | (5.1 | ) | $ | 3.8 | $ | (14.4 | ) | $ | 8.5 | ||||||
(Losses) on commodity derivatives not designated as hedging instruments recognized in other operating income (expense), net (1) | (2.9 | ) | — | (2.9 | ) | — | ||||||||||
Realized (losses) reclassified out of OCI on commodity derivatives designated as cash flow hedging instruments | (8.8 | ) | (31.7 | ) | (8.8 | ) | (39.5 | ) | ||||||||
Gains recognized on commodity derivatives due to cash flow hedging ineffectiveness | 0.7 | 0.2 | 0.7 | 0.4 | ||||||||||||
Total | $ | (16.1 | ) | $ | (27.7 | ) | $ | (25.4 | ) | $ | (30.6 | ) | ||||
(1) | For alternative disclosures about "trading derivatives." See separate table below. |
For cash flow hedges, no component of the derivative instruments’ gains or losses was excluded from the assessment of hedge effectiveness for the three and six months ended June 30, 2018 or 2017. As of June 30, 2018 and December 31, 2017, losses of $40.7 million (related to Midland to Cushing crude price differentials at our refineries) and gains of $7.6 million (related to future purchases of crude oil), respectively, on cash flow hedges, net of tax, remained in accumulated other comprehensive income. Losses of $7.0 million, net of tax, on settled commodity contracts were reclassified into cost of goods sold in the condensed consolidated statements of income during both the three and six months ended June 30, 2018. Losses of $20.6 million and $25.7 million, net of tax, on settled commodity contracts were reclassified into cost of goods sold in the condensed consolidated statements of income during the three and six months ended June 30, 2017, respectively. We estimate that $54.1 million of deferred losses related to commodity cash flow hedges will be reclassified into cost of goods sold over the next 12 months as a result of hedged transactions that are forecasted to occur. As of December 31, 2017, gains of $0.4 million, net of tax, related to the interest rate cash flow hedges, remained in accumulated other comprehensive income. Related to Alon's interest rate swap cash flow hedges during the six months ended June 30, 2018, we recognized $0.1 million and $0.6 million in interest expense on the condensed consolidated statements of income in regards to normal settlements and for early termination settlements reclassified from accumulated other comprehensive income into income as a result of the discontinuation of cash flow hedge accounting, respectively. There was no cash flow hedge ineffectiveness for the six months ended June 30, 2018 in regards to Alon's interest rate swap cash flow hedges.
Total gains on our trading forward contract derivatives (none of which were designated as hedging instruments) recorded in other operating income (expense), net on the condensed consolidated statements of income are as follows (in millions):
Three Months Ended June 30, | Six Months Ended June 30, | ||||||||||||||||
2018 | 2017 | 2018 | 2017 | ||||||||||||||
Realized gains | $ | 8.8 | $ | — | $ | 8.8 | — | $ | — | ||||||||
Unrealized gains | 2.9 | — | 2.9 | — | |||||||||||||
Total | $ | 11.7 | $ | — | $ | 11.7 | $ | — | |||||||||
17. Commitments and Contingencies
Litigation
In the ordinary conduct of our business, we are from time to time subject to lawsuits, investigations and claims, including environmental claims and employee-related matters. Although we cannot predict with certainty the ultimate resolution of lawsuits, investigations and claims asserted against us, including civil penalties or other enforcement actions, we do not believe that any currently pending legal proceeding or proceedings to which we are a party will have a material adverse effect on our business, financial condition or results of operations. Certain environmental matters that have or may result in penalties or assessments are discussed below in the "Environmental, Health and Safety" section of Note 17.
Self-insurance
Delek records a self-insurance accrual for workers’ compensation claims up to a $1.0 million deductible on a per accident basis, general liability claims up to $4.0 million on a per occurrence basis and medical claims for eligible full-time employees up to $0.3 million per covered individual per calendar year. We also record a self-insurance accrual for auto liability up to a $1.0 million deductible on a per accident basis for claims incurred in recent periods, and up to a $4.0 million deductible for remaining claims from certain prior periods.
We have umbrella liability insurance available to each of our segments in an amount determined reasonable by management.
Environmental, Health and Safety
We are subject to extensive federal, state and local environmental and safety laws and regulations enforced by various agencies, including the EPA, the United States Department of Transportation, the Occupational Safety and Health Administration, as well as numerous state, regional and local environmental, safety and pipeline agencies. These laws and regulations govern the discharge of materials into the environment, waste management practices, pollution prevention measures and the composition of the fuels we produce, as well as the safe operation of our plants and pipelines and the safety of our workers and the public. Numerous permits or other authorizations are required under these laws and regulations for the operation of our refineries, renewable fuels facilities, terminals, pipelines, underground storage tanks, trucks, rail cars and related operations, and may be subject to revocation, modification and renewal.
43
These laws and permits raise potential exposure to future claims and lawsuits involving environmental and safety matters which could include soil and water contamination, air pollution, personal injury and property damage allegedly caused by substances which we manufactured, handled, used, released or disposed of, transported, or that relate to pre-existing conditions for which we have assumed responsibility. We believe that our current operations are in substantial compliance with existing environmental and safety requirements. However, there have been and will continue to be ongoing discussions about environmental and safety matters between us and federal and state authorities, including notices of violations, citations and other enforcement actions, some of which have resulted or may result in changes to operating procedures and in capital expenditures. While it is often difficult to quantify future environmental or safety related expenditures, we anticipate that continuing capital investments and changes in operating procedures will be required for the foreseeable future to comply with existing and new requirements, as well as evolving interpretations and more strict enforcement of existing laws and regulations.
The Big Spring refinery has been negotiating an agreement with the EPA for over 10 years under the EPA’s National Petroleum Refinery Initiative regarding alleged historical violations of the federal Clean Air Act related to emissions and emissions control equipment. A Consent Decree resolving these alleged historical violations for the Big Spring refinery was lodged with the United States District Court for the Northern District of Texas on June 6, 2017, and we expect that Consent Decree with modifications to become final in the third quarter of 2018. We anticipate the Consent Decree will require payment of a $0.5 million civil penalty and capital expenditures for pollution control equipment that may be significant over the next five years.
The Big Spring refinery had been in discussions with the EPA since March 2016 to resolve alleged violations regarding six batches of gasoline produced in 2012-2013 that exceeded the applicable Reid Vapor Pressure standard. The issue, which was previously accrued in the Delek/Alon Merger purchase price allocation, was resolved in January 2018, resulting in payment of a penalty of approximately $0.4 million.
Alon USA’s Paramount Petroleum subsidiary had been in discussions with the State of California since December 2016 regarding alleged violations of the state’s Low Carbon Fuel Standard (“LCFS”) program related to reporting of fuel transactions. The issue, which was previously accrued in the Delek/Alon Merger purchase price allocation, was resolved in March 2018, resulting in payment of a penalty of approximately $0.3 million.
As of June 30, 2018, we have recorded an environmental liability of approximately $143.3 million, primarily related to the estimated probable costs of remediating or otherwise addressing certain environmental issues of a non-capital nature at our refineries, as well as terminals, some of which we no longer own. This liability includes estimated costs for ongoing investigation and remediation efforts, which were already being performed by the former operators of the refineries and terminals prior to our acquisition of those facilities, for known contamination of soil and groundwater, as well as estimated costs for additional issues which have been identified subsequent to the acquisitions. Approximately $7.6 million of the total liability is expected to be expended over the next 12 months, with most of the balance expended by 2032, although some costs may extend up to 30 years. In the future, we could be required to extend the expected remediation period or undertake additional investigations of our refineries, pipelines and terminal facilities, which could result in the recognition of additional remediation liabilities.
We have experienced several crude oil releases from pipelines owned by our logistics segment, including, but not limited to:
• | Magnolia Station in March 2013 (the "Magnolia release") |
• | A pipeline segment east of El Dorado, Arkansas in February 2018 (the Sandy Bend - Urbana release) |
The United States Department of Justice (the "DOJ"), on behalf of the EPA, and the State of Arkansas, on behalf of the Arkansas Department of Environmental Quality, are currently pursuing an enforcement action against the Partnership with regard to potential violations of the Clean Water Act and certain state laws arising from the Magnolia Release. Although we have been negotiating a resolution to this matter with the EPA and the State of Arkansas, which will include monetary penalties and other relief, the DOJ and the State of Arkansas filed a civil action, on July 13, 2018, against two of Delek Logistics’ wholly-owned subsidiaries, Delek Logistics Operating LLC and SALA Gathering Systems LLC, with regard to the Magnolia Release seeking monetary penalties and injunctive relief. As of June 30, 2018, we have accrued $1.0 million, which we recorded in pipeline release liabilities in our condensed consolidated balance sheet, for the Magnolia Release in connection with these proceedings. We believe this amount is adequate to cover our expected obligations related to these proceedings and that these proceedings will not have a material adverse effect upon Delek's business, financial condition or result of operations.
Letters of Credit
As of June 30, 2018, we had in place letters of credit totaling approximately $133.3 million with various financial institutions securing obligations primarily with respect to our commodity purchases for the refining segment and our workers’ compensation and auto liability insurance programs. No amounts were drawn by beneficiaries of these letters of credit at June 30, 2018.
18. Employees
Postretirement Benefits
The components of net periodic benefit cost related to our benefit plans consisted of the following:
Components of net periodic benefit cost: | Three Months Ended June 30, 2018 | Six Months Ended June 30, 2018 | |||||
Service cost | $ | 0.2 | $ | 0.4 | |||
Interest cost | 1.2 | 2.4 | |||||
Expected return on plan assets | (1.8 | ) | (3.6 | ) | |||
Recognition due to settlement | — | (0.1 | ) | ||||
Net periodic benefit | $ | (0.4 | ) | $ | (0.9 | ) | |
The service cost component of net periodic benefit is included as part of general and administrative expenses in the accompanying condensed consolidated statements of income. The other components of net periodic benefit are included as part of other non-operating income, net. During the three months ended March 31, 2018, we completely settled the supplemental retirement income plan of the retail segment, and we had a partial settlement of Alon's executive non-qualified restoration plan.
Our estimated contributions to our pension plans during 2018 have not changed significantly from amounts previously disclosed in the notes to the consolidated financial statements for the year ended December 31, 2017. For the three and six months ended June 30, 2018, we made no contributions to our funded qualified pension plan, but made $0.1 million and $4.2 million of contributions related to payments to participants in our unfunded pension plans.
44
19. Subsequent Events
Dividend Declaration
On August 7, 2018, our Board of Directors voted to declare a quarterly cash dividend of $0.25 per share of our common stock, payable on September 4, 2018 to shareholders of record on August 21, 2018.
Disposal of Certain Long Beach Assets
The transaction to dispose of certain assets and liabilities associated with our Long Beach, California refinery, which remained classified as held for sale and discontinued operations as of June 30, 2018, to Bridge Point Long Beach, LLC, closed July 17, 2018 resulting in initial cash proceeds of approximately $14.9 million.
45
ITEM 2. MANAGEMENT’S DISCUSSION AND ANALYSIS OF FINANCIAL CONDITION AND RESULTS OF OPERATIONS
Management’s Discussion and Analysis of Financial Condition and Results of Operations ("MD&A") is management’s analysis of our financial performance and of significant trends that may affect our future performance. The MD&A should be read in conjunction with our condensed consolidated financial statements and related notes included elsewhere in this Quarterly Report on Form 10-Q and in the Annual Report on Form 10-K filed with the Securities and Exchange Commission ("SEC") on March 1, 2018 (the "Annual Report on Form 10-K"). Those statements in the MD&A that are not historical in nature should be deemed forward-looking statements that are inherently uncertain.
Unless otherwise noted or the context requires otherwise, the terms "we," "our," "us," "Delek" and the "Company" are used in this report to refer to Old Delek and its consolidated subsidiaries for the periods prior to July 1, 2017, and New Delek and its consolidated subsidiaries for the periods on or after July 1, 2017 - see Note 1 of the condensed consolidated financial statements in Item 1, Financial Statements, for additional information.
Forward-Looking Statements
This Quarterly Report on Form 10-Q contains "forward-looking statements" within the meaning of Section 27A of the Securities Act of 1933, as amended, and Section 21E of the Securities Exchange Act of 1934, as amended (the "Exchange Act"). These forward-looking statements reflect our current estimates, expectations and projections about our future results, performance, prospects and opportunities. Forward-looking statements include, among other things, the information concerning our possible future results of operations, business and growth strategies, financing plans, expectations that regulatory developments or other matters will or will not have a material adverse effect on our business or financial condition, our competitive position and the effects of competition, the projected growth of the industry in which we operate, and the benefits and synergies to be obtained from our completed and any future acquisitions, statements of management’s goals and objectives, and other similar expressions concerning matters that are not historical facts. Words such as "may," "will," "should," "could," "would," "predicts," "potential," "continue," "expects," "anticipates," "future," "intends," "plans," "believes," "estimates," "appears," "projects" and similar expressions, as well as statements in future tense, identify forward-looking statements.
Forward-looking statements should not be read as a guarantee of future performance or results, and will not necessarily be accurate indications of the times at, or by, which such performance or results will be achieved. Forward-looking information is based on information available at the time and/or management’s good faith belief with respect to future events, and is subject to risks and uncertainties that could cause actual performance or results to differ materially from those expressed in the statements. Important factors that, individually or in the aggregate, could cause such differences include, but are not limited to:
• | volatility in our refining margins or fuel gross profit as a result of changes in the prices of crude oil, other feedstocks and refined petroleum products; |
• | our ability to execute our strategy of growth through acquisitions and the transactional risks inherent in such acquisitions; |
• | acquired assets may suffer a diminishment in fair value, which may require us to record a write-down or impairment; |
• | reliability of our operating assets; |
• | competition; |
• | changes in, or the failure to comply with, the extensive government regulations applicable to our industry segments; |
• | changes in interpretations, assumptions and expectations regarding the Tax Cuts and Jobs Act, including additional guidance that may be issued by federal and state taxing authorities; |
• | diminution in value of long-lived assets may result in an impairment in the carrying value of the assets on our balance sheet and a resultant loss recognized in the statement of operations; |
• | general economic and business conditions affecting the southern, southwestern and western United States, particularly levels of spending related to travel and tourism; |
• | volatility under our derivative instruments; |
• | deterioration of creditworthiness or overall financial condition of a material counterparty (or counterparties); |
• | unanticipated increases in cost or scope of, or significant delays in the completion of, our capital improvement and periodic turnaround projects; |
• | risks and uncertainties with respect to the quantities and costs of refined petroleum products supplied to our pipelines and/or held in our terminals; |
46
• | operating hazards, natural disasters, casualty losses and other matters beyond our control; |
• | increases in our debt levels or costs; |
• | changes in our ability to continue to access the credit markets; |
• | compliance, or failure to comply, with restrictive and financial covenants in our various debt agreements; |
• | the inability of our subsidiaries to freely make dividends, loans or other cash distributions to us; |
• | seasonality; |
• | acts of terrorism aimed at either our facilities or other facilities that could impair our ability to produce or transport refined products or receive feedstocks; |
• | changes in the cost or availability of transportation for feedstocks and refined products; and |
• | other factors discussed under the headings "Management’s Discussion and Analysis of Financial Condition and Results of Operations" and "Risk Factors" and in our other filings with the SEC. |
In light of these risks, uncertainties and assumptions, our actual results of operations and execution of our business strategy could differ materially from those expressed in, or implied by, the forward-looking statements, and you should not place undue reliance upon them. In addition, past financial and/or operating performance is not necessarily a reliable indicator of future performance, and you should not use our historical performance to anticipate future results or period trends. We can give no assurances that any of the events anticipated by any forward-looking statements will occur or, if any of them do, what impact they will have on our results of operations and financial condition.
Forward-looking statements speak only as of the date the statements are made. We assume no obligation to update forward-looking statements to reflect actual results, changes in assumptions or changes in other factors affecting forward-looking information except to the extent required by applicable securities laws. If we do update one or more forward-looking statements, no inference should be drawn that we will make additional updates with respect thereto or with respect to other forward-looking statements.
Executive Summary and Strategic Overview
Business Overview
We are an integrated downstream energy business focused on petroleum refining, the transportation, storage and wholesale distribution of crude oil, intermediate and refined products and convenience store retailing.
Effective with the Delek/Alon Merger July 1, 2017, Delek's retail segment includes the operations of Alon's approximately 300 owned and leased convenience store sites located primarily in central and west Texas and New Mexico. These convenience stores typically offer various grades of gasoline and diesel under the Alon brand name and food products, food service, tobacco products, non-alcoholic and alcoholic beverages, general merchandise as well as money orders to the public, primarily under the 7-Eleven and Alon brand names. Substantially all of the motor fuel sold through our retail segment is supplied by our Big Spring refinery, which is transferred to the retail segment at prices substantially determined by reference to published commodity pricing information.
Our corporate activities, results of certain immaterial operating segments, including Alon's asphalt terminal operations effective with the Delek/Alon Merger, our equity method interest in Alon prior to the Delek/Alon Merger, as well as our discontinued Paramount and Long Beach, California refineries and California renewable fuels facility operations (acquired as part of the Delek/Alon Merger - see Note 5 of the condensed consolidated financial statements in Item 1, Financial Statements for further discussion) and intercompany eliminations are reported in the corporate, other and eliminations segment. On March 16, 2018, Delek sold to World Energy, LLC (i) all of Delek’s membership interests in the California renewable fuels facility, (ii) certain refining assets and other related assets located in Paramount, California and (iii) certain associated tank farm and pipeline assets and other related assets located in California, as further discussed in Note 5 of the condensed consolidated financial statements in Item 1, Financial Statements. On May 21, 2018, Delek sold certain assets and operations of four asphalt terminals (included in Delek's corporate/other segment), as well as an equity method investment in an additional asphalt terminal, to an affiliate of Andeavor, as further discussed in Note 5.
In regards to the aforementioned asphalt operations, we currently own or operate asphalt terminals located in Big Spring,Texas; Richmond Beach, Washington; and Brownwood, Texas (the Brownwood terminal is 50% owned and recorded under the equity method of accounting). We purchase non-blended asphalt from third parties in addition to non-blended asphalt produced at the Big Spring refinery. We market asphalt through our terminals as blended and non-blended asphalt. Sales of asphalt are seasonal with the majority of sales occurring between May and October.
47
The refining segment processes crude oil and other purchased feedstocks for the manufacture of transportation motor fuels, including various grades of gasoline, diesel fuel, aviation fuel, asphalt and other petroleum-based products that are distributed through owned and third-party product terminals. Prior to the Delek/Alon Merger, the refining segment had a combined nameplate capacity of 155,000 bpd, including the 75,000 bpd Tyler, Texas refinery (the "Tyler refinery") and the 80,000 bpd El Dorado, Arkansas refinery (the "El Dorado refinery"). The refining segment also owns and operates two biodiesel facilities involved in the production of biodiesel fuels and related activities, located in Crossett, Arkansas and Cleburn, Texas. Effective with the Delek/Alon Merger, our refining segment now also includes the operations of our refinery located in Big Spring, Texas (the "Big Spring refinery") with a nameplate capacity of 73,000 bpd, a refinery located in Krotz Springs, Louisiana (the "Krotz Springs refinery") with a nameplate capacity of 74,000 bpd and a refinery located in Bakersfield, California. The Bakersfield, California refinery has not processed crude oil since 2012 due to the high cost of crude oil relative to product yield and low asphalt demand. Alon's petroleum-based products are marketed primarily in the south central, southwestern and western regions of the United States and also ships and sells gasoline into wholesale markets in the Southern and Eastern United States. Motor fuels are sold under the Alon brand through various terminals to supply Alon branded retail sites, including our retail segment convenience stores. In addition, Alon sells motor fuels through its wholesale distribution network on an unbranded basis.
Prior to February 7, 2018, we were the majority owner of the Big Spring refinery and its integrated wholesale marketing operations through Alon USA Partners, LP (the "Alon Partnership"). As discussed in Note 3 of the condensed consolidated financial statements in Item 1, Financial Statements, Delek acquired the outstanding limited partner units of the Alon Partnership which Delek did not already own in an all-equity transaction on February 7, 2018. Our marketing of transportation fuels produced at the Big Spring refinery is focused on central and west Texas, Oklahoma, New Mexico and Arizona. We provide substantially all of our branded customers motor fuels, brand support and payment processing services in addition to the license of the Alon brand name and associated trade dress. We market transportation fuel production from our Krotz Springs refinery substantially through bulk sales and exchange channels. These bulk sales and exchange arrangements are entered into with various oil companies and trading companies and are transported to markets on the Mississippi River and the Atchafalaya River, as well as to the Colonial Pipeline.
Our profitability in the refining segment is substantially determined by the difference between the cost of the crude oil feedstocks we purchase and the price of the refined products we sell, referred to as the "crack spread", "refining margin" or "refined product margin." The cost to acquire feedstocks and the price of the refined petroleum products we ultimately sell from our refineries depend on numerous factors beyond our control, including the supply of, and demand for, crude oil, gasoline and other refined petroleum products which, in turn, depend on, among other factors, changes in domestic and foreign economies, weather conditions such as hurricanes or tornadoes, local, domestic and foreign political affairs, global conflict, production levels, the availability of imports, the marketing of competitive fuels and government regulation. Other significant factors that influence our results in the refining segment include operating costs (particularly the cost of natural gas used for fuel and the cost of electricity), seasonal factors, refinery utilization rates and planned or unplanned maintenance activities or turnarounds. Moreover, while the fluctuations in the cost of crude oil are typically reflected in the prices of light refined products, such as gasoline and diesel fuel, the price of other residual products, such as asphalt, coke, carbon black oil and liquefied petroleum gas ("LPG"), are less likely to move in parallel with crude cost. This could cause additional pressure on our realized margin during periods of rising or falling crude oil prices. Additionally, our margins are impacted by the pricing differentials of the various types and sources of crude oil we use at our refineries and their relation to product pricing, such as the differentials between West Texas Intermediate ("WTI") Midland and WTI Cushing or WTI Midland and Brent crude oil.
With respect to measuring our refining margins at our refineries, we consider the following:
• | For our Tyler refinery, we compare our per barrel refined product margin to the U.S.Gulf Coast ("Gulf Coast") 5-3-2 crack spread. The Gulf Coast 5-3-2 crack spread is used as a benchmark for measuring a refinery's product margins by measuring the difference between the market price of light products and crude oil, and represents the approximate gross margin resulting from processing five barrels of crude oil into three barrels of gasoline and two barrels of high-sulfur diesel. We calculate the Gulf Coast 5-3-2 crack spread using the market values of Gulf Coast Pipeline CBOB and Gulf Coast Pipeline No. 2 Heating Oil (high-sulfur diesel) and the market value of WTI crude oil. Gulf Coast Pipeline CBOB and Gulf Coast Pipeline No. 2 Heating Oil are prices for which the products trade in the Gulf Coast Region. Gulf Coast Pipeline CBOB is a grade of gasoline commonly blended with biofuels and marketed as Regular Unleaded at retail locations. Gulf Coast Pipeline No. 2 Heating Oil is a petroleum distillate that can be used as either a diesel fuel or a fuel oil. This is the standard by which other distillate products (such as ultra-low sulfur diesel) are priced. |
• | For our Big Spring refinery, we compare our per barrel refined product margin to the Gulf Coast 3-2-1 crack spread. The Gulf Coast 3-2-1 crack spread is calculated assuming that three barrels of WTI Cushing crude oil are converted, or cracked, into two barrels of Gulf Coast conventional gasoline and one barrel of Gulf Coast ultra-low sulfur diesel. Our Big Spring refinery is capable of processing substantial volumes of sour crude oil, which has historically cost less than intermediate, and/or substantial volumes of sweet crude oils based on price differentials. |
• | For our Krotz Springs refinery, we compare our per barrel refined product margin to the Gulf Coast 2-1-1 high sulfur diesel crack spread. A Gulf Coast 2-1-1 high sulfur diesel crack spread is calculated assuming that two barrels of Light Louisiana Sweet (“LLS”) crude oil are converted into one barrel of Gulf Coast conventional gasoline and one barrel of Gulf Coast high sulfur diesel. The Krotz |
48
Springs refinery has the capability to process substantial volumes of sweet, crude oils to produce a high percentage of refined light products.
• | The crude oil and product slate flexibility of the El Dorado refinery allows us to take advantage of changes in the crude oil and product markets; therefore, we anticipate that the quantities and varieties of crude oil processed and products manufactured at the El Dorado refinery by processing a variety of feedstocks into a number of refined product types will continue to vary. Thus, we do not believe that it is possible to develop a reasonable refined product margin benchmark that would accurately portray our refined product margins at the El Dorado refinery. |
A widening of the WTI Cushing less WTI Midland spread will favorably influence the operating margin for our refineries. Alternatively, a narrowing of this differential will have an adverse effect on our operating margins. Global product prices are influenced by the price of Brent crude which is a global benchmark crude. Global product prices influence product prices in the U.S. As a result, our refineries are influenced by the spread between Brent crude and WTI Midland. The Brent less WTI Midland spread represents the differential between the average per barrel price of Brent crude oil and the average per barrel price of WTI Midland crude oil. A widening of the spread between Brent and WTI Midland will favorably influence our refineries' operating margins. Also, the Krotz Springs refinery is influenced by the spread between Brent crude and LLS. The Brent less LLS spread represents the differential between the average per barrel price of Brent crude oil and the average per barrel price of LLS crude oil. A discount in LLS relative to Brent will favorably influence the Krotz Springs refinery operating margin.
Our logistics segment owns and operates crude oil and refined products logistics and marketing assets. The logistics segment generates revenue by charging fees for gathering, transporting and storing crude oil and for marketing, distributing, transporting and storing intermediate and refined products in select regions of the southeastern United States and west Texas for our refining segment and third parties, and effective March 1, 2018, fees related to marketing certain finished products produced at or sold from the Big Spring refinery to various customers (see Note 3 of the condensed consolidated financial statements in Item 1, Financial Statements for further discussion regarding that new marketing agreement).
At June 30, 2018, we own a 61.4% limited partner interest in Delek Logistics Partners, LP ("Delek Logistics") and a 94.6% interest in the entity that owns the entire 2.0% general partner interest in Delek Logistics and all of the incentive distribution rights. Delek Logistics was formed by Delek in 2012 to own, operate, acquire and construct crude oil and refined products logistics and marketing assets. Delek Logistics' initial assets were contributed by us and included certain assets formerly owned or used by certain of our subsidiaries. A substantial majority of Delek Logistics' assets are currently integral to our refining and marketing operations.
The cost to acquire the refined fuel products we sell to our wholesale customers in our logistics segment and at our convenience stores in our retail segment depends on numerous factors beyond our control, including the supply of, and demand for, crude oil, gasoline and other refined petroleum products which, in turn, depend on, among other factors, changes in domestic and foreign economies, weather conditions, domestic and foreign political affairs, production levels, the availability of imports, the marketing of competitive fuels and government regulation. Our retail merchandise sales are driven by convenience, customer service, competitive pricing and branding. Motor fuel margin is sales less the delivered cost of fuel and motor fuel taxes, measured on a cents per gallon basis. Our motor fuel margins are impacted by local supply, demand, weather, competitor pricing and product brand.
As part of our overall business strategy, we regularly evaluate opportunities to expand our portfolio of businesses and may at any time be discussing or negotiating a transaction that, if consummated, could have a material effect on our business, financial condition, liquidity or results of operations.
Recent Developments
Return to Shareholders
Dividend Declaration
On May 7, 2018, Delek's Board of Directors voted to declare a quarterly cash dividend of $0.25 per share, payable on June 4, 2018, to stockholders of record on May 21, 2018. Our previous quarterly cash dividend amounts were $0.15 per share during 2017 and $0.20 for the first quarter of 2018.
Share Repurchase from Alon Israel/New Share Repurchase Program
On January 23, 2018, Delek repurchased 2.0 million shares of its common stock from Alon Israel in connection with Delek’s rights pursuant to a Stock Purchase Agreement dated April 14, 2015, by and between Delek and Alon Israel. Alon Israel delivered a right of first offer notice to Delek on January 16, 2018, informing Delek of Alon Israel’s intention to sell the 2.0 million shares, and Delek accepted such offer on January 17, 2018. The total purchase price was approximately $75.3 million, or $37.64 per share.
49
On February 26, 2018, the Board of Directors approved a new $150.0 million authorization to repurchase Delek common stock, which was announced on February 26, 2018. This amount has no expiration date and is in addition to any remaining amounts previously authorized. The aggregate authorization available as of June 30, 2018 was approximately $159.7 million.
Acquisition of Non-controlling Interest in Alon Partnership
On November 8, 2017, Delek and the Alon Partnership entered into a definitive merger agreement under which Delek agreed to acquire all of the outstanding limited partner units which Delek did not already own in an all-equity transaction. This transaction was approved by all voting members of the board of directors of the general partner of the Alon Partnership upon the recommendation from its conflicts committee and by the board of directors of Delek. This transaction closed on February 7, 2018 (the "Merger Date"). Delek owned approximately 51.0 million limited partner units of the Alon Partnership, or approximately 81.6% of the outstanding units immediately prior to the Merger Date. Under terms of the merger agreement, the owners of the remaining outstanding units in the Alon Partnership that Delek did not currently own immediately prior to the Merger Date received a fixed exchange ratio of 0.49 shares of New Delek common stock for each limited partner unit of the Alon Partnership, resulting in the issuance of approximately 5.6 million shares to the public unitholders of the Alon Partnership. The limited partner interests of the Alon Partnership prior to this acquisition were represented as common units outstanding. Because the transaction represented a combination of ownership interests under common control, the transfer of equity from non-controlling interest to owned interest was recorded at carrying value and no gain or loss was recognized in connection with the transaction.
Sale of Asphalt Assets
On February 12, 2018, Delek announced it had reached a definitive agreement to sell certain assets and operations of four asphalt terminals (included in Delek's corporate/other segment), as well as an equity method investment in an additional asphalt terminal, to an affiliate of Andeavor. This transaction includes asphalt terminal assets in Bakersfield, Mojave and Elk Grove, California and Phoenix, Arizona, as well as Delek’s 50 percent equity interest in the Paramount-Nevada Asphalt Company, LLC joint venture that operates an asphalt terminal located in Fernley, Nevada. On May 21, 2018, Delek completed the transaction and received net proceeds of approximately $110.8 million, inclusive of the $75.0 million base proceeds as well as certain preliminary working capital adjustments. The assets associated with the owned terminals met the definition of held for sale pursuant to ASC 360 as of February 1, 2018, but did not meet the definition of discontinued operations pursuant to ASC 205-20, as the sale of these asphalt assets does not represent a strategic shift that will have a major effect on the entity's operations and financial results. Accordingly, depreciation ceased as of February 1, 2018, and the associated assets to be sold were reclassified to assets held for sale as of that date and were written down to the estimated fair value less costs to sell, resulting in an impairment loss on assets held for sale of $27.5 million for the six months ended June 30, 2018 (none for the three months ended June 30, 2018). All goodwill associated with the asphalt operations sold was written off in connection with the impairment charge discussed above. In connection with the completion of the sale transaction, we recognized a gain of approximately $13.2 million, resulting from the recognition of certain additional proceeds at closing associated with the asphalt terminals which were not previously determinable/probable and the recognition of the gain on the sale of the joint venture which was not previously recognized as held for sale (as it did not meet the criteria). Such gain on sale of the asphalt assets is reflected in results of continuing operations on the accompanying consolidated income statement. None of these assets met the definition of held for sale pursuant to ASC 360 as of December 31, 2017, and therefore were not reflected as held for sale nor as discontinued operations in the consolidated financial statements as of and for the year ended December 31, 2017.
Transaction with Delek Logistics
In March 2018, a subsidiary of Delek Logistics completed the acquisition from the Alon Partnership of storage tanks and terminals that support our Big Spring Logistic Assets Acquisition (as defined in Note 3 to our accompanying condensed consolidated financial statements). In addition, a new marketing agreement was entered into between the subsidiary of Delek Logistics and the Alon Partnership pursuant to which the subsidiary of Delek Logistics will provide marketing services for product sales from the Big Spring refinery. The cash paid for the transferred assets was $170.8 million, subject to certain post-closing adjustments, and the cash paid for the marketing agreement was $144.2 million. The transactions were financed with borrowings under the DKL Revolver (as defined in Note 8 of the condensed consolidated financial statements in Item 1, Financial Statements).
RINs Waivers
In March 2018, the El Dorado and Krotz Springs refineries both received approval from the EPA for a small refinery exemption from the requirements of the renewable fuel standard for the 2017 calendar year, which resulted in a reduction of our RINs Obligation (as defined in Note 15 to our accompanying condensed consolidated financial statements) and related cost of goods sold of approximately $59.3 million and $31.6 million for the El Dorado and Krotz Springs refineries, respectively, for the six months ended June 30, 2018.
50
Delek Revolver and Term Loan
On March 30, 2018, (the "Closing Date"), Delek entered into (i) a new term loan credit agreement with Wells Fargo Bank, National Association, as administrative agent (the "Term Administrative Agent"), Delek, as borrower, and the lenders from time to time party thereto, providing for a senior secured term loan facility in an amount of $700 million (the "Term Loan Credit Facility") and (ii) a second amended and restated credit agreement with Wells Fargo Bank, National Association, as administrative agent (the "Revolver Administrative Agent"), Delek, as borrower, certain subsidiaries of Delek, as guarantors, and the other lenders party thereto, providing for a senior secured asset-based revolving credit facility with commitments of $1.0 billion (the "Revolving Credit Facility" and, together with the "Term Loan Credit Facility," the "New Credit Facilities") - see Note 8 of the condensed consolidated financial statements in Item 1, Financial Statements, for additional information. The Term Loan Credit Facility was drawn in full for $700.0 million on the Closing Date at an original issue discount of 0.50%. Proceeds under the Term Loan Credit Facility, as well as proceeds of approximately $300.0 million in borrowings under the Revolving Credit Facility on the Closing Date, were used to repay certain indebtedness of Delek and its subsidiaries (the “Refinancing”), as well as certain fees, costs and expenses in connection with the closing of the New Credit Facilities, with any remaining proceeds held in cash. Proceeds of future borrowings under the Revolving Credit Facility will be used for working capital and general corporate purposes of Delek and its subsidiaries. We recorded a loss on extinguishment of debt totaling approximately $9.0 million during the six months ended June 30, 2018 (none during the three months ended June 30, 2018) in connection with the Refinancing.
DKL Notes Offer to Exchange
On April 25, 2018, Delek Logistics made an offer to exchange the 2025 Notes and the related guarantees that were validly tendered and not validly withdrawn for an equal principal amount of exchange notes that are freely tradeable, as required under the terms of the original indenture (the “Exchange Offer”). The Exchange Offer expired on May 23, 2018 (the "Expiration Date"). The terms of the exchange notes that were issued as a result of the Exchange Offer are substantially identical to the terms of the original 2025 Notes.
Disposal of Certain Long Beach Assets
The transaction to dispose of certain assets and liabilities associated with our Long Beach, California refinery, which remained classified as held for sale and discontinued operations as of June 30, 2018, to Bridge Point Long Beach, LLC, closed July 17, 2018 resulting in initial cash proceeds of approximately $14.9 million.
Market Trends
Our results of operations are significantly affected by fluctuations in the prices of certain commodities, including, but not limited to, crude oil, gasoline, distillate fuel, biofuels and natural gas and electricity, among others. Historically, our profitability has been affected by commodity price volatility, specifically as it relates to the price of crude oil and refined products.
51
The table below reflects the quarterly high, low and average prices of WTI Cushing crude oil for each of the quarterly periods in 2017 and the six months ended June 30, 2018.
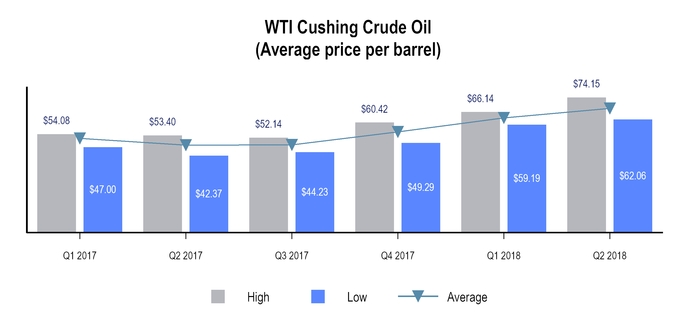
The table below reflects the quarterly high, low and average Gulf Coast 5-3-2 crack spread (Tyler benchmark) for each of the quarterly periods in 2017 and the six months ended June 30, 2018.
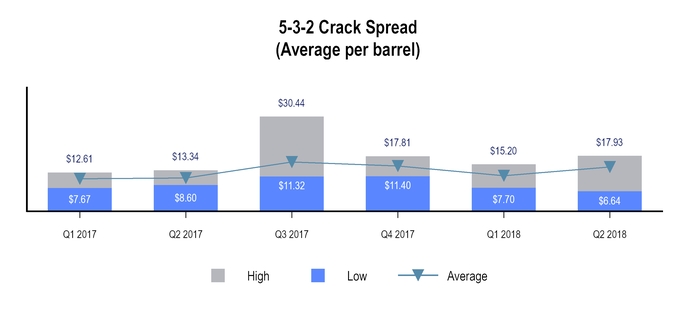
52
The table below reflects the quarterly high, low and average Gulf Coast 3-2-1 crack spread (Big Spring benchmark) for each of the quarterly periods in 2017 and the six months ended June 30, 2018, where we have owned the Big Spring refinery only since the Delek/Alon Merger.
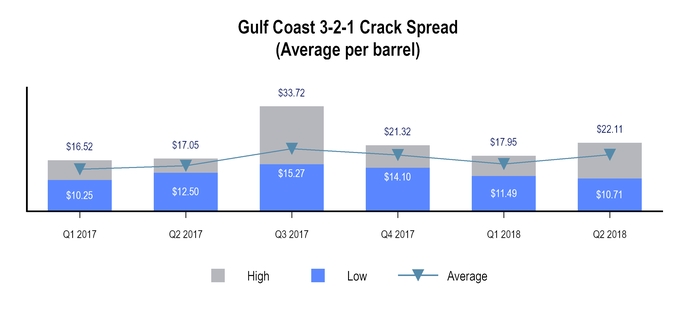
The table below reflects the quarterly high, low and average Gulf Coast 2-1-1 crack spread (Krotz Springs benchmark) for each of the quarterly periods in 2017 and the six months ended June 30, 2018, where we have owned the Krotz Springs refinery only since the Delek/Alon Merger.
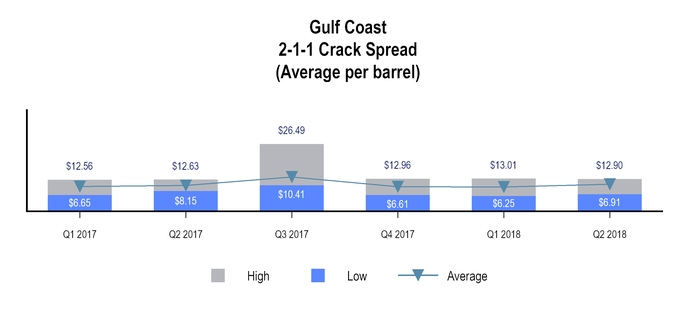
The market price of refined products contributed to the increase in the average Gulf Coast 5-3-2 crack spread to $12.99 during the first six months of 2018 from $10.72 during the first six months of 2017, with the Gulf Coast price of gasoline (CBOB) increasing 26.4%, from an average of $1.48 per gallon in the first six months of 2017 to $1.87 per gallon in the first six months of 2018 and the Gulf Coast price of High Sulfur Diesel increased 34.5%, from an average of $1.39 per gallon in the first six months of 2017 to $1.87 per gallon in the first six months of 2018. The charts below illustrate the quarterly high, low and average prices of Gulf Coast Gasoline, U.S. High Sulfur Diesel and Ultra Low Sulfur Diesel ("ULSD") for each of the quarterly periods in 2017 and the six months ended June 30, 2018.
53
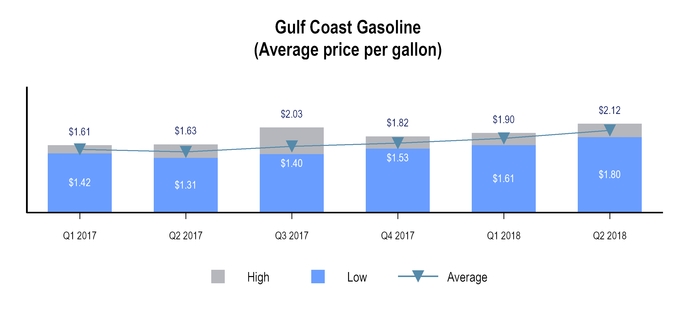
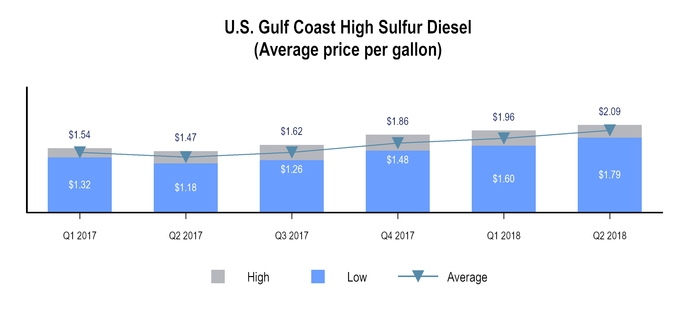
54
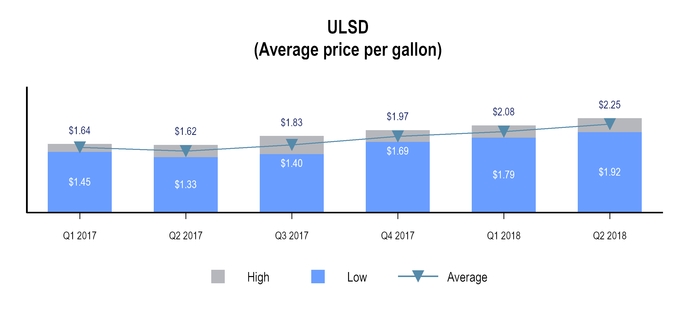
As US crude oil production has increased, we have seen the discount for WTI Cushing compared to Brent widen. This generally leads to higher margins in our refineries, as refined product prices are influenced by Brent crude prices and the majority of our crude supply is WTI-linked. The discount for WTI Cushing compared to Brent increased to $5.66 during the first six months of 2018 from $2.74 during the first six months of 2017. We note similar historical trends when reviewing the discount for WTI Cushing compared to LLS, where the discount increased to $3.99 during the first six months of 2018 from $1.88 during the first six months of 2017. Additionally, our refineries continue to have relatively greater access to WTI Midland and WTI Midland-linked crude feedstocks compared to certain of our competitors. The discount for WTI Midland compared to WTI Cushing increased to $4.33 during the first six months of 2018 from a discount of $0.40 during the first six months of 2017. As these price discounts increase, so does our competitive advantage, created by our access to WTI Midland-linked crude oil pricing. The chart below illustrates the differentials of both Brent crude oil and WTI Midland crude oil as compared to WTI Cushing crude oil for each of the quarterly periods in 2017 and the six months ended June 30, 2018.
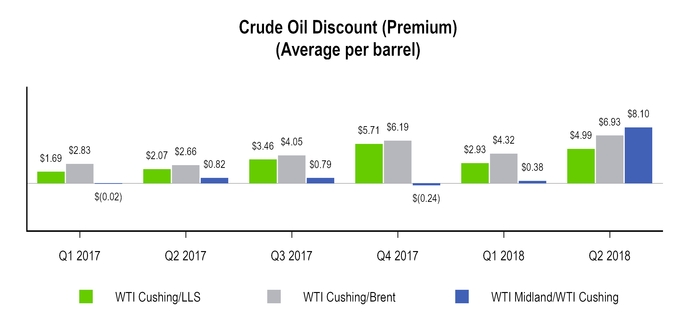
55
Environmental regulations continue to affect our margins in the form of the increasing cost of Renewable Identification Numbers ("RINs"). On a consolidated basis, we work to balance our RINs obligations in order to minimize the effect of RINs on our results. While we generate RINs in both our refining and logistics segments through our ethanol blending and biodiesel production, our refining segment needs to purchase additional RINs to satisfy its obligations. As a result, increases in the price of RINs generally adversely affect our results of operations. It is not possible at this time to predict with certainty what future volumes or costs may be, but given the volatile price of RINs, the cost of purchasing sufficient RINs could have an adverse impact on our results of operations if we are unable to recover those costs in the price of our refined products. The chart below illustrates the volatile nature of the price for RINs for each of the quarterly periods in 2017 and the six months ended June 30, 2018.
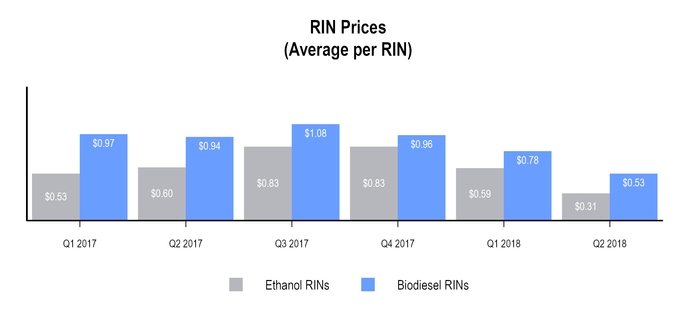
Seasonality
Refining Segment
Demand for gasoline and asphalt products is generally higher during the summer months than during the winter months due to seasonal increases in motor vehicle traffic and road and home construction. Varying vapor pressure requirements between the summer and winter months also tighten summer gasoline supply. In addition, our refining segment often performs planned maintenance during the winter, when demand for their products is lower. As a result, our operating results of our refining segment are generally lower for the first and fourth quarters of the calendar year.
Logistics Segment
The volume and throughput of crude oil and refined products transported through our pipelines and sold through our terminals and to third parties is directly affected by the level of supply and demand for all of such products in the markets served directly or indirectly by our assets. Supply and demand for such products fluctuates during the calendar year. Demand for gasoline, for example, is generally higher during the summer months than during the winter months due to seasonal increases in motor vehicle traffic. Varying vapor pressure requirements between the summer and winter months also tighten summer gasoline supply. In addition, our refining segment often performs planned maintenance during the winter, when demand for their products is lower. Accordingly, these factors can diminish the demand for crude oil or finished products by our customers, and therefore limit our volumes or throughput during these periods, and we expect that our operating results will generally be lower during the first and fourth quarters of the calendar year.
56
Retail Segment
Demand for gasoline and convenience store merchandise is generally higher during the summer months than during the winter months due to seasonal increases in motor vehicle traffic. As a result, the operating results of our retail segment are generally lower for the first quarter of the calendar year. Weather conditions in our operating area also have a significant effect on our operating results. Customers are more likely to purchase higher profit margin items at our retail fuel and convenience stores, such as fast foods, fountain drinks and other beverages and more gasoline during the spring and summer months. Unfavorable weather conditions during these months and a resulting lack of the expected seasonal upswings in traffic and sales could have a negative impact on our results of operations.
Contractual Obligations
There have been no material changes to our contractual obligations and commercial commitments during the six months ended June 30, 2018, from those disclosed in our Annual Report on Form 10-K, other than the refinancing of debt (as discussed in Note 8 to the financial statements).
Critical Accounting Policies
The preparation of our consolidated financial statements requires us to make estimates and judgments that affect the reported amounts of assets, liabilities, revenues and expenses and related disclosure of contingent assets and liabilities. The SEC has defined critical accounting policies as those that are both most important to the portrayal of our financial condition and results of operations, and require our most difficult, subjective or complex judgments or estimates. Based on this definition and as further described in our Annual Report on Form 10-K, we believe our critical accounting policies include the following: (i) determining our inventory using the last-in, first-out valuation method for the Tyler refinery, (ii) evaluating impairment for property, plant and equipment and definite life intangibles, (iii) valuing goodwill and evaluating potential impairment, and (iv) estimating environmental expenditures. For all financial statement periods presented, there have been no material modifications to the application of these critical accounting policies or estimates since our most recently filed Annual Report on Form 10-K. See Note 1 of the condensed consolidated financial statements in Item 1, Financial Statements for discussion of updates to our accounting policies.
57
Summary Financial and Other Information
The following table provides summary financial data for Delek (in millions, except share and per share data):
Three Months Ended | Six Months Ended | |||||||||||||||
Statement of Operations Data | June 30, | June 30, | ||||||||||||||
2018 | 2017 | 2018 | 2017 | |||||||||||||
Net revenues: | ||||||||||||||||
Refining(1) | $ | 2,469.8 | $ | 1,153.0 | $ | 4,595.7 | $ | 2,252.5 | ||||||||
Logistics | 166.3 | 126.7 | 334.2 | 256.2 | ||||||||||||
Retail | 244.8 | — | 454.4 | — | ||||||||||||
Other(1) | (317.4 | ) | (49.0 | ) | (467.6 | ) | (95.9 | ) | ||||||||
Net revenues | $ | 2,563.5 | $ | 1,230.7 | $ | 4,916.7 | $ | 2,412.8 | ||||||||
Operating costs and expenses: | ||||||||||||||||
Cost of goods sold | 2,176.8 | 1,157.8 | 4,219.6 | 2,193.5 | ||||||||||||
Operating expenses | 157.5 | 62.1 | 315.6 | 123.3 | ||||||||||||
General and administrative expenses | 52.9 | 27.5 | 118.1 | 54.0 | ||||||||||||
Depreciation and amortization | 49.2 | 29.5 | 97.2 | 58.5 | ||||||||||||
Other operating (income) expense, net | (8.0 | ) | 0.3 | (7.7 | ) | 0.3 | ||||||||||
Total operating costs and expenses | 2,428.4 | 1,277.2 | 4,742.8 | 2,429.6 | ||||||||||||
Operating income (loss) | 135.1 | (46.5 | ) | 173.9 | (16.8 | ) | ||||||||||
Interest expense | 31.5 | 14.9 | 64.0 | 28.4 | ||||||||||||
Interest income | (0.9 | ) | (0.8 | ) | (1.6 | ) | (1.8 | ) | ||||||||
Income from equity method investments | (2.9 | ) | (1.5 | ) | (2.9 | ) | (4.6 | ) | ||||||||
Gain on sale of business | (13.2 | ) | — | (13.2 | ) | — | ||||||||||
Impairment loss on assets held for sale | — | — | 27.5 | — | ||||||||||||
Loss on extinguishment of debt | — | — | 9.0 | — | ||||||||||||
Other expense (income), net | 0.3 | 0.1 | (0.4 | ) | 0.1 | |||||||||||
Total non-operating expenses, net | 14.8 | 12.7 | 82.4 | 22.1 | ||||||||||||
Income (loss) from continuing operations before income tax expense (benefit) | 120.3 | (59.2 | ) | 91.5 | (38.9 | ) | ||||||||||
Income tax expense (benefit) | 32.8 | (27.0 | ) | 15.8 | (22.0 | ) | ||||||||||
Income (loss) from continuing operations, net of tax | 87.5 | (32.2 | ) | 75.7 | (16.9 | ) | ||||||||||
Loss from discontinued operations, net of tax | (0.8 | ) | — | (9.0 | ) | — | ||||||||||
Net income (loss) | 86.7 | (32.2 | ) | 66.7 | (16.9 | ) | ||||||||||
Net income attributed to non-controlling interests | 7.6 | 5.7 | 22.5 | 9.8 | ||||||||||||
Net income (loss) attributable to Delek | $ | 79.1 | $ | (37.9 | ) | $ | 44.2 | $ | (26.7 | ) | ||||||
Basic income (loss) per share: | ||||||||||||||||
Income (loss) from continuing operations | $ | 0.95 | $ | (0.61 | ) | $ | 0.74 | $ | (0.43 | ) | ||||||
Loss from discontinued operations | (0.01 | ) | — | (0.21 | ) | — | ||||||||||
Total basic income (loss) per share | $ | 0.94 | $ | (0.61 | ) | $ | 0.53 | $ | (0.43 | ) | ||||||
Diluted income (loss) per share: | ||||||||||||||||
Income (loss) from continuing operations | $ | 0.90 | $ | (0.61 | ) | $ | 0.71 | $ | (0.43 | ) | ||||||
Loss from discontinued operations | (0.01 | ) | — | (0.20 | ) | — | ||||||||||
Total diluted income (loss) per share | $ | 0.89 | $ | (0.61 | ) | $ | 0.51 | $ | (0.43 | ) | ||||||
(1)The corporate, other and eliminations segment results of operations for the six months ended June 30, 2018 includes Canada trading activity which was previously included and reported in the refining segment for the three months ended March 31, 2018.
58
Results of Operations
Consolidated Results of Operations — Comparison of the Three Months Ended June 30, 2018 versus the Three Months Ended June 30, 2017
Net Income (Loss)
Consolidated net income for the second quarter of 2018 was $86.7 million compared to net loss of $32.2 million for the second quarter of 2017. Consolidated net income attributable to Delek for the second quarter of 2018 was $79.1 million, or $0.94 per basic share, compared to net loss attributable to Delek of $37.9 million, or $(0.61) per basic share, for the second quarter of 2017.
Net Revenues
In the second quarters of 2018 and 2017, we generated net revenues of $2,563.5 million and $1,230.7 million, respectively, an increase of $1,332.8 million, or 108.3%. The increase in net revenues was primarily due to the addition of Alon financial results as a result of the Delek/Alon Merger, which contributed net revenues of $833.5 million during the second quarter of 2018, and the effects of increases in the price of finished petroleum products at our refineries (including a 32.9% increase in average price of gasoline per gallon and a 43.5% increase in average price of ULSD per gallon), combined with increases in sales volume in our refining and logistics segments during the second quarter of 2018, compared to the second quarter of 2017.
Cost of Goods Sold
Cost of goods sold was $2,176.8 million for the second quarter of 2018 compared to $1,157.8 million for the second quarter of 2017, an increase of $1,019.0 million, or 88.0%. The increase in cost of goods sold primarily related to the addition of Alon financial results as a result of the Delek/Alon Merger, which contributed cost of goods sold of $614.5 million during the second quarter of 2018, and the increase in the cost of both crude oil feedstocks at the refineries and refined products in the logistics segment, as well as increases in sales volumes in our refining and logistics segments.
Operating Expenses
Operating expenses were $157.5 million for the second quarter of 2018 compared to $62.1 million for the second quarter of 2017, an increase of $95.4 million, or 153.6%. The increase in operating expenses was primarily due to the addition of Alon financial results as a result of the Delek/Alon Merger, which contributed operating expenses of $82.4 million during the second quarter of 2018.
General and Administrative Expenses
General and administrative expenses were $52.9 million for the second quarter of 2018 compared to $27.5 million for the second quarter of 2017, an increase of $25.4 million, or 92.4%. The increase was primarily due to the addition of Alon financial results as a result of the Delek/Alon Merger, which contributed general and administrative expenses of $17.2 million during the second quarter
of 2018. Additionally, we had a $4.6 million increase in outside services, $2.7 million higher employee related expenses (primarily due to headcount) and $1.8 million of increased legal expense. These expenses were partially offset by a $2.2 million decrease in transaction costs.
Depreciation and Amortization
Depreciation and amortization was $49.2 million for the second quarter of 2018 compared to $29.5 million for the second quarter of 2017, an increase of $19.7 million, or 66.8%. The increase in depreciation expense was primarily attributable to the addition of Alon property, plant and equipment of $1,130.3 million and the addition of amortizable intangibles of $56.2 million as a result of the Delek/Alon Merger, combined with the addition of other capital expenditures and acquisitions (net of disposals) completed to date in 2018 as compared to 2017. The acquisition of Alon contributed $18.8 million in additional depreciation and amortization during the second quarter of 2018.
Other Operating (Income) Expense, Net
Other operating income was $8.0 million for the second quarter of 2018 compared to expense of $0.3 million for the second quarter of 2017, an increase of $8.3 million. This increase was primarily due to net gains associated with our crude trading operations in the second quarter of 2018.
Interest Expense
Interest expense was $31.5 million for the second quarter of 2018 compared to $14.9 million for the second quarter of 2017, an increase of $16.6 million, or 111.4%. The increase was primarily attributable to the addition of assumed debt totaling $568.0 million (at fair value) in connection with the Delek/Alon Merger, all of which was paid off and refinanced as part of the March 30, 2018 Refinancing except for $150.0 million of convertible senior notes, as well as increases in LIBOR interest rates under our credit facilities.
Results from Equity Method Investments
We recognized income of $2.9 million from equity method investments during the second quarter of 2018, compared to income of $1.5 million for the second quarter of 2017, an increase of $1.4 million. This increase is partially attributable to the the addition of equity method investments owned by Alon as a result of the Delek/Alon Merger, which contributed $1.0 million during the second quarter of 2018. Additionally, our proportionate share of net income from our logistics joint ventures increased from $0.8 during the second quarter of 2017, to $1.9 million for the second quarter of 2018. These increases were offset by the fact that we did not have an equity method investment in Alon during the second quarter of 2018.
59
Other Non-operating Expenses, Net
During the second quarter of 2018, we recognized a gain totaling $13.2 million on the sale of certain asphalt assets which was not present during the three months ended June 30, 2017. See Note 5 of the condensed consolidated financial statements in Item 1, Financial Statements, for additional information.
Income Taxes
Under ASC 740, Income Taxes (“ASC 740”), companies are required to apply an estimated annual tax rate to interim period results on a year-to-date basis; however, the estimated annual tax rate should not be applied to interim financial results if a reliable estimate cannot be made. In this situation, the interim tax rate should be based on actual year-to-date results. We used an estimated annual tax rate to record income taxes for the three months ended June 30, 2018, and an actual year-to-date effective tax rate to record income taxes for the three months ended June 30, 2017.
We have accounted for the effects of the comprehensive tax legislation commonly referred to as the Tax Cuts and Jobs Act (the "Tax Reform Act"), using reasonable estimates based on currently available information and our interpretations of the Tax Reform Act. The estimated impact of the Tax Reform Act during the three months ended June 30, 2018 may differ from the final accounting as supplemental legislation, regulatory guidance or evolving technical interpretations become available. These changes could be material to income tax expense.
Income tax expense was $32.8 million for the second quarter of 2018, compared to a benefit of $27.0 million for the second quarter of 2017, an increase in expense of $59.8 million. The increase in expense was primarily attributable to pre-tax income of $120.3 million in the second quarter of 2018, as compared to pre-tax loss of $59.2 million for the second quarter of 2017, offset by the decrease in our effective tax rate which was largely attributable to the enactment of the Tax Reform Act. Our effective tax rate was 27.3% for the second quarter of 2018, compared to 45.6% for the second quarter of 2017. The change in our effective tax rate was primarily due to the decrease in Federal income tax rate attributable to continued adjustments to properly consider the impact of the Tax Reform Act (which reduced the US federal corporate tax rate from 35% to 21%) on previously recorded deferred taxes.
Consolidated Results of Operations — Comparison of the Six Months Ended June 30, 2018 versus the Six Months Ended June 30, 2017
Net Income (Loss)
Consolidated net income for the six months ended June 30, 2018 was $66.7 million compared to net loss of $16.9 million for the six months ended June 30, 2017. Consolidated net income attributable to Delek for the six months ended June 30, 2018 was $44.2 million, or $0.53 per basic share, compared to net loss attributable to Delek of $26.7 million, or $(0.43) per basic share, for the six months ended June 30, 2017.
Net Revenues
For the six months ended June 30, 2018 and 2017, we generated net revenues of $4,916.7 million and $2,412.8 million, respectively, an increase of $2,503.9 million, or 103.8%. The increase in net revenues was primarily due to the addition of Alon financial results as a result of the Delek/Alon Merger, which contributed net revenues of $1,580.2 million during the six months ended June 30, 2018, and the effects of increases in the price of finished petroleum products at our refineries (including a 25.5% increase in average price of gasoline per gallon and a 32.9% increase in average price of ULSD per gallon), combined with increases in sales volumes in our refining and logistics segments during the six months ended June 30, 2018, compared to the same period in 2017.
Cost of Goods Sold
Cost of goods sold was $4,219.6 million for the six months ended June 30, 2018, compared to $2,193.5 million for the six months ended June 30, 2017, an increase of $2,026.1 million, or 92.4%. The increase in cost of goods sold primarily related to the addition of Alon financial results as a result of the Delek/Alon Merger, which contributed cost of goods sold of $1,224.6 million during the six months ended June 30, 2018, and the increase in the cost of both crude oil feedstocks at the refineries and refined products in the logistics segment, as well as increases in sales volumes in our refining and logistics segments. In both March 2018 and March 2017, the El Dorado refinery received approval from the EPA for a small refinery exemption from the requirements of the renewable fuel standard for the 2017 and 2016 calendar years, respectively, which resulted in a reduction of our RINs Obligation and the related cost of goods sold of approximately $59.3 million and $47.5 million for the six months ended June 30, 2018 and June 30, 2017, respectively. In March 2018, the Krotz Springs refinery received such approval as well, which resulted in a further reduction of our RINs Obligation and related cost of goods sold of approximately $31.6 million for the six months ended June 30, 2018.
Operating Expenses
Operating expenses were $315.6 million for the six months ended June 30, 2018 compared to $123.3 million for the six months ended June 30, 2017, an increase of $192.3 million, or 156.0%. The increase in operating expenses was primarily due to the addition of Alon financial results as a result of the Delek/Alon Merger, which contributed operating expenses of $170.1 million during the six months ended June 30, 2018.
General and Administrative Expenses
General and administrative expenses were $118.1 million and $54.0 million for the six months ended June 30, 2018 and 2017, respectively, an increase of $64.1 million, or 118.7%. The increase was primarily due to the addition of Alon as a result of the Delek/Alon Merger, which contributed general and administrative expenses of $36.8 million and $2.5 million of transaction costs during the six months ended June 30, 2018. Additionally contributing to the increase was a $12.7 million increase in employee related costs, as well as increases in legal and audit fees.
60
Depreciation and Amortization
Depreciation and amortization was $97.2 million compared to $58.5 million for the six months ended June 30, 2018 and 2017, respectively, an increase of $38.7 million, or 66.2%. The increase in depreciation expense was primarily attributable to the addition of Alon property, plant and equipment of $1,130.3 million and the addition of amortizable intangibles of $56.2 million as a result of the Delek/Alon Merger, combined with the addition of other capital expenditures and acquisitions (net of disposals) completed to date in 2018 as compared to 2017. The acquisition of Alon contributed $38.1 million in additional depreciation and amortization during the six months ended June 30, 2018.
Interest Expense
Interest expense was $64.0 million compared to $28.4 million for the six months ended June 30, 2018 and 2017, respectively, an increase of $35.6 million, or 125.4%. The increase was primarily attributable to the addition of assumed debt totaling $568.0 million (at fair value) in connection with the Delek/Alon Merger during the first six months of 2018 (all of which was paid off and refinanced as part of the March 30, 2018 Refinancing except for $150.0 million of convertible senior notes), as well as increases in LIBOR interest rates under our credit facilities.
Results from Equity Method Investments
During the six months ended June 30, 2018, we recognized income from equity method investments of $2.9 million, compared to income of $4.6 million for the six months ended June 30, 2017. Changes in the results from equity method investments for the six months ended June 30, 2018 were primarily attributable to the fact that we did not have an equity method investment in Alon during the six months ended June 30, 2018. We recognized our proportionate share of the net income from our investment in Alon of $4.5 million, net of $1.3 million in amortization of the excess of our investment over our equity in the underlying net assets of Alon for the six months ended June 30, 2017.
Other Non-operating Expenses, Net
During the six months ended June 30, 2018, we incurred certain infrequently occurring expenses/charges that were not incurred during the six months ended June 30, 2017. These included a $9.0 million loss on extinguishment of debt related to the Refinancing and an impairment loss on assets held for sale totaling approximately $27.5 million related to the asphalt assets held for sale. These charges were partially offset by a realized gain on the sale of certain asphalt assets totaling $13.2 million, including a gain on the sale of an asphalt equity method investment that was not previously included in assets held for sale (because it did not meet the criteria). See Notes 5 and 8 of the condensed consolidated financial statements in Item 1, Financial Statements, for additional information.
Income Taxes
Under ASC 740, companies are required to apply an estimated annual tax rate to interim period results on a year-to-date basis; however, the estimated annual tax rate should not be applied to interim financial results if a reliable estimate cannot be made. In this situation, the interim tax rate should be based on actual year-to-date results. We used an estimated annual tax rate to record income taxes for the six months ended June 30, 2018, and an actual year-to-date effective tax rate to record income taxes for the six months ended June 30, 2017.
We have accounted for the effects of the Tax Reform Act, using reasonable estimates based on currently available information and our interpretations of the Tax Reform Act. The estimated impact of the Tax Reform Act during the six months ended June 30, 2018 may differ from the final accounting as supplemental legislation, regulatory guidance or evolving technical interpretations become available. These changes could be material to income tax expense.
Income tax expense was $15.8 million for the six months ended June 30, 2018, compared to income tax benefit of $22.0 million for the six months ended June 30, 2017, an increase in expense of $37.8 million. The increase in expense was primarily attributable to pre-tax income of $91.5 million compared to pre-tax loss of $38.9 million for the six months ended June 30, 2018 and 2017, respectively, offset by the decrease in our effective tax rate which was largely attributable to the enactment of the Tax Reform Act. Our effective tax rate was 17.3% compared to 56.6% for the for the six months ended June 30, 2018 and 2017, respectively. The change in our effective tax rate was primarily due to the following: decrease in Federal income tax rate attributable to continued adjustments to properly consider the impact of the Tax Reform Act (which reduced the US federal corporate tax rate from 35% to 21%) on previously recorded deferred taxes, combined with income tax benefit for federal tax credits attributable to the Company’s biodiesel blending operations for 2017, partially offset by tax expense associated with the impairment of assets held for sale.
61
Operating Segments
We report operating results in three reportable segments: refining, logistics and retail. Decisions concerning the allocation of resources and assessment of operating performance are made based on this segmentation. Management measures the operating performance of each of its reportable segments based on the segment contribution margin.
Refining Segment
The tables and charts below set forth certain information concerning our refining segment operations ($ in millions, except per barrel amounts):
Three Months Ended June 30, | Six Months Ended June 30, | |||||||||||||||
2018 | 2017 | 2018 | 2017 | |||||||||||||
Net revenues | $ | 2,469.8 | $ | 1,153.0 | $ | 4,595.7 | $ | 2,252.5 | ||||||||
Cost of goods sold | 2,179.6 | 1,084.5 | 4,057.5 | 2,065.3 | ||||||||||||
Gross margin | 290.2 | 68.5 | 538.2 | 187.2 | ||||||||||||
Operating expenses | 113.2 | 51.6 | 227.9 | 102.4 | ||||||||||||
Contribution margin | $ | 177.0 | $ | 16.9 | $ | 310.3 | $ | 84.8 | ||||||||
(1) | The net revenues, cost of goods sold and gross margin for the six months ended June 30, 2018 excludes Canada trading activity which was previously included and reported in the refining segment for the three months ended March 31, 2018. |
62
Refining Segment | Three Months Ended June 30, | Six Months Ended June 30, | ||||||||||||||
2018 | 2017 | 2018 | 2017 | |||||||||||||
Tyler, TX Refinery | (Unaudited) | (Unaudited) | ||||||||||||||
Days in period | 91 | 91 | 181 | 181 | ||||||||||||
Total sales volume (average barrels per day)(1) | 81,088 | 79,404 | 77,555 | 71,906 | ||||||||||||
Products manufactured (average barrels per day): | ||||||||||||||||
Gasoline | 42,918 | 41,817 | 41,800 | 37,955 | ||||||||||||
Diesel/Jet | 32,899 | 30,810 | 30,275 | 27,767 | ||||||||||||
Petrochemicals, LPG, NGLs | 2,877 | 3,316 | 2,479 | 2,676 | ||||||||||||
Other | 1,742 | 1,678 | 1,756 | 1,613 | ||||||||||||
Total production | 80,436 | 77,621 | 76,310 | 70,011 | ||||||||||||
Throughput (average barrels per day): | ||||||||||||||||
Crude Oil | 75,272 | 73,047 | 70,305 | 65,120 | ||||||||||||
Other feedstocks | 5,902 | 5,298 | 6,537 | 5,656 | ||||||||||||
Total throughput | 81,174 | 78,345 | 76,842 | 70,776 | ||||||||||||
Per barrel of sales: | ||||||||||||||||
Tyler refining margin | $ | 11.90 | $ | 5.04 | $ | 10.21 | $ | 5.17 | ||||||||
Direct operating expenses | $ | 3.38 | $ | 3.37 | $ | 3.40 | $ | 3.75 | ||||||||
Crude Slate: (% based on amount received in period) | ||||||||||||||||
WTI crude oil | 77.5 | % | 77.7 | % | 79.2 | % | 78.7 | % | ||||||||
East Texas crude oil | 21.0 | % | 18.2 | % | 18.8 | % | 19.3 | % | ||||||||
Other | 1.5 | % | 4.1 | % | 2.0 | % | 2.0 | % | ||||||||
El Dorado, AR Refinery | ||||||||||||||||
Days in period | 91 | 91 | 181 | 181 | ||||||||||||
Total sales volume (average barrels per day)(2) | 76,353 | 76,826 | 73,488 | 80,190 | ||||||||||||
Products manufactured (average barrels per day): | ||||||||||||||||
Gasoline | 36,285 | 36,446 | 35,689 | 38,151 | ||||||||||||
Diesel | 25,256 | 27,396 | 25,773 | 26,744 | ||||||||||||
Petrochemicals, LPG, NGLs | 1,236 | 1,751 | 1,350 | 1,703 | ||||||||||||
Asphalt | 4,662 | 7,205 | 4,895 | 6,635 | ||||||||||||
Other | 785 | 1,014 | 812 | 1,001 | ||||||||||||
Total production | 68,224 | 73,812 | 68,519 | 74,234 | ||||||||||||
Throughput (average barrels per day): | ||||||||||||||||
Crude Oil | 68,685 | 74,342 | 68,559 | 73,775 | ||||||||||||
Other feedstocks | 1,175 | 612 | 1,475 | 1,488 | ||||||||||||
Total throughput | 69,860 | 74,954 | 70,034 | 75,263 | ||||||||||||
Per barrel of sales: | ||||||||||||||||
El Dorado refining margin | $ | 4.74 | $ | 4.44 | $ | 8.73 | $ | 8.19 | ||||||||
Direct operating expenses | $ | 4.84 | $ | 3.76 | $ | 4.99 | $ | 3.53 | ||||||||
Crude Slate: (% based on amount received in period) | ||||||||||||||||
WTI crude oil | 68.0 | % | 58.7 | % | 65.1 | % | 63.9 | % | ||||||||
Local Arkansas crude oil | 21.0 | % | 18.9 | % | 20.7 | % | 18.8 | % | ||||||||
Other | 11.0 | % | 22.4 | % | 14.2 | % | 17.3 | % | ||||||||
63
Refining Segment (continued) | Three Months Ended June 30, | Six Months Ended June 30, | ||||||
2018 | 2018 | |||||||
Big Spring, TX Refinery (acquired on July 1, 2017) | (Unaudited) | (Unaudited) | ||||||
Days in period | 91 | 181 | ||||||
Total sales volume (average barrels per day) (3) | 77,005 | 69,928 | ||||||
Products manufactured (average barrels per day): | ||||||||
Gasoline | 36,009 | 33,581 | ||||||
Diesel/Jet | 29,266 | 24,180 | ||||||
Petrochemicals, LPG, NGLs | 3,834 | 3,431 | ||||||
Asphalt | 1,856 | 1,856 | ||||||
Other | 1,476 | 1,295 | ||||||
Total production | 72,441 | 64,343 | ||||||
Throughput (average barrels per day): | ||||||||
Crude oil | 72,013 | 62,936 | ||||||
Other feedstocks | 171 | 1,007 | ||||||
Total throughput | 72,184 | 63,943 | ||||||
Per barrel of sales: | ||||||||
Big Spring refining margin | $ | 16.88 | $ | 13.62 | ||||
Direct operating expenses | $ | 3.57 | $ | 4.31 | ||||
Crude Slate: (% based on amount received in period) | ||||||||
WTI crude oil | 72.0 | % | 71.2 | % | ||||
WTS crude oil | 28.0 | % | 28.8 | % | ||||
Krotz Springs, LA Refinery (acquired on July 1, 2017) | ||||||||
Days in period | 91 | 181 | ||||||
Total sales volume (average barrels per day) (4) | 76,789 | 78,335 | ||||||
Products manufactured (average barrels per day): | ||||||||
Gasoline | 35,976 | 37,515 | ||||||
Diesel/Jet | 32,008 | 31,534 | ||||||
Heavy Oils | 1,362 | 1,350 | ||||||
Other | 7,295 | 7,522 | ||||||
Total production | 76,641 | 77,921 | ||||||
Throughput (average barrels per day): | ||||||||
Crude Oil | 74,625 | 74,256 | ||||||
Other feedstocks | 997 | 2,406 | ||||||
Total throughput | 75,622 | 76,662 | ||||||
Per barrel of sales: | ||||||||
Krotz Springs refining margin | $ | 8.82 | $ | 7.86 | ||||
Direct operating expenses | $ | 3.87 | $ | 3.72 | ||||
Crude Slate: (% based on amount received in period) | ||||||||
WTI Crude | 54.9 | % | 57.2 | % | ||||
Gulf Coast Sweet Crude | 45.1 | % | 42.8 | % | ||||
64
Pricing statistics (average for the period presented): | Three Months Ended June 30, | Six Months Ended June 30, | ||||||||||||||
2018 | 2017 | 2018 | 2017 | |||||||||||||
(Unaudited) | (Unaudited) | |||||||||||||||
WTI — Cushing crude oil (per barrel) | $ | 68.03 | $ | 48.11 | $ | 65.52 | $ | 49.89 | ||||||||
WTI — Midland crude oil (per barrel) | $ | 59.93 | $ | 47.29 | $ | 61.19 | $ | 49.49 | ||||||||
WTS -- Midland crude oil (per barrel) (5) | $ | 59.53 | $ | 47.05 | $ | 60.47 | $ | 48.65 | ||||||||
LLS (per barrel) (5) | $ | 73.02 | $ | 50.18 | $ | 69.51 | $ | 51.77 | ||||||||
Brent crude oil (per barrel) | $ | 74.96 | $ | 50.77 | $ | 71.18 | $ | 52.63 | ||||||||
US Gulf Coast 5-3-2 crack spread (per barrel) (5) | $ | 14.37 | $ | 10.86 | $ | 12.99 | $ | 10.72 | ||||||||
US Gulf Coast 3-2-1 crack spread (per barrel) (5) | $ | 18.26 | $ | 14.78 | $ | 16.82 | $ | 14.20 | ||||||||
US Gulf Coast 2-1-1 crack spread (per barrel) (5) | $ | 10.83 | $ | 10.33 | $ | 10.29 | $ | 10.13 | ||||||||
US Gulf Coast Unleaded Gasoline (per gallon) | $ | 1.96 | $ | 1.45 | $ | 1.87 | $ | 1.48 | ||||||||
Gulf Coast Ultra low sulfur diesel (per gallon) | $ | 2.11 | $ | 1.47 | $ | 2.02 | $ | 1.52 | ||||||||
US Gulf Coast high sulfur diesel (per gallon) | $ | 1.96 | $ | 1.33 | $ | 1.87 | $ | 1.39 | ||||||||
Natural gas (per MMBTU) | $ | 2.83 | $ | 3.14 | $ | 2.84 | $ | 3.10 | ||||||||
(1) | Total sales volume includes 267 and 917 bpd sold to the logistics segment during the three and six months ended June 30, 2018, respectively, and 743 and 842 during the three and six months ended June 30, 2017, respectively. Total sales volume also includes sales of 109 and 120 bpd of intermediate and finished products to the El Dorado refinery during the three and six months ended June 30, 2018, respectively, and 1 and 5 bpd during the three and six months ended June 30, 2017, respectively. Total sales volume also includes 428 and 459 bpd of produced finished product sold to the Big Spring refinery and 0 and 118 bpd sold to the Krotz Springs refinery during the three and six months ended June 30, 2018, respectively. Total sales volume excludes 4,729 and 4,603 bpd of wholesale activity during the three and six months ended June 30, 2018, respectively, and 4,177 and 5,297 of wholesale activity during the three and six months ended June 30, 2017, respectively. |
(2) | Total sales volume includes 985 and 515 bpd of produced finished product sold to the Tyler refinery during the three and six months ended June 30, 2018, respectively, and 525 and 787 bpd during the three and six months ended June 30, 2017, respectively; 21,648 and 11,407 bpd of produced finished product sold to the Krotz Springs refinery during the three and six months ended June 30, 2018, respectively; 302 and 566 bpd of produced finished product sold to the Big Spring refinery during the three and six months ended June 30, 2018, respectively; and 220 and 123 bpd of produced finished product sold to Alon Asphalt Company during the three and six months ended June 30, 2018, respectively. Total sales volume excludes 48,287 and 50,709 bpd of wholesale activity during the three and six months ended June 30, 2018, respectively, and 19,219 and 18,880 bpd of wholesale activity during the three and six months ended June 30, 2017, respectively. |
(3) | Total sales volume includes 13,838 and 14,026 bpd sold to the retail segment, 3,158 and 4,237 bpd sold to the logistics segment and 1,895 and 1,522 bpd sold to Alon Asphalt Company during the three and six months ended June 30, 2018, respectively. |
(4) | Sales volume includes 39,398 and 29,130 bpd sold to the El Dorado refinery and 0 and 110 bpd sold to the Tyler refinery during the three and six months ended June 30, 2018, respectively. |
(5) | For our Tyler and El Dorado refineries, we compare our per barrel refining product margin to the Gulf Coast 5-3-2 crack spread consisting of WTI Cushing crude, U.S. Gulf Coast CBOB and U.S, Gulf Coast Pipeline No. 2 heating oil (high sulfur diesel). For our Big Spring refinery, we compare our per barrel refined product margin to the Gulf Coast 3-2-1 crack spread consisting of WTI Cushing crude, Gulf Coast 87 Conventional gasoline and Gulf Coast ultra low sulfur diesel, and for our Krotz Springs refinery, we compare our per barrel refined product margin to the Gulf Coast 2-1-1 crack spread consisting of LLS crude oil, Gulf Coast 87 Conventional gasoline and U.S, Gulf Coast Pipeline No. 2 heating oil (high sulfur diesel). The Tyler refinery's crude oil input is primarily WTI Midland and east Texas, while the El Dorado refinery's crude input is primarily combination of WTI Midland, local Arkansas and other domestic inland crude oil. The Big Spring refinery’s crude oil input is primarily comprised of WTS and WTI Midland. The Krotz Springs refinery’s crude oil input is primarily comprised of LLS and WTI Midland. The Big Spring and Krotz Springs refineries were acquired July 1, 2017 as part of the Delek/Alon Merger, so Gulf Coast 3-2-1 and 2-1-1 crack spreads, LLS and WTS statistics are presented only for the period Delek owned these refineries. |
65
Refining Segment Operational Comparison of the Three Months Ended June 30, 2018 versus the Three Months Ended June 30, 2017
Net Revenues

Net revenues for the refining segment were $2,469.8 million for the second quarter of 2018 compared to $1,153.0 million for the second quarter of 2017, an increase of $1,316.8 million, or 114.2%. The increase in net revenues primarily resulted from the addition of the Big Spring and Krotz Springs refineries in connection with the Delek/Alon Merger, as well as increases in the price of U.S. Gulf Coast gasoline, ULSD, and High-Sulfur diesel ("HSD").
Cost of Goods Sold
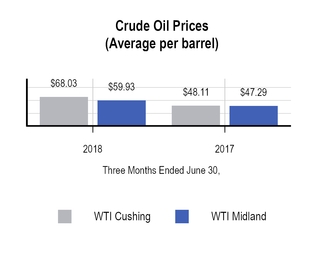
Cost of goods sold for the second quarter of 2018 for the refining segment was $2,179.6 million compared to $1,084.5 million for the second quarter of 2017, an increase of $1,095.1 million, or 101.0%. This increase was primarily attributable to the addition of the Big Spring and Krotz Springs refineries in connection with the Delek/Alon Merger, combined with an increase in the cost of WTI Cushing crude oil, from an average of $48.11 per barrel in the second quarter of 2017 to an average of $68.03 in the second quarter of 2018, and an increase in the cost of WTI Midland crude oil, from an average
of $47.29 per barrel in the second quarter of 2017 to an average of $59.93 in the second quarter of 2018.
Our refining segment has multiple service agreements with our logistics segment, which, among other things, require the refining segment to pay terminalling and storage fees based on the throughput volume of crude and finished product in the logistics segment pipelines and the volume of crude and finished product stored in the logistics segment storage tanks, subject to minimum volume commitments. These fees were $43.6 million and $33.1 million during the second quarters of 2018 and 2017, respectively, and are included in cost of goods sold for the refining segment. We eliminate these intercompany fees in consolidation.
Operating Expenses
Operating expenses for the refining segment were $113.2 million for the second quarter of 2018 compared to $51.6 million for the second quarter of 2017, an increase of $61.6 million, or 119.4%. The increase in operating expenses was primarily due to the addition of the Big Spring and Krotz Springs refineries in connection with the Delek/Alon Merger.
Contribution Margin
Contribution margin for the refining segment increased to $177.0 million, or a contribution margin percentage of 7.9% , in the second quarter of 2018, compared to $16.9 million, or a contribution margin percentage of 1.5%, in the second quarter of 2017, representing an increase of $160.1 million in contribution margin and a 6.4% improvement in contribution margin percentage. The refining segment contribution margin increase was primarily attributable to the addition of the Big Spring and Krotz Springs refineries in connection with the Delek/Alon Merger, combined with the 32.3% improvement in the average Gulf Coast 5-3-2 crack spread in the second quarter of 2018 as compared to the second quarter of 2017, which favorably impacted the period-over-period dollar value margins as well as margin percentages at our refineries.
66
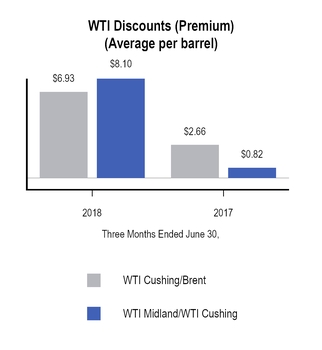
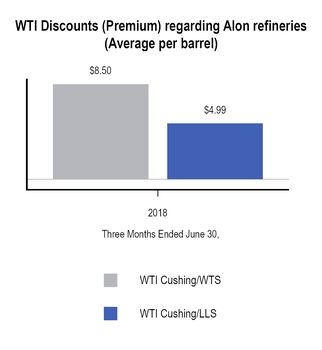
Refining Segment Operational Comparison of the Six Months Ended June 30, 2018 versus the Six Months Ended June 30, 2017
Net Revenues
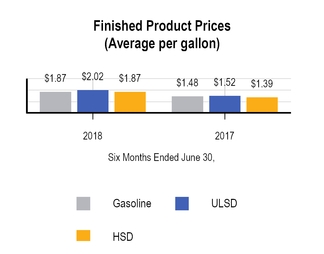
Net revenues for the refining segment were $4,595.7 million for the six months ended June 30, 2018 compared to $2,252.5 million for the six months ended June 30, 2017, an increase of $2,343.2 million, or 104.0%. Significant contributors to the increase in net revenues included the addition of the Big Spring and Krotz Springs refineries in connection with the Delek/Alon Merger in the second quarter of 2018, as well as increases in the price of both U.S. Gulf Coast gasoline, ULSD and HSD in the six months ended June 30, 2018 as compared to the six months ended June 30, 2017.
Cost of Goods Sold
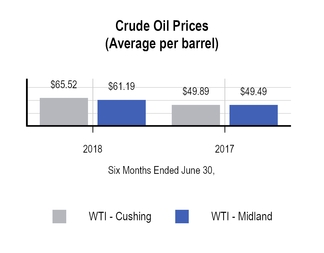
Cost of goods sold for the refining segment for the six months ended June 30, 2018 was $4,057.5 million, compared to $2,065.3 million for the six months ended June 30, 2017, an increase of $1,992.2 million, or 96.5%. This increase was primarily attributable to the addition of the Big Spring and Krotz Springs refineries in connection with the Delek/Alon Merger in the second quarter of 2018, combined with an increase in the cost of WTI Cushing crude
67
oil from an average of $49.89 per barrel for the six months ended June 30, 2017 to an average of $65.52 during the six months ended June 30, 2018, and an increase in the cost of WTI Midland crude oil, from an average of $49.49 per barrel for the six months ended June 30, 2017 to an average of $61.19 for the six months ended June 30, 2018. Partially offsetting the increase in costs of goods sold was a reduction of our RINs Obligation and related cost of goods sold of approximately $59.3 million and $47.5 million for the six months ended June 30, 2018 and 2017, respectively, related to the receipt of small refinery exemptions from the requirements of the renewable fuel standard at our El Dorado refinery for the 2017 and 2016 calendar years, respectively. In March 2018, the Krotz Springs refinery received such approval as well, which resulted in a reduction of our RINs Obligation and related cost of goods sold of approximately $31.6 million for the six months ended June 30, 2018.
Our refining segment has multiple service agreements with our logistics segment which, among other things, require the refining segment to pay terminalling and storage fees based on the throughput volume of crude and finished product in the logistics segment pipelines and the volume of crude and finished product stored in the logistics segment storage tanks. These fees were $97.9 million and $64.3 million during the six months ended June 30, 2018 and 2017, respectively. We eliminate these intercompany fees in consolidation.
Operating Expenses
Operating expenses for the refining segment were $227.9 million for the six months ended June 30, 2018 compared to $102.4 million for the six months ended June 30, 2017, an increase of $125.5 million, or 122.6%. The increase in operating expenses was primarily due to the addition of the Big Spring and Krotz Springs refineries in connection with the Delek/Alon Merger during the six months ended June 30, 2018.
Contribution Margin
Contribution margin for the refining segment increased to $310.3 million, or a contribution margin percentage of 7.4%, in the six months ended June 30, 2018, compared to $84.8 million, or a contribution margin percentage of 3.8%, in the six months ended June 30, 2017, representing an increase of $225.5 million in contribution margin and a 3.6% improvement in contribution margin percentage. The refining segment contribution margin increase was primarily attributable to the addition of the Big Spring and Krotz Springs refineries in connection with the Delek/Alon Merger, combined with the 21.2% improvement in the average Gulf Coast 5-3-2 crack spread in the six months ended June 30, 2018 as compared to the six months ended June 30, 2017 and the cost of goods sold benefit attributable to the RIN waivers, both of which favorably impacted the period-over-period margins at our refineries.
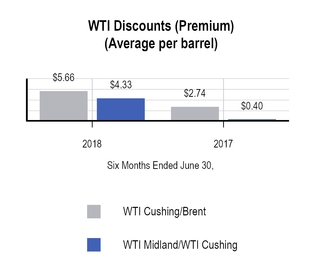
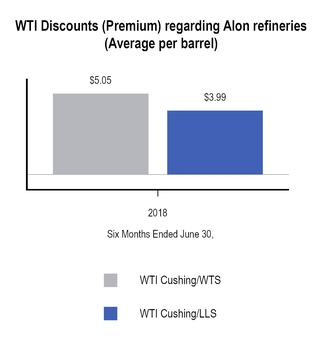
68
Logistics Segment
The table below sets forth certain information concerning our logistics segment operations ($ in millions, except per barrel amounts):
Three Months Ended June 30, | Six Months Ended June 30, | |||||||||||||||
2018 | 2017 | 2018 | 2017 | |||||||||||||
Logistics Segment Contribution: | ||||||||||||||||
Net revenues | $ | 166.3 | $ | 126.7 | $ | 334.2 | $ | 256.2 | ||||||||
Cost of goods sold | 106.0 | 85.0 | 225.0 | 177.6 | ||||||||||||
Gross margin | 60.3 | 41.7 | 109.2 | 78.6 | ||||||||||||
Operating expenses | 14.9 | 10.0 | 27.5 | 20.3 | ||||||||||||
Contribution margin | $ | 45.4 | $ | 31.7 | $ | 81.7 | $ | 58.3 | ||||||||
Operating Information: | ||||||||||||||||
East Texas - Tyler Refinery sales volumes (average bpd) (1) | 79,330 | 77,878 | 76,304 | 70,677 | ||||||||||||
West Texas wholesale marketing throughputs (average bpd) | 12,261 | 13,422 | 14,091 | 13,942 | ||||||||||||
West Texas wholesale marketing margin per barrel | $ | 8.06 | $ | 4.26 | $ | 6.43 | $ | 3.44 | ||||||||
Big Spring wholesale marketing throughputs (average bpd) (2) | 80,536 | — | 79,165 | — | ||||||||||||
Terminalling throughputs (average bpd) (3) | 162,383 | 128,111 | 154,917 | 122,026 | ||||||||||||
Throughputs (average bpd) | ||||||||||||||||
Lion Pipeline System: | ||||||||||||||||
Crude pipelines (non-gathered) | 56,088 | 59,953 | 55,412 | 59,351 | ||||||||||||
Refined products pipelines to Enterprise Systems | 48,013 | 49,820 | 48,879 | 50,583 | ||||||||||||
SALA Gathering System | 16,738 | 15,957 | 16,705 | 16,242 | ||||||||||||
East Texas Crude Logistics System | 16,902 | 13,591 | 17,478 | 14,876 | ||||||||||||
_____________________________
(1) | Excludes jet fuel and petroleum coke. |
(2) | Throughputs for the six months ended June 30, 2018 are for the 122 days we marketed certain finished products produced at or sold from the Big Spring Refinery following the execution of the Big Spring Marketing Agreement, effective March 1, 2018, as defined in Note 3 to our accompanying condensed consolidated financial statements. |
(3) | Consists of terminalling throughputs at our Tyler, Big Spring, Big Sandy and Mount Pleasant, Texas; our El Dorado and North Little Rock, Arkansas; and our Memphis and Nashville, Tennessee terminals. Throughputs for the six months ended June 30, 2018 for the Big Spring terminal are for the 122 days we operated the terminal following its acquisition effective March 1, 2018. Barrels per day are calculated for only the days we operated each terminal. Total throughput barrels for the six months ended June 30, 2018 was 26.0 million barrels, which averaged 143,593 bpd for the period. |
Logistics Segment Operational Comparison of the Three Months Ended June 30, 2018 versus the Three Months Ended June 30, 2017
Net Revenues
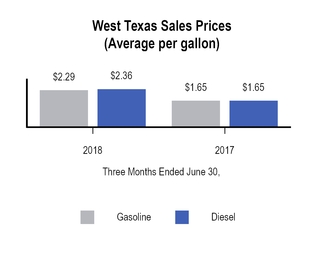
Net revenues for the logistics segment were $166.3 million in the second quarter of 2018, compared to $126.7 million for the second quarter of 2017, an increase of $39.6 million, or 31.3%. The increase was primarily attributable to increases in the average sales prices per gallon of gasoline and diesel sold in our west Texas marketing operations. The average sales prices per gallon of gasoline and diesel sold increased $0.64 per gallon and $0.71 per gallon, respectively, during the second quarter of 2018 compared to the second quarter of 2017. Also contributing to the increase were net revenues generated under the agreements executed in connection with the Big Spring Logistic Assets Acquisition, which were effective March 1, 2018. Refer to Note 3 to our accompanying condensed consolidated financial statements for additional information about the agreements executed in connection with the Big Spring Logistic Assets Acquisition.
69
Net revenues included $8.7 million and $5.3 million of net service fees paid by our refining segment to our logistics segment during the second quarter of 2018 and 2017, respectively. These service fees are based on the number of gallons sold and a fee for providing sales and customer support services. Net revenues also included crude and refined product transportation, terminalling and storage fees paid by our refining segment to our logistics segment, which includes revenues earned under the commercial agreements entered into in connection with the Big Spring Logistic Assets Acquisition. These fees were $43.6 million and $33.1 million in the second quarter of 2018 and 2017, respectively. The logistics segment also sold $0.7 million and $1.2 million of RINs to the refining segment during the second quarter of 2018 and 2017, respectively. These intercompany sales and fees are eliminated in consolidation.
Cost of Goods Sold
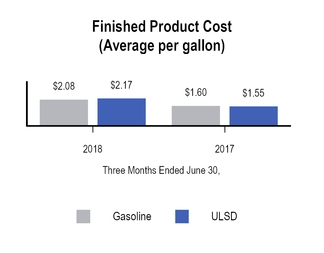
Cost of goods sold for the logistics segment increased $21.0 million, or 24.7%, to $106.0 million in the second quarter of 2018, compared to $85.0 million in the second quarter of 2017. The increase in cost of goods sold was primarily attributable to increases in the average cost per gallon of gasoline and diesel purchased in our west Texas marketing operations. The average cost per gallon of gasoline and diesel purchased increased $0.48 per gallon and $0.62 per gallon, respectively, during the second quarter of 2018 compared to the second quarter of 2017.
Operating Expenses
Operating expenses for the logistics segment were approximately $14.9 million and $10.0 million for the second quarter of 2018 and 2017, respectively, an increase of $4.9 million, or 49.0%. The increase in operating expenses was primarily due to the operating costs associated with the assets acquired in the Big Spring Logistic Asset Acquisition that was effective March 1, 2018, including professional services fees incurred in connection with the transaction. Also contributing to the increase were increases in employee costs allocated to us as a result of increases in employee headcount and increases in employee incentive costs.
Contribution Margin
Contribution margin for the logistics segment for the second quarter of 2018 was $45.4 million, or 19.8% of our consolidated segment contribution margin, compared to $31.7 million, or 293.5% of our consolidated segment contribution margin, in the second quarter of 2017, an increase of $13.7 million, or 43.2%. The increase in contribution margin was primarily attributable to improved contribution margin in our west Texas operations as a result of continued increased drilling activity in the region and favorable market price movements. Also contributing to the increase were increases in revenue generated under the agreements executed in connection with the Big Spring Logistic Assets Acquisition as described above.
Logistics Segment Operational Comparison of the Six Months Ended June 30, 2018 versus the Six Months Ended June 30, 2017
Net Revenues
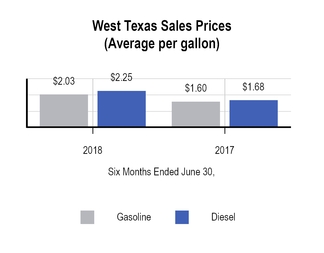
Net revenues for the logistics segment were $334.2 million during the six months ended June 30, 2018, compared to $256.2 million during the six months ended June 30, 2017, an increase of $78.0 million, or 30.4%. The increase was primarily attributable to increases in the average sales prices per gallon of gasoline and diesel sold in our west Texas marketing operations. The average sales prices per gallon of gasoline and diesel sold increased $0.43 per gallon and $0.57 per gallon, respectively, during the six months ended June 30, 2018 compared to the six months ended June 30, 2017. Also contributing to the increase were net revenues generated under the agreements executed in connection with the Big Spring Logistics Assets Acquisition, which were effective March 1, 2018, as well as the increased volume related to the east Texas marketing agreement. Refer to Note 3 to our accompanying condensed consolidated financial statements for additional information about the agreements executed in connection with the Big Spring Logistic Assets Acquisition.
Net revenues included $14.8 million and $9.6 million of net service fees paid by our refining segment to our logistics segment during the six months ended June 30, 2018 and 2017, respectively.
70
These service fees are based on the number of gallons sold and a shared portion of the margin achieved in return for providing sales and customer support services. Net revenues also included crude and refined product transportation, terminalling and storage fees paid by our refining segment to our logistics segment, which includes revenues earned under the commercial agreements entered into in connection with the Big Spring Logistic Assets Acquisition. These fees were $97.9 million and $64.3 million in the six months ended June 30, 2018 and 2017, respectively. The logistics segment also sold $2.0 million and $2.3 million of RINs to the refining segment in the six months ended June 30, 2018 and 2017, respectively. These intercompany sales and fees are eliminated in consolidation.
Cost of Goods Sold
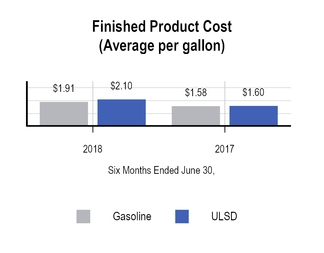
Cost of goods sold for the logistics segment increased $47.4 million, or 26.7%, to $225.0 million in the six months ended June 30, 2018, compared to $177.6 million in the six months ended June 30, 2017. The increase in cost of goods sold was primarily attributable to increases in the average cost per gallon of gasoline and diesel purchased in our west Texas marketing operations. The average cost per gallon of gasoline and diesel purchased increased $0.33 per gallon and $0.50 per gallon, respectively, during the six months ended June 30, 2018, compared to the six months ended June 30, 2017.
Operating Expenses
Operating expenses for the logistics segment were $27.5 million and $20.3 million for the six months ended June 30, 2018 and 2017, respectively, an increase of $7.2 million, or 35.5%. The increase in operating expenses was primarily due to the operating costs associated with the assets acquired in the Big Spring Logistic Asset Acquisition that was effective March 1, 2018, including professional services fees incurred in connection with the transaction. Also contributing to the increase were increases in employee costs allocated to us as a result of increases in employee headcount and increases in employee incentive costs.
Contribution Margin
Contribution margin for the logistics segment for the six months ended June 30, 2018 was $81.7 million, or 21.4% of our consolidated segment contribution margin, compared to $58.3 million, or 60.7% of our consolidated segment contribution margin, for the six months ended June 30, 2017, an increase of $23.4 million, or 40.1%. The increase in contribution margin was primarily attributable to improved contribution margin in our west Texas operations as a result of continued increased drilling activity in the region and favorable market price movements. Also contributing to the increase were increases in revenue generated under the agreements executed in connection with the Big Spring Logistic Assets Acquisition and the improved performance related to the east Texas marketing agreement as described above.
71
Retail Segment
The Retail Segment was not reported for the periods prior to July 1, 2017 (the date of the Delek/Alon Merger which included the Retail Segment). The table below sets forth certain information concerning our retail segment operations ($ in millions):
Three Months Ended June 30, | Six Months Ended June 30, | ||||||
2018 | 2018 | ||||||
Net revenues | $ | 244.8 | $ | 454.4 | |||
Cost of goods sold | 200.9 | 374.1 | |||||
Gross margin | 43.9 | 80.3 | |||||
Operating expenses | 25.3 | 49.8 | |||||
Contribution margin | $ | 18.6 | $ | 30.5 | |||
Operating Information: | |||||||
Number of stores (end of period) | 297 | 297 | |||||
Average number of stores | 297 | 298 | |||||
Retail Segment Operational Comparison of the Three Months Ended June 30, 2018 versus the Three Months Ended June 30, 2017
Net Revenues
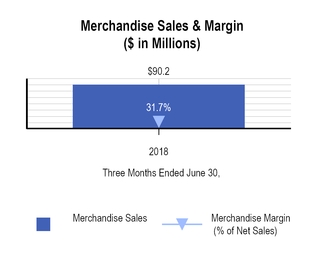
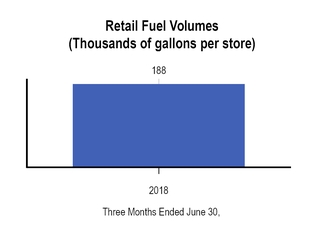
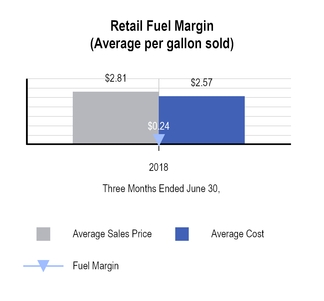
Net revenues for the retail segment in the second quarter of 2018 were $244.8 million. The net revenues were due to the addition of 297 convenience stores, most of which market motor fuels in central and west Texas and New Mexico in connection with the Delek/Alon Merger. Retail fuel gallons sold for the retail segment were 54.1 million gallons for the second quarter of 2018, and total fuel sales, including wholesale dollars, were $152.0 million in the second quarter of 2018. Merchandise sales for the retail segment were $90.2 million in the second quarter of 2018.
Cost of Goods Sold
Cost of goods sold for the retail segment was $200.9 million in the second quarter of 2018 and was attributable to the addition of 297 convenience stores, most of which market motor fuels in central and west Texas and New Mexico in connection with the Delek/Alon Merger.
72
Operating Expenses
Operating expenses for the retail segment were $25.3 million in the second quarter of 2018 and was attributable to the addition of 297 convenience stores, most of which market motor fuels in central and west Texas and New Mexico in connection with the Delek/Alon Merger.
Contribution Margin
Contribution margin for the retail segment was $18.6 million, or 8.1% of our consolidated segment contribution margin in the second quarter of 2018 and was attributable to the addition of 297 convenience stores, most of which market motor fuels in central and west Texas and New Mexico in connection with the Delek/Alon Merger.
Retail Segment Operational Comparison of the Six Months Ended June 30, 2018 versus the Six Months Ended June 30, 2017
Net Revenues
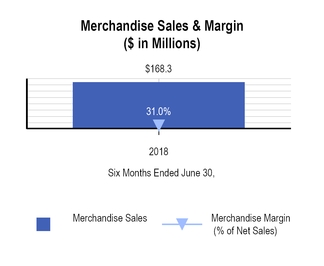
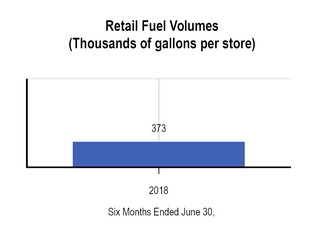
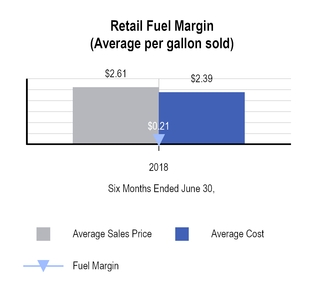
Net revenues for the retail segment during the six months ended June 30, 2018 were $454.4 million. The net revenues were due to the addition of 297 convenience stores, most of which market motor fuels in central and west Texas and New Mexico in connection with the Delek/Alon Merger. Retail fuel gallons sold for the retail segment were 107.8 million gallons during the six months ended June 30, 2018, and total fuel sales, including wholesale dollars, were $280.9 million during the six months ended June 30, 2018. Merchandise sales for the retail segment were $168.3 million during the six months ended June 30, 2018.
Cost of Goods Sold
Cost of goods sold for the retail segment was $374.1 million during the six months ended June 30, 2018 and was attributable to the addition of 297 convenience stores, most of which market motor fuels in central and west Texas and New Mexico in connection with the Delek/Alon Merger.
73
Operating Expenses
Operating expenses for the retail segment were $49.8 million during the six months ended June 30, 2018 and was attributable to the addition of 297 convenience stores, most of which market motor fuels in central and west Texas and New Mexico in connection with the Delek/Alon Merger.
Contribution Margin
Contribution margin for the retail segment was $30.5 million, or 8.0% of our consolidated segment contribution margin during the six months ended June 30, 2018 and was attributable to the addition of 297 convenience stores, most of which market motor fuels in central and west Texas and New Mexico in connection with the Delek/Alon Merger.
74
Liquidity and Capital Resources
Our primary sources of liquidity are cash generated from our operating activities, borrowings under our debt facilities and potential issuances of additional equity and debt securities. We believe that cash generated from these sources will be sufficient to satisfy the anticipated cash requirements associated with our existing operations and capital expenditures for at least the next 12 months.
Cash Flows
The following table sets forth a summary of our consolidated cash flows (in millions):
Six Months Ended June 30, | ||||||||
2018 | 2017 | |||||||
Cash Flow Data: | ||||||||
Operating activities | $ | (136.4 | ) | $ | (46.9 | ) | ||
Investing activities | 13.8 | (32.1 | ) | |||||
Financing activities | 313.5 | (37.9 | ) | |||||
Net increase (decrease) | $ | 190.9 | $ | (116.9 | ) | |||
We adopted new accounting guidance on January 1, 2018 that resulted in a reclassification of $10.6 million of distributions received in the six months ended June 30, 2017 from cash flows of operating activities to cash flows of investing activities, as discussed further in Note 1 of the condensed consolidated financial statements in Item 1, Financial Statement.
Cash Flows from Operating Activities
Net cash used in operating activities was $136.4 million for the six months ended June 30, 2018, compared to $46.9 million for the comparable period of 2017. The decrease in cash flows from operations was partially due to an increase in cash used to purchase inventory and other current assets and an increase in cash used to pay the accounts payable and other current liabilities. Partially offsetting the decrease in cash flows was a decrease in cash used to pay non-current assets and liabilities, net. Additionally offsetting the decrease was an increase in net income, which for the six months ended June 30, 2018 was $66.7 million, compared to a loss of $16.9 million in the same period of 2017. Net income for the six months ended June 30, 2018 included a non-cash benefit of deferred income taxes of $70.8 million in 2018 compared to $12.4 million in the prior year, as well as a non-cash impairment of assets held for sale of $27.5 million and a gain on sale of business of $13.2 million.
Cash Flows from Investing Activities
Net cash provided by investing activities was $13.8 million for the first six months of 2018, compared to net cash used of $32.1 million in the comparable period of 2017. The increase in cash flows provided by investing activities was primarily due to proceeds from sales of discontinued operations of $54.6 million and proceeds from the sale of asphalt assets of $110.8 million received in 2018. This increase was offset by an increase in cash purchases of property, plant and equipment, which increased from $35.0 million in 2017, to $142.5 million in 2018, and a $9.9 million decrease in distributions received from equity method investments.
Cash Flows from Financing Activities
Net cash provided by financing activities was $313.5 million for the six months ended June 30, 2018, compared to cash used of $37.9 million in the comparable 2017 period. We completed a debt refinancing transaction during the six months ended June 30, 2018. The increase in net cash flows from financing activities was primarily attributable to proceeds from long-term revolvers of $1,569.6 million and proceeds from term debt of $690.6 million, offset by payments on long-term revolvers of $1,017.6 million, payment on term debt of $672.9 million, deferred financing costs paid of $7.8 million, repayment of product financing agreements of $72.4 million, repurchase of common stock of $115.3 million and increases in dividends paid to $37.8 million compared to $19.0 million in the comparable 2017 period.
Cash Position and Indebtedness
As of June 30, 2018, our total cash and cash equivalents were $1,132.8 million and we had total indebtedness of approximately $2,042.5 million. Total unused credit commitments or borrowing base availability, as applicable, under our revolving credit facilities was approximately $702.8 million and we had letters of credit issued of approximately $133.3 million. We believe we were in compliance with our covenants in all debt facilities as of June 30, 2018. See Note 8 of the condensed consolidated financial statements in Item 1, Financial Statements, for additional information about our separate revolving credit facilities.
75
Capital Spending
A key component of our long-term strategy is our capital expenditure program. Our capital expenditures for the six months ended June 30, 2018 were $124.8 million, of which approximately $85.2 million was spent in our refining segment, $4.5 million in our logistics segment, $4.1 million in our retail segment and $31.0 million at the holding company level. The following table summarizes our actual capital expenditures for the six months ended June 30, 2018 and planned capital expenditures for the full year 2018 by operating segment and major category (in millions):
Full Year 2018 Forecast | Six Months Ended June 30, 2018 | |||||||
Refining: | ||||||||
Sustaining maintenance, including turnaround activities | $ | 74.3 | $ | 39.1 | ||||
Regulatory | 42.4 | 13.2 | ||||||
Discretionary projects | 59.8 | 32.9 | ||||||
Refining segment total | 176.5 | 85.2 | ||||||
Logistics: | ||||||||
Regulatory | 3.4 | 0.5 | ||||||
Sustaining maintenance | 8.9 | 1.2 | ||||||
Discretionary projects | 6.6 | 2.8 | ||||||
Logistics segment total | 18.9 | 4.5 | ||||||
Retail: | ||||||||
Regulatory | 0.9 | 0.2 | ||||||
Sustaining maintenance | 4.3 | 1.2 | ||||||
Discretionary projects | 14.3 | 2.7 | ||||||
Retail segment total | 19.5 | 4.1 | ||||||
Other: | ||||||||
Regulatory | 0.5 | 0.1 | ||||||
Sustaining maintenance | 1.5 | 0.3 | ||||||
Discretionary projects | 11.1 | 30.6 | ||||||
Other total | 13.1 | 31.0 | ||||||
Total capital spending | $ | 228.0 | $ | 124.8 | ||||
The amount of our capital expenditure budget is subject to change due to unanticipated increases in the cost, scope and completion time for our capital projects. For example, we may experience increases in the cost of and/or timing to obtain necessary equipment required for our continued compliance with government regulations or to complete improvement projects or scheduled maintenance activities. Additionally, the scope and cost of employee or contractor labor expense related to installation of that equipment could exceed our projections. Our capital expenditure budget may also be revised as management continues to evaluate projects for reliability or profitability. The forecast amount for 2018 in the table above does not include midstream projects to enhance our position in the Permian Basin, for which the amount is estimated to be
approximately $75.7 million. Capital spending excludes transaction costs capitalized in the amount of $0.4 million that relate to the Big Spring Logistic Assets Acquisition.
Off-Balance Sheet Arrangements
We have no off-balance sheet arrangements through the date of the filing of this Quarterly Report on Form 10-Q.
76
ITEM 3. QUANTITATIVE AND QUALITATIVE DISCLOSURES ABOUT MARKET RISK
These disclosures should be read in conjunction with the condensed consolidated financial statements, "Management's Discussion and Analysis of Financial Condition and Results of Operations," and other information presented herein, as well as in the "Quantitative and Qualitative Disclosures About Market Risk" section contained in our Annual Report on Form 10-K.
Price Risk Management Activities. At times, we enter into commodity derivative contracts to manage our price exposure to our inventory positions, future purchases of crude oil and ethanol, future sales of refined products or to fix margins on future production. We also enter into future commitments to purchase or sell RINs at fixed prices and quantities, which are used to manage the costs associated with our RINs obligations. These future RIN commitments meet the definition of derivative instruments under ASC 815, Derivatives and Hedging ("ASC 815"). In accordance with ASC 815, all of these commodity contracts and future purchase commitments are recorded at fair value, and any change in fair value between periods has historically been recorded in the profit and loss section of our condensed consolidated financial statements. Occasionally, at inception, the Company will elect to designate the commodity derivative contracts as cash flow hedges under ASC 815. Gains or losses on commodity derivative contracts accounted for as cash flow hedges are recognized in other comprehensive income on the condensed consolidated balance sheets and, ultimately, when the forecasted transactions are completed, in net revenues or cost of goods sold in the condensed consolidated statements of income.
The following table sets forth information relating to our open commodity derivative contracts as of June 30, 2018 ($ in millions).
Total Outstanding | Notional Contract Volume by Year of Maturity | |||||||||||||||
Contract Description | Fair Value | Notional Contract Volume | 2018 | 2019 | 2020 | |||||||||||
Contracts not designated as hedging instruments: | ||||||||||||||||
Crude oil price swaps - long(1) | $ | 35.3 | 15,266,000 | 14,313,000 | 473,000 | 480,000 | ||||||||||
Crude oil price swaps - short(1) | (39.3 | ) | 13,006,000 | 11,953,000 | 473,000 | 580,000 | ||||||||||
Inventory, refined product and crack spread swaps - long(1) | 35.4 | 29,853,000 | 27,387,000 | 1,735,000 | 731,000 | |||||||||||
Inventory, refined product and crack spread swaps - short(1) | (74.5 | ) | 33,267,429 | 30,346,429 | 1,950,000 | 971,000 | ||||||||||
RIN commitment contracts - long(2) | (18.8 | ) | 52,550,000 | 52,550,000 | — | — | ||||||||||
RIN commitment contracts - short(2) | 24.0 | 64,825,000 | 64,825,000 | — | — | |||||||||||
Total | $ | (37.9 | ) | 208,767,429 | 201,374,429 | 4,631,000 | 2,762,000 | |||||||||
Contracts designated as cash flow hedging instruments: | ||||||||||||||||
Crude oil price swaps - long(1) | $ | — | — | — | — | — | ||||||||||
Crude oil price swaps - short(1) | — | — | — | — | — | |||||||||||
Inventory, refined product and crack spread swaps - long(1) | (57.1 | ) | 15,457,000 | 4,971,000 | 10,486,000 | — | ||||||||||
Inventory, refined product and crack spread swaps - short(1) | 0.8 | 90,000 | 90,000 | — | — | |||||||||||
Total | $ | (56.3 | ) | 15,547,000 | 5,061,000 | 10,486,000 | — | |||||||||
(1)Volume in barrels
(2)Volume in RINs
Interest Risk Management Activities. We have market exposure to changes in interest rates relating to our outstanding floating rate borrowings, which totaled approximately $1,562.2 million as of June 30, 2018.
We help manage this risk through interest rate swap agreements that we may periodically enter into in order to modify the interest rate characteristics of our outstanding long-term debt. In accordance with ASC 815, all interest rate hedging instruments are recorded at fair value and any changes in the fair value between periods are recognized in earnings. The fair values of our interest rate swaps have been obtained from dealer quotes. These values represent the estimated amount that we would have received or paid to terminate the agreements taking into
77
account the difference between the contract rate of interest and the then-current rates quoted for agreements of similar terms and maturities. We expect that any interest rate derivatives held would reduce our exposure to short-term interest rate movements. As of December 31, 2017, we had four floating-to-fixed interest rate derivative agreements in place for a notional amount of $68.3 million that were to mature in March 2019 that effectively fixed the variable LIBOR interest component of the term loans within the Alon Retail Credit Agreement. These interest rate swap agreements were terminated in connection with the Refinancing on March 30, 2018 - See Note 8 of the condensed consolidated financial statements in Item 1, Financial Statements, for additional information.
The annualized impact of a hypothetical one percent change in interest rates on our floating rate debt as of June 30, 2018 would be to change interest expense by approximately $15.6 million.
Commodity Derivatives Trading Activities. In the first half of 2018, we entered into active trading positions in a variety of commodity derivatives, which include forward physical contracts, swap contracts, and futures contracts. These contracts are classified as held for trading and are recognized at fair value with changes in fair value recognized in the income statement. Trading activities are undertaken by using a range of contract types in combination to create incremental gains by capitalizing on crude oil supply and pricing seasonality. These contracts had remaining durations of less than one year as of June 30, 2018.
The following table sets forth information relating to commodity derivative contracts held for trading purposes as of June 30, 2018.
Contract Description | Less than 1 year | |||
Over the counter forward sales contracts | ||||
Notional contract volume (1) | 683,960 | |||
Weighted-average market price (per barrel) | $ | 48.0 | ||
Contract amounts at fair value (in millions) | $ | 32.8 | ||
Over the counter forward purchase contracts | ||||
Notional contract volume (1) | 474,750 | |||
Weighted-average market price (per barrel) | $ | 47.8 | ||
Contract amounts at fair value (in millions) | $ | 22.7 | ||
(1) | Volume in barrels |
78
ITEM 4. CONTROLS AND PROCEDURES
(a) Evaluation of Disclosure Controls and Procedures
Our management has evaluated, with the participation of our principal executive and principal financial officers, the effectiveness of our disclosure controls and procedures (as defined in Rule 13a-15(e) or Rule 15d-15(e) under the Exchange Act) as of the end of the period covered by this report, and has, based on this evaluation, concluded that our disclosure controls and procedures are effective to provide reasonable assurance that information required to be disclosed by us in the reports that we file or submit under the Exchange Act is recorded, processed, summarized and reported within the time periods specified in the SEC's rules and forms including, without limitation, controls and procedures designed to ensure that information required to be disclosed by us in the reports that we file or submit under the Exchange Act is accumulated and communicated to our management, including our principal executive and principal financial officers, as appropriate to allow timely decisions regarding required disclosures.
(b) Changes in Internal Control over Financial Reporting
There has been no change in our internal control over financial reporting (as defined in Rule 13a-15(f) and 15d-15(f) under the Exchange Act) that occurred during our last fiscal quarter that has materially affected, or is reasonably likely to materially affect, our internal control over financial reporting.
79
PART II.
OTHER INFORMATION
ITEM 1. LEGAL PROCEEDINGS
In the ordinary conduct of our business, we are from time to time subject to lawsuits, investigations and claims, including environmental claims and employee-related matters. Although we cannot predict with certainty the ultimate resolution of lawsuits, investigations and claims asserted against us, including civil penalties or other enforcement actions, we do not believe that any currently pending legal proceeding or proceedings to which we are a party will have a material adverse effect on our business, financial condition or results of operations, and there have been no material developments to the proceedings previously reported in our Annual Report on Form 10-K to comply with certain SEC regulations except as set forth below.
As previously reported, in June 2015, the United States Department of Justice (the “DOJ”), on behalf of the EPA, and the State of Arkansas, on behalf of the Arkansas Department of Environmental Quality (the "ADEQ"), notified Delek Logistics that they were planning to bring an enforcement action with regard to potential violations of the Clean Water Act and certain state laws arising from the release of crude oil in March 2013 from Delek Logistics’ Magnolia Station in Magnolia, Arkansas (the “Magnolia Release”). On July 13, 2018, the DOJ and the State of Arkansas brought a civil action in the United States District Court for the Western District of Arkansas against two of Delek Logistics’ wholly-owned subsidiaries, Delek Logistics Operating LLC (“DLO”) and SALA Gathering Systems LLC (“SALA”), with regard to the Magnolia Release seeking monetary penalties and injunctive relief. The complaint alleges that DLO and SALA violated sections of the Clean Water Act, the Arkansas Water and Air Pollution Control Act and their implementing regulations. The complaint does not make a specific demand for monetary damages, but references the statutory maximum civil penalties available for each of the alleged claims. Delek Logistics is currently attempting to negotiate a resolution to this matter with the EPA and the ADEQ.
ITEM 1A. RISK FACTORS
There have been no material changes in the risk factors previously disclosed in "Item 1A. Risk Factors" of our Annual Report on Form 10-K.
80
ITEM 2. UNREGISTERED SALES OF EQUITY SECURITIES AND USE OF PROCEEDS
In December 2016, our Board of Directors authorized a share repurchase program for up to $150.0 million of Delek common stock. Any share repurchases under the repurchase program may be implemented through open market transactions or in privately negotiated transactions, in accordance with applicable securities laws. The timing, price, and size of repurchases will be made at the discretion of management and will depend on prevailing market prices, general economic and market conditions and other considerations. The repurchase program does not obligate us to acquire any particular amount of stock and does not expire. On February 26, 2018, the Board of Directors approved a new $150.0 million authorization to repurchase Delek common stock, which was announced on February 26, 2018. The following table sets forth information with respect to the purchase of shares of our common stock made during the three months ended June 30, 2018 by or on behalf of us or any “affiliated purchaser,” as defined by Rule 10b-18 of the Exchange Act:
Period | Total Number of Shares Purchased | Average Price Paid per Share | Total Number of Shares Purchased as Part of Publicly Announced Plans or Programs | Approximate Dollar Value of Shares that May Yet Be Purchased Under the Plans or Programs (1) | ||||||||||
April 1 - April 30, 2018 | — | $ | — | — | $ | 179,720,539 | ||||||||
May 1 - May 31, 2018 | — | — | — | 179,720,539 | ||||||||||
June 1 - June 30, 2018 | 371,271 | 53.87 | 371,271 | $ | 159,721,210 | |||||||||
Total | 371,271 | $ | 53.87 | 371,271 | N/A | |||||||||
(1) | 371,271 shares were repurchased during the three months ended June 30, 2018 pursuant to the repurchase program authorized by the Board of Directors in December 2016 for up to $150.0 million of Delek common stock, which was announced on January 3, 2017, and an additional $150.0 million authorization to repurchase Delek common stock, which was announced on February 26, 2018. |
ITEM 5. OTHER INFORMATION
Dividend Declaration
On August 7, 2018, our Board of Directors voted to declare a quarterly cash dividend of $0.25 per share of our common stock, payable on September 4, 2018 to shareholders of record on August 21, 2018.
81
ITEM 6. EXHIBITS
Exhibit No. | Description | |||
* | ||||
* | ||||
§ | Certification of the Company’s Chief Executive Officer pursuant to Rule 13a-14(a)/15(d)-14(a) under the Securities Exchange Act of 1934, as amended. | |||
§ | Certification of the Company’s Chief Financial Officer pursuant to Rule 13a-14(a)/15(d)-14(a) under the Securities Exchange Act of 1934, as amended. | |||
§§ | Certification of the Company’s Chief Executive Officer pursuant to 18 U.S.C. Section 1350, as adopted pursuant to Section 906 of the Sarbanes-Oxley Act of 2002. | |||
§§ | Certification of the Company’s Chief Financial Officer pursuant to 18 U.S.C. Section 1350, as adopted pursuant to Section 906 of the Sarbanes-Oxley Act of 2002. | |||
101 | The following materials from Delek US Holdings, Inc.’s Quarterly Report on Form 10-Q for the quarterly period ended June 30, 2018, formatted in XBRL (eXtensible Business Reporting Language): (i) Condensed Consolidated Balance Sheets as of June 30, 2018 and December 31, 2017 (Unaudited), (ii) Condensed Consolidated Statements of Income for the three and six months ended June 30, 2018 and 2017 (Unaudited), (iii) Condensed Consolidated Statements of Comprehensive Income for the three and six months ended June 30, 2018 and 2017 (Unaudited), (iv) Condensed Consolidated Statements of Cash Flows for the six months ended June 30, 2018 and 2017 (Unaudited), and (v) Notes to Condensed Consolidated Financial Statements (Unaudited). | |||
_______________
* | Management contract or compensatory plan or arrangement. |
§ | Filed herewith. |
§§ | Furnished herewith. |
82
SIGNATURES
Pursuant to the requirements of the Securities Exchange Act of 1934, the registrant has duly caused this report to be signed on its behalf by the undersigned, thereunto duly authorized.
Delek US Holdings, Inc. | |
By: | /s/ Ezra Uzi Yemin |
Ezra Uzi Yemin | |
Director (Chairman), President and Chief Executive Officer (Principal Executive Officer) | |
By: | /s/ Kevin Kremke |
Kevin Kremke | |
Executive Vice President and Chief Financial Officer (Principal Financial and Accounting Officer) | |
Dated: August 9, 2018
83