Attached files
| file | filename |
|---|---|
| 8-K - 8-K - Conifer Holdings, Inc. | a630188-kquarterinvestorpr.htm |

SECOND QUARTER 2018 INVESTOR CONFERENCE CALL August 9, 2018
SAFE HARBOR STATEMENT This presentation contains “forward-looking” statements within the meaning of Section 27A of the Securities Act of 1933, as amended, and Section 21E of the Securities Exchange Act of 1934, as amended, that are based on our management’s beliefs and assumptions and on information currently available to management. These forward-looking statements include, without limitation, statements regarding our industry, business strategy, plans, goals and expectations concerning our market position, product expansion, future operations, margins, profitability, future efficiencies, and other financial and operating information. When used in this discussion, the words “may,” “believes,” “intends,” “seeks,” “anticipates,” “plans,” “estimates,” “expects,” “should,” “assumes,” “continues,” “potential,” “could,” “will,” “future” and the negative of these or similar terms and phrases are intended to identify forward-looking statements. Forward-looking statements involve known and unknown risks, uncertainties, inherent risks and other factors that may cause our actual results, performance or achievements to be materially different from any future results, performance or achievements expressed or implied by the forward-looking statements. Forward-looking statements represent our management’s beliefs and assumptions only as of the date of this presentation. Our actual future results may be materially different from what we expect due to factors largely outside our control, including the occurrence of severe weather conditions and other catastrophes, the cyclical nature of the insurance industry, future actions by regulators, our ability to obtain reinsurance coverage at reasonable rates and the effects of competition. These and other risks and uncertainties associated with our business are described under the heading “Risk Factors” in our most recently filed Annual Report on Form 10-K and our Quarterly Report on Form 10-Q for the quarter ended June 30, 2018, which should be read in conjunction with this presentation. The company and subsidiaries operate in a dynamic business environment, and therefore the risks identified are not meant to be exhaustive. Risk factors change and new risks emerge frequently. Except as required by law, we assume no obligation to update these forward-looking statements publicly, or to update the reasons actual results could differ materially from those anticipated in the forward-looking statements, even if new information becomes available in the future. 1 1
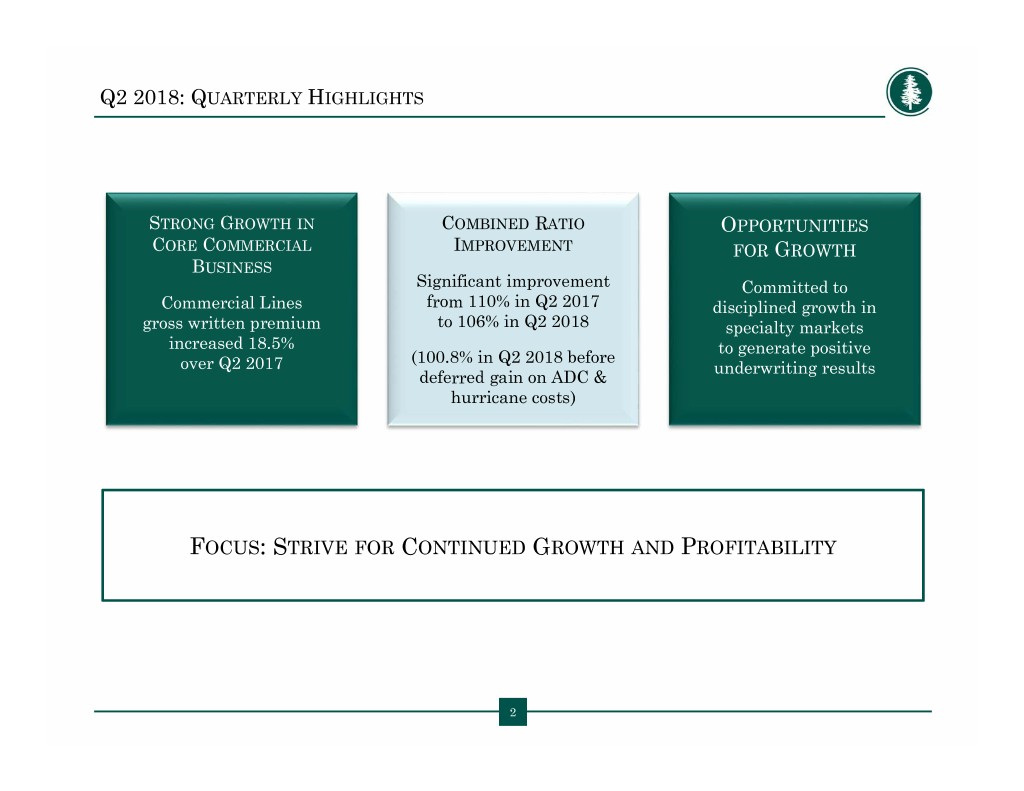
Q2 2018: QUARTERLY HIGHLIGHTS STRONG GROWTH IN COMBINED RATIO OPPORTUNITIES CORE COMMERCIAL IMPROVEMENT FOR GROWTH BUSINESS Significant improvement Committed to Commercial Lines from 110% in Q2 2017 disciplined growth in gross written premium to 106% in Q2 2018 specialty markets increased 18.5% to generate positive (100.8% in Q2 2018 before over Q2 2017 underwriting results deferred gain on ADC & hurricane costs) FOCUS: STRIVE FOR CONTINUED GROWTH AND PROFITABILITY 2
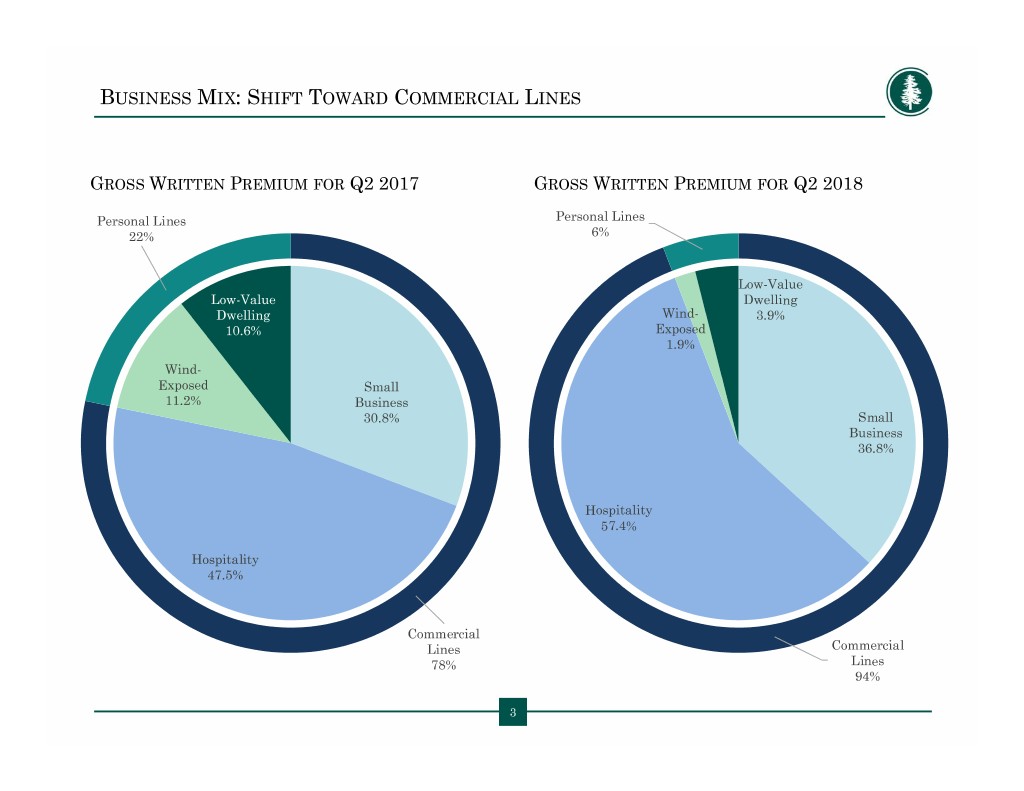
BUSINESS MIX: SHIFT TOWARD COMMERCIAL LINES GROSS WRITTEN PREMIUM FOR Q2 2017 GROSS WRITTEN PREMIUM FOR Q2 2018 Personal Lines Personal Lines 22% 6% Low-Value Low-Value Dwelling Dwelling Wind- 3.9% 10.6% Exposed 1.9% Wind- Exposed Small 11.2% Business 30.8% Small Business 36.8% Hospitality 57.4% Hospitality 47.5% Commercial Lines Commercial 78% Lines 94% 3 3
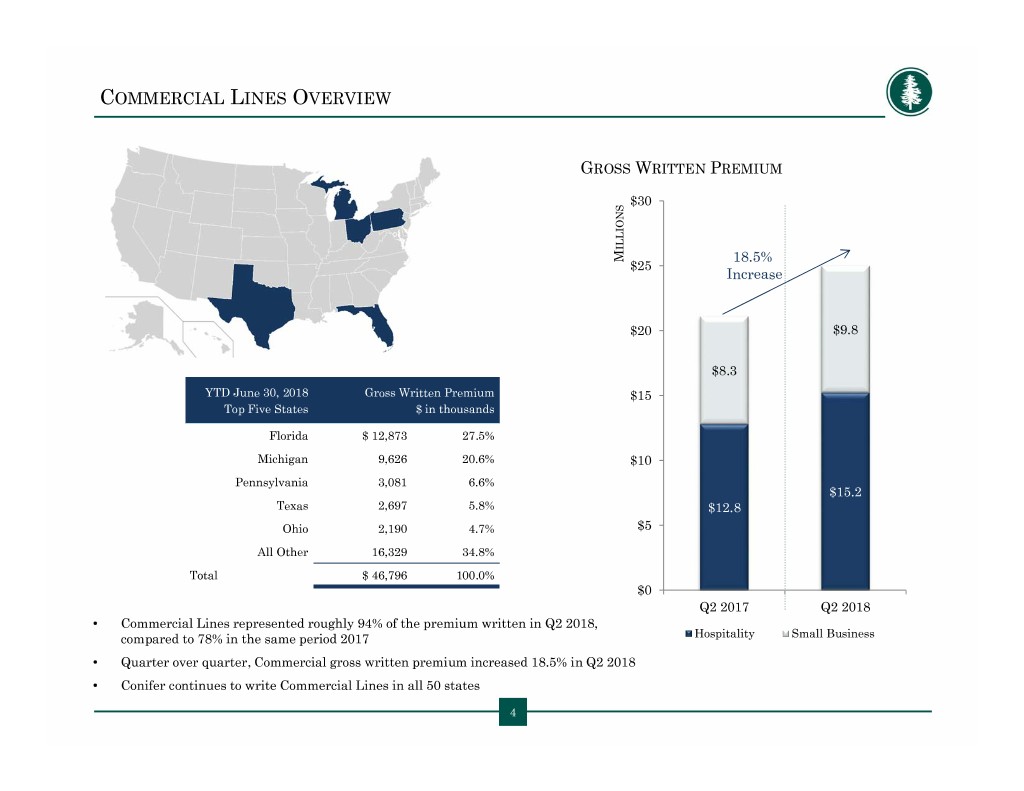
COMMERCIAL LINES OVERVIEW GROSS WRITTEN PREMIUM $30 ILLIONS M 18.5% $25 Increase $20 $9.8 $8.3 YTD June 30, 2018 Gross Written Premium $15 Top Five States $ in thousands Florida $ 12,873 27.5% Michigan 9,626 20.6% $10 Pennsylvania 3,081 6.6% $15.2 Texas 2,697 5.8% $12.8 Ohio 2,190 4.7% $5 All Other 16,329 34.8% Total $ 46,796 100.0% $0 Q2 2017 Q2 2018 • Commercial Lines represented roughly 94% of the premium written in Q2 2018, compared to 78% in the same period 2017 Hospitality Small Business • Quarter over quarter, Commercial gross written premium increased 18.5% in Q2 2018 • Conifer continues to write Commercial Lines in all 50 states 4 4
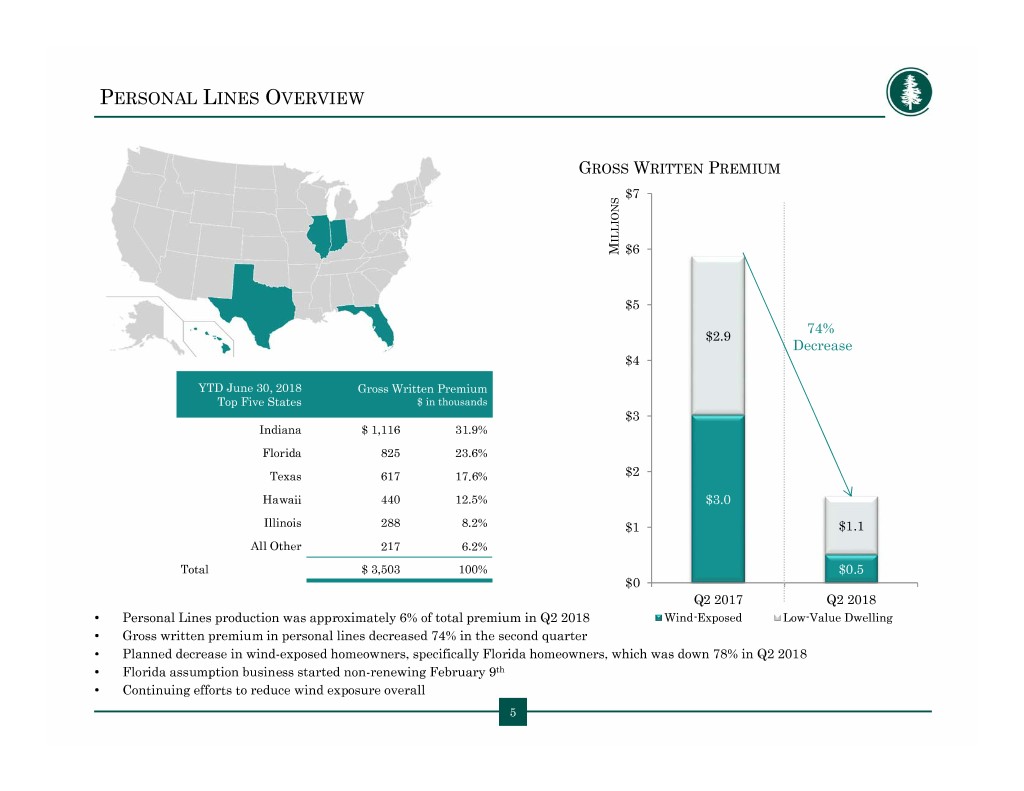
PERSONAL LINES OVERVIEW GROSS WRITTEN PREMIUM $7 ILLIONS M $6 $5 74% $2.9 Decrease $4 YTD June 30, 2018 Gross Written Premium Top Five States $ in thousands $3 Indiana $ 1,116 31.9% Florida 825 23.6% Texas 617 17.6% $2 Hawaii 440 12.5% $3.0 Illinois 288 8.2% $1 $1.1 All Other 217 6.2% Total $ 3,503 100% $0.5 $0 Q2 2017 Q2 2018 • Personal Lines production was approximately 6% of total premium in Q2 2018 Wind-Exposed Low-Value Dwelling • Gross written premium in personal lines decreased 74% in the second quarter • Planned decrease in wind-exposed homeowners, specifically Florida homeowners, which was down 78% in Q2 2018 • Florida assumption business started non-renewing February 9th • Continuing efforts to reduce wind exposure overall 5 5
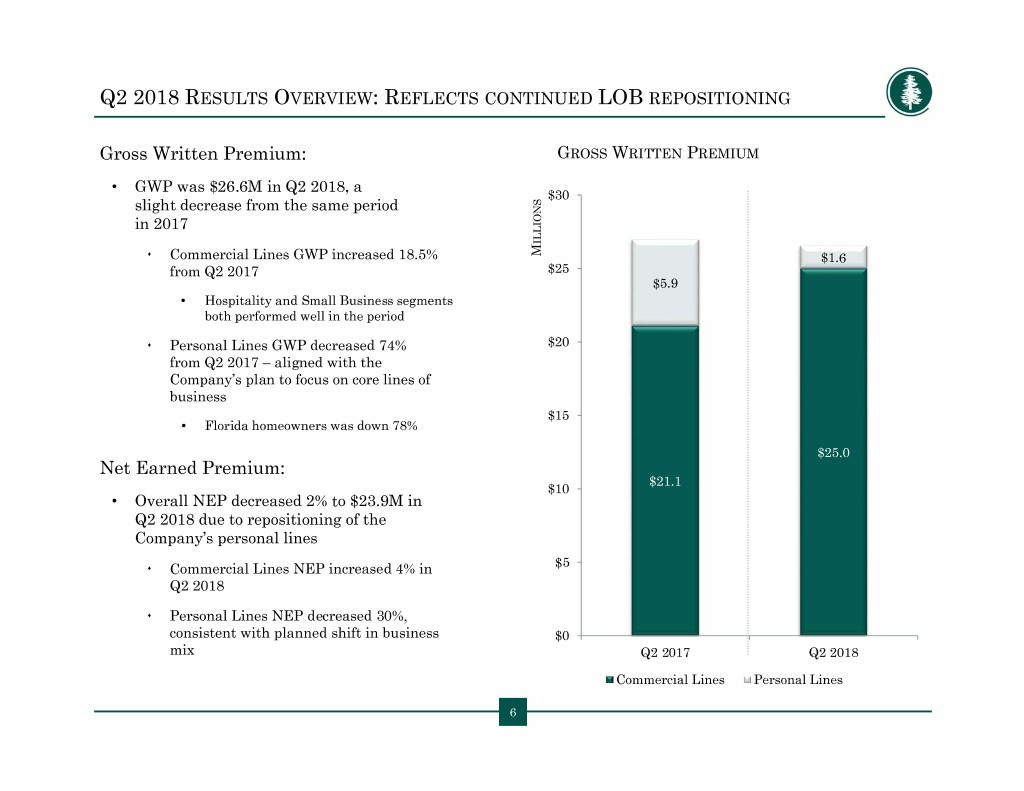
Q2 2018 RESULTS OVERVIEW: REFLECTS CONTINUED LOB REPOSITIONING Gross Written Premium: GROSS WRITTEN PREMIUM • GWP was $26.6M in Q2 2018, a $30 slight decrease from the same period in 2017 ILLIONS Commercial Lines GWP increased 18.5% M $1.6 from Q2 2017 $25 $5.9 • Hospitality and Small Business segments both performed well in the period Personal Lines GWP decreased 74% $20 from Q2 2017 – aligned with the Company’s plan to focus on core lines of business $15 • Florida homeowners was down 78% $25.0 Net Earned Premium: $21.1 $10 • Overall NEP decreased 2% to $23.9M in Q2 2018 due to repositioning of the Company’s personal lines Commercial Lines NEP increased 4% in $5 Q2 2018 Personal Lines NEP decreased 30%, consistent with planned shift in business $0 mix Q2 2017 Q2 2018 Commercial Lines Personal Lines 6 6
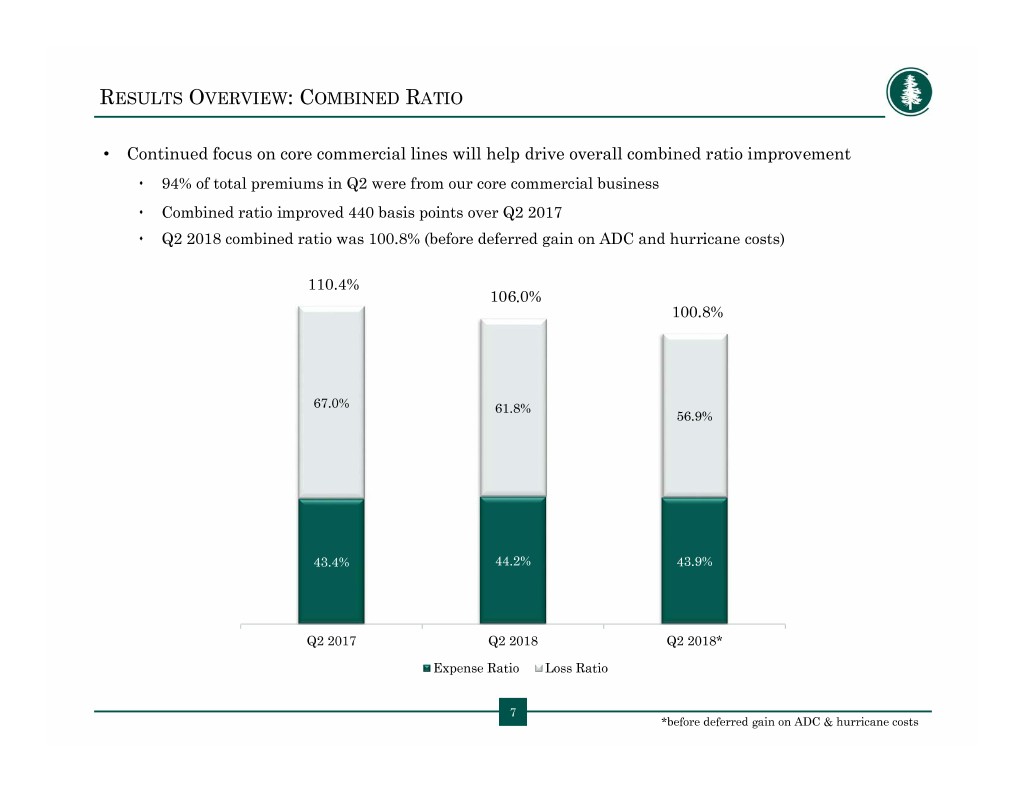
RESULTS OVERVIEW: COMBINED RATIO • Continued focus on core commercial lines will help drive overall combined ratio improvement 94% of total premiums in Q2 were from our core commercial business Combined ratio improved 440 basis points over Q2 2017 Q2 2018 combined ratio was 100.8% (before deferred gain on ADC and hurricane costs) 110.4% 106.0% 100.8% 67.0% 61.8% 56.9% 43.4% 44.2% 43.9% Q2 2017 Q2 2018 Q2 2018* Expense Ratio Loss Ratio 7 *before deferred gain on ADC & hurricane costs
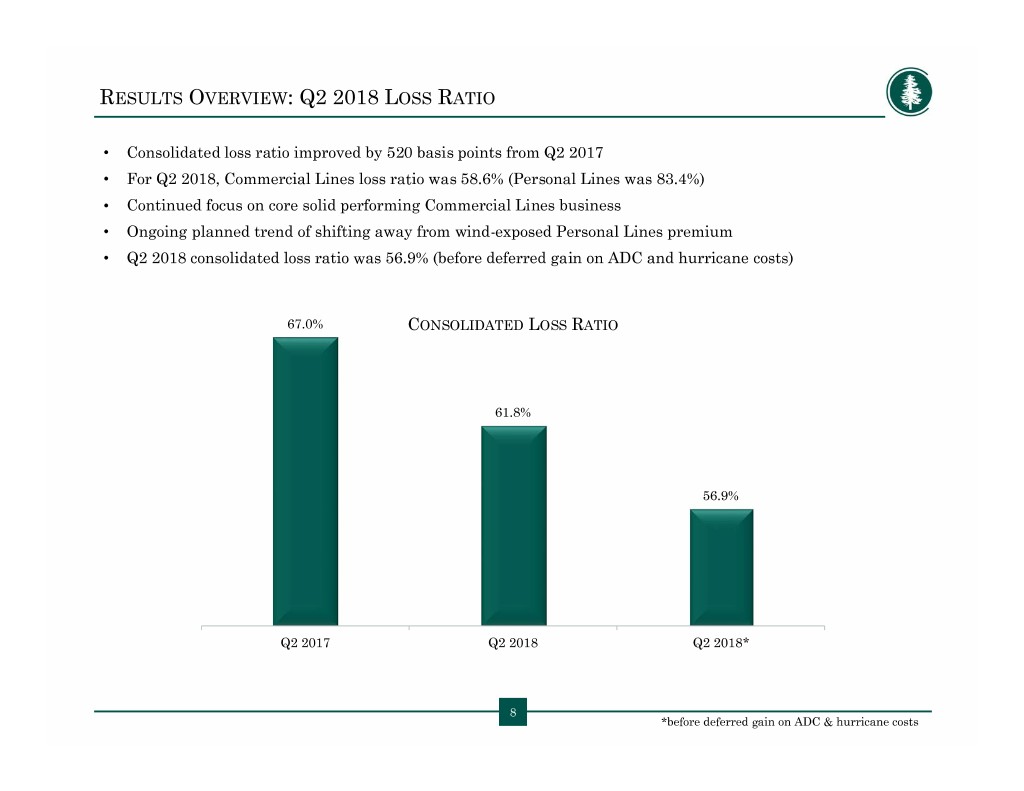
RESULTS OVERVIEW: Q2 2018 LOSS RATIO • Consolidated loss ratio improved by 520 basis points from Q2 2017 • For Q2 2018, Commercial Lines loss ratio was 58.6% (Personal Lines was 83.4%) • Continued focus on core solid performing Commercial Lines business • Ongoing planned trend of shifting away from wind-exposed Personal Lines premium • Q2 2018 consolidated loss ratio was 56.9% (before deferred gain on ADC and hurricane costs) 67.0% CONSOLIDATED LOSS RATIO 61.8% 56.9% Q2 2017 Q2 2018 Q2 2018* 8 *before deferred gain on ADC & hurricane costs
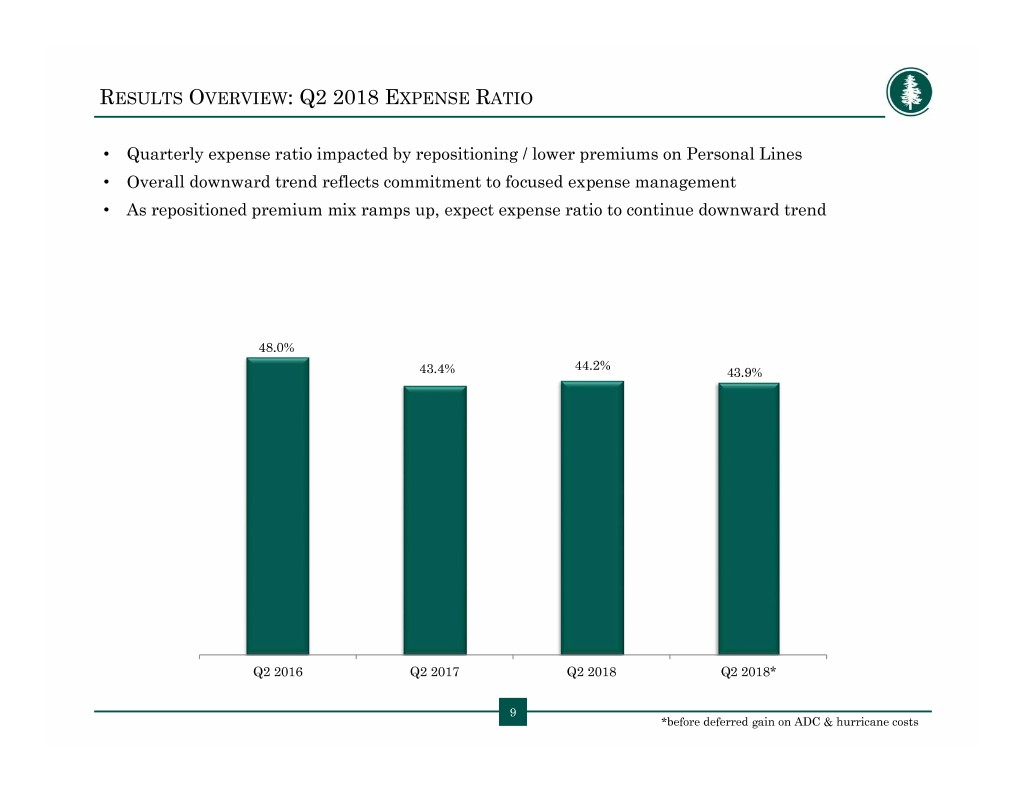
RESULTS OVERVIEW: Q2 2018 EXPENSE RATIO • Quarterly expense ratio impacted by repositioning / lower premiums on Personal Lines • Overall downward trend reflects commitment to focused expense management • As repositioned premium mix ramps up, expect expense ratio to continue downward trend 48.0% 44.2% 43.4% 43.9% Q2 2016 Q2 2017 Q2 2018 Q2 2018* 9 *before deferred gain on ADC & hurricane costs
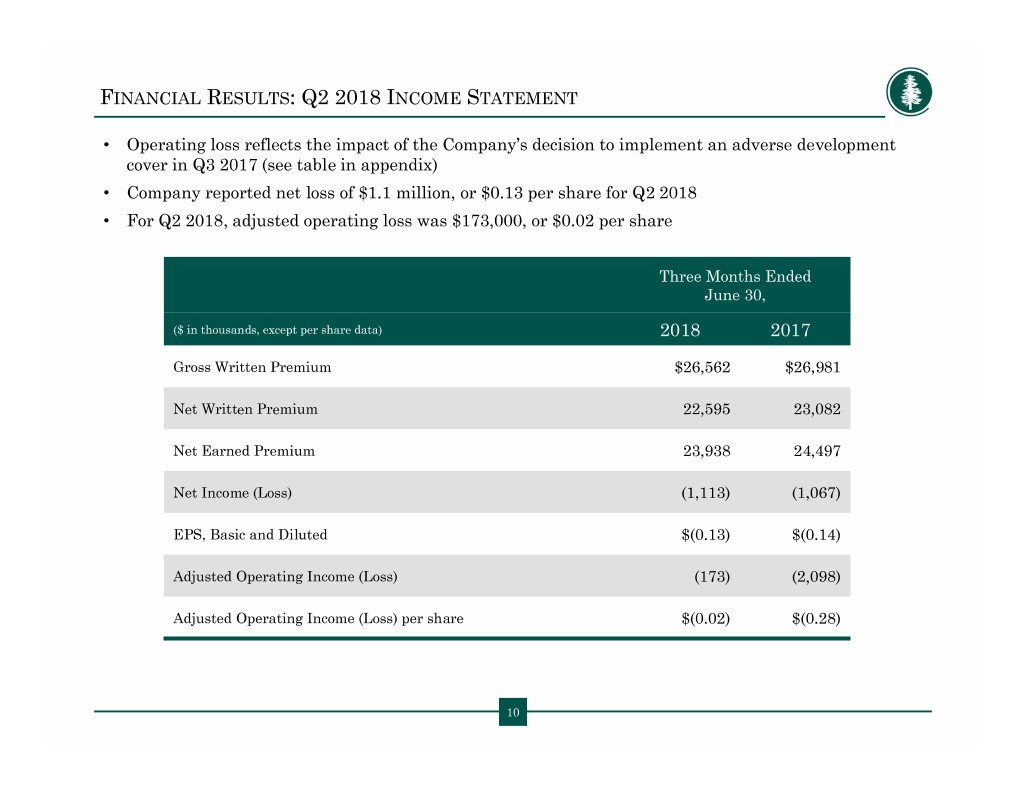
FINANCIAL RESULTS: Q2 2018 INCOME STATEMENT • Operating loss reflects the impact of the Company’s decision to implement an adverse development cover in Q3 2017 (see table in appendix) • Company reported net loss of $1.1 million, or $0.13 per share for Q2 2018 • For Q2 2018, adjusted operating loss was $173,000, or $0.02 per share Three Months Ended June 30, ($ in thousands, except per share data) 2018 2017 Gross Written Premium $26,562 $26,981 Net Written Premium 22,595 23,082 Net Earned Premium 23,938 24,497 Net Income (Loss) (1,113) (1,067) EPS, Basic and Diluted $(0.13) $(0.14) Adjusted Operating Income (Loss) (173) (2,098) Adjusted Operating Income (Loss) per share $(0.02) $(0.28) 10 10
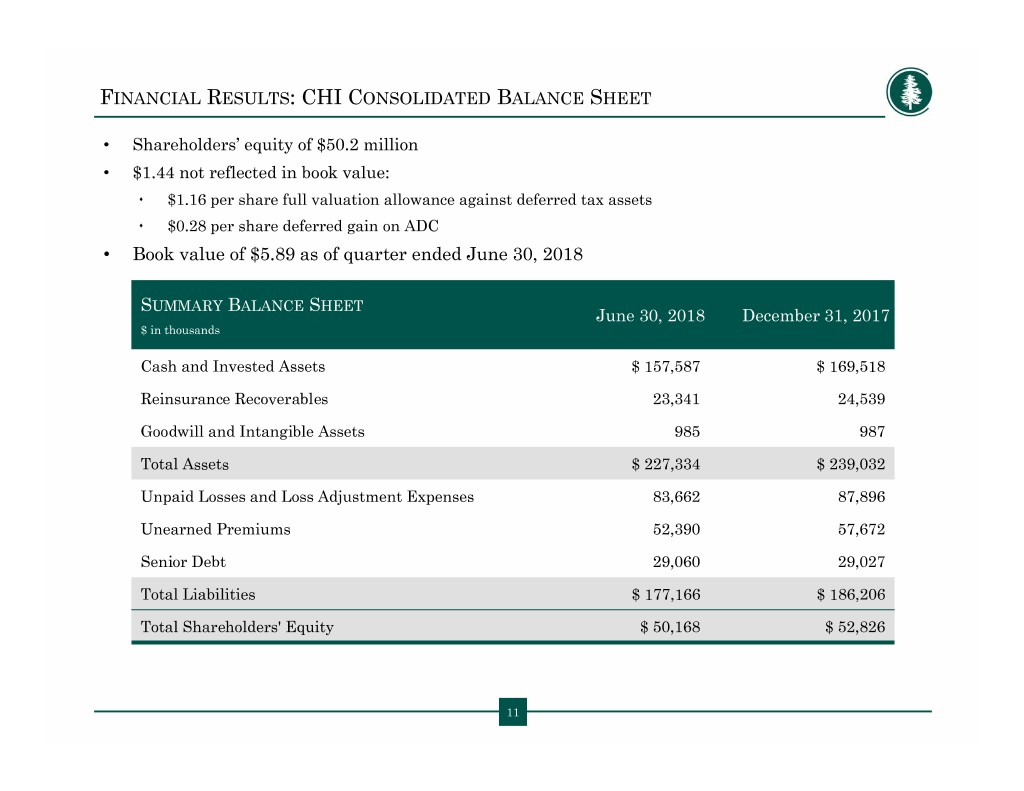
FINANCIAL RESULTS: CHI CONSOLIDATED BALANCE SHEET • Shareholders’ equity of $50.2 million • $1.44 not reflected in book value: $1.16 per share full valuation allowance against deferred tax assets $0.28 per share deferred gain on ADC • Book value of $5.89 as of quarter ended June 30, 2018 SUMMARY BALANCE SHEET June 30, 2018 December 31, 2017 $ in thousands Cash and Invested Assets $ 157,587 $ 169,518 Reinsurance Recoverables 23,341 24,539 Goodwill and Intangible Assets 985 987 Total Assets $ 227,334 $ 239,032 Unpaid Losses and Loss Adjustment Expenses 83,662 87,896 Unearned Premiums 52,390 57,672 Senior Debt 29,060 29,027 Total Liabilities $ 177,166 $ 186,206 Total Shareholders' Equity $ 50,168 $ 52,826 11
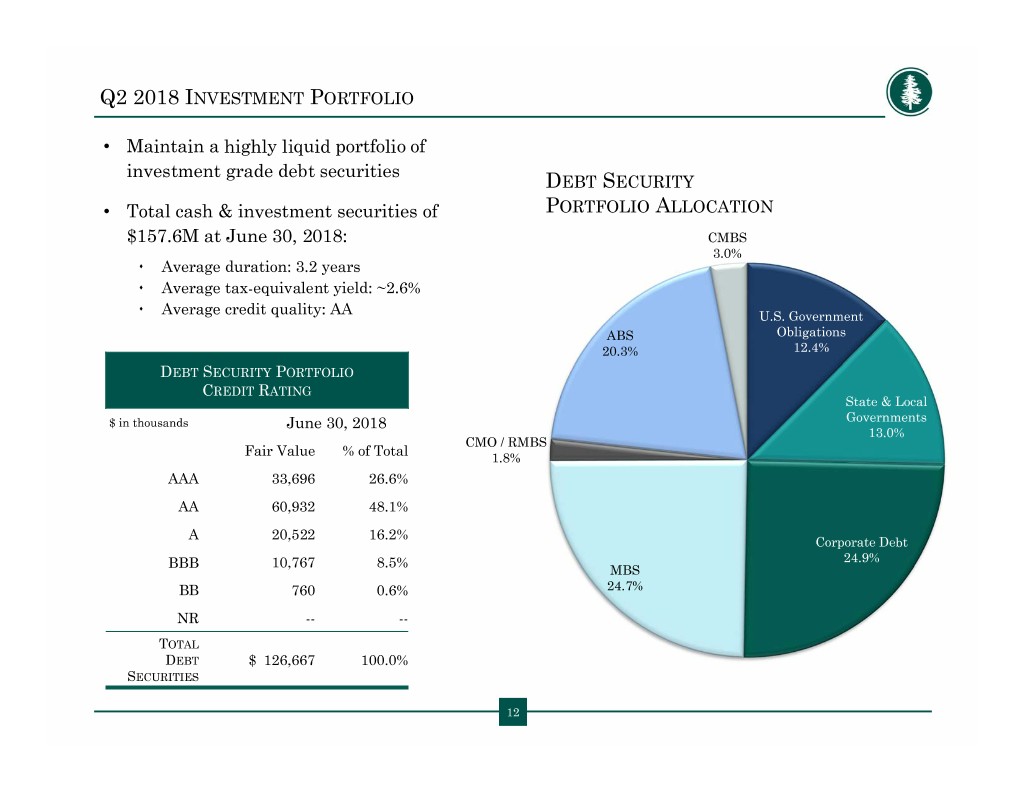
Q2 2018 INVESTMENT PORTFOLIO • Maintain a highly liquid portfolio of investment grade debt securities DEBT SECURITY • Total cash & investment securities of PORTFOLIO ALLOCATION $157.6M at June 30, 2018: CMBS 3.0% Average duration: 3.2 years Average tax-equivalent yield: ~2.6% Average credit quality: AA U.S. Government ABS Obligations 20.3% 12.4% DEBT SECURITY PORTFOLIO CREDIT RATING State & Local $ in thousands June 30, 2018 Governments 13.0% CMO / RMBS Fair Value % of Total 1.8% AAA 33,696 26.6% AA 60,932 48.1% A 20,522 16.2% Corporate Debt BBB 10,767 8.5% 24.9% MBS BB 760 0.6% 24.7% NR -- -- TOTAL DEBT $ 126,667 100.0% SECURITIES 12
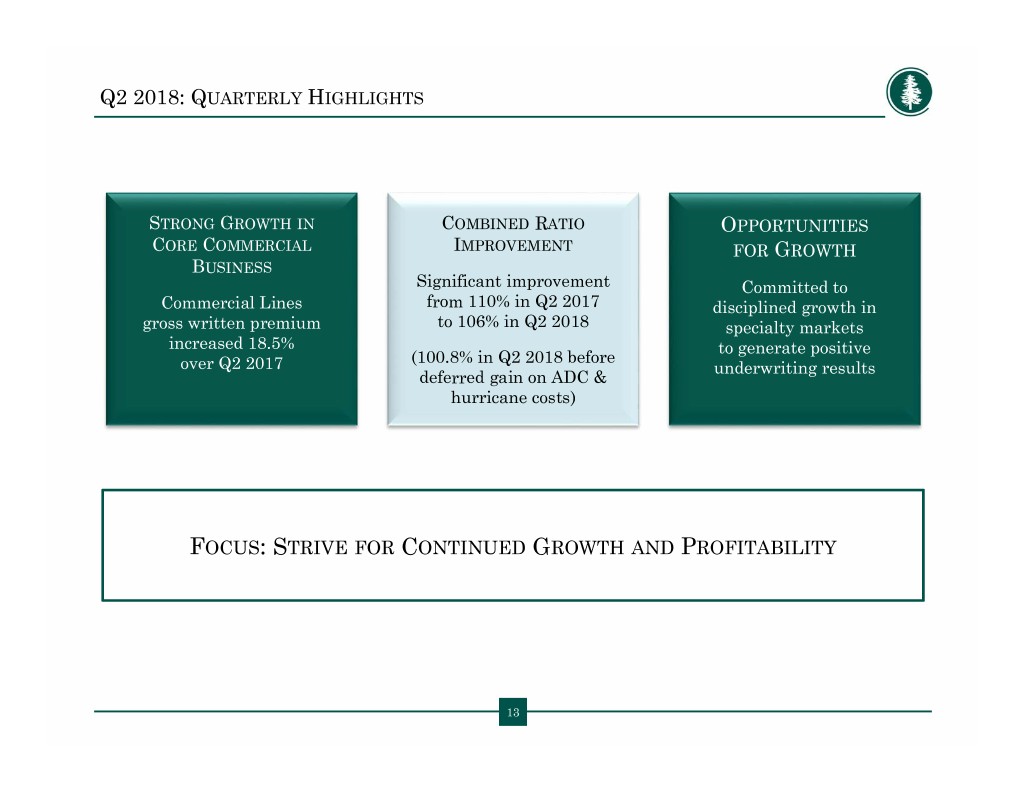
Q2 2018: QUARTERLY HIGHLIGHTS STRONG GROWTH IN COMBINED RATIO OPPORTUNITIES CORE COMMERCIAL IMPROVEMENT FOR GROWTH BUSINESS Significant improvement Committed to Commercial Lines from 110% in Q2 2017 disciplined growth in gross written premium to 106% in Q2 2018 specialty markets increased 18.5% to generate positive (100.8% in Q2 2018 before over Q2 2017 underwriting results deferred gain on ADC & hurricane costs) FOCUS: STRIVE FOR CONTINUED GROWTH AND PROFITABILITY 13
