Attached files
| file | filename |
|---|---|
| 8-K - 8-K - BP Midstream Partners LP | q2-2018resultspr8xk.htm |
FOR IMMEDIATE RELEASE Houston August 9, 2018 |  |
BP Midstream Partners LP (NYSE: BPMP) Exhibit 99.1
Second Quarter 2018 Results
Strong earnings and cash available for distribution, increased distribution
Highlights | - • BPMP delivers another quarter of strong operational and financial performance.• Exceeds the IPO forecasts for Net Income, Adjusted EBITDA and Cash available for distribution attributable to the Partnership.• Continued growth in earnings and cash available for distribution underpins increased distribution of half a cent over the first quarter distribution and one cent over the minimum quarterly distribution.• Full year 2018 Cash available for distribution guidance revised up to $130-135 million (from $126 million).GAAP Measures: • Net income attributable to the Partnership in the quarter was $30.5 million (or $0.29 per unit), exceeding the IPO forecast of $27.0 million for the same period.• Cash from operating activities was $45.8 million for the three months ended June 30, 2018.• Cash on hand was $40.5 million at June 30, 2018.• Outstanding borrowings were $0 under our $600.0 million unsecured revolving credit facility with an affiliate of BP at June 30, 2018.Non-GAAP Measures: • Adjusted EBITDA* attributable to the Partnership in the quarter was $33.6 million, compared with the IPO forecast of $29.3 million for the same period.• Cash available for distribution* attributable to the Partnership generated in the quarter was $32.5 million, compared with the IPO forecast of $29.2 million for the same period.• Quarterly cash distribution: On July 18, 2018, the board of directors of the general partner of BPMP declared an increased quarterly cash distribution of $0.2725 per unit for the second quarter of 2018; an increase of $0.0100 over the Partnership’s minimum quarterly distribution.• Distribution coverage ratio was 1.14 times for the period.* Adjusted EBITDA and cash available for distribution are Non-GAAP supplemental financial measures. See reconciliation tables later in this press release. |
Second Quarter | 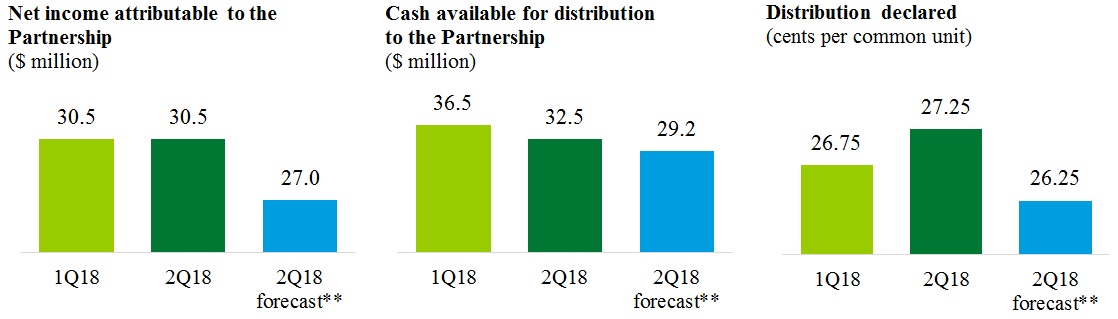 ** This represents the 2Q18 IPO forecast in our Prospectus dated October 25, 2017. |
Webcast and Conference Call | A webcast and conference call will be held at 9:00 a.m. CDT on August 9, 2018, hosted by Robert Zinsmeister, Chief Executive Officer, Craig Coburn, Chief Financial Officer, and Brian Sullivan, Vice President Investor Relations, to discuss BPMP’s performance in the second quarter 2018. Interested parties may listen to the presentation at www.bpmidstreampartners.com, by clicking on the “2018 Second Quarter Financial Results Webcast” link, found under the "Events & presentations" section. A replay of the webcast will be available following the live event. The Partnership has also posted an investor presentation to its website. Information on the Partnership's website does not constitute a portion of this press release. |
Robert Zinsmeister – Chief Executive Officer: “Our second quarter operational and financial performance across the asset portfolio was strong, exceeding the IPO forecast for the same period. With continued growth in earnings and cash available for distribution, we increased the quarterly cash distribution by half a cent over the first quarter distribution, and one cent over the minimum quarterly distribution. This clearly demonstrates our commitment to delivering our differentiated investment proposition - to deliver unit holders consistent, top-tier distribution growth.” | |
1
FOR IMMEDIATE RELEASE Houston August 9, 2018 | |
About BP Midstream Partners
BPMP is a fee-based, growth-oriented master limited partnership formed by BP Pipelines (North America), Inc. (“BP Pipelines”) to own, operate, develop and acquire pipelines and other midstream assets. BPMP’s assets consist of interests in entities that own crude oil, natural gas, refined products and diluent pipelines serving as key infrastructure for BP and other customers to transport onshore crude oil production to BP’s Whiting Refinery and offshore crude oil and natural gas production to key refining markets and trading and distribution hubs. Certain of BPMP’s assets deliver refined products and diluent from the Whiting Refinery and other U.S. supply hubs to major demand centers.
For more information on BPMP and the assets owned by BPMP, please visit www.bpmidstreampartners.com.
Factors Affecting Comparability
• | The financial results prior to our initial public offering (the "IPO") on October 30, 2017 only included the results of the BP2, River Rouge and Diamondback pipeline systems and related assets (collectively, “our accounting predecessor”, the “Predecessor”, or the “Wholly Owned Assets”). Our equity method investment, Mars Pipeline Company LLC, and our consolidated subsidiary, Mardi Gras Transportation System Company LLC, are not included in the results of our accounting predecessor. |
• | Effective October 30, 2017, we pay an annual fee to BP Pipelines of $13.3 million, for general and administrative services, and reimburses BP Pipelines for operating services under an omnibus agreement with BP Pipelines. In addition, following the IPO we incur incremental cash expenses associated with being a publicly traded partnership. |
• | Effective October 30, 2017, we entered into commercial agreements that contain minimum volume commitments with a major related-party customer. These agreements were not in place prior to the IPO. |
• | Federal and state income taxes were reflected on the historical financial statements of our accounting predecessor. BPMP is a non-taxable entity and does not record any income tax expense in its consolidated financial statements. |
Factors affecting comparability are detailed further in the “Factors Affecting the Comparability of Our Financial Results” in our quarterly report on Form 10-Q for the three and six months ended June 30, 2018 filed with the Securities and Exchange Commission (“SEC”) on August 9, 2018.
Cautionary Statement
Certain statements contained in this news release constitute “forward-looking statements” within the meaning of the Private Securities Litigation Reform Act of 1995. These forward-looking statements represent BPMP’s expectations or beliefs concerning future events, and it is possible that the results described in this news release will not be achieved. These forward-looking statements are subject to risks, uncertainties and other factors, many of which are outside of BPMP’s control, which could cause actual results to differ materially from the results discussed in the forward-looking statements. Any forward-looking statement speaks only as of the date on which it is made, and, except as required by law, BPMP does not undertake any obligation to update or revise any forward-looking statement, whether as a result of new information, future events or otherwise. New factors emerge from time to time, and it is not possible for BPMP to predict all such factors. When considering these forward-looking statements, you should keep in mind the risk factors and other cautionary statements found in BPMP’s filings with the SEC, including the annual report on Form 10-K for the year ended December 31, 2017 filed with SEC on March 22, 2018. The risk factors and other factors noted in BPMP’s SEC filings could cause its actual results to differ materially from those contained in any forward-looking statement.
Non-GAAP Financial Measures
This press release includes the terms Adjusted EBITDA and cash available for distribution. Adjusted EBITDA and cash available for distribution are non-GAAP supplemental financial measures that management and external users of our consolidated financial statements, such as industry analysts, investors, lenders and rating agencies, may use to assess:
• | our operating performance as compared to other publicly traded partnerships in the midstream energy industry, without regard to historical cost basis or, in the case of Adjusted EBITDA, financing methods; |
• | the ability of our business to generate sufficient cash to support our decision to make distributions to our unitholders; |
• | our ability to incur and service debt and fund capital expenditures; and |
• | the viability of acquisitions and other capital expenditure projects and the returns on investment of various investment opportunities. |
2
FOR IMMEDIATE RELEASE Houston August 9, 2018 | |
We believe that the presentation of Adjusted EBITDA and cash available for distribution provides useful information to investors in assessing our financial condition and results of operations. The GAAP measures most directly comparable to Adjusted EBITDA and cash available for distribution are net income and net cash provided by operating activities, respectively. Adjusted EBITDA and cash available for distribution should not be considered as an alternative to GAAP net income or net cash provided by operating activities.
Adjusted EBITDA and cash available for distribution have important limitations as analytical tools because they exclude some but not all items that affect net income and net cash provided by operating activities. You should not consider Adjusted EBITDA or cash available for distribution in isolation or as a substitute for analysis of our results as reported under GAAP. Additionally, because Adjusted EBITDA and cash available for distribution may be defined differently by other companies in our industry, our definition of Adjusted EBITDA and cash available for distribution may not be comparable to similarly titled measures of other companies, thereby diminishing its utility.
References to Adjusted EBITDA in this press release refer to net income before net interest expense, income taxes, gain or loss from disposition of property, plant and equipment and depreciation and amortization, plus cash distributed to the Partnership from equity method investments for the applicable period, less income from equity method investments. We define Adjusted EBITDA attributable to the Partnership as Adjusted EBITDA less Adjusted EBITDA attributable to non-controlling interests. We define cash available for distribution as Adjusted EBITDA attributable to the Partnership plus net adjustments from volume deficiency agreements, less maintenance capital expenditures, net interest paid/received, cash reserves, and income taxes paid. Cash available for distribution will not reflect changes in working capital balances.
Further Information
BP Press Office, US: +1 281-366-4463, uspress@bp.com
3
FOR IMMEDIATE RELEASE Houston August 9, 2018 | |
RESULTS OF OPERATIONS (UNAUDITED)
Three Months Ended June 30, | Six Months Ended June 30, | ||||||||||||||||||||||
(in thousands of dollars, unless otherwise indicated) | 2018 | 2018 | 2017 | 2018 | 2018 | 2017 | |||||||||||||||||
IPO Forecast | Predecessor | IPO Forecast | Predecessor | ||||||||||||||||||||
Revenue | $ | 27,222 | $ | 28,935 | $ | 26,885 | $ | 54,032 | $ | 55,554 | $ | 53,528 | |||||||||||
Costs and expenses | |||||||||||||||||||||||
Operating expenses | 4,810 | 4,058 | 3,705 | 9,434 | 7,654 | 7,185 | |||||||||||||||||
Maintenance expenses | 675 | 871 | 921 | 973 | 927 | 1,481 | |||||||||||||||||
Loss/(Gain) from disposition of property, plant and equipment | — | — | (6 | ) | — | — | (6 | ) | |||||||||||||||
General and administrative | 4,000 | 3,857 | 938 | 8,000 | 8,068 | 2,405 | |||||||||||||||||
Depreciation | 727 | 662 | 662 | 1,454 | 1,324 | 1,332 | |||||||||||||||||
Property and other taxes | 161 | 112 | 46 | 261 | 223 | 154 | |||||||||||||||||
Total costs and expenses | 10,373 | 9,560 | 6,266 | 20,122 | 18,196 | 12,551 | |||||||||||||||||
Operating income | 16,849 | 19,375 | 20,619 | 33,910 | 37,358 | 40,977 | |||||||||||||||||
Income from equity method investments | 20,666 | 20,842 | — | 44,410 | 43,681 | — | |||||||||||||||||
Other loss | — | — | 312 | — | — | 488 | |||||||||||||||||
Interest expense, net | 200 | 25 | — | 400 | 139 | — | |||||||||||||||||
Income before income taxes | 37,315 | 40,192 | 20,307 | 77,920 | 80,900 | 40,489 | |||||||||||||||||
Income tax expense | — | — | 7,933 | — | — | 15,816 | |||||||||||||||||
Net income | 37,315 | 40,192 | $ | 12,374 | 77,920 | 80,900 | $ | 24,673 | |||||||||||||||
Less: Net income attributable to non-controlling interests | 10,275 | 9,722 | 21,182 | 19,891 | |||||||||||||||||||
Net income attributable to the Partnership | $ | 27,040 | $ | 30,470 | $ | 56,738 | $ | 61,009 | |||||||||||||||
Net income attributable to the Partnership per limited partner unit - basic and diluted (in dollars): | |||||||||||||||||||||||
Common units | $ | 0.29 | $ | 0.58 | |||||||||||||||||||
Subordinated units | $ | 0.29 | $ | 0.58 | |||||||||||||||||||
Distributions declared per limited partner unit (in dollars): | |||||||||||||||||||||||
Common units | $ | 0.2725 | $ | 0.5400 | |||||||||||||||||||
Subordinated units | $ | 0.2725 | $ | 0.5400 | |||||||||||||||||||
Weighted average number of limited partner units outstanding - basic and diluted (in millions): | |||||||||||||||||||||||
Common units – public | 47.8 | 47.8 | |||||||||||||||||||||
Common units – BP Holdco | 4.6 | 4.6 | |||||||||||||||||||||
Subordinated units – BP Holdco | 52.4 | 52.4 | |||||||||||||||||||||
4
FOR IMMEDIATE RELEASE Houston August 9, 2018 | |
ADDITIONAL FINANCIAL DATA (UNAUDITED)
(in thousands of dollars, except per-unit data and ratio data) | Three Months Ended June 30, 2018 | Six Months Ended June 30, 2018 | |||||
Quarterly distribution declared per unit (in dollars) | $ | 0.2725 | $ | 0.5400 | |||
Adjusted EBITDA attributable to the Partnership | 33,582 | 68,808 | |||||
Cash available for distribution attributable to the Partnership | 32,524 | 69,013 | |||||
Distribution declared: | |||||||
Limited partner units – public | 13,024 | 25,809 | |||||
Limited partner units – BP Holdco | 15,521 | 30,757 | |||||
General partner units – BP Holdco | — | — | |||||
Total distribution declared | 28,545 | 56,566 | |||||
Coverage ratio(1) | 1.14 | 1.22 | |||||
(1) | Coverage ratio is equal to Cash available for distribution attributable to the Partnership divided by Total distribution declared. |
5
FOR IMMEDIATE RELEASE Houston August 9, 2018 | |
RECONCILIATION OF ADJUSTED EBITDA AND CASH AVAILABLE FOR DISTRIBUTION TO NET INCOME
Three Months Ended June 30, | Six Months Ended June 30, | ||||||||||||||||||||||
2018 | 2018 | 2017 | 2018 | 2018 | 2017 | ||||||||||||||||||
(in thousands of dollars) | IPO Forecast | Predecessor | IPO Forecast | Predecessor | |||||||||||||||||||
Net income | $ | 37,315 | $ | 40,192 | $ | 12,374 | $ | 77,920 | $ | 80,900 | $ | 24,673 | |||||||||||
Add: | |||||||||||||||||||||||
Depreciation | 727 | 662 | 662 | 1,454 | 1,324 | 1,332 | |||||||||||||||||
Gain from disposition of property, plant and equipment | — | — | (6 | ) | — | — | (6 | ) | |||||||||||||||
Income tax expense | — | — | 7,933 | — | — | 15,816 | |||||||||||||||||
Interest expense, net | 200 | 25 | — | 400 | 139 | — | |||||||||||||||||
Cash distribution received from equity method investments – Mars | 8,408 | 10,118 | — | 19,381 | 22,943 | — | |||||||||||||||||
Cash distribution received from equity method investments – Mardi Gras Joint Ventures | 16,825 | 17,135 | — | 34,920 | 35,917 | — | |||||||||||||||||
Less: | |||||||||||||||||||||||
Income from equity method investments – Mars | 7,823 | 8,689 | — | 17,933 | 18,816 | — | |||||||||||||||||
Income from equity method investments – Mardi Gras Joint Ventures | 12,843 | 12,153 | — | 26,477 | 24,865 | — | |||||||||||||||||
Adjusted EBITDA | 42,809 | 47,290 | $ | 20,963 | 89,665 | 97,542 | 41,815 | ||||||||||||||||
Less: | |||||||||||||||||||||||
Adjusted EBITDA attributable to non-controlling interests | 13,460 | 13,708 | 27,936 | 28,734 | |||||||||||||||||||
Adjusted EBITDA attributable to the Partnership | 29,349 | 33,582 | 61,729 | 68,808 | |||||||||||||||||||
Add: | |||||||||||||||||||||||
Net adjustments from volume deficiency agreements | — | (509 | ) | — | 823 | ||||||||||||||||||
Less: | |||||||||||||||||||||||
Net interest paid/(received) | 300 | 162 | 400 | 146 | |||||||||||||||||||
Maintenance capital expenditures | (160 | ) | 387 | 441 | 472 | ||||||||||||||||||
Cash available for distribution attributable to the Partnership | $ | 29,209 | $ | 32,524 | $ | 60,888 | $ | 69,013 | |||||||||||||||
6
FOR IMMEDIATE RELEASE Houston August 9, 2018 | |
RECONCILIATION OF ADJUSTED EBITDA AND CASH AVAILABLE FOR DISTRIBUTION TO NET CASH PROVIDED BY OPERATING ACTIVITIES
Three Months Ended June 30, | Six Months Ended June 30, | ||||||||||||||
2018 | 2017 | 2018 | 2017 | ||||||||||||
(in thousands of dollars) | Predecessor | Predecessor | |||||||||||||
Net cash provided by operating activities | $ | 45,777 | 9,614 | $ | 87,837 | $ | 20,448 | ||||||||
Add: | |||||||||||||||
Income tax expense | — | 7,933 | — | 15,816 | |||||||||||
Interest expense, net | 25 | — | 139 | — | |||||||||||
Distributions in excess of earnings from equity method investments | 4,983 | — | 11,053 | — | |||||||||||
Change in other assets and liabilities | (3,450 | ) | 4,034 | (1,403 | ) | 6,682 | |||||||||
Less: | |||||||||||||||
Non-cash adjustments | 45 | 618 | 84 | 1,131 | |||||||||||
Adjusted EBITDA | 47,290 | $ | 20,963 | 97,542 | $ | 41,815 | |||||||||
Less: | |||||||||||||||
Adjusted EBITDA attributable to non-controlling interests | 13,708 | 28,734 | |||||||||||||
Adjusted EBITDA attributable to the Partnership | 33,582 | 68,808 | |||||||||||||
Add: | |||||||||||||||
Net adjustments from volume deficiency agreements | (509 | ) | 823 | ||||||||||||
Less: | |||||||||||||||
Net interest paid/(received) | 162 | 146 | |||||||||||||
Maintenance capital expenditures | 387 | 472 | |||||||||||||
Cash available for distribution attributable to the Partnership | $ | 32,524 | $ | 69,013 | |||||||||||
7
FOR IMMEDIATE RELEASE Houston August 9, 2018 | |
SELECTED OPERATING DATA (UNAUDITED)
Three Months Ended June 30, | Six Months Ended June 30, | ||||||||||||||
Pipeline throughput (thousands of barrels per day) (1)(2) | 2018 | 2017 | 2018 | 2017 | |||||||||||
BP2 | 295 | 281 | 291 | 277 | |||||||||||
Diamondback | 73 | 58 | 77 | 62 | |||||||||||
River Rouge | 65 | 60 | 63 | 60 | |||||||||||
Total Wholly Owned Assets | 433 | 399 | 431 | 399 | |||||||||||
Mars | 451 | 506 | 458 | 473 | |||||||||||
Caesar | 174 | 218 | 190 | 220 | |||||||||||
Cleopatra (3) | 21 | 24 | 22 | 26 | |||||||||||
Proteus | 175 | 154 | 179 | 161 | |||||||||||
Endymion | 175 | 154 | 179 | 161 | |||||||||||
Mardi Gras Joint Ventures | 545 | 550 | 570 | 568 | |||||||||||
Average revenue per barrel ($ per barrel)(2)(4) | |||||||||||||||
Total Wholly Owned Assets | $ | 0.73 | $ | 0.74 | $ | 0.71 | $ | 0.74 | |||||||
Mars | 1.15 | 1.35 | 1.20 | 1.40 | |||||||||||
Mardi Gras Joint Ventures | 0.65 | 0.67 | 0.65 | 0.67 | |||||||||||
(1) | Pipeline throughput is defined as the volume of delivered barrels. |
(2) | Interests in Mars and Mardi Gras were contributed to the Partnership on October 30, 2017. Throughput and average revenue per barrel for Mars and the Mardi Gras Joint Ventures are presented on a 100% basis for the three and six months ended June 30, 2018 and 2017. Data presented for Mars and Mardi Gras Joint Ventures for the three and six months ended June 30, 2017 are for informational purposes only and are not included in our Predecessor financial results. |
(3) | Natural gas is converted to oil equivalent at 5.8 million cubic feet per one thousand barrels. |
(4) | Based on reported revenues from transportation and allowance oil divided by delivered barrels over the same time period. |
8
FOR IMMEDIATE RELEASE Houston August 9, 2018 | |
CAPITAL EXPENDITURES(1) (UNAUDITED)
Three Months Ended June 30, | Six Months Ended June 30, | ||||||||||||||
2018 | 2017 | 2018 | 2017 | ||||||||||||
(in thousands of dollars) | Predecessor | Predecessor | |||||||||||||
Cash spent on maintenance capital expenditures | $ | 387 | $ | 470 | $ | 472 | $ | 1,840 | |||||||
Increase/(Decrease) in accrued capital expenditures | — | (453 | ) | 179 | (1,351 | ) | |||||||||
Total capital expenditures incurred | $ | 387 | $ | 17 | $ | 651 | $ | 489 | |||||||
(1) | Capital expenditures presented above are related to the Wholly Owned Assets. |
9
FOR IMMEDIATE RELEASE Houston August 9, 2018 | |
SELECTED BALANCE SHEET DATA (UNAUDITED)
(in thousands of dollars) | June 30, 2018 | December 31, 2017 | |||||
Cash and cash equivalents | $ | 40,527 | $ | 32,694 | |||
Property, plant and equipment, net | 68,815 | 69,488 | |||||
Total assets | 594,499 | 605,658 | |||||
Short-term debt | — | 15,000 | |||||
Equity | 583,508 | 580,855 | |||||
August 9, 2018
The information in this release reflects the unaudited consolidated financial position and results of BP Midstream Partners LP.
10