Attached files
| file | filename |
|---|---|
| 8-K - 8-K - ARENA PHARMACEUTICALS INC | arna-8k_20180809.htm |

Corporate Presentation August 2018 Exhibit 99.1
This presentation includes forward-looking statements that involve a number of risks and uncertainties, including statements about the Arena investment thesis, catalysts, value, our investigative stage drug candidates, including with respect to their potential (including to become first or best-in-class), safety, efficacy, indications, significance of data, development plans, differentiation, the market and unmet needs and commercialization, expected data readouts and initiation of new clinical trials; our focus, goals, strategy, plans, timelines and guidance; our partnered programs; financial and other guidance; and other statements that are not historical facts, including statements that may include words such as “may,” “will,” “intend,” “plan,” “expect,” “potential,” “opportunity” or other similar words. For such statements, we claim the protection of the Private Securities Litigation Reform Act of 1995. Actual events or results may differ materially from expectations, and you are cautioned not to place undue reliance on these forward-looking statements, which speak only as of the time they were made. Factors that could cause actual results to differ materially from such statements include, without limitation: we expect to need additional funds to advance all of our programs, and you and others may not agree with the manner in which we allocate our resources; topline data may not accurately reflect the complete results of a particular study or trial; results of clinical trials and other studies are subject to different interpretations and may not be predictive of future results; clinical and nonclinical data is voluminous and detailed, and regulatory agencies may interpret or weigh the importance of data differently and reach different conclusions than Arena or others, request additional information, have additional recommendations or change their guidance or requirements; the timing and outcome of research, development and regulatory review is uncertain; unexpected or unfavorable new data; our drug candidates may not advance in development or be approved for marketing; clinical trials and other studies may not proceed at the time or in the manner expected or at all; enrolling patients in our ongoing and intended clinical trials is competitive and challenging; data and information related to our programs may not meet regulatory requirements or otherwise be sufficient for further development, regulatory review, partnering or approval; other risks related to developing, seeking regulatory approval of and commercializing drugs, including regulatory, manufacturing, supply and marketing issues and drug availability; Arena's and third parties' intellectual property rights; competition; reimbursement and pricing decisions; risks related to relying on partners and other third parties; and satisfactory resolution of litigation or other disagreements. Additional factors that could cause actual results to differ materially from those stated or implied by our forward-looking statements are disclosed in our Securities and Exchange Commission (SEC) filings, including under the heading “Risk Factors.” We disclaim any intent or obligation to update these forward-looking statements, other than as may be required under applicable law. Forward Looking Statements
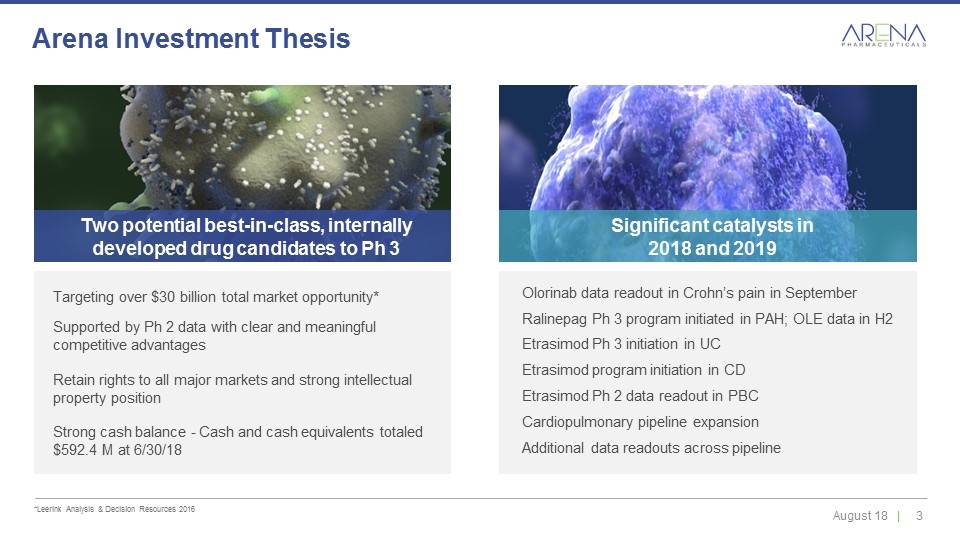
*Leerink Analysis & Decision Resources 2016 Arena Investment Thesis Two potential best-in-class, internally developed drug candidates to Ph 3 Olorinab data readout in Crohn’s pain in September Ralinepag Ph 3 program initiated in PAH; OLE data in H2 Etrasimod Ph 3 initiation in UC Etrasimod program initiation in CD Etrasimod Ph 2 data readout in PBC Cardiopulmonary pipeline expansion Additional data readouts across pipeline Targeting over $30 billion total market opportunity* Supported by Ph 2 data with clear and meaningful competitive advantages Retain rights to all major markets and strong intellectual property position Strong cash balance - Cash and cash equivalents totaled $592.4 M at 6/30/18 Significant catalysts in 2018 and 2019
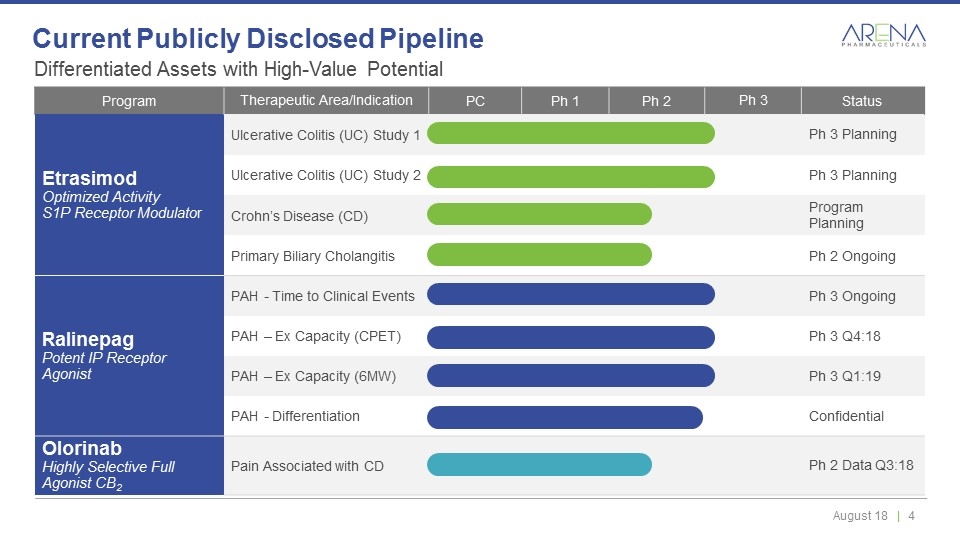
Differentiated Assets with High-Value Potential Current Publicly Disclosed Pipeline Program Therapeutic Area/Indication PC Ph 1 Ph 2 Ph 3 Status Etrasimod Optimized Activity S1P Receptor Modulator Ulcerative Colitis (UC) Study 1 Ph 3 Planning Ulcerative Colitis (UC) Study 2 Ph 3 Planning Crohn’s Disease (CD) Program Planning Primary Biliary Cholangitis Ph 2 Ongoing Ralinepag Potent IP Receptor Agonist PAH - Time to Clinical Events Ph 3 Ongoing PAH – Ex Capacity (CPET) Ph 3 Q4:18 PAH – Ex Capacity (6MW) Ph 3 Q1:19 PAH - Differentiation Confidential Olorinab Highly Selective Full Agonist CB2 Pain Associated with CD Ph 2 Data Q3:18
Oral, Next Generation, S1P Receptor Modulator with Optimized Activity Being Evaluated for Multiple Immune-Inflammatory Diseases Etrasimod
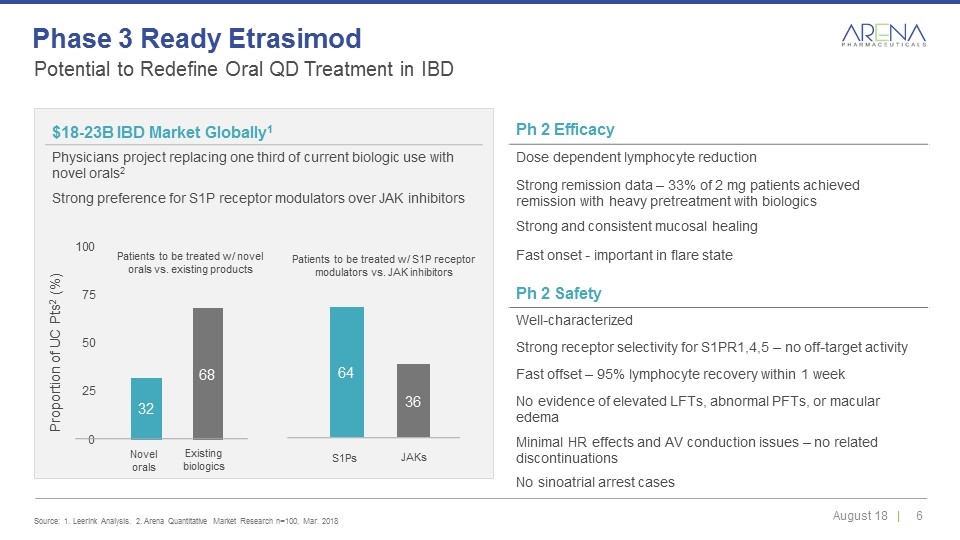
Ph 2 Efficacy Dose dependent lymphocyte reduction Strong remission data – 33% of 2 mg patients achieved remission with heavy pretreatment with biologics Strong and consistent mucosal healing Fast onset - important in flare state Novel orals Existing biologics S1Ps JAKs $18-23B IBD Market Globally1 Physicians project replacing one third of current biologic use with novel orals2 Strong preference for S1P receptor modulators over JAK inhibitors Ph 2 Safety Well-characterized Strong receptor selectivity for S1PR1,4,5 – no off-target activity Fast offset – 95% lymphocyte recovery within 1 week No evidence of elevated LFTs, abnormal PFTs, or macular edema Minimal HR effects and AV conduction issues – no related discontinuations No sinoatrial arrest cases Patients to be treated w/ novel orals vs. existing products Patients to be treated w/ S1P receptor modulators vs. JAK inhibitors Potential to Redefine Oral QD Treatment in IBD Source: 1. Leerink Analysis. 2. Arena Quantitative Market Research n=100, Mar. 2018 Phase 3 Ready Etrasimod
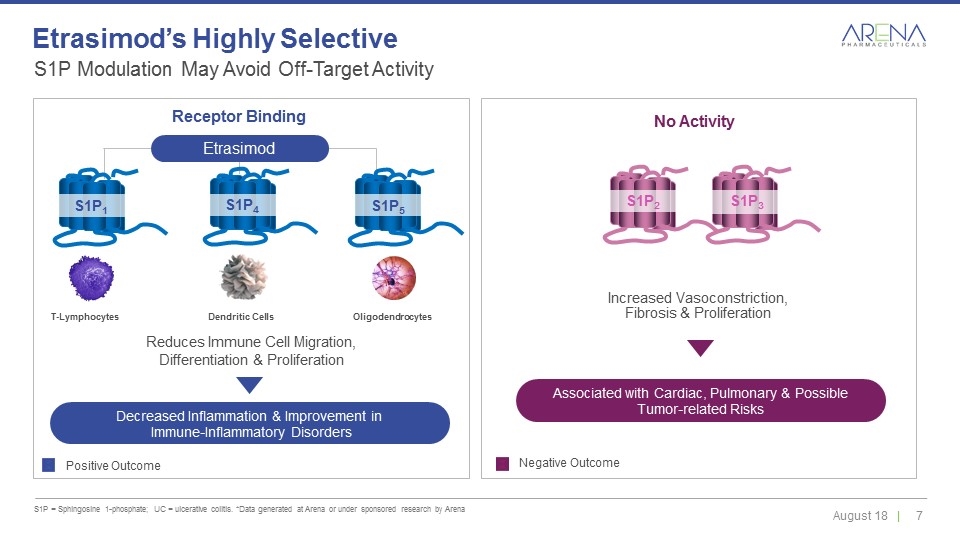
S1P Modulation May Avoid Off-Target Activity S1P = Sphingosine 1-phosphate; UC = ulcerative colitis. *Data generated at Arena or under sponsored research by Arena Etrasimod’s Highly Selective Etrasimod Decreased Inflammation & Improvement in Immune-Inflammatory Disorders Positive Outcome Negative Outcome Reduces Immune Cell Migration, Differentiation & Proliferation Increased Vasoconstriction, Fibrosis & Proliferation No Activity Receptor Binding Dendritic Cells T-Lymphocytes Oligodendrocytes S1P1 S1P4 S1P5 S1P2 S1P3 Associated with Cardiac, Pulmonary & Possible Tumor-related Risks
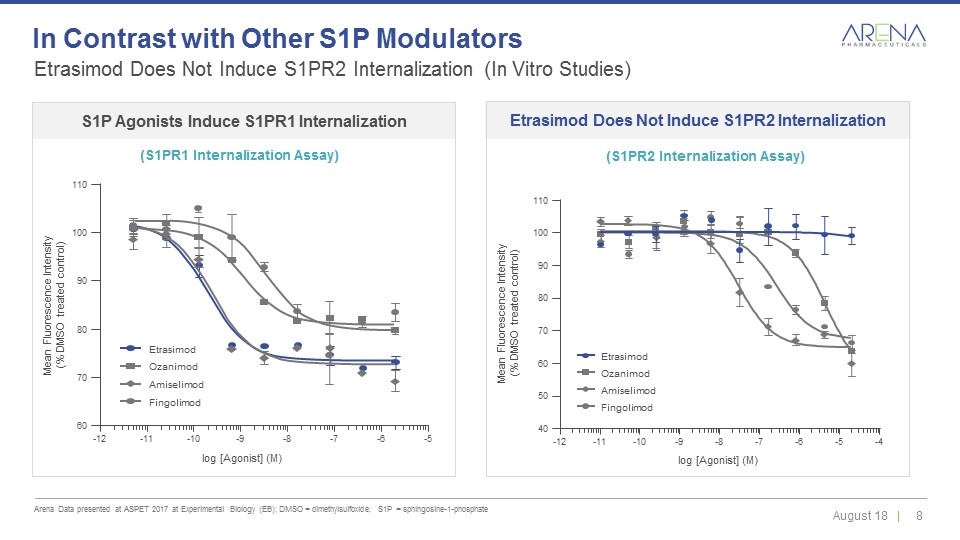
Etrasimod Does Not Induce S1PR2 Internalization (In Vitro Studies) Arena Data presented at ASPET 2017 at Experimental Biology (EB); DMSO = dimethylsulfoxide; S1P = sphingosine-1-phosphate In Contrast with Other S1P Modulators -12 -11 -10 -9 -8 -7 -6 -5 log [Agonist] (M) Mean Fluorescence Intensity (% DMSO treated control) 60 80 90 100 110 70 Etrasimod Fingolimod Ozanimod Amiselimod -12 -11 -10 -9 -8 -7 -6 -5 -4 log [Agonist] (M) Mean Fluorescence Intensity (% DMSO treated control) 40 80 90 100 110 50 60 70 Etrasimod Fingolimod Ozanimod Amiselimod S1P Agonists Induce S1PR1 Internalization (S1PR1 Internalization Assay) Etrasimod Does Not Induce S1PR2 Internalization (S1PR2 Internalization Assay)
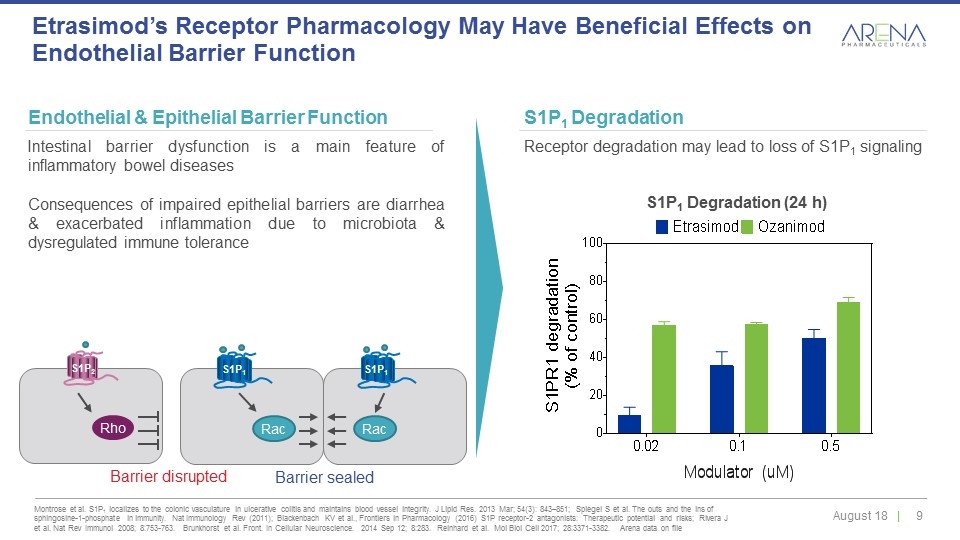
Montrose et al. S1P1 localizes to the colonic vasculature in ulcerative colitis and maintains blood vessel integrity. J Lipid Res. 2013 Mar; 54(3): 843–851; Spiegel S et al. The outs and the ins of sphingosine-1-phosphate in immunity. Nat Immunology Rev (2011); Blackenbach KV et al., Frontiers in Pharmacology (2016) S1P receptor-2 antagonists: Therapeutic potential and risks; Rivera J et al. Nat Rev Immunol 2008; 8:753-763. Brunkhorst et al. Front. In Cellular Neuroscience. 2014 Sep 12; 8:283. Reinhard et al. Mol Biol Cell 2017; 28:3371-3382. Arena data on file Etrasimod’s Receptor Pharmacology May Have Beneficial Effects on Endothelial Barrier Function Endothelial & Epithelial Barrier Function Intestinal barrier dysfunction is a main feature of inflammatory bowel diseases Consequences of impaired epithelial barriers are diarrhea & exacerbated inflammation due to microbiota & dysregulated immune tolerance S1P1 Degradation Receptor degradation may lead to loss of S1P1 signaling S1P1 Degradation (24 h) S1P1 S1P1 Rac Rac Barrier sealed Rho Barrier disrupted S1P2
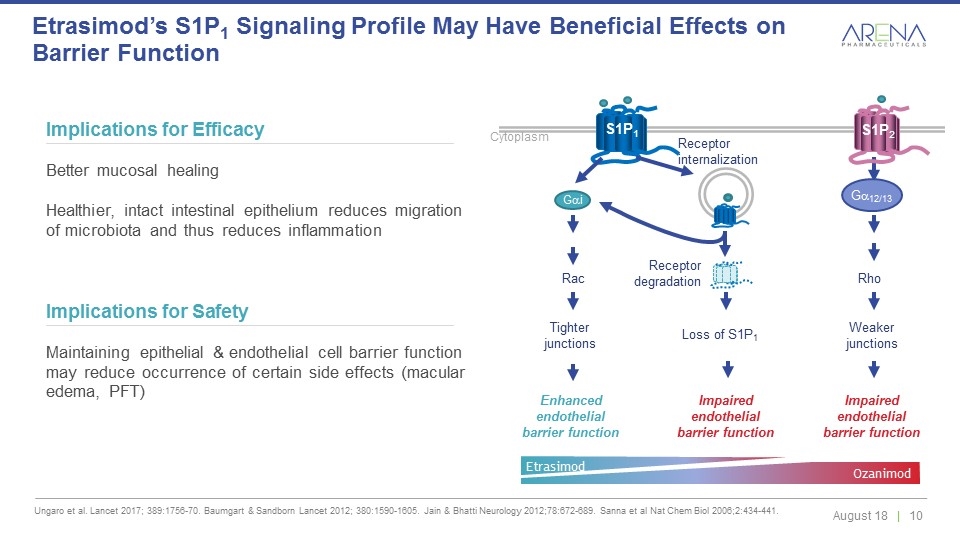
Ungaro et al. Lancet 2017; 389:1756-70. Baumgart & Sandborn Lancet 2012; 380:1590-1605. Jain & Bhatti Neurology 2012;78:672-689. Sanna et al Nat Chem Biol 2006;2:434-441. Etrasimod’s S1P1 Signaling Profile May Have Beneficial Effects on Barrier Function Implications for Efficacy Better mucosal healing Healthier, intact intestinal epithelium reduces migration of microbiota and thus reduces inflammation Implications for Safety Maintaining epithelial & endothelial cell barrier function may reduce occurrence of certain side effects (macular edema, PFT) Receptor internalization Receptor degradation S1P1 Gai Cytoplasm Loss of S1P1 Enhanced endothelial barrier function Tighter junctions Impaired endothelial barrier function Impaired endothelial barrier function Rac Rho Weaker junctions Ga12/13 S1P2 Etrasimod Ozanimod
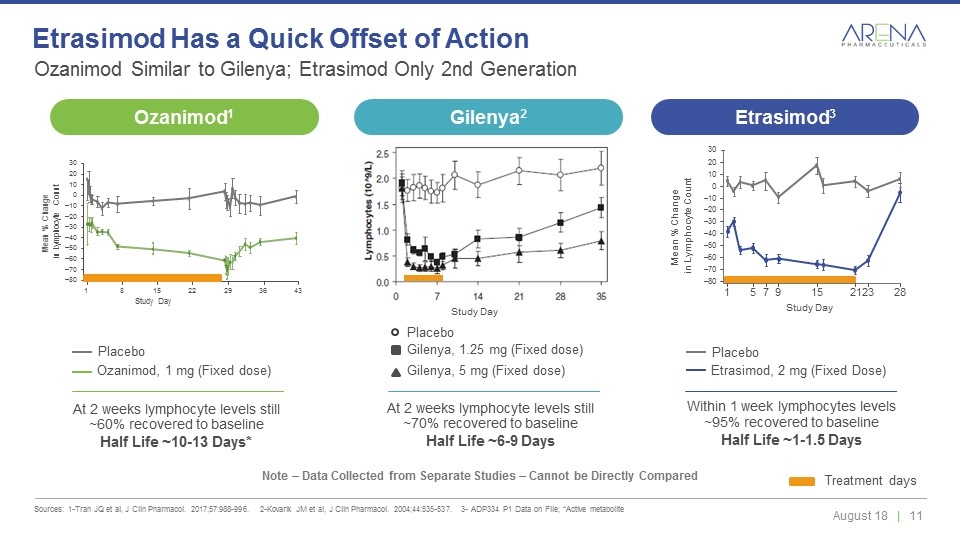
Ozanimod Similar to Gilenya; Etrasimod Only 2nd Generation Sources: 1-Tran JQ et al, J Clin Pharmacol. 2017;57:988-996. 2-Kovarik JM et al, J Clin Pharmacol. 2004;44:535-537. 3- ADP334 P1 Data on File; *Active metabolite Etrasimod Has a Quick Offset of Action Note – Data Collected from Separate Studies – Cannot be Directly Compared Ozanimod, 1 mg (Fixed dose) Placebo Etrasimod, 2 mg (Fixed Dose) Placebo Within 1 week lymphocytes levels ~95% recovered to baseline Half Life ~1-1.5 Days At 2 weeks lymphocyte levels still ~60% recovered to baseline Half Life ~10-13 Days* Treatment days Study Day 30 Mean % Change in Lymphocyte Count 20 10 0 –10 –20 –30 –40 –50 –60 –70 –80 1 5 7 9 15 21 23 28 At 2 weeks lymphocyte levels still ~70% recovered to baseline Half Life ~6-9 Days Study Day Gilenya, 1.25 mg (Fixed dose) Gilenya, 5 mg (Fixed dose) Placebo Study Day 30 20 10 0 –10 –20 –30 –40 –50 –60 –70 –80 1 8 15 22 29 36 43 Mean % Change in Lymphocyte Count Ozanimod1 Gilenya2 Etrasimod3
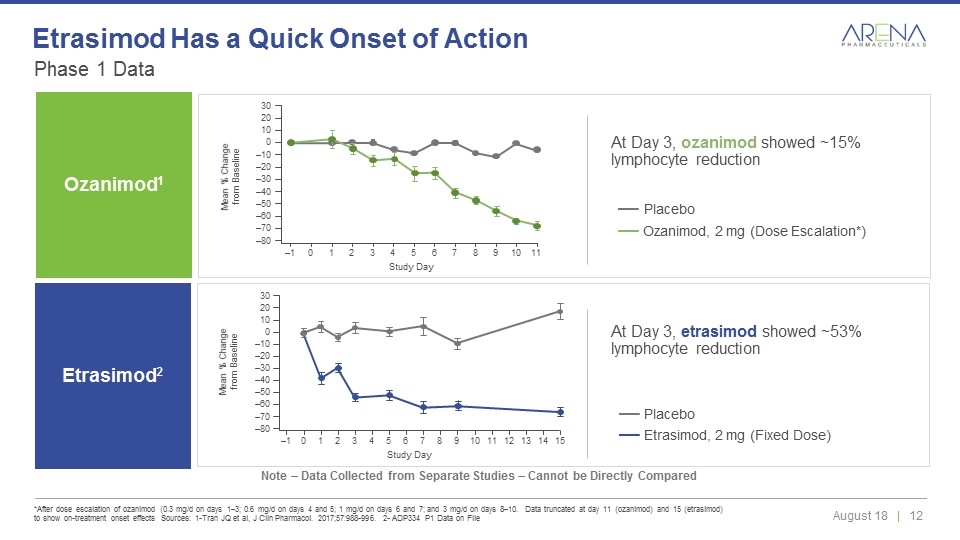
Phase 1 Data *After dose escalation of ozanimod (0.3 mg/d on days 1–3; 0.6 mg/d on days 4 and 5; 1 mg/d on days 6 and 7; and 3 mg/d on days 8–10. Data truncated at day 11 (ozanimod) and 15 (etrasimod) to show on-treatment onset effects Sources: 1-Tran JQ et al, J Clin Pharmacol. 2017;57:988-996. 2- ADP334 P1 Data on File Etrasimod Has a Quick Onset of Action Note – Data Collected from Separate Studies – Cannot be Directly Compared Ozanimod1 Ozanimod, 2 mg (Dose Escalation*) Placebo Mean % Change from Baseline 30 20 10 0 –10 –20 –30 –40 –50 –60 –70 –80 –1 0 1 2 3 4 5 6 7 8 9 10 11 Study Day Study Day 30 20 10 0 –10 –20 –30 –40 –50 –60 –70 –80 –1 0 1 2 3 4 5 6 7 8 9 10 11 12 13 14 15 Mean % Change from Baseline Etrasimod, 2 mg (Fixed Dose) Placebo At Day 3, etrasimod showed ~53% lymphocyte reduction At Day 3, ozanimod showed ~15% lymphocyte reduction Etrasimod2
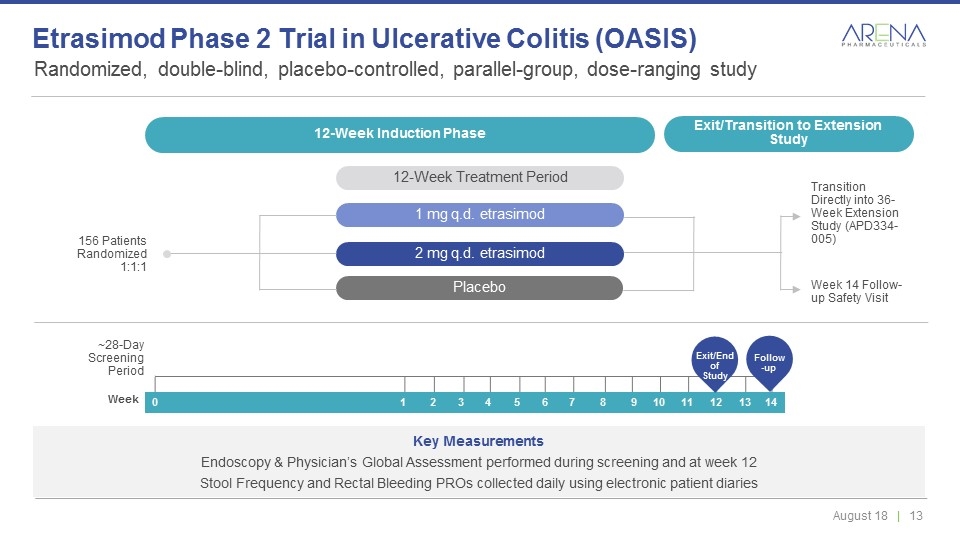
Randomized, double-blind, placebo-controlled, parallel-group, dose-ranging study Etrasimod Phase 2 Trial in Ulcerative Colitis (OASIS) 12-Week Induction Phase 12-Week Treatment Period Transition Directly into 36-Week Extension Study (APD334-005) 156 Patients Randomized 1:1:1 Week 14 Follow-up Safety Visit ~28-Day Screening Period Key Measurements Endoscopy & Physician’s Global Assessment performed during screening and at week 12 Stool Frequency and Rectal Bleeding PROs collected daily using electronic patient diaries 12-Week Induction Phase Exit/Transition to Extension Study 12-Week Treatment Period 1 mg q.d. etrasimod 2 mg q.d. etrasimod Placebo 0 1 2 3 4 5 6 7 8 9 10 11 12 13 14 Week Exit/End of Study Follow-up
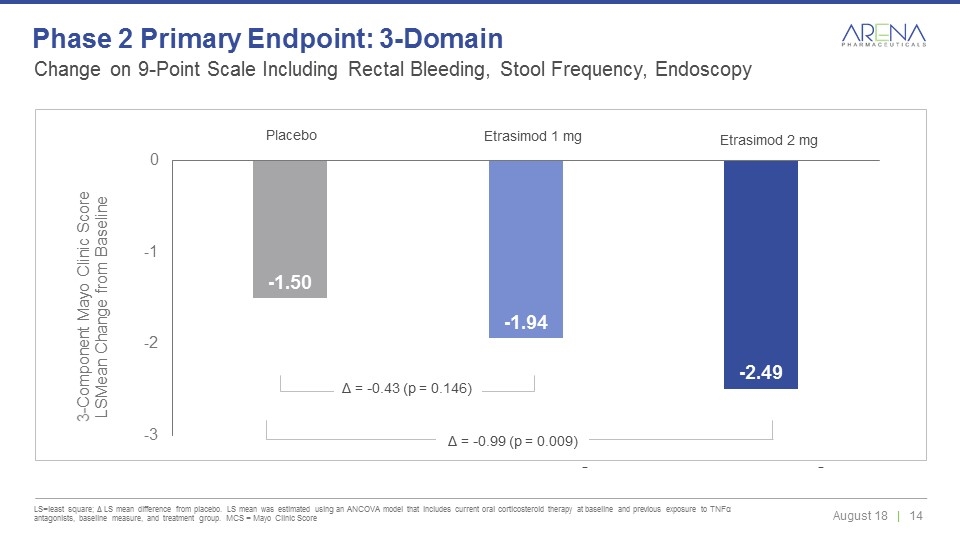
Δ = -0.43 (p = 0.146) Placebo Etrasimod 1 mg Etrasimod 2 mg Δ = -0.99 (p = 0.009) Change on 9-Point Scale Including Rectal Bleeding, Stool Frequency, Endoscopy LS=least square; Δ LS mean difference from placebo. LS mean was estimated using an ANCOVA model that includes current oral corticosteroid therapy at baseline and previous exposure to TNFα antagonists, baseline measure, and treatment group. MCS = Mayo Clinic Score Phase 2 Primary Endpoint: 3-Domain
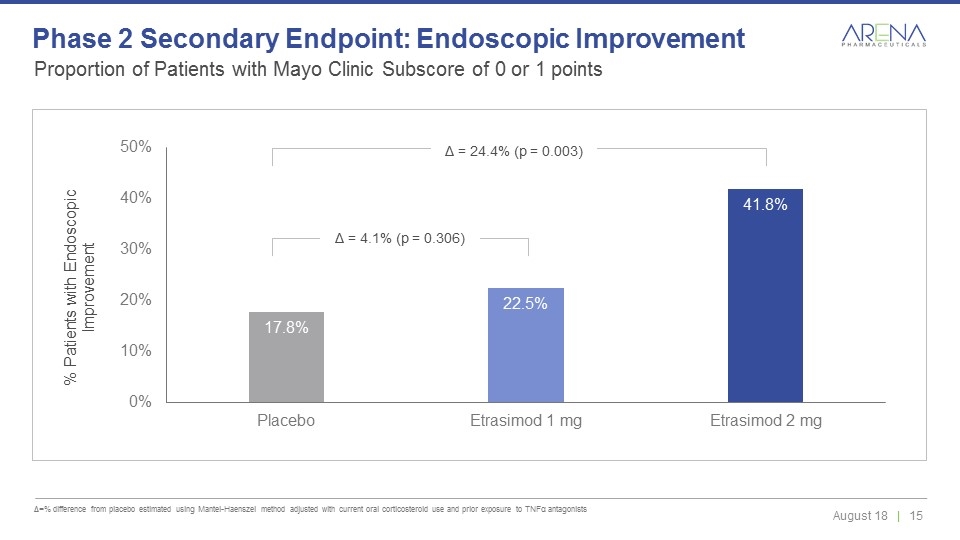
Δ = 4.1% (p = 0.306) Δ = 24.4% (p = 0.003) Proportion of Patients with Mayo Clinic Subscore of 0 or 1 points Δ=% difference from placebo estimated using Mantel-Haenszel method adjusted with current oral corticosteroid use and prior exposure to TNFα antagonists Phase 2 Secondary Endpoint: Endoscopic Improvement
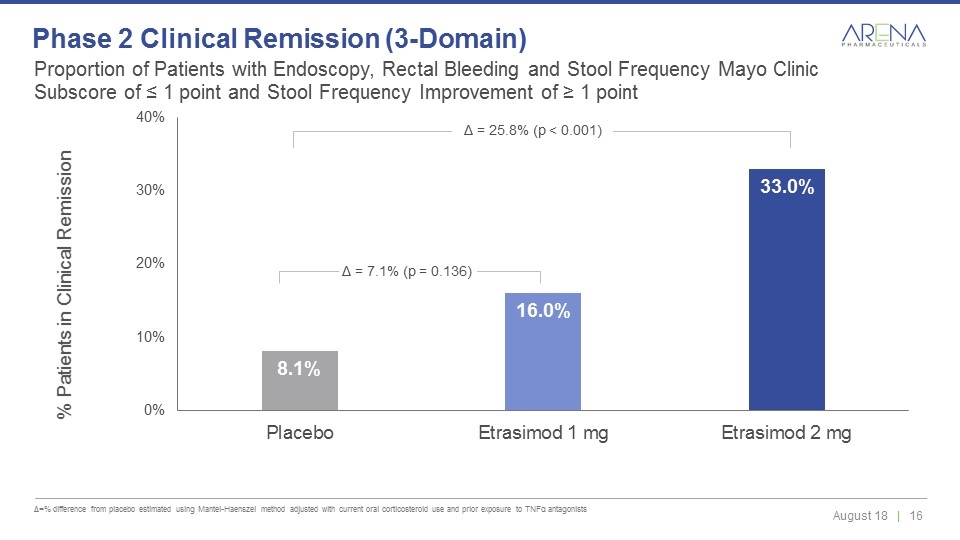
Proportion of Patients with Endoscopy, Rectal Bleeding and Stool Frequency Mayo Clinic Subscore of ≤ 1 point and Stool Frequency Improvement of ≥ 1 point Δ=% difference from placebo estimated using Mantel-Haenszel method adjusted with current oral corticosteroid use and prior exposure to TNFα antagonists Phase 2 Clinical Remission (3-Domain) Δ = 7.1% (p = 0.136) Δ = 25.8% (p < 0.001)
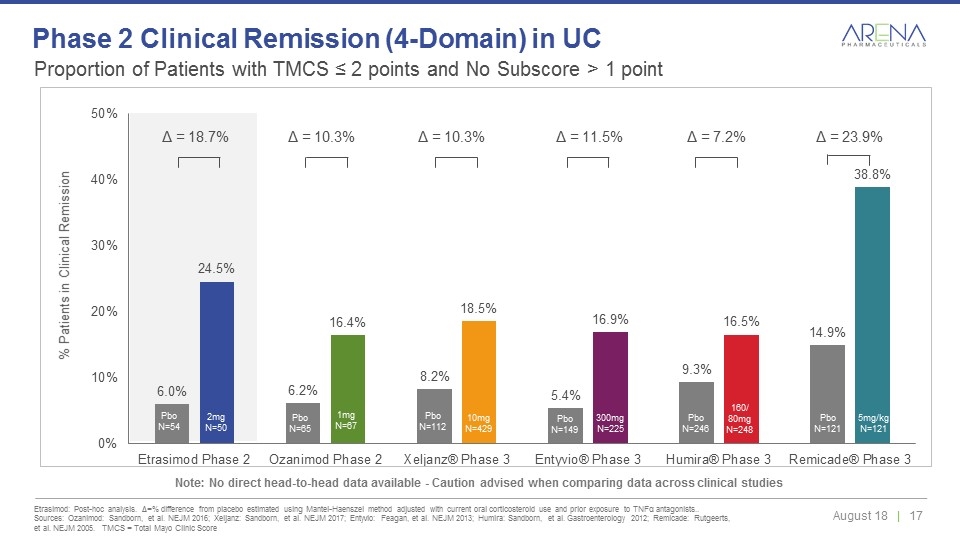
Proportion of Patients with TMCS ≤ 2 points and No Subscore > 1 point Etrasimod: Post-hoc analysis. Δ=% difference from placebo estimated using Mantel-Haenszel method adjusted with current oral corticosteroid use and prior exposure to TNFα antagonists.. Sources: Ozanimod: Sandborn, et al. NEJM 2016; Xeljanz: Sandborn, et al. NEJM 2017; Entyvio: Feagan, et al. NEJM 2013; Humira: Sandborn, et al. Gastroenterology 2012; Remicade: Rutgeerts, et al. NEJM 2005. TMCS = Total Mayo Clinic Score Phase 2 Clinical Remission (4-Domain) in UC Note: No direct head-to-head data available - Caution advised when comparing data across clinical studies Pbo N=65 Pbo N=112 Pbo N=149 Pbo N=121 Pbo N=246 Pbo N=54 1mg N=67 10mg N=429 300mg N=225 5mg/kg N=121 160/ 80mg N=248 2mg N=50 Δ = 10.3% Δ = 10.3% Δ = 11.5% Δ = 7.2% Δ = 23.9% Δ = 18.7%
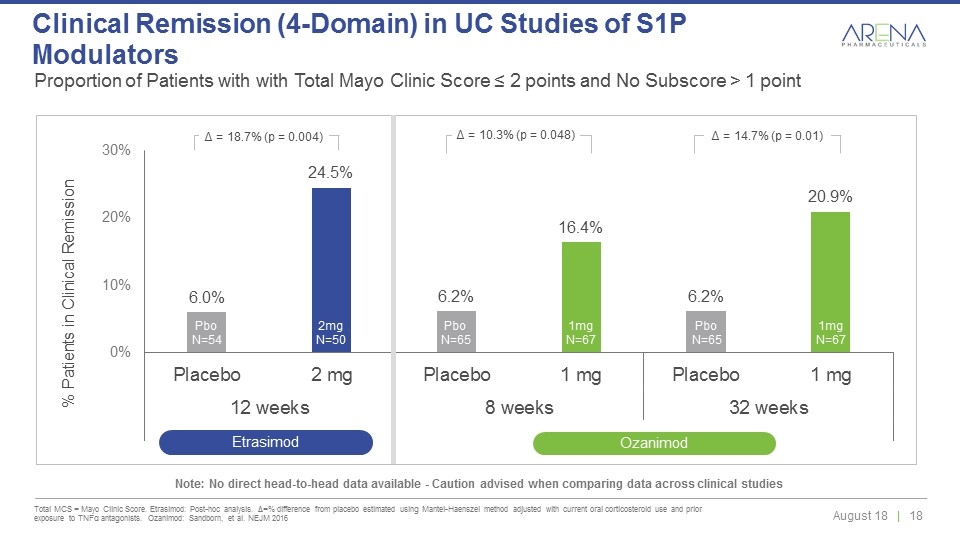
Proportion of Patients with with Total Mayo Clinic Score ≤ 2 points and No Subscore > 1 point Total MCS = Mayo Clinic Score. Etrasimod: Post-hoc analysis. Δ=% difference from placebo estimated using Mantel-Haenszel method adjusted with current oral corticosteroid use and prior exposure to TNFα antagonists. Ozanimod: Sandborn, et al. NEJM 2016 Clinical Remission (4-Domain) in UC Studies of S1P Modulators Pbo N=65 Pbo N=54 1mg N=67 2mg N=50 Pbo N=65 1mg N=67 Δ = 18.7% (p = 0.004) Δ = 10.3% (p = 0.048) Δ = 14.7% (p = 0.01) Etrasimod Ozanimod Note: No direct head-to-head data available - Caution advised when comparing data across clinical studies
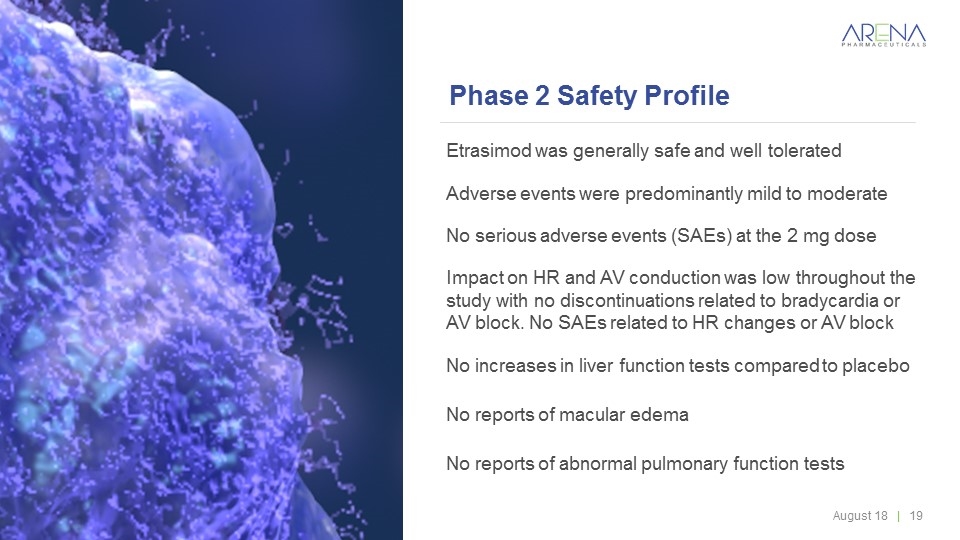
Phase 2 Safety Profile Etrasimod was generally safe and well tolerated Adverse events were predominantly mild to moderate No serious adverse events (SAEs) at the 2 mg dose Impact on HR and AV conduction was low throughout the study with no discontinuations related to bradycardia or AV block. No SAEs related to HR changes or AV block No increases in liver function tests compared to placebo No reports of macular edema No reports of abnormal pulmonary function tests

A Next-Generation, Oral, Selective Prostacyclin Receptor (IP) Agonist for the Treatment of Pulmonary Arterial Hypertension Ralinepag
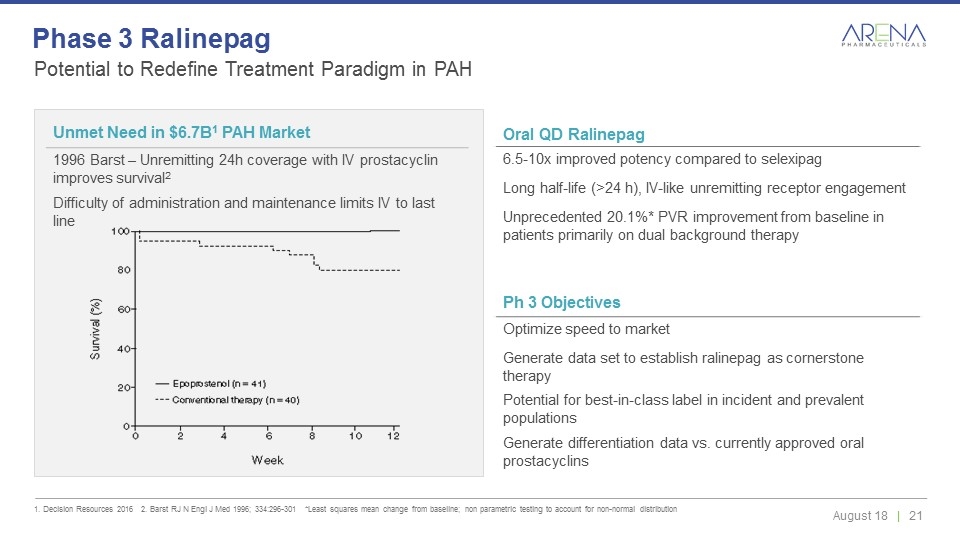
Potential to Redefine Treatment Paradigm in PAH 1. Decision Resources 2016 2. Barst RJ N Engl J Med 1996; 334:296-301 *Least squares mean change from baseline; non parametric testing to account for non-normal distribution Phase 3 Ralinepag Oral QD Ralinepag 6.5-10x improved potency compared to selexipag Long half-life (>24 h), IV-like unremitting receptor engagement Unprecedented 20.1%* PVR improvement from baseline in patients primarily on dual background therapy Unmet Need in $6.7B1 PAH Market 1996 Barst – Unremitting 24h coverage with IV prostacyclin improves survival2 Difficulty of administration and maintenance limits IV to last line Ph 3 Objectives Optimize speed to market Generate data set to establish ralinepag as cornerstone therapy Potential for best-in-class label in incident and prevalent populations Generate differentiation data vs. currently approved oral prostacyclins
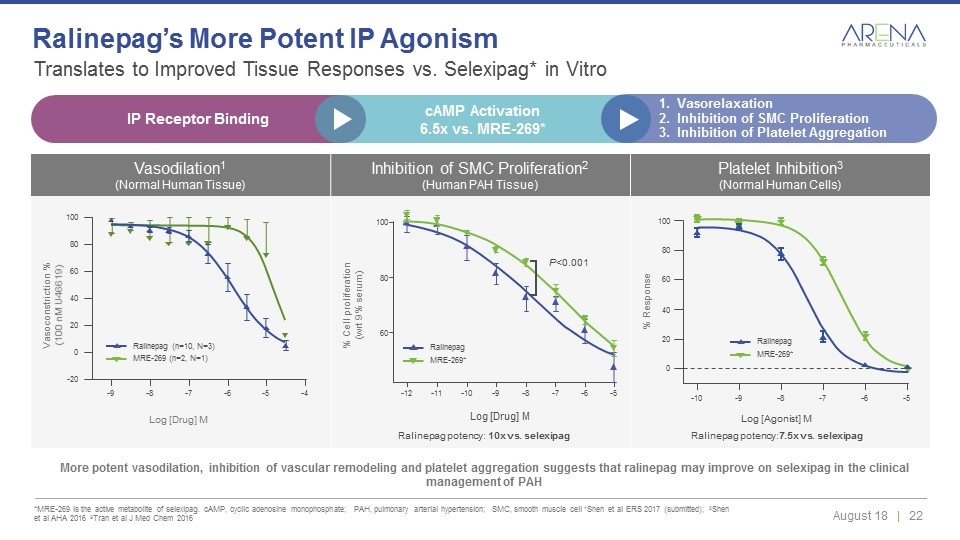
Vasodilation1 (Normal Human Tissue) Inhibition of SMC Proliferation2 (Human PAH Tissue) Platelet Inhibition3 (Normal Human Cells) Translates to Improved Tissue Responses vs. Selexipag* in Vitro *MRE-269 is the active metabolite of selexipag. cAMP, cyclic adenosine monophosphate; PAH, pulmonary arterial hypertension; SMC, smooth muscle cell 1Shen et al ERS 2017 (submitted); 2Shen et al AHA 2016 3Tran et al J Med Chem 2016 Ralinepag’s More Potent IP Agonism More potent vasodilation, inhibition of vascular remodeling and platelet aggregation suggests that ralinepag may improve on selexipag in the clinical management of PAH 0 20 40 60 80 100 -10 -9 -8 -7 -6 -5 -9 -8 -7 -6 -5 -4 -20 0 20 40 60 80 100 Log [Drug] M Log [Drug] M 100 60 80 -12 -11 -10 -9 -8 -7 -6 -5 P<0.001 Vasoconstriction % (100 nM U46619) % Cell proliferation (wrt 9% serum) Ralinepag potency: 10x vs. selexipag Log [Agonist] M Ralinepag potency:7.5x vs. selexipag % Response MRE-269 (n=2, N=1) Ralinepag (n=10, N=3) MRE-269* Ralinepag MRE-269* Ralinepag IP Receptor Binding cAMP Activation 6.5x vs. MRE-269* Vasorelaxation Inhibition of SMC Proliferation Inhibition of Platelet Aggregation
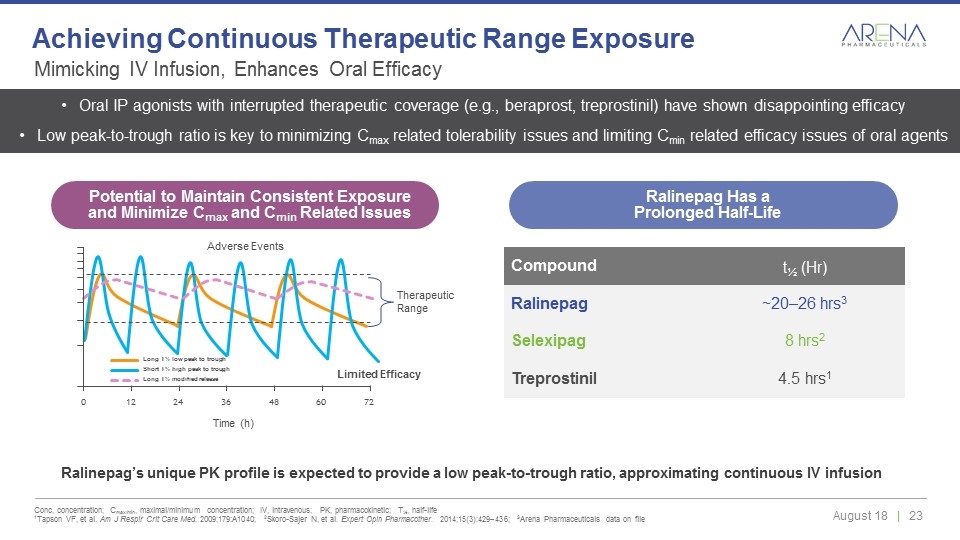
Ralinepag’s unique PK profile is expected to provide a low peak-to-trough ratio, approximating continuous IV infusion Compound t½ (Hr) Ralinepag ~20–26 hrs3 Selexipag 8 hrs2 Treprostinil 4.5 hrs1 Long T½ low peak to trough Short T½ high peak to trough Long T½ modified release 0 24 36 48 60 72 12 Time (h) Adverse Events Therapeutic Range Oral IP agonists with interrupted therapeutic coverage (e.g., beraprost, treprostinil) have shown disappointing efficacy Low peak-to-trough ratio is key to minimizing Cmax related tolerability issues and limiting Cmin related efficacy issues of oral agents Limited Efficacy Mimicking IV Infusion, Enhances Oral Efficacy Conc, concentration; Cmax/min, maximal/minimum concentration; IV, intravenous; PK, pharmacokinetic; T½, half-life 1Tapson VF, et al. Am J Respir Crit Care Med. 2009;179:A1040; 2Skoro-Sajer N, et al. Expert Opin Pharmacother. 2014;15(3):429–436; 3Arena Pharmaceuticals data on file Achieving Continuous Therapeutic Range Exposure Potential to Maintain Consistent Exposure and Minimize Cmax and Cmin Related Issues Ralinepag Has a Prolonged Half-Life
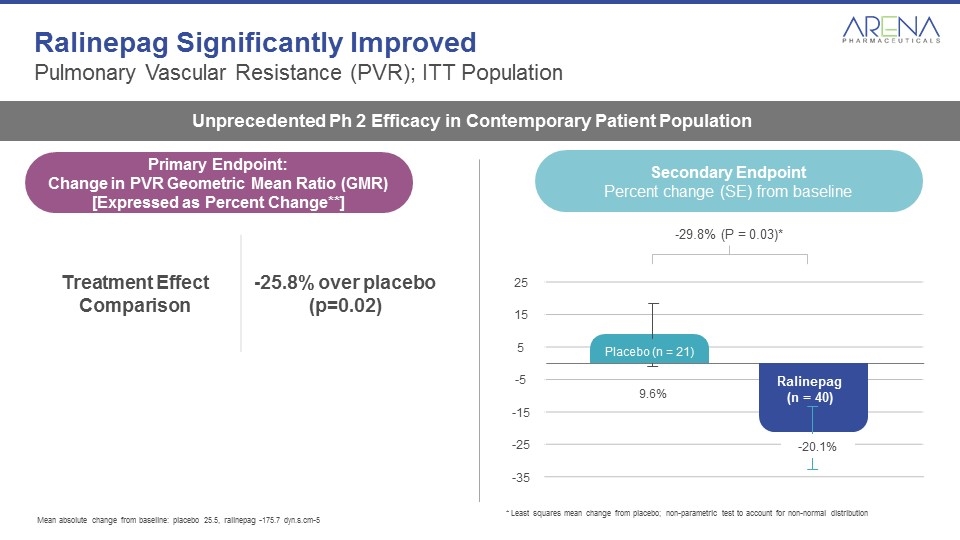
Ralinepag Significantly Improved Pulmonary Vascular Resistance (PVR); ITT Population Unprecedented Ph 2 Efficacy in Contemporary Patient Population Secondary Endpoint Percent change (SE) from baseline 25 15 5 -5 -15 -25 -35 Ralinepag (n = 40) -29.8% (P = 0.03)* -20.1% Placebo (n = 21) 9.6% Mean absolute change from baseline: placebo 25.5, ralinepag -175.7 dyn.s.cm-5 * Least squares mean change from placebo; non-parametric test to account for non-normal distribution Treatment Effect Comparison -25.8% over placebo (p=0.02) Primary Endpoint: Change in PVR Geometric Mean Ratio (GMR) [Expressed as Percent Change**]
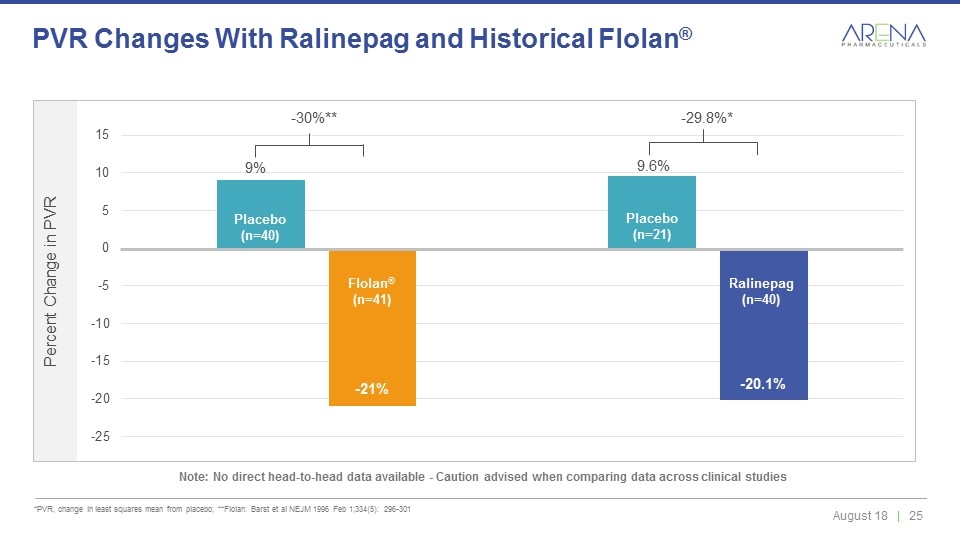
*PVR, change in least squares mean from placebo; **Flolan: Barst et al NEJM 1996 Feb 1;334(5): 296-301 PVR Changes With Ralinepag and Historical Flolan® Note: No direct head-to-head data available - Caution advised when comparing data across clinical studies Ralinepag (n=40) Placebo (n=40) Placebo (n=21) 9.6% -20.1% 9% -21% Flolan® (n=41) -30%** -29.8%*
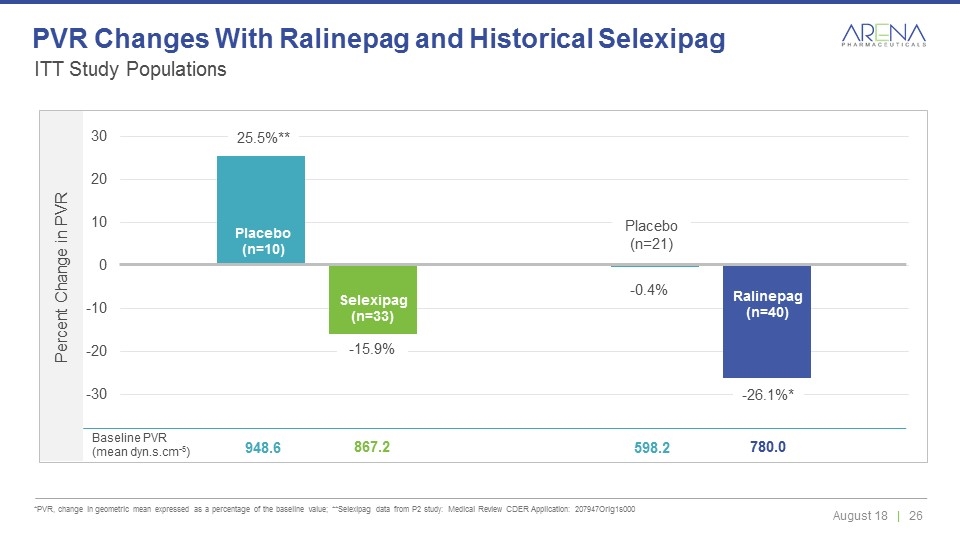
ITT Study Populations *PVR, change in geometric mean expressed as a percentage of the baseline value; **Selexipag data from P2 study: Medical Review CDER Application: 207947Orig1s000 PVR Changes With Ralinepag and Historical Selexipag Placebo (n=10) Selexipag (n=33) Placebo (n=21) Ralinepag (n=40) -0.4% -26.1%* 25.5%** -15.9% Baseline PVR (mean dyn.s.cm-5) 948.6 867.2 598.2 780.0
Phase 2 Safety and Tolerability The overall safety and tolerability profile consistent with the known profile of the prostacyclin therapy class Adverse events that occurred most frequently on ralinepag were similar to the on-target effects expected for prostacyclin therapies: Headache, nausea, diarrhea, jaw pain, flushing Events were more frequent during dose titration; consistent reduction in adverse event frequency during maintenance period During 25 week safety assessment period 12.5% of patients discontinued ralinepag and 10.0% patients discontinued placebo due to adverse events Serious adverse events occurred in 4 (10%) patients taking ralinepag and 6 (28.6%) patients taking placebo 2 deaths occurred among placebo patients; 0 deaths on ralinepag
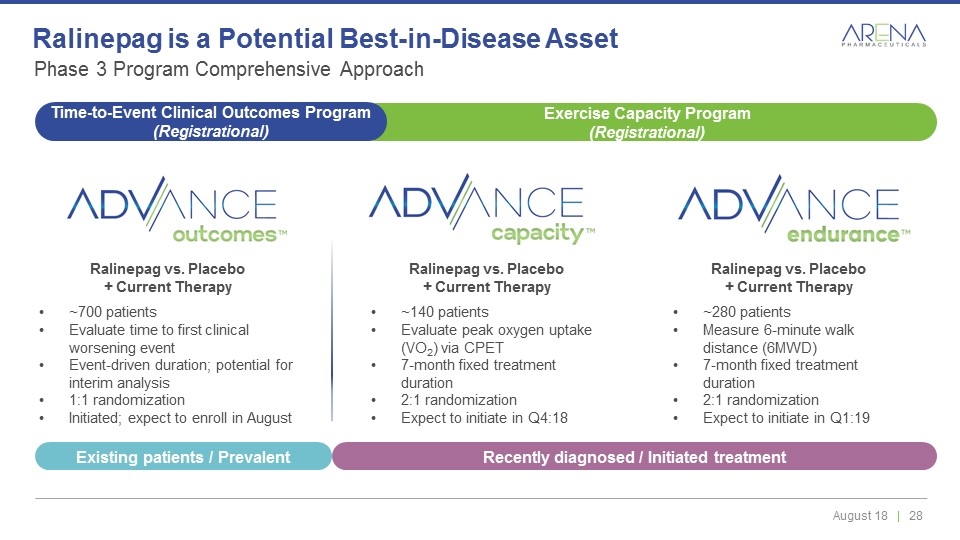
Ralinepag vs. Placebo + Current Therapy ~140 patients Evaluate peak oxygen uptake (VO2) via CPET 7-month fixed treatment duration 2:1 randomization Expect to initiate in Q4:18 Ralinepag vs. Placebo + Current Therapy ~700 patients Evaluate time to first clinical worsening event Event-driven duration; potential for interim analysis 1:1 randomization Initiated; expect to enroll in August Phase 3 Program Comprehensive Approach Ralinepag is a Potential Best-in-Disease Asset Ralinepag vs. Placebo + Current Therapy ~280 patients Measure 6-minute walk distance (6MWD) 7-month fixed treatment duration 2:1 randomization Expect to initiate in Q1:19 Exercise Capacity Program (Registrational) Time-to-Event Clinical Outcomes Program (Registrational) Recently diagnosed / Initiated treatment Existing patients / Prevalent
Peripherally Restricted, Highly–Selective, Full Agonist to Cannabinoid 2 Receptor (CB2) Being Evaluated for Treatment of Pain Associated with Crohn’s Disease Olorinab
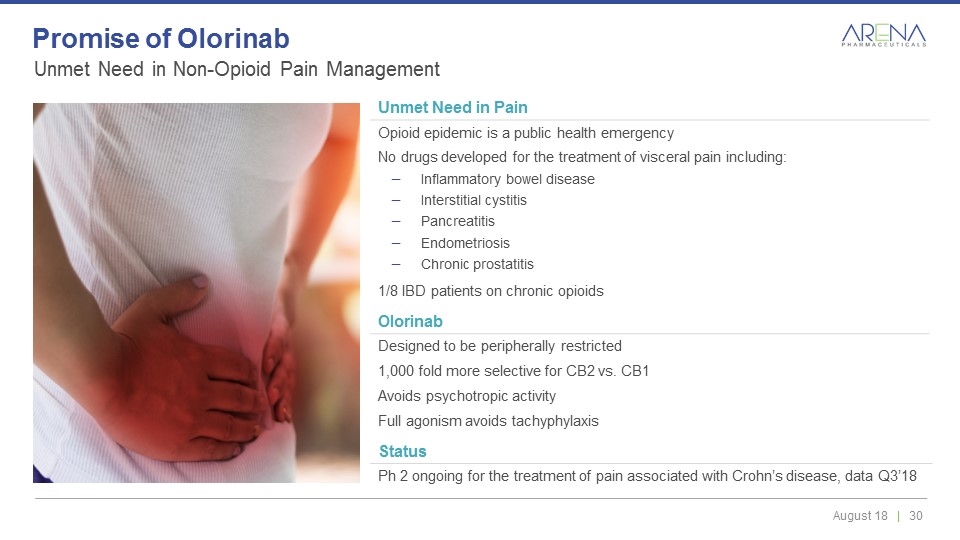
Status Ph 2 ongoing for the treatment of pain associated with Crohn’s disease, data Q3’18 Unmet Need in Pain Opioid epidemic is a public health emergency No drugs developed for the treatment of visceral pain including: Inflammatory bowel disease Interstitial cystitis Pancreatitis Endometriosis Chronic prostatitis 1/8 IBD patients on chronic opioids Olorinab Designed to be peripherally restricted 1,000 fold more selective for CB2 vs. CB1 Avoids psychotropic activity Full agonism avoids tachyphylaxis Unmet Need in Non-Opioid Pain Management Promise of Olorinab
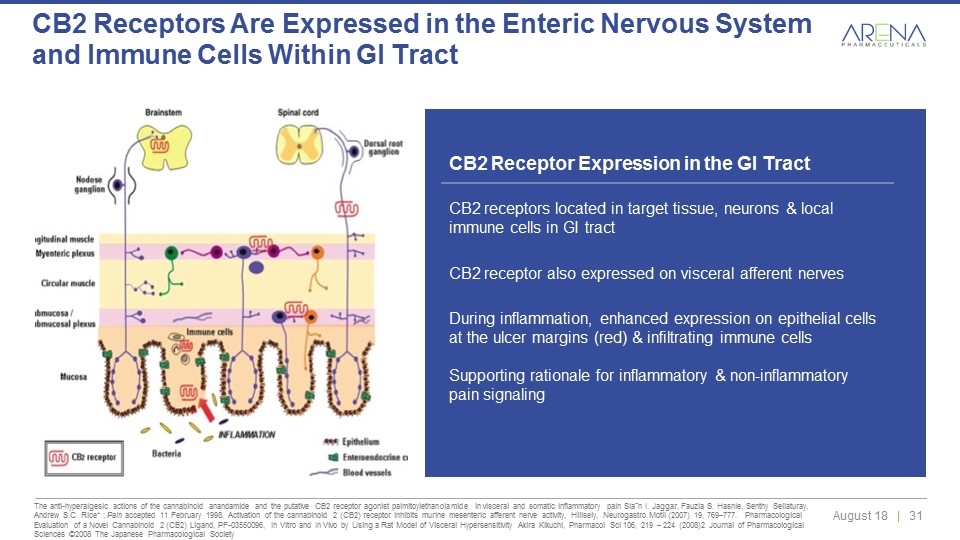
CB2 receptors represent a pathophysiological mechanism in GI tract to regulate abnormal motility, modulate intestinal inflammation & limit visceral sensitivity/pain CB2 Receptor Expression in the GI Tract CB2 receptors located in target tissue, neurons & local immune cells in GI tract CB2 receptor also expressed on visceral afferent nerves During inflammation, enhanced expression on epithelial cells at the ulcer margins (red) & infiltrating immune cells Supporting rationale for inflammatory & non-inflammatory pain signaling The anti-hyperalgesic actions of the cannabinoid anandamide and the putative CB2 receptor agonist palmitoylethanolamide in visceral and somatic inflammatory pain Siaˆn I. Jaggar, Fauzia S. Hasnie, Senthy Sellaturay, Andrew S.C. Rice* ; Pain accepted 11 February 1998. Activation of the cannabinoid 2 (CB2) receptor inhibits murine mesenteric afferent nerve activity, Hillsely, Neurogastro Motil (2007) 19, 769–777. Pharmacological Evaluation of a Novel Cannabinoid 2 (CB2) Ligand, PF-03550096, In Vitro and In Vivo by Using a Rat Model of Visceral Hypersensitivity Akira Kikuchi, Pharmacol Sci 106, 219 – 224 (2008)2 Journal of Pharmacological Sciences ©2008 The Japanese Pharmacological Society CB2 Receptors Are Expressed in the Enteric Nervous System and Immune Cells Within GI Tract
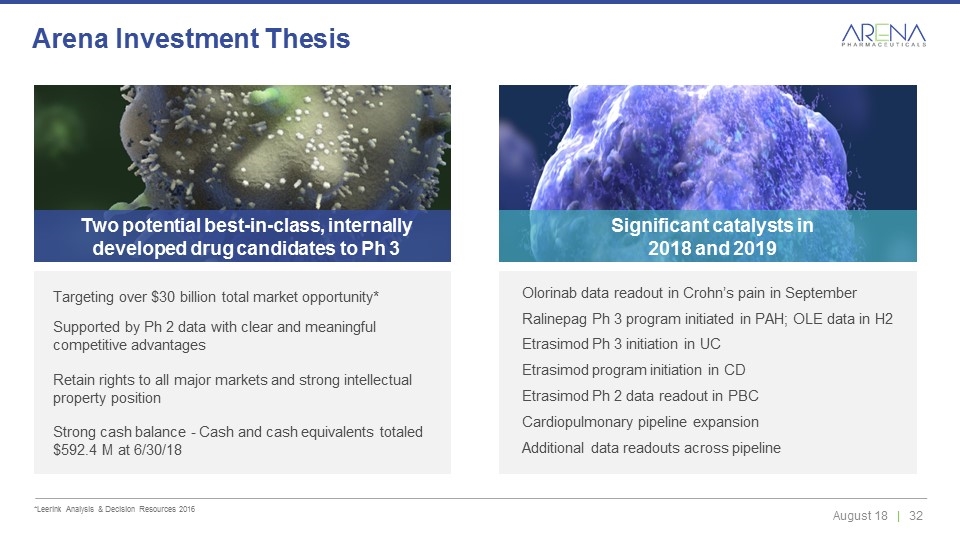
*Leerink Analysis & Decision Resources 2016 Arena Investment Thesis Two potential best-in-class, internally developed drug candidates to Ph 3 Olorinab data readout in Crohn’s pain in September Ralinepag Ph 3 program initiated in PAH; OLE data in H2 Etrasimod Ph 3 initiation in UC Etrasimod program initiation in CD Etrasimod Ph 2 data readout in PBC Cardiopulmonary pipeline expansion Additional data readouts across pipeline Targeting over $30 billion total market opportunity* Supported by Ph 2 data with clear and meaningful competitive advantages Retain rights to all major markets and strong intellectual property position Strong cash balance - Cash and cash equivalents totaled $592.4 M at 6/30/18 Significant catalysts in 2018 and 2019

THANK YOU NASDAQ: ARNA
