Attached files
| file | filename |
|---|---|
| 8-K - CURRENT REPORT - YELP INC | yelp3263139-8k.htm |
| EX-99.2 - LETTER TO SHAREHOLDERS, DATED AUGUST 8, 2018 - YELP INC | yelp3263139-ex992.pdf |
| EX-99.1 - PRESS RELEASE, DATED AUGUST 8, 2018 - YELP INC | yelp3263139-ex991.htm |
| 2 | Q2 2018 |
Yelp drives customers
to local businesses
 |
Matthew Hayes Faubourg Bistro | |
 |
318 reviews | |
|
“After beginning to advertise with Yelp, I quickly realized the positive impact it had on my business. I’ve increased my Yelp advertising budget and continue to see more and more growth.” | ||
 |
Michelle Tascoe | |
 |
7 reviews | |
|
“Yelp has helped me grow my business beyond what I thought could be possible. The best part is that the right clients are finding me and I have been able to help them.” | ||
Reviews and star ratings as of August 8, 2018
| 3 | Q2 2018 |
Second Quarter 2018
Financial Highlights
| > | Net revenue of $235 million for the second quarter exceeded our outlook, driven by strength across Yelp’s advertising business |
| > | Net income improved to $11 million, or $0.12 per diluted share, compared to net income of $8 million, or $0.09 per diluted share, in the second quarter of 2017 |
| > | Adjusted EBITDA of $47 million increased $4 million compared to the second quarter of 2017 and also surpassed our second quarter outlook |
| > | Cash flow from operations was $61 million for the year to date and we finished the quarter with cash, cash equivalents and marketable securities of $803 million |
| > | Shares repurchased during the second quarter totalled approximately 771,000 at an aggregate cost of $32 million |
| > | We revised our 2018 Business Outlook. We now expect Net revenue to be between $952 and $967 million and Adjusted EBITDA to be between $186 and $192 million |
Operational Highlights
| Advertising revenue | Transactions revenue | Other services revenue | ||
 |
 |
 | ||
| App unique devices | Paying advertiser accounts | Cumulative reviews | ||
 |
 |
 |
**Excluding the effect of the acquisition of Turnstyle on April 3, 2017, Other services revenue grew 30% year over year

| 4 | Q2 2018 |
Dear fellow
shareholders,
Our focus on long-term growth and monetization is delivering solid financial results. Second quarter Net revenue and Adjusted EBITDA exceeded our outlook, as the transition to selling local advertising without an initial term commitment accelerated customer growth and drove stronger year-over-year growth in Advertising revenue. We are pleased with how the transition has gone. Clients have responded well to the increased flexibility and our salesforce has closed more new deals than ever before. We added a record number of advertisers in the quarter, and trial conversion and client retention were consistent with our expectations.
Even as we focused on executing the transition in our Local ad business, we also made encouraging progress on growth initiatives in other areas. In the second quarter, we more than doubled the number of diners seated via Yelp Reservations and Nowait compared to a year earlier, and we accelerated food ordering growth into the mid-30% range year to year with the benefit of our partnership with Grubhub. In Home & Local Services, Request-A-Quote helped Advertising revenue for the category surpass $75 million in the second quarter, a more than 30% year-over-year increase.
While we had a good first half of 2018, we are not resting on these accomplishments. We are working hard to realize the full potential that they present to make Yelp an even stronger company in the future.
“Second quarter results were once again driven by strong revenue growth in our core Advertising business. We completed the transition to selling non-term local advertising in the quarter, which helped deliver record advertising account additions. Our growth initiatives elsewhere also produced encouraging results.”
—Jeremy Stoppelman
Co-founder and Chief Executive Officer
Net Paying Advertising
Account Additions

Diners Seated via
Yelp Reservations and Nowait

| 5 | Q2 2018 |
The transition in our Local advertising business has gone well
Our intention with these letters is to provide greater detail on the strategic matters and major initiatives that we believe will influence the future value of the company. We also recognize that significant changes—such as transitioning to non-term advertising after more than a decade of selling ads on term contracts—can make it harder to evaluate business performance using established metrics like Repeat rate alone. Accordingly, we want to share some key insights and data from the transition thus far.
Non-term is attracting more advertisers to Yelp
We completed the transition to selling non-term advertising across our Local salesforce in May, and our second quarter results begin to show the impact it is having on our business. Paying advertising accounts increased by nearly one-third from a year ago to 194,000, the fastest growth rate in two years. In the first two quarters of 2018, we added a total of 31,000 net new accounts, approximately the same number that we added in the preceding five quarters combined. The faster advertiser acquisition drove Advertising revenue growth, which accelerated for the second consecutive quarter.
Providing merchants and service providers the opportunity to try Yelp advertising without a commitment is introducing more business owners to Yelp. In the second quarter, our Local sales reps acquired three times as many new-to-Yelp advertisers as they did in the same quarter a year ago. Meanwhile, the number of both prior customers who reactivated their Yelp advertising and longer-term advertisers increased in the second quarter.
Local Salesforce
Acquiring More New Clients

| 6 | Q2 2018 |
Non-term is helping our Local salesforce close more deals
Monthly transactions per sales rep were up nearly three-fold under the new model in the second quarter, as our Local reps closed deals more quickly and more often. The favorable effect on sales rep production is most pronounced among our newer hires. These reps are now ramping toward full production in less time than it took under the term contract structure. We expect the improvement in our sales reps’ success rates to drive revenue going forward.
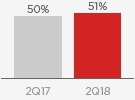
The bottom-line economics remain attractive
By design, the transition to non-term advertising has accelerated deal volume and although it has also accelerated account turnover to a degree, the net result has been greater revenue. The revenue growth is generating more profit dollars for Yelp, as the contribution-margin of local non-term deals have been consistent with those realized from term contracts in the past. This is because we use a time-tested variable-commission structure developed years ago and an advanced deal scoring system based on predicted lifetime value (“LTV”) to balance the relationship between the revenue advertisers generate and their cost of acquisition. With more accounts driving more revenue at a consistent contribution margin, the switch to non-term advertising has the power to achieve greater fixed-cost leverage over time. We believe these dynamics will support strong long-term profitability as our Advertising business grows.
Non-term creates additional opportunity
To capture more of the opportunity the increase in advertiser acquisitions presents, we are pursuing several customer success and product initiatives. Our focus is on increasing advertiser LTV by converting more new customers into long-term advertisers and increasing the spending of existing advertisers. The increase in trial purchase activity provides Yelp with thousands of new direct relationships with business owners to whom we can communicate and market in the future. We see an expanding opportunity to offer new products, drive upgrades and reactivate advertisers, not only with our Local salesforce and client partner teams, but also via self-serve. We are also using the business-owner app and site to drive client satisfaction. For example, the heightened flexibility we are providing advertisers through features like Yelp Custom Ads has deepened client engagement and improved retention.
| 7 | Q2 2018 |
We are driving strong engagement with great product experiences
In the second quarter, we continued to drive healthy usage growth of the Yelp app, which generates about three quarters of our total pageviews. App unique devices grew 15% over the prior year to more than 32 million.
Since the start of the year, one of our key product objectives has been to drive even deeper user engagement, and in the second quarter, we hit an all-time record for new photo and review submissions. We are leveraging all of this new content with an even more engaging app experience. In June, we launched Popular Dishes, a feature that scours more than 100 million photos and reviews to surface the menu items Yelpers rave about and take the guesswork out of what to order. In addition, we are now providing millions of app users with dining recommendations that are personalized to their tastes and locations.
Recognizing that consumers also want to use Yelp for more than just researching local businesses, we are developing a growing number of proprietary experiences that more closely connect users with great local businesses. Some of the best examples appear in the Restaurants category, where we generate about half of our consumer engagement and where Yelp is rapidly becoming more transactional. As we have grown table inventory and deployed in-app marketing to raise user awareness, the monthly number of diners seated via Yelp Reservations has grown by more than 50% year to date and Nowait’s monthly diner tally has more than doubled in the same time frame. Experiences like these take the friction out of local commerce and help further differentiate our app, all with the benefit of making Yelp more of a “must-have” local utility for consumers.
Financially, these initiatives in Restaurants support the growth of our subscription and transaction revenue streams. Strategically, we also stand to benefit when highly-engaged, repeat Restaurant traffic migrates into other business categories on Yelp. This year, we have leveraged in-app cross promotion to drive sustained 20-30% traffic increases in categories such as cleaning, landscaping, and moving. In fact, we have increased the proportion of our users who are active in the broader Home & Local Services category by several percentage points in the past year without spending any appreciable marketing dollars towards that goal.
Popular Dishes

Driving Traffic
Across Categories

| 8 | Q2 2018 |
Our Home & Local Services initiatives are driving monetization
As we pursue greater user engagement in high-frequency areas such as Restaurants, we are also enhancing monetization in high-value areas, in particular, Home & Local Services. To put some context around the how valuable the category is to Yelp, consider that Advertising revenue per business location within the Home & Local Services category is about twice the average for all other categories combined. Advertising revenue per Home & Local Service business pageview is also more than five-times that of all other categories combined.
At 33% of Yelp’s Advertising revenue in the second quarter, Home & Local Services is by far our largest business category and it is also our fastest-growing. In the second quarter, Advertising revenue growth in the category accelerated for the third consecutive quarter to more than 30% compared to the prior year, a rate that is more than one-and-a-half times greater than revenue growth in all remaining categories. The strong performance of Home & Local Services reflects favorable secular trends in consumer behavior and service provider marketing preferences, as well as the adoption of Yelp’s Request-A-Quote feature.
Request-A-Quote lead volume grew 27% from the first to the second quarter of 2018 and topped 5.5 million delivered requests in the second quarter. During that same short time frame, revenue attributable to Request-A-Quote increased by more than 50%, surpassing a $35 million annual run rate at the end of the second quarter. Since we introduced Request-A-Quote in 2016, trends in traffic growth, business engagement and monetization in Home & Local Services have accelerated relative to other business categories on Yelp.
Uniquely, Yelp’s growth in Home & Local Services has been organic and efficient, achieved without acquisitions or heavy marketing spend. As we continue to fuel its growth through product innovation, increased inventory and monetization experiments, we anticipate that Home & Local Services will remain a significant growth driver in the coming years.
RAQ Revenue
Up 50% From Q1

| 9 | Q2 2018 |
We are encouraged by the progress we are making
The changes that we are undertaking today are driving growth and monetization. More importantly, they are helping us leverage our leadership position in local to capture more of the market opportunity for the long term. The shift to non-term advertising has accelerated advertiser acquisition, which is allowing us to engage with more business owners more frequently and offer them more solutions. At the same time, our focus on user engagement is deepening our relationships with consumers and allowing us to build new transactional and subscription revenue streams. These are all helping to cultivate a thriving business that we expect will continue to generate growth for years to come.
Signed,
 |
 | |
|
Jeremy Stoppelman |
Lanny Baker |
| 10 | Q2 2018 |
Financial Review &
Business Outlook
All results are presented in accordance with ASC 606, as detailed in our most recent Quarterly Report on Form 10-Q filed with the SEC.
Strong second quarter results
Second quarter Net revenue and Adjusted EBITDA surpassed our outlook, primarily as a result of Advertising revenue momentum. Total net revenue grew to $235 million in the second quarter of 2018, an increase of 12% over the second quarter of 2017. Excluding the impacts of the sale of Eat24 to Grubhub and the acquisition of Turnstyle in 2017, revenue grew by 22% year over year. GAAP Net income improved to $11 million in the second quarter of 2018 compared to $8 million a year ago. Adjusted EBITDA was $47 million in the second quarter of 2018, up 9% from $43 million in the second quarter of 2017.
Based on second quarter results and the positive underlying trends across the business, we have updated the Business Outlook for 2018. Full year revenue is now expected to be in the range of $952 to $967 million with Adjusted EBITDA expected to be in the range of $186 to $192 million. Details of the revised Business Outlook appear later in this letter.
Total Net Revenue

Adjusted EBITDA

| 11 | Q2 2018 |
Strong Advertising revenue growth
Advertising revenue was $226 million in the second quarter of 2018, a 21% increase over second quarter 2017, driven by growth in the size of our local salesforce and by business owners’ positive response to our transition to non-term advertising. Stronger sales productivity related to the transition to non-term advertising increased the number of Paying advertising accounts by a record 17,000 customers from the first quarter to the second quarter of 2018. Total Paying advertising accounts were 194,000 for the second quarter of 2018, a 31% year-over-year increase.
Transaction revenue was $4 million in the second quarter of 2018 compared to $18 million in the year-ago period. The decrease in Transaction revenue reflects the sale of Eat24, which closed in October 2017; Eat24 generated $17 million in Transaction revenue for Yelp in the second quarter of 2017. Following the sale, the majority of Transaction revenue is now derived from our partnership with Grubhub, in which Yelp earns a fee for food orders originated on Yelp and transmitted to Grubhub for fulfillment.
Other services revenue was $5 million for the second quarter of 2018, up from $4 million in the second quarter of 2017, due to efficiencies gained from combining our Yelp Reservations and Yelp Nowait sales teams, and the growth of the Yelp WiFi marketing platform.
| Three Months Ended June 30, | |||||||
| 2018 | 2017 | ||||||
| Net revenue by product | |||||||
| Advertising | $ | 226,168 | $ | 187,683 | |||
| Transactions | 3,520 | 18,435 | |||||
| Other services | 5,175 | 3,827 | |||||
| Total net revenue | $ | 234,863 | $ | 209,945 | |||
| 12 | Q2 2018 |
Expenses & Adjusted EBITDA
Total costs and expenses were $227 million in the second quarter, up 12% from $203 million in the second quarter of 2017, driven primarily by employee head-count growth.
Cost of revenue was $15 million, down $3 million or 19% year to year, due primarily to the sale of Eat24. Gross profit was $220 million, up 15% from second quarter 2017. Gross margin improved to 94%, up from 93% in the first quarter and 91% in the year-ago quarter.
Sales and marketing expenses totalled $121 million in the second quarter of 2018, up 15% from a year ago, driven by expenses associated with sales headcount growth.
Product development expenses were $53 million in the second quarter, up 25% year over year, as a result of our investments in the Yelp consumer experience and business-owner portfolio, as well as to support infrastructure and systems. The majority of the product and engineering teams that formerly supported Eat24 were also redeployed to other company initiatives after the acquisition closed last year.
General and administrative expenses were $29 million in the second quarter, up 6% from the same quarter of 2017. Bad debt expense increased less than $1 million year to year as a result of the increase in Advertising revenue, while the remaining General and administrative expenses grew just 4% year to year.
Adjusted EBITDA was $47 million in the second quarter of 2018, up 9% from the second quarter of 2017. Adjusted EBITDA margin was 20% in the second quarter, consistent with the year-ago quarter. Stock-based compensation was $29 million in the quarter, 14% higher than in the same quarter of 2017.
COR % of Revenue
![]()
S&M % of Revenue
PD % of Revenue

G&A % of Revenue

| 13 | Q2 2018 |
Balance sheet and cash flows
At the end of June 2018, Yelp held $803 million in cash, cash equivalents and investments on its balance sheet, with no debt. Our initiatives to manage dilution from share issuances reduced the balance of cash, cash equivalents and investments, by $43 million from the end of 2017. During the second quarter, the company repurchased approximately 771,000 Yelp shares at an aggregate purchase price of $32 million, bringing the total number of shares repurchased in the first half of 2018 to approximately 1,600,000 for an aggregate purchase price of $66 million. The share repurchase program authorized in July 2017 had $122 million in remaining capacity as of June 30, 2018. For the year-to-date, the company has also paid $28 million in employee income taxes related to net share withholding and the settlement of taxes associated with vested RSUs.
| 14 | Q2 2018 |
Third Quarter and Full Year 2018 Business Outlook
As of today, Yelp is providing its outlook for the third quarter and updating its full year 2018 outlook. Please note that the outlook reflects the sale of Eat24 and the acquisitions of Nowait and Turnstyle in 2017:
| $ and shares in millions | Third Quarter 2018 | Full Year 2018 | ||||||
| Net revenue | $ | 242-246 | $ | 952-967 | ||||
| Adjusted EBITDA* | $ | 49-52 | $ | 186-192 | ||||
| Stock-based compensation | $ | 30-32 | $ | 118-121 | ||||
| Depreciation and amortization as a % of Net revenue |
5% | 5% | ||||||
| Fully diluted share count | 90-92 | 90-92 | ||||||
The updated Business Outlook reflects the second quarter results, encouraging trends in advertiser acquisition, and continued caution about the transition to selling advertising services under non-term contracts in our Local ad business, which was completed in May 2018. For the full year, Transactions revenue is expected to be approximately $12 million, and Other services revenue is now expected to be approximately $20 million. Please note that with Grubhub’s integration of Eat24 now completed, Transactions revenue will no longer include $1-2 million in quarterly revenue from payment processing related to the transition.
| * | Yelp has not reconciled its Adjusted EBITDA outlook to GAAP net income (loss) because it does not provide an outlook for GAAP net income (loss) due to the uncertainty and potential variability of other income, net and provision for (benefit from) income taxes, which are reconciling items between Adjusted EBITDA and GAAP net income (loss). Because we cannot reasonably predict such items and they could have a significant impact on the calculation of GAAP net income (loss), a reconciliation of the non-GAAP financial measure outlook to the corresponding GAAP measure is not available without unreasonable effort. For more information regarding the non-GAAP financial measures discussed in this release, please see “Non-GAAP Financial Measures” and “Reconciliation of GAAP to Non-GAAP Financial Measures” which follow. |
| 15 | Q2 2018 |
Quarterly Earnings Webcast
Yelp will host a live webcast today at 2:00 p.m. PDT to discuss the second quarter 2018 financial results. The webcast can be accessed on the Yelp Investor Relations website at yelp-ir.com. A replay of the webcast will be available at the same website until August 16, 2018.
About Yelp
Yelp Inc. (www.yelp.com) connects people with great local businesses. With unmatched local business information, photos and review content, Yelp provides a platform for consumers to discover, interact and transact with local businesses of all sizes. Yelp was founded in San Francisco in July 2004.
| 16 | Q2 2018 |
Condensed Consolidated
Balance Sheets (In thousands, unaudited)
| June 30, 2018 | December 31, 2017 | ||||||
| Assets | |||||||
| Current assets: | |||||||
| Cash and cash equivalents | $ | 389,416 | $ | 547,850 | |||
| Short-term marketable securities | 413,946 | 273,366 | |||||
| Accounts receivable, net | 78,452 | 76,173 | |||||
| Prepaid expenses and other current assets | 20,621 | 15,700 | |||||
| Total current assets | 902,435 | 913,089 | |||||
| Long-term marketable securities | - | 25,032 | |||||
| Property, equipment and software, net | 109,673 | 103,651 | |||||
| Goodwill | 106,526 | 107,954 | |||||
| Intangibles, net | 15,125 | 16,893 | |||||
| Restricted cash | 22,166 | 18,554 | |||||
| Other non-current assets | 42,299 | 40,428 | |||||
| Total assets | $ | 1,198,224 | $ | 1,225,601 | |||
| Liabilities and Stockholders’ Equity | |||||||
| Current liabilities: | |||||||
| Accounts payable | $ | 9,808 | $ | 9,033 | |||
| Accrued liabilities | 52,469 | 73,665 | |||||
| Deferred revenue | 3,668 | 3,469 | |||||
| Total current liabilities | 65,945 | 86,167 | |||||
| Long-term liabilities | 33,845 | 30,737 | |||||
| Total liabilities | 99,790 | 116,904 | |||||
| Stockholders' equity | |||||||
| Common stock | - | - | |||||
| Additional paid-in capital | 1,086,727 | 1,038,017 | |||||
| Treasury stock | - | (46) | |||||
| Accumulated other comprehensive loss | (10,032) | (8,444) | |||||
| Retained earnings | 21,739 | 79,170 | |||||
| Total stockholders' equity | 1,098,434 | 1,108,697 | |||||
| Total liabilities and stockholders' equity | $ | 1,198,224 | $ | 1,225,601 | |||
| 17 | Q2 2018 |
Condensed Consolidated Statements
of Operations (In thousands, except per share data; unaudited)
| Three Months Ended June 30, | |||||||
| 2018 | 2017 | ||||||
| Net revenue | $ | 234,863 | $ | 209,945 | |||
| Costs and expenses: | |||||||
| Cost of revenue (1) | 14,708 | 18,056 | |||||
| Sales and marketing (1) | 120,653 | 104,921 | |||||
| Product development (1) | 52,789 | 42,088 | |||||
| General and administrative (1) | 28,583 | 27,042 | |||||
| Depreciation and amortization | 10,509 | 10,662 | |||||
| Restructuring and integration | - | 21 | |||||
| Total costs and expenses | 227,242 | 202,790 | |||||
| Income from operations | 7,621 | 7,155 | |||||
| Other income, net | 3,424 | 864 | |||||
| Income before income taxes | 11,045 | 8,019 | |||||
| Provision for income taxes | (341) | (118) | |||||
| Net income attributable to common stockholders | $ | 10,704 | $ | 7,901 | |||
| Net income per share attributable to common stockholders: | |||||||
| Basic | $ | 0.13 | $ | 0.10 | |||
| Diluted | $ | 0.12 | $ | 0.09 | |||
| Weighted-average shares used to compute net income per share attributable to common stockholders: | |||||||
| Basic | 83,769 | 80,996 | |||||
| Diluted | 88,651 | 84,860 | |||||
(1) Includes stock-based compensation expense as follows: |
|||||||
| Three Months Ended June 30, | |||||||
| 2018 | 2017 | ||||||
| Cost of revenue | $ | 1,153 | $ | 957 | |||
| Sales and marketing | 8,055 | 7,261 | |||||
| Product development | 13,907 | 11,245 | |||||
| General and administrative | 5,690 | 5,902 | |||||
| Total stock-based compensation | $ | 28,805 | $ | 25,365 | |||
![]()
| 18 | Q2 2018 |
Condensed Consolidated Statements
of Cash Flows (In thousands, unaudited)
| Six Months Ended June 30, | ||||||||
| 2018 | 2017 | |||||||
| Operating activities | ||||||||
| Net income | $ | 8,418 | $ | 3,878 | ||||
| Adjustments to reconcile net income to net cash provided by operating activities: | ||||||||
| Depreciation and amortization | 20,537 | 20,813 | ||||||
| Provision for doubtful accounts and sales returns | 14,608 | 10,792 | ||||||
| Stock-based compensation | 56,539 | 49,699 | ||||||
| Other adjustments | (1,911) | 267 | ||||||
| Changes in operating assets and liabilities: | ||||||||
| Accounts receivable | (15,208) | (9,661) | ||||||
| Prepaid expenses and other assets | (6,924) | (1,421) | ||||||
| Accounts payable, accrued expenses and other liabilities | (15,325) | 1,472 | ||||||
| Deferred revenue | 203 | 484 | ||||||
| Net cash provided by operating activities | 60,937 | 76,323 | ||||||
| Investing activities | ||||||||
| Purchases of marketable securities | (403,324) | (124,855) | ||||||
| Maturities of marketable securities | 290,000 | 140,000 | ||||||
| Acquisition of a business, net of cash received | - | (50,544) | ||||||
| Purchases of property, equipment and software | (15,018) | (4,079) | ||||||
| Capitalized website and software development costs | (10,139) | (8,030) | ||||||
| Other investing activities | 34 | 58 | ||||||
| Net cash used in investing activities | (138,447) | (47,450) | ||||||
| Financing activities | ||||||||
| Proceeds from issuance of common stock for employee stock-based plans | 16,221 | 19,354 | ||||||
| Repurchases of common stock | (65,789) | - | ||||||
| Taxes paid related to the net share settlement of equity awards | (27,953) | - | ||||||
| Net cash (used in) provided by financing activities | (77,521) | 19,354 | ||||||
| Effect of exchange rate changes on cash, cash equivalents and restricted cash | 209 | 548 | ||||||
| Change in cash, cash equivalents and restricted cash | (154,822) | 48,775 | ||||||
| Cash, cash equivalents and restricted cash - Beginning of period | 566,404 | 289,518 | ||||||
| Cash, cash equivalents and restricted cash - End of period | $ | 411,582 | $ | 338,293 | ||||
![]()
| 19 | Q2 2018 |
Reconciliation of GAAP Net Income to
Adjusted EBITDA (In thousands, except per share data; unaudited)
| Three Months Ended June 30, | ||||||||
| 2018 | 2017 | |||||||
| Reconciliation of GAAP net income to EBITDA and adjusted EBITDA: | ||||||||
| GAAP net income | $ | 10,704 | $ | 7,901 | ||||
| Provision for income taxes | 341 | 118 | ||||||
| Other income, net | (3,424) | (864) | ||||||
| Depreciation and amortization | 10,509 | 10,662 | ||||||
| EBITDA | 18,130 | 17,817 | ||||||
| Stock-based compensation | 28,805 | 25,365 | ||||||
| Restructuring and integration costs | - | 21 | ||||||
| Adjusted EBITDA | $ | 46,935 | $ | 43,203 | ||||
| Net revenue | $ | 234,863 | $ | 209,945 | ||||
| Adjusted EBITDA margin | 20% | 21% | ||||||
Second Quarter Net Revenue Adjusted for
Eat24 and Turnstyle (In thousands, unaudited)
| Three Months Ended June 30, | ||||||||
| 2018 | 2017 | |||||||
| Net revenue as reported | $ | 234,863 | $ | 209,945 | ||||
| Eat24 revenue | - | (17,443) | ||||||
| Turnstyle revenue | (735) | (405) | ||||||
| Net revenue excluding Eat24 and Turnstyle | $ | 234,128 | $ | 192,097 | ||||
| 20 | Q2 2018 |
Non-Financial Metrics
| 2Q16 | 3Q16 | 4Q16 | 1Q17 | 2Q17 | 3Q17 | 4Q17 | 1Q18 | 2Q18 | |||||||||||
| Key operational metrics (thousands) | |||||||||||||||||||
| App Unique Devices1 | 23,010 | 24,900 | 24,073 | 25,827 | 27,987 | 30,162 | 28,845 | 30,115 | 32,062 | ||||||||||
| Paying Advertising Accounts2 | 125 | 132 | 135 | 139 | 148 | 155 | 163 | 177 | 194 | ||||||||||
| Sales Headcount3 | 2,400 | 2,550 | 2,500 | 2,550 | 2,750 | 3,050 | 3,300 | 3,300 | 3,350 | ||||||||||
| Claimed Local Business Locations4 | 3,010 | 3,192 | 3,363 | 3,559 | 3,753 | 3,963 | 4,156 | 4,378 | 4,593 | ||||||||||
| Other non-financial metrics (thousands) | |||||||||||||||||||
| Cumulative Reviews | 108,251 | 115,259 | 121,022 | 127,478 | 134,591 | 142,036 | 148,298 | 155,328 | 162,969 | ||||||||||
| Desktop Unique Visitors1 | 73,406 | 71,409 | 67,888 | 78,167 | 82,998 | 83,592 | 76,748 | 73,668 | 73,939 | ||||||||||
| Mobile Web Unique Visitors1 | 69,327 | 72,040 | 65,351 | 73,192 | 74,101 | 73,508 | 64,221 | 69,901 | 72,328 | ||||||||||
| Total Headcount | 4,150 | 4,350 | 4,250 | 4,350 | 4,600 | 5,050 | 5,200 | 5,250 | 5,300 | ||||||||||
| Repeat Rate5 | 78% | 79% | 80% | 78% | 76% | 78% | 77% | 71% | 69% | ||||||||||
| Advertising revenue by vertical | |||||||||||||||||||
| Home & Local Services | 30% | 30% | 30% | 30% | 31% | 31% | 31% | 32% | 33% | ||||||||||
| Restaurants | 14% | 15% | 15% | 14% | 14% | 15% | 14% | 14% | 14% | ||||||||||
| Beauty & Fitness | 12% | 12% | 12% | 13% | 13% | 12% | 12% | 12% | 12% | ||||||||||
| Health | 11% | 10% | 11% | 11% | 11% | 11% | 11% | 11% | 10% | ||||||||||
| Shopping | 9% | 10% | 9% | 9% | 9% | 9% | 9% | 8% | 8% | ||||||||||
| Other | 24% | 23% | 24% | 23% | 22% | 22% | 22% | 23% | 22% |
|
1 On a monthly average basis 2 Paying advertising accounts comprise all business accounts from which we recognize advertising revenue in a given three-month period 3 Sales headcount includes Local Client Partners as of 3Q16 4 Claimed local business locations for 3Q17, 4Q17 and 1Q18 have been adjusted to account for a recently discovered software error 5 Repeat rate as defined as the percentage of existing Paying advertising accounts from which we recognized advertising revenue at some point in the immediately preceding 12-month period For more information about the Company, including the factors that could affect the Company’s operating results, is included under the captions “Risk Factors” and “Management’s Discussion and Analysis of Financial Condition and Results of Operations” in the Company’s most recent Quarterly or Annual Report filed with the SEC, available at www.yelp-ir.com or the SEC’s website at www.sec.gov |
| 21 | Q2 2018 |
Non-GAAP Financial Measures
This letter includes, and statements made during the above referenced webcast will include, information relating to Adjusted EBITDA, EBITDA and Adjusted EBITDA margin, each of which the Securities and Exchange Commission has defined as a “non-GAAP financial measure.” We define Adjusted EBITDA as net income (loss), adjusted to exclude: provision for (benefit from) income taxes; other income, net; depreciation and amortization; stock-based compensation expense; any gain (loss) on the disposal of a business unit; and restructuring and integration costs. We define EBITDA as net income (loss), adjusted to exclude: provision for (benefit from) income taxes; other income, net; depreciation and amortization; and restructuring and integration costs. We define Adjusted EBITDA margin as Adjusted EBITDA divided by net revenue. Adjusted EBITDA, EBITDA and Adjusted EBITDA margin have been included in this letter, or will be included in the conference call, because they are key measures used by Yelp management and the board of directors to understand and evaluate core operating performance and trends, to prepare and approve Yelp’s annual budget and to develop short- and long-term operational plans. The presentation of this financial information, which is not prepared under any comprehensive set of accounting rules or principles, is not intended to be considered in isolation or as a substitute for the financial information prepared and presented in accordance with generally accepted accounting principles in the United States (“GAAP”).
Adjusted EBITDA and EBITDA have limitations as analytical tools, and you should not consider them in isolation or as substitutes for analysis of Yelp’s financial results as reported under GAAP. Some of these limitations are:
| > | Although depreciation and amortization are non-cash charges, the assets being depreciated and amortized may have to be replaced in the future, and Adjusted EBITDA and EBITDA do not reflect cash capital expenditure requirements for such replacements or for new capital expenditure requirements; |
| > | Adjusted EBITDA and EBITDA do not reflect changes in, or cash requirements for, Yelp’s working capital needs; |
| > | Adjusted EBITDA does not consider the potentially dilutive impact of equity-based compensation; |
| > | Adjusted EBITDA and EBITDA do not reflect tax payments that may represent a reduction in cash available to Yelp; |
| > | Adjusted EBITDA does not take into account any restructuring and integration costs; and |
| > | Other companies, including those in Yelp’s industry, may calculate Adjusted EBITDA and EBITDA differently, which reduces their usefulness as comparative measures. |
| 22 | Q2 2018 |
Because of these limitations, you should consider Adjusted EBITDA, EBITDA and Adjusted EBITDA margin alongside other financial performance measures, including various cash flow metrics, net income (loss) and Yelp’s other GAAP results.
Forward-Looking Statements
This letter contains, and statements made during the above referenced webcast will contain, forward-looking statements relating to, among other things, the future performance of Yelp and its consolidated subsidiaries that are based on Yelp’s current expectations, forecasts and assumptions and involve risks and uncertainties. These statements include, but are not limited to: statements regarding expected financial results for the third quarter and full year 2018; Yelp’s investment and other priorities for 2018 and beyond, including its ability to increase consumer usage through deepening its product experience in the Restaurants category and to capture more of the opportunity associated with its increased advertiser acquisition, as well as its ability to execute against those priorities; Yelp’s expectation that the improvement seen to date from the transition to non-term advertising in its sales reps’ success rate will continue and will drive revenue and profit in the future; Yelp’s ability to continue attracting new and returning advertisers through expanding sales channels and increasing ad product flexibility; trends in advertiser and revenue retention, including the impact of the increasing proportion of advertisers with non-term advertising contracts; the strategic partnership with Grubhub, including Yelp’s ability to capitalize on the partnership, the expected benefits of the partnership and the potential impact of the long-term partnership with Grubhub on Yelp’s business and financial results; Yelp’s ability to maintain and improve its earnings, margins, profitability and productivity; Yelp’s ability to capture a meaningful share of the large local market; the future growth in Yelp revenue, including the breakdown of such growth between Yelp’s sales channels and business categories, and advertiser accounts; the impact of Yelp’s transition to selling non-term advertising on the business, including on future revenue growth and profitability, paying advertiser account growth, sales force productivity and its fixed-cost leverage; Yelp’s ability to execute on its monetization strategy of converting traffic to its Restaurants category into engagement with businesses in other categories, where the vast majority of its Advertising revenue comes from; Yelp’s ability to increase usage of, awareness of and engagement on Yelp among consumers, and deliver value to consumers and local businesses; Yelp’s ability to develop proprietary experiences that more closely connect users with great local businesses; Yelp’s ability to increase transactions completed on its platform, including the continued development, growth and advertiser acceptance of Request-A-Quote; trends in the appeal of Yelp’s product offerings; Yelp’s ability to build a comprehensive offering in the Restaurant category, including the continued expansion of Yelp Reservations, Yelp Nowait and Yelp WiFi Marketing; and Yelp’s plans to manage dilution, including the implementation of the authorized stock repurchase program and purchase of shares thereunder. Yelp’s actual results could differ materially from those predicted or implied and reported results should not be considered as an indication of future performance. Factors that could cause or contribute to such differences include, but are not limited to: Yelp’s limited operating history in an evolving industry; Yelp’s ability to generate sufficient revenue to maintain profitability, particularly in light of its significant ongoing sales and marketing expenses, its ongoing investments in Yelp Reservations, Yelp Nowait and Yelp WiFi Marketing, and the sale of Eat24; the risk that Yelp will be unable to realize the intended benefits of the Grubhub partnership, which may adversely affect its business relationships, operating results and business generally; Yelp’s ability to successfully manage the acquisition and integration of new businesses, solutions or technologies, as well as to monetize the acquired products, solutions or technologies; Yelp’s reliance on traffic to its website from search engines like Google and Bing and the quality and reliability of such traffic; Yelp’s ability to generate and maintain sufficient high quality content from its users; maintaining a strong brand and managing negative publicity that may arise; maintaining and expanding Yelp’s base of advertisers, particularly as an increasing portion of advertisers have the ability to cancel their ad campaigns at any time; Yelp’s ability to timely upgrade and develop its systems, infrastructure and customer service capabilities; and Yelp’s ability to purchase shares under the stock repurchase purchase program, or the modification, suspension or termination of that program. The forward-looking statements in this release do not include the potential impact of any acquisitions or divestitures that may be announced and/or completed after the date hereof.
| 23 | Q2 2018 |
More information about factors that could affect Yelp’s operating results is included under the captions “Risk Factors” and “Management’s Discussion and Analysis of Financial Condition and Results of Operations” in Yelp’s most recent Annual Report on Form 10-K or Quarterly Report on Form 10-Q at http://www.yelp-ir.com or the SEC’s website at www.sec.gov. Undue reliance should not be placed on the forward-looking statements in this release, which are based on information available to Yelp on the date hereof. Yelp assumes no obligation to update such statements.