Attached files
| file | filename |
|---|---|
| EX-32.2 - EX-32.2 - NCS Multistage Holdings, Inc. | ncsm-20180630xex32_2.htm |
| EX-32.1 - EX-32.1 - NCS Multistage Holdings, Inc. | ncsm-20180630xex32_1.htm |
| EX-31.2 - EX-31.2 - NCS Multistage Holdings, Inc. | ncsm-20180630xex31_2.htm |
| EX-31.1 - EX-31.1 - NCS Multistage Holdings, Inc. | ncsm-20180630xex31_1.htm |
UNITED STATES
SECURITIES AND EXCHANGE COMMISSION
Washington, D.C. 20549
FORM 10-Q
(Mark One)
☑ Quarterly Report Pursuant to Section 13 or 15(d) of
the Securities Exchange Act of 1934
For the quarterly period ended June 30, 2018
OR
☐ Transition Report Pursuant to Section 13 or 15(d) of
the Securities Exchange Act of 1934
For the transition period from ______ to ______
Commission file number: 001-38071
NCS Multistage Holdings, Inc.
(Exact name of registrant as specified in its charter)
|
|
Delaware |
46-1527455 |
||
|
|
(State or other jurisdiction of incorporation or organization) |
(IRS Employer Identification number) |
||
|
|
||||
|
|
19450 State Highway 249, Suite 200 |
|||
|
|
Houston, Texas |
77070 |
||
|
|
(Address of principal executive offices) |
(Zip Code) |
Registrant’s telephone number, including area code: (281) 453-2222
Indicate by check mark whether the registrant (1) has filed all reports required to be filed by Section 13 or 15(d) of the Securities Exchange Act of 1934 during the preceding 12 months (or for such shorter period that the registrant was required to file such reports), and (2) has been subject to such filing requirements for the past 90 days. Yes ☑ No ☐
Indicate by check mark whether the registrant has submitted electronically and posted on its corporate Web site, if any, every Interactive Data File required to be submitted and posted pursuant to Rule 405 of Regulation S-T (§232.405 of this chapter) during the preceding 12 months (or for such shorter period that the registrant was required to submit and post such files). Yes ☑ No ☐
Indicate by check mark whether the registrant is a large accelerated filer, an accelerated filer, a non-accelerated filer, smaller reporting company, or an emerging growth company. See the definitions of “large accelerated filer,” “accelerated filer,” “smaller reporting company,” and “emerging growth company” in Rule 12b-2 of the Exchange Act.
|
|
|
|
|
|
|
|
|
Large accelerated filer |
☐ |
Accelerated filer |
☐ |
|
|
|
Non-accelerated filer |
☑ (Do not check if a smaller reporting company) |
Smaller reporting company |
☐ |
|
|
|
|
|
Emerging growth company |
☑ |
|
If an emerging growth company, indicate by check mark if the registrant has elected not to use the extended transition period for complying with any new or revised financial accounting standards provided pursuant to Section 13(a) of the Exchange Act. ☑
Indicate by check mark whether the registrant is a shell company (as defined in Rule 12b-2 of the Act). Yes ☐ No ☑
As of August 7, 2018, there were 44,908,920 shares of common stock outstanding.
|
|
Page |
|
|
|
||
|
Item 1. |
||
|
|
Condensed Consolidated Balance Sheets at June 30, 2018 and December 31, 2017 |
3 |
|
|
||
|
|
4 |
|
|
|
Condensed Consolidated Statements of Comprehensive (Loss) Income |
|
|
|
5 |
|
|
|
||
|
|
6 |
|
|
|
||
|
|
7 |
|
|
|
Notes to Unaudited Condensed Consolidated Financial Statements |
8 |
|
|
||
|
Item 2. |
Management’s Discussion and Analysis of Financial Condition and Results of Operations |
22 |
|
|
||
|
Item 3. |
35 |
|
|
|
||
|
Item 4. |
35 |
|
|
|
||
|
|
||
|
Item 1. |
36 | |
|
|
||
|
Item 1A. |
36 | |
|
|
||
|
Item 6. |
38 | |
|
|
||
| 39 | ||
2
CONDENSED CONSOLIDATED BALANCE SHEETS
(In thousands, except share data)
(Unaudited)
|
|
|
|
|
|
|
|
|
|
|
|
|
|
|
|
|
|
|
June 30, |
|
December 31, |
||
|
|
|
2018 |
|
2017 |
||
|
Assets |
|
|
|
|
|
|
|
Current assets |
|
|
|
|
|
|
|
Cash and cash equivalents |
|
$ |
33,477 |
|
$ |
33,809 |
|
Accounts receivable—trade, net |
|
|
40,394 |
|
|
47,880 |
|
Inventories |
|
|
30,991 |
|
|
33,135 |
|
Prepaid expenses and other current assets |
|
|
3,637 |
|
|
1,616 |
|
Other current receivables |
|
|
5,983 |
|
|
1,369 |
|
Total current assets |
|
|
114,482 |
|
|
117,809 |
|
Noncurrent assets |
|
|
|
|
|
|
|
Property and equipment, net |
|
|
25,691 |
|
|
23,651 |
|
Goodwill |
|
|
179,519 |
|
|
184,478 |
|
Identifiable intangibles, net |
|
|
126,876 |
|
|
136,412 |
|
Deposits and other assets |
|
|
1,416 |
|
|
1,563 |
|
Total noncurrent assets |
|
|
333,502 |
|
|
346,104 |
|
Total assets |
|
$ |
447,984 |
|
$ |
463,913 |
|
Liabilities and Stockholders’ Equity |
|
|
|
|
|
|
|
Current liabilities |
|
|
|
|
|
|
|
Accounts payable—trade |
|
$ |
8,320 |
|
$ |
7,448 |
|
Accrued expenses |
|
|
5,292 |
|
|
6,673 |
|
Income taxes payable |
|
|
129 |
|
|
10,561 |
|
Current contingent consideration |
|
|
11,695 |
|
|
— |
|
Other current liabilities |
|
|
2,361 |
|
|
1,673 |
|
Current maturities of long-term debt |
|
|
2,801 |
|
|
5,334 |
|
Total current liabilities |
|
|
30,598 |
|
|
31,689 |
|
Noncurrent liabilities |
|
|
|
|
|
|
|
Long-term debt, less current maturities |
|
|
22,240 |
|
|
21,702 |
|
Noncurrent contingent consideration |
|
|
— |
|
|
12,835 |
|
Other long-term liabilities |
|
|
1,224 |
|
|
4,513 |
|
Deferred income taxes, net |
|
|
20,427 |
|
|
24,183 |
|
Total noncurrent liabilities |
|
|
43,891 |
|
|
63,233 |
|
Total liabilities |
|
|
74,489 |
|
|
94,922 |
|
Commitments and contingencies (Note 9) |
|
|
|
|
|
|
|
Stockholders’ equity |
|
|
|
|
|
|
|
Preferred stock, $0.01 par value, 10,000,000 shares authorized, one share issued and outstanding at |
|
|
|
|
|
|
|
June 30, 2018 and December 31, 2017, respectively |
|
|
— |
|
|
— |
|
Common stock, $0.01 par value, 225,000,000 shares authorized, 44,926,665 shares issued |
|
|
|
|
|
|
|
and 44,908,317 shares outstanding at June 30, 2018 and 43,931,484 shares issued |
|
|
|
|
|
|
|
and 43,913,136 shares outstanding at December 31, 2017 |
|
|
449 |
|
|
439 |
|
Additional paid-in capital |
|
|
405,550 |
|
|
399,426 |
|
Accumulated other comprehensive loss |
|
|
(77,631) |
|
|
(66,707) |
|
Retained earnings |
|
|
31,036 |
|
|
23,864 |
|
Treasury stock, at cost; 18,348 shares at June 30, 2018 and at December 31, 2017 |
|
|
(175) |
|
|
(175) |
|
Total stockholders’ equity |
|
|
359,229 |
|
|
356,847 |
|
Non-controlling interest |
|
|
14,266 |
|
|
12,144 |
|
Total equity |
|
|
373,495 |
|
|
368,991 |
|
Total liabilities and stockholders' equity |
|
$ |
447,984 |
|
$ |
463,913 |
The accompanying notes are an integral part of these condensed consolidated financial statements.
3
CONDENSED CONSOLIDATED STATEMENTS OF OPERATIONS
(In thousands, except per share data)
(Unaudited)
|
|
|
|
|
|
|
|
|
|
|
|
|
|
|
|
|
|
|
|
|
|
|
|
|
|
|
|
|
|
|
Three Months Ended |
|
Six Months Ended |
||||||||
|
|
|
June 30, |
|
June 30, |
||||||||
|
|
|
2018 |
|
2017 |
|
2018 |
|
2017 |
||||
|
Revenues |
|
|
|
|
|
|
|
|
|
|
|
|
|
Product sales |
|
$ |
27,773 |
|
$ |
29,397 |
|
$ |
77,881 |
|
$ |
74,971 |
|
Services |
|
|
15,625 |
|
|
7,460 |
|
|
36,203 |
|
|
20,522 |
|
Total revenues |
|
|
43,398 |
|
|
36,857 |
|
|
114,084 |
|
|
95,493 |
|
Cost of sales |
|
|
|
|
|
|
|
|
|
|
|
|
|
Cost of product sales, exclusive of depreciation |
|
|
12,622 |
|
|
15,733 |
|
|
37,325 |
|
|
40,448 |
|
Cost of services, exclusive of depreciation |
|
|
7,290 |
|
|
3,152 |
|
|
16,179 |
|
|
7,791 |
|
Total cost of sales, exclusive of depreciation |
|
|
19,912 |
|
|
18,885 |
|
|
53,504 |
|
|
48,239 |
|
Selling, general and administrative expenses |
|
|
22,125 |
|
|
16,163 |
|
|
43,152 |
|
|
28,935 |
|
Depreciation |
|
|
1,156 |
|
|
678 |
|
|
2,255 |
|
|
1,242 |
|
Amortization |
|
|
3,283 |
|
|
5,973 |
|
|
6,604 |
|
|
11,995 |
|
Change in fair value of contingent consideration |
|
|
213 |
|
|
767 |
|
|
(1,140) |
|
|
767 |
|
(Loss) income from operations |
|
|
(3,291) |
|
|
(5,609) |
|
|
9,709 |
|
|
4,315 |
|
Other income (expense) |
|
|
|
|
|
|
|
|
|
|
|
|
|
Interest expense, net |
|
|
(608) |
|
|
(2,007) |
|
|
(1,065) |
|
|
(3,516) |
|
Other (expense) income, net |
|
|
(44) |
|
|
64 |
|
|
40 |
|
|
1,038 |
|
Foreign currency exchange gain |
|
|
106 |
|
|
1,952 |
|
|
289 |
|
|
1,011 |
|
Total other (expense) income |
|
|
(546) |
|
|
9 |
|
|
(736) |
|
|
(1,467) |
|
(Loss) income before income tax |
|
|
(3,837) |
|
|
(5,600) |
|
|
8,973 |
|
|
2,848 |
|
Income tax (benefit) expense |
|
|
(1,019) |
|
|
(855) |
|
|
(74) |
|
|
1,245 |
|
Net (loss) income |
|
|
(2,818) |
|
|
(4,745) |
|
|
9,047 |
|
|
1,603 |
|
Net income (loss) attributable to non-controlling interest |
|
|
1,235 |
|
|
(254) |
|
|
2,122 |
|
|
(456) |
|
Net (loss) income attributable to |
|
$ |
(4,053) |
|
$ |
(4,491) |
|
$ |
6,925 |
|
$ |
2,059 |
|
(Loss) earnings per common share |
|
|
|
|
|
|
|
|
|
|
|
|
|
Basic (loss) earnings per common share attributable to |
|
$ |
(0.09) |
|
$ |
(0.11) |
|
$ |
0.15 |
|
$ |
0.05 |
|
Diluted (loss) earnings per common share attributable to |
|
$ |
(0.09) |
|
$ |
(0.11) |
|
$ |
0.15 |
|
$ |
0.05 |
|
Weighted average common shares outstanding |
|
|
|
|
|
|
|
|
|
|
|
|
|
Basic |
|
|
44,778 |
|
|
40,198 |
|
|
44,517 |
|
|
37,119 |
|
Diluted |
|
|
44,778 |
|
|
40,198 |
|
|
47,186 |
|
|
40,188 |
The accompanying notes are an integral part of these condensed consolidated financial statements.
4
CONDENSED CONSOLIDATED STATEMENTS OF COMPREHENSIVE (LOSS) INCOME
(In thousands)
(Unaudited)
|
|
|
|
|
|
|
|
|
|
|
|
|
|
|
|
|
|
|
|
|
|
|
|
|
|
|
|
|
|
|
Three Months Ended |
|
Six Months Ended |
||||||||
|
|
|
June 30, |
|
June 30, |
||||||||
|
|
|
2018 |
|
2017 |
|
2018 |
|
2017 |
||||
|
Net (loss) income |
|
$ |
(2,818) |
|
$ |
(4,745) |
|
$ |
9,047 |
|
$ |
1,603 |
|
Foreign currency translation adjustments, net of tax of $0 |
|
|
(4,235) |
|
|
5,940 |
|
|
(10,924) |
|
|
7,593 |
|
Comprehensive (loss) income |
|
|
(7,053) |
|
|
1,195 |
|
|
(1,877) |
|
|
9,196 |
|
Less: Comprehensive income (loss) attributable to non-controlling interest |
|
|
1,235 |
|
|
(277) |
|
|
2,122 |
|
|
(456) |
|
Comprehensive (loss) income attributable to NCS Multistage Holdings, Inc. |
|
$ |
(8,288) |
|
$ |
1,472 |
|
$ |
(3,999) |
|
$ |
9,652 |
The accompanying notes are an integral part of these condensed consolidated financial statements.
5
CONDENSED CONSOLIDATED STATEMENTS OF STOCKHOLDERS’ EQUITY
(In thousands, except share data)
(Unaudited)
|
|
|
|
|
|
|
|
|
|
|
|
|
|
|
|
|
|
|
|
|
|
|
|
|
|
|
|
|
|
|
|
|
|
|
|
|
|
|
|
|
|
|
|
|
|
|
|
|
|
|
|
|
|
|
|
|
|
|
|
|
|
|
|
|
|
|
|
|
|
|
|
|
|
|
|
|
|
|
|
|
|
|
|
|
|
|
|
|
|
|
|
|
|
|
|
|
|
|
Six Months Ended June 30, 2017 |
||||||||||||||||||||||||||||
|
|
|
Preferred Stock |
|
Common Stock |
|
Additional |
|
Accumulated |
|
Retained |
|
Treasury Stock |
|
Non-controlling |
|
Total Stockholders' |
||||||||||||||
|
|
|
Shares |
|
Amount |
|
Shares |
|
Amount |
|
Capital |
|
(Loss) Income |
|
Earnings |
|
Shares |
|
Amount |
|
Interest |
|
Equity |
||||||||
|
Balances as of December 31, 2016 |
|
1 |
|
$ |
— |
|
34,024,326 |
|
$ |
340 |
|
$ |
237,566 |
|
$ |
(82,015) |
|
$ |
21,762 |
|
18,348 |
|
$ |
(175) |
|
$ |
— |
|
$ |
177,478 |
|
Acquisition |
|
— |
|
|
— |
|
— |
|
|
— |
|
|
— |
|
|
— |
|
|
— |
|
— |
|
|
— |
|
|
12,954 |
|
|
12,954 |
|
Share-based compensation |
|
— |
|
|
— |
|
— |
|
|
— |
|
|
1,836 |
|
|
— |
|
|
— |
|
— |
|
|
— |
|
|
— |
|
|
1,836 |
|
Net income (loss) |
|
— |
|
|
— |
|
— |
|
|
— |
|
|
— |
|
|
— |
|
|
2,059 |
|
— |
|
|
— |
|
|
(456) |
|
|
1,603 |
|
Issuance of common stock upon IPO, net of offering costs |
|
— |
|
|
— |
|
9,550,000 |
|
|
96 |
|
|
148,841 |
|
|
— |
|
|
— |
|
— |
|
|
— |
|
|
— |
|
|
148,937 |
|
Currency translation adjustment |
|
— |
|
|
— |
|
— |
|
|
— |
|
|
— |
|
|
7,593 |
|
|
— |
|
— |
|
|
— |
|
|
— |
|
|
7,593 |
|
Balances as of June 30, 2017 |
|
1 |
|
$ |
— |
|
43,574,326 |
|
$ |
436 |
|
$ |
388,243 |
|
$ |
(74,422) |
|
$ |
23,821 |
|
18,348 |
|
$ |
(175) |
|
$ |
12,498 |
|
$ |
350,401 |
|
|
|
|
|
|
|
|
|
|
|
|
|
|
|
|
|
|
|
|
|
|
|
|
|
|
|
|
|
|
|
|
|
|
|
Six Months Ended June 30, 2018 |
||||||||||||||||||||||||||||
|
|
|
Preferred Stock |
|
Common Stock |
|
Additional |
|
Accumulated |
|
Retained |
|
Treasury Stock |
|
Non-controlling |
|
Total Stockholders' |
||||||||||||||
|
|
|
Shares |
|
Amount |
|
Shares |
|
Amount |
|
Capital |
|
Loss |
|
Earnings |
|
Shares |
|
Amount |
|
Interest |
|
Equity |
||||||||
|
Balances as of December 31, 2017 |
|
1 |
|
$ |
— |
|
43,931,484 |
|
$ |
439 |
|
$ |
399,426 |
|
$ |
(66,707) |
|
$ |
23,864 |
|
18,348 |
|
$ |
(175) |
|
$ |
12,144 |
|
$ |
368,991 |
|
Adoption of ASC 606 |
|
— |
|
|
— |
|
— |
|
|
— |
|
|
— |
|
|
— |
|
|
247 |
|
— |
|
|
— |
|
|
— |
|
|
247 |
|
Share-based compensation |
|
— |
|
|
— |
|
— |
|
|
— |
|
|
5,332 |
|
|
— |
|
|
— |
|
— |
|
|
— |
|
|
— |
|
|
5,332 |
|
Net income |
|
— |
|
|
— |
|
— |
|
|
— |
|
|
— |
|
|
— |
|
|
6,925 |
|
— |
|
|
— |
|
|
2,122 |
|
|
9,047 |
|
Exercise of stock options |
|
— |
|
|
— |
|
552,869 |
|
|
6 |
|
|
796 |
|
|
— |
|
|
— |
|
— |
|
|
— |
|
|
— |
|
|
802 |
|
Cemblend exchangeable shares |
|
— |
|
|
— |
|
442,312 |
|
|
4 |
|
|
(4) |
|
|
— |
|
|
— |
|
— |
|
|
— |
|
|
— |
|
|
— |
|
Currency translation adjustment |
|
— |
|
|
— |
|
— |
|
|
— |
|
|
— |
|
|
(10,924) |
|
|
— |
|
— |
|
|
— |
|
|
— |
|
|
(10,924) |
|
Balances as of June 30, 2018 |
|
1 |
|
$ |
— |
|
44,926,665 |
|
$ |
449 |
|
$ |
405,550 |
|
$ |
(77,631) |
|
$ |
31,036 |
|
18,348 |
|
$ |
(175) |
|
$ |
14,266 |
|
$ |
373,495 |
The accompanying notes are an integral part of these condensed consolidated financial statements.
6
CONDENSED CONSOLIDATED STATEMENTS OF CASH FLOWS
(In thousands)
(Unaudited)
|
|
|
|
|
|
|
|
|
|
|
|
|
|
|
|
|
|
|
Six Months Ended |
||||
|
|
|
June 30, |
||||
|
|
|
2018 |
|
2017 |
||
|
Cash flows from operating activities |
|
|
|
|||
|
Net income |
|
$ |
9,047 |
|
$ |
1,603 |
|
Adjustments to reconcile net income to net cash provided by operating activities: |
|
|
|
|
|
|
|
Depreciation and amortization |
|
|
8,859 |
|
|
13,237 |
|
Amortization of deferred loan cost |
|
|
168 |
|
|
289 |
|
Share-based compensation |
|
|
5,332 |
|
|
1,836 |
|
Provision for inventory obsolescence |
|
|
858 |
|
|
— |
|
Deferred income tax benefit |
|
|
(2,185) |
|
|
(8,577) |
|
Gain on sale of property and equipment |
|
|
(16) |
|
|
(44) |
|
Foreign exchange gain on financing item |
|
|
— |
|
|
(1,780) |
|
Write-off of deferred loan costs |
|
|
— |
|
|
1,422 |
|
Change in fair value of contingent consideration |
|
|
(1,140) |
|
|
767 |
|
Changes in operating assets and liabilities: |
|
|
|
|
|
|
|
Accounts receivable—trade |
|
|
6,753 |
|
|
(3,598) |
|
Inventories |
|
|
391 |
|
|
(4,866) |
|
Prepaid expenses and other assets |
|
|
(2,066) |
|
|
(601) |
|
Accounts payable—trade |
|
|
1,587 |
|
|
60 |
|
Accrued expenses |
|
|
(1,284) |
|
|
1,407 |
|
Other liabilities |
|
|
284 |
|
|
(679) |
|
Income taxes receivable/payable |
|
|
(19,093) |
|
|
6,564 |
|
Net cash provided by operating activities |
|
|
7,495 |
|
|
7,040 |
|
Cash flows from investing activities |
|
|
|
|
|
|
|
Purchases of property and equipment |
|
|
(3,068) |
|
|
(3,873) |
|
Purchase and development of software and technology |
|
|
(714) |
|
|
— |
|
Proceeds from sales of property and equipment |
|
|
232 |
|
|
137 |
|
Proceeds from short-term note receivable |
|
|
— |
|
|
1,000 |
|
Acquisition of business, net of cash acquired |
|
|
— |
|
|
(5,996) |
|
Net cash used in investing activities |
|
|
(3,550) |
|
|
(8,732) |
|
Cash flows from financing activities |
|
|
|
|
|
|
|
Equipment note borrowings |
|
|
— |
|
|
1,533 |
|
Payments on equipment note and capital leases |
|
|
(846) |
|
|
(80) |
|
Promissory note borrowings |
|
|
4,884 |
|
|
2,955 |
|
Payments on promissory note |
|
|
(7,749) |
|
|
(1,216) |
|
Payment of deferred loan cost related to senior secured credit facility |
|
|
— |
|
|
(683) |
|
Payments related to public offering |
|
|
— |
|
|
(2,178) |
|
Proceeds from related party note receivable |
|
|
— |
|
|
752 |
|
Repayment of term note |
|
|
— |
|
|
(89,077) |
|
Proceeds from issuance of common stock, net of offering costs |
|
|
— |
|
|
151,356 |
|
Proceeds from the exercise of options for common stock |
|
|
802 |
|
|
— |
|
Net cash (used in) provided by financing activities |
|
|
(2,909) |
|
|
63,362 |
|
Effect of exchange rate changes on cash and cash equivalents |
|
|
(1,368) |
|
|
46 |
|
Net change in cash and cash equivalents |
|
|
(332) |
|
|
61,716 |
|
Cash and cash equivalents beginning of period |
|
|
33,809 |
|
|
18,275 |
|
Cash and cash equivalents end of period |
|
$ |
33,477 |
|
$ |
79,991 |
|
Supplemental cash flow information |
|
|
|
|
|
|
|
Cash paid for income taxes (net of refunds) |
|
$ |
20,830 |
|
$ |
3,297 |
|
Noncash investing and financing activities |
|
|
|
|
|
|
|
Assets obtained by entering into capital leases |
|
$ |
1,831 |
|
$ |
43 |
The accompanying notes are an integral part of these condensed consolidated financial statements.
7
NCS MULTISTAGE HOLDINGS, INC.
NOTES TO UNAUDITED CONDENSED CONSOLIDATED FINANCIAL STATEMENTS
NCS Multistage Holdings, Inc., through its wholly owned subsidiaries and subsidiaries for which we have a controlling voting interest (collectively referred to as the “Company,” “NCS,” “we” or “us”), is primarily engaged in providing engineered products and support services for oil and natural gas well completions and field development strategies. We offer our products and services primarily to exploration and production companies for use in onshore wells. We operate through service facilities principally located in Houston, Midland and Corpus Christi, Texas; Tulsa and Oklahoma City, Oklahoma; and Calgary, Red Deer, Grande Prairie and Estevan, Canada.
Basis of Presentation
Our accompanying unaudited condensed consolidated financial statements have been prepared in accordance with accounting principles generally accepted in the United States (“GAAP”) for interim financial information and with the instructions to Form 10-Q and Article 10 of Regulation S-X of the Securities Exchange Act of 1934, as amended (the “Exchange Act”), issued by the Securities Exchange Commission (“SEC”) and have not been audited by our independent registered public accounting firm. The Condensed Consolidated Balance Sheet at December 31, 2017 is derived from our audited financial statements. However, certain information and footnote disclosures required by GAAP for complete annual financial statements have been omitted or condensed as permitted by the rules and regulations of the SEC, and, therefore, these interim financial statements should be read in conjunction with our audited financial statements included in our Annual Report on Form 10-K filed with the SEC on March 9, 2018. In the opinion of management, these condensed consolidated financial statements, which have been prepared pursuant to the rules of the SEC and GAAP for interim financial reporting, reflect all adjustments, which consisted only of normal recurring adjustments that were necessary for a fair statement of the interim periods presented. The results of operations for interim periods are not necessarily indicative of those for a full year. All intercompany accounts and transactions have been eliminated for purposes of preparing these condensed consolidated financial statements.
Summary of New Significant Accounting Policy
Certain costs incurred in the development of internal-use software applications are capitalized and costs incurred outside of the software application development stage are expensed as incurred. The amounts capitalized are included in intangibles, categorized as internally developed software, and will be amortized on a straight-line basis over the estimated useful life of the software, which is five years. We will begin to amortize internal-use software when it is ready for its intended use.
Recent Accounting Pronouncements
Pronouncements Adopted in 2018
In June 2018, the Financial Accounting Standards Board (“FASB”) issued Accounting Standards Update (“ASU”) 2018-07, Improvements to Nonemployee Share-Based Payment Accounting (Topic 718). The ASU is intended to reduce the cost and complexity and to improve financial reporting for nonemployee share-based payments. The ASU expands the scope of Topic 718 to include share-based payments issued to nonemployees for goods or services. Consequently, the accounting for share-based payments to nonemployees and employees will be substantially aligned. The ASU is for fiscal years beginning after December 15, 2018, including interim periods within that fiscal year. Early adoption is permitted, but no earlier than an entity’s adoption date of Topic 606, Revenue from Contracts with Customers. We have elected to early adopt this ASU on April 1, 2018. The adoption of this ASU did not have a material impact on our condensed consolidated financial statements.
In January 2017, the FASB issued ASU 2017-01, Clarifying the Definition of a Business (Topic 805), to clarify the definition of a business with the objective of adding guidance to assist entities with evaluating whether transactions should be accounted for as acquisitions or disposals of assets or businesses. For public entities, this guidance is effective for annual periods beginning after December 15, 2017, including interim periods within those periods. We adopted ASU 2017-01 on January 1, 2018, which did not have a material impact on our condensed consolidated financial statements.
In August 2016, the FASB issued ASU 2016-15, Classification of Certain Cash Receipts and Cash Payments (Topic 230). The objective of the guidance is to reduce the existing diversity in practice related to the presentation and classification of certain cash receipts and cash payments. The guidance addresses eight specific cash flow issues including but not limited to, debt prepayment or
8
NCS MULTISTAGE HOLDINGS, INC.
NOTES TO UNAUDITED CONDENSED CONSOLIDATED FINANCIAL STATEMENTS
extinguishment costs, contingent consideration payments made after a business combination, proceeds from the settlement of insurance claims and proceeds from the settlement of corporate-owned life insurance policies. For public entities, the guidance is effective for financial statements issued for fiscal years beginning after December 15, 2017, including interim periods within those fiscal years and is retrospective for all periods presented. Early adoption is permitted including for interim periods. We adopted ASU 2016-15 on January 1, 2018, which did not have a material impact on our condensed consolidated financial statements.
In May 2014, the FASB issued ASU No. 2014-09, Revenue from Contracts with Customers (Topic 606). The new standard is effective for annual reporting periods beginning after December 15, 2017 and early adoption is permitted, however, not before fiscal years beginning after December 15, 2016. Subsequent to ASU 2014-09’s issuance, Topic 606 was amended for FASB updates that changed the effective date as well as addressed certain aspects regarding new revenue standards. The comprehensive new standard will supersede existing revenue recognition guidance and require revenue to be recognized when promised goods or services are transferred to customers in amounts that reflect the consideration to which entities expect to be entitled in exchange for those goods or services. Adoption of the new rules could affect the timing of revenue recognition for certain transactions. The guidance permits the use of either a full retrospective or modified retrospective transition method. On January 1, 2018, we adopted ASU 2014-09 and its related amendments (collectively known as Accounting Standards Codification “ASC 606”), using the modified retrospective method. We have concluded that the adoption of this ASU did not have a material impact on our condensed consolidated financial statements. See “Note 2. Revenue” for the required disclosures related to the impact of adopting this standard.
Pronouncements Not Yet Effective
In February 2016, the FASB issued ASU No. 2016-02, Leases (Topic 842), which replaces the existing guidance in ASC 840, Leases. Under ASC 842, lessees will need to recognize most leases on their balance sheets as lease liabilities with corresponding right-of-use assets. The new lease standard also changes the definition of a lease and requires expanded quantitative and qualitative disclosures for both lessees and lessors. Entities are required to adopt ASC 842 using a modified retrospective transition method. Certain practical expedients can be applied. The new standard is effective for interim and annual reporting periods beginning after December 15, 2018, with early adoption permitted. We plan to adopt ASC 842 effective January 1, 2019 and are currently assessing the impact of the adoption. During the second quarter of 2018, we put in place a team, including a third-party consultant, to evaluate our current lease contracts and analyze contracts that may contain lease components. While we cannot currently estimate the quantitative effect that ASC 842 will have on our condensed consolidated financial statements, the adoption of ASC 842 will increase our asset and liability balances on the condensed consolidated balance sheets due to the required recognition of right-of-use assets and corresponding lease liabilities for most lease obligations that are currently classified as operating leases.
Note 2. Revenues
On January 1, 2018, we adopted ASC 606 and elected to use the modified retrospective method for all contracts not completed as of the date of adoption. The reported results for 2018 reflect the application of ASC 606 guidance while the reported results for 2017 were prepared under the guidance of ASC 605, Revenue Recognition. In accordance with ASC 606, revenue is recognized when promised goods or services are transferred to customers in an amount that reflects the consideration to which an entity expects to be entitled for those goods or services if certain criteria are met.
Financial Statement Impact of Adopting ASC 606
The cumulative effect of the changes made to our condensed consolidated balance sheet at January 1, 2018 for the adoption of ASC 606 using the modified retrospective method was as follows (in thousands):
[
|
|
|
|
|
|
|
|
|
|
|
|
|
|
|
|
Balance at |
|
Adjustments |
|
|
|
||
|
|
|
|
December 31, |
|
due to |
|
Balance at |
|||
|
|
|
|
2017 |
|
ASC 606 |
|
January 1, 2018 |
|||
|
Assets |
|
|
|
|
|
|
|
|
|
|
|
Accounts receivable—trade, net |
|
|
$ |
47,880 |
|
$ |
313 |
|
$ |
48,193 |
|
|
|
|
|
|
|
|
|
|
|
|
|
Liabilities |
|
|
|
|
|
|
|
|
|
|
|
Income taxes payable |
|
|
$ |
10,561 |
|
$ |
66 |
|
$ |
10,627 |
|
|
|
|
|
|
|
|
|
|
|
|
|
Equity |
|
|
|
|
|
|
|
|
|
|
|
Retained earnings |
|
|
$ |
23,864 |
|
$ |
247 |
|
$ |
24,111 |
9
NCS MULTISTAGE HOLDINGS, INC.
NOTES TO UNAUDITED CONDENSED CONSOLIDATED FINANCIAL STATEMENTS
The following tables compare the reported condensed consolidated balance sheet as of June 30, 2018 and statements of operations for the three and six months ended June 30, 2018, to the balances without the adoption of ASC 606 (in thousands):
|
|
|
|
|
|
|
|
|
|
|
|
|
|
|
|
As of June 30, 2018 |
|||||||
|
|
|
|
|
|
Balances |
|
Effect of |
|||
|
|
|
|
|
|
without Adoption |
|
Change |
|||
|
|
|
|
As Reported |
|
of ASC 606 |
|
Higher/(Lower) |
|||
|
Balance Sheet |
|
|
|
|
|
|
|
|
|
|
|
|
|
|
|
|
|
|
|
|
|
|
|
Assets |
|
|
|
|
|
|
|
|
|
|
|
Accounts receivable—trade, net |
|
|
$ |
40,394 |
|
$ |
40,235 |
|
$ |
159 |
|
|
|
|
|
|
|
|
|
|
|
|
|
Liabilities |
|
|
|
|
|
|
|
|
|
|
|
Income taxes payable |
|
|
$ |
129 |
|
$ |
96 |
|
$ |
33 |
|
|
|
|
|
|
|
|
|
|
|
|
|
Equity |
|
|
|
|
|
|
|
|
|
|
|
Retained earnings |
|
|
$ |
31,036 |
|
$ |
30,910 |
|
$ |
126 |
|
|
|
|
|
|
|
|
|
|
|
|
|
|
|
|
|
|
|
|
|
|
|
|
|
Three Months Ended June 30, 2018 |
|
Six Months Ended June 30, 2018 |
||||||||||||||
|
|
|
|
|
|
Balances |
|
Effect of |
|
|
|
Balances |
|
Effect of |
||||||
|
|
|
|
|
|
without Adoption |
|
Change |
|
|
|
without Adoption |
|
Change |
||||||
|
|
|
|
As Reported |
|
of ASC 606 |
|
Higher/(Lower) |
|
As Reported |
|
of ASC 606 |
|
Higher/(Lower) |
||||||
|
Income Statement |
|
|
|
|
|
|
|
|
|
|
|
|
|
|
|
|
|
|
|
|
|
|
|
|
|
|
|
|
|
|
|
|
|
|
|
|
|
|
|
|
|
Revenues |
|
|
|
|
|
|
|
|
|
|
|
|
|
|
|
|
|
|
|
|
Services |
|
|
$ |
15,625 |
|
$ |
16,044 |
|
$ |
(419) |
|
$ |
36,203 |
|
$ |
36,357 |
|
$ |
(154) |
|
|
|
|
|
|
|
|
|
|
|
|
|
|
|
|
|
|
|
|
|
|
Costs and expenses |
|
|
|
|
|
|
|
|
|
|
|
|
|
|
|
|
|
|
|
|
Income tax (benefit) expense |
|
|
$ |
(1,019) |
|
$ |
(931) |
|
$ |
(88) |
|
$ |
(74) |
|
$ |
(42) |
|
$ |
(32) |
|
Net income |
|
|
$ |
(2,818) |
|
$ |
(2,487) |
|
$ |
(331) |
|
$ |
9,047 |
|
$ |
9,169 |
|
$ |
(122) |
|
Net income attributable to NCS Multistage Holdings, Inc. |
|
|
$ |
(4,053) |
|
$ |
(3,722) |
|
$ |
(331) |
|
$ |
6,925 |
|
$ |
7,047 |
|
$ |
(122) |
Revenue Recognition
We derive our revenues primarily from highly engineered products and support services. Revenues are based upon a purchase order, contract or other persuasive evidence of an arrangement with the customer that includes a fixed or determinable price, provided that collectability is reasonably assured, but such arrangements do not generally include right of return or other similar provisions or other significant post-delivery obligations. Sales and value added taxes that we collect concurrent with revenue-producing activities are excluded from revenue. We determine revenue recognition through the following steps: (i) identify the contract, (ii) identify the performance obligations, (iii) determine the transaction price, (iv) allocate the transaction price and (v) satisfy the performance obligation.
On occasion, we issue credits to our customers that are related specifically to the performance of our products or the services we provide, with such credits reducing the amount of revenue for that sale or job. Such credits are infrequent, situation-specific and cannot be estimated in advance.
The payment terms and conditions in our customer contracts vary. We do not have contracts that contain a significant financing component and do not accept noncash consideration from customers.
NCS has elected to recognize shipping and handling costs when the title of the product transfers to the customer. These costs are included in cost of sales in our condensed consolidated statements of operations.
Product Sales Revenues
For product sale arrangements that are standard inventory products or modified inventory products with an alternative use, revenue is recognized at a point in time when control transfers. Control generally transfers upon shipment, which is also when risk of loss and title transfers. Customers may also request bill and hold arrangements in writing. Once we have completed the bill and hold
10
NCS MULTISTAGE HOLDINGS, INC.
NOTES TO UNAUDITED CONDENSED CONSOLIDATED FINANCIAL STATEMENTS
order, the products are segregated from the rest of inventory in the warehouse. The products are delivered based on the customer instructions and revenue is recognized when control transfers, which is generally when title is transferred to the customer.
The transaction price for product sales having a performance obligation is the price per unit times the unit quantity ordered and shipped to the customer or consumed at the well site.
For service arrangements that do not have a contract provision with a right to a payment for services up to the date of termination, revenue is recognized when the job has been completed, which usually includes a customer signature or acknowledgement and when there are no additional services or future obligations required by us. The transaction price is determined by the contract unit day rate times the cumulative number of days of service provided upon the completion of the service and upon customer acceptance.
For service arrangements that do have a contract provision with a right to payment for services up to the date of termination, revenue is recognized over time using a unit rate (labor and materials) output method that corresponds to the value we would receive upon termination of the contract at a reporting period. In applying the output method at the end of a quarter, we check that there is no material work in progress that is not in the measurement of the output. The transaction price for the period end is determined by the contract unit rate times the cumulative number of units earned up to the reporting period less any revenue recognized in prior periods.
Disaggregation of Revenue
We sell our products and services primarily in North America and in selected international markets. Revenue by geography is attributed based on the current billing address of the customer. The following table depicts the disaggregation of revenue by geographic region (in thousands):
|
|
|
|
|
|
|
|
|
|
|
Three Months Ended |
|
Six Months Ended |
||
|
|
|
June 30, |
|
June 30, |
||
|
|
|
2018 |
|
2018 |
||
|
United States |
|
|
|
|
|
|
|
Product sales |
|
$ |
16,309 |
|
$ |
29,886 |
|
Services |
|
|
11,396 |
|
|
19,819 |
|
Total United States |
|
|
27,705 |
|
|
49,705 |
|
Canada |
|
|
|
|
|
|
|
Product sales |
|
|
10,740 |
|
|
46,438 |
|
Services |
|
|
3,132 |
|
|
14,609 |
|
Total Canada |
|
|
13,872 |
|
|
61,047 |
|
Other Countries |
|
|
|
|
|
|
|
Product sales |
|
|
724 |
|
|
1,557 |
|
Services |
|
|
1,097 |
|
|
1,775 |
|
Total Other Countries |
|
|
1,821 |
|
|
3,332 |
|
Total |
|
|
|
|
|
|
|
Product sales |
|
|
27,773 |
|
|
77,881 |
|
Services |
|
|
15,625 |
|
|
36,203 |
|
Total |
|
$ |
43,398 |
|
$ |
114,084 |
11
NCS MULTISTAGE HOLDINGS, INC.
NOTES TO UNAUDITED CONDENSED CONSOLIDATED FINANCIAL STATEMENTS
Contract Balances
When the timing of the delivery of products and provision of services is different from the timing of the customer payments, we recognize either a contract asset (performance precedes contractual due date in connection with estimates of variable consideration) or a contract liability (customer payment precedes performance) on our condensed consolidated balance sheet. The following table includes the contract assets and liabilities as of June 30, 2018 and January 1, 2018 (in thousands):
|
|
|
|
|
|
|
|
|
|
|
|
|
|
|
|
|
Contract Assets |
|
Contract Liabilities |
||||||||
|
|
|
Current |
|
Non-Current |
|
Current |
|
Non-Current |
||||
|
Balance at January 1, 2018 |
|
$ |
— |
|
$ |
— |
|
$ |
170 |
|
$ |
— |
|
Additions |
|
|
— |
|
|
— |
|
|
301 |
|
|
— |
|
Revenue recognized |
|
|
— |
|
|
— |
|
|
(170) |
|
|
— |
|
Balance at June 30, 2018 |
|
$ |
— |
|
$ |
— |
|
$ |
301 |
|
$ |
— |
Our contract liability as of June 30, 2018 is included in current liabilities on our condensed consolidated balance sheet. Our performance obligations for our product and service revenues are usually satisfied before the customer’s payment although prepayments may occasionally be required for international sales.
Contracts with Multiple Performance Obligations
Greater than 99% of our product and service revenues are considered a single performance obligation. Our self-service product line, which is less than one percent of our revenue for the three and six months ended June 30, 2018, is made up of two performance obligations: (i) the delivery of tracer materials to a customer well site and (ii) the creation of diagnostic reports ordered by customers when we do not perform an integrated service. For these contracts, we do not allocate the transaction price as the individual performance obligations are sold at standalone prices in the customer order. The transaction prices for our self-service product line that have two performance obligations are (i) the price per unit times the quantity of tracer materials and (ii) prices charged for diagnostic reports ordered by and delivered to the customer.
Practical Expedients and Exemptions
We generally expense sales commissions when incurred because the amortization period would have been one year or less. These costs are recorded within selling, general and administrative expenses.
We do not disclose the value of unsatisfied performance obligations when the related contract has a duration of one year or less or we recognize revenue equal to what we have the right to invoice when that amount corresponds directly with the value to the customer of our performance to date.
Note 3. Acquisitions
Spectrum Tracer Services
On August 31, 2017, we acquired 100% of the equity interests in Spectrum Tracer Services, LLC (“Spectrum”) in exchange for approximately $83 million, subject to certain adjustments, which was comprised of (i) approximately $76 million in cash and (ii) 0.4 million shares of our common stock using a fair market value of $19.42 per share. The cash portion was funded with available cash and borrowings under our Senior Secured Credit Facility (as defined below). We believe Spectrum’s tracer diagnostics services offering strengthens our ability to provide our customers with actionable data and analysis to optimize oil and natural gas well completions and field development strategies.
The acquisition of Spectrum includes an earn-out provision that could provide up to $12.5 million in additional cash consideration to Spectrum’s former unitholders if Spectrum’s actual gross profit during the earn-out period that commenced on October 1, 2017 and ends on December 31, 2018 is greater than the earn-out threshold. The fair value of the earn-out recognized on the acquisition date was $0.4 million. We estimated the fair value of the earn-out using a risk-neutral option pricing analysis within a Monte Carlo simulation framework. The earn-out is subject to re-measurement each reporting period using Level 3 inputs until it has been paid. Subsequent changes in the fair value of the liability are reflected in our condensed consolidated statements of operations as a change in fair value of contingent consideration. As of June 30, 2018, the earn-out had a value of $2.0 million, which is included in current contingent consideration on the condensed consolidated balance sheet. As of December 31, 2017, the earn-out had a value of $3.4 million and is included in noncurrent contingent consideration on the condensed consolidated balance sheet. During the three and six months ended June 30, 2018, we recognized a change of $0.1 million and $(1.4) million, respectively, in the estimated fair value of
12
NCS MULTISTAGE HOLDINGS, INC.
NOTES TO UNAUDITED CONDENSED CONSOLIDATED FINANCIAL STATEMENTS
contingent consideration expense in the condensed consolidated statements of operations related to the change in fair value of the Spectrum earn-out. The cash payment, if any, is expected to be paid during the second quarter of 2019.
The following unaudited pro forma summary presents our select financial information as if the acquisition had occurred on January 1, 2016. The below information reflects pro forma adjustments based on available information and certain assumptions we believe are reasonable, including: (i) adjustments related to the depreciation and amortization of the fair value of acquired intangibles and fixed assets, (ii) removal of the historical interest expense of Spectrum as well as the addition of the interest expense of the borrowings under our Senior Secured Credit Facility in connection with the acquisition, (iii) tax effect related to historical U.S. operations and the aforementioned pro forma adjustments, (iv) adjustments related to the number of shares of our common stock outstanding to reflect the 0.4 million shares issued in connection with the acquisition and (v) accounting policy conformity changes. The pro forma condensed combined financial information has been included for comparative purposes and is not necessarily indicative of the results that might have actually occurred had the Spectrum acquisition taken place on January 1, 2016; furthermore, the financial information is not intended to be a projection of future results. The following table summarizes our unaudited selected financial information on a pro forma basis (in thousands, except per share data):
|
|
|
|
|
|
|
|
|
|
|
Pro Forma (Unaudited) |
||||
|
|
|
Three Months Ended |
|
Six Months Ended |
||
|
|
|
June 30, 2017 |
|
June 30, 2017 |
||
|
Revenue |
|
$ |
44,771 |
|
$ |
108,777 |
|
Net (loss) income attributable to NCS Multistage Holdings, Inc. |
|
$ |
(3,846) |
|
$ |
3,416 |
|
Diluted earnings per share |
|
$ |
(0.09) |
|
$ |
0.08 |
The purchase price is allocated to the estimated fair value of assets acquired and liabilities assumed as of the acquisition date. Goodwill is calculated as the excess of the consideration transferred over the fair value of the net assets recognized. By combining Spectrum’s tracer diagnostics services offering with our existing portfolio of completions products and services, we believe we have an opportunity to increase our revenue through the cross-selling of tracer diagnostics services to current NCS customers and to sell NCS’s completions products and services to current Spectrum customers. This expected synergy gives rise to goodwill being recorded as part of the purchase price of Spectrum. The assets and liabilities of Spectrum have been measured based on various preliminary estimates using assumptions that we believe are reasonable based on information that is currently available. The purchase price allocation is preliminary and adjustments to provisional amounts may occur as we continue to analyze information. We have recognized $40.2 million of goodwill as a result of the transaction of which approximately $6 million will be non-deductible for tax purposes. Additional changes to the purchase price allocation may result in a corresponding change to goodwill in the period of the change as we are currently evaluating the deferred taxes calculation, however, we do not expect such adjustments to materially change the purchase price allocation. We also incurred acquisition costs of $0.3 million and $0.4 million related to this acquisition during the three and six months ended June 30, 2017, respectively, which was included in general and administrative expense on our condensed consolidated statements of operations.
13
NCS MULTISTAGE HOLDINGS, INC.
NOTES TO UNAUDITED CONDENSED CONSOLIDATED FINANCIAL STATEMENTS
The following table summarizes the consideration and the assets acquired at the Spectrum closing date (in thousands):
|
|
|
|
|
|
Consideration |
|
|
|
|
Cash consideration |
|
$ |
76,485 |
|
Equity consideration |
|
|
6,907 |
|
Earn-out liability recognized |
|
|
352 |
|
Total consideration |
|
$ |
83,744 |
|
Preliminary purchase price allocation |
|
|
|
|
Cash |
|
$ |
1,326 |
|
Accounts receivable |
|
|
4,648 |
|
Inventories |
|
|
3,761 |
|
Other current assets |
|
|
480 |
|
Property and equipment |
|
|
4,725 |
|
Intangible assets |
|
|
31,900 |
|
Other long-term assets |
|
|
26 |
|
Total identifiable assets acquired |
|
|
46,866 |
|
Accounts payable—trade |
|
|
454 |
|
Accrued expenses |
|
|
436 |
|
Income taxes payable |
|
|
228 |
|
Other current liabilities |
|
|
44 |
|
Deferred tax liability |
|
|
956 |
|
Other long-term liabilities |
|
|
1,191 |
|
Total liabilities assumed |
|
|
3,309 |
|
Net identifiable assets acquired |
|
|
43,557 |
|
Goodwill |
|
|
40,187 |
|
Net assets acquired |
|
$ |
83,744 |
The amount allocated to intangible assets was attributed to the following categories (in thousands):
|
|
|
|
|
|
|
|
|
|
|
|
|
|
|
Estimated Useful |
|
|
|
Fair Value |
|
|
Lives (Years) |
|
|
Technology |
|
$ |
5,600 |
|
|
16 |
|
Trademarks |
|
|
1,600 |
|
|
10 |
|
Customer relationships |
|
|
24,700 |
|
|
21 |
|
Total intangible assets |
|
$ |
31,900 |
|
|
|
These intangible assets are amortized on a straight-line basis, which is presented in amortization in our condensed consolidated statements of operations. Amortization expense for the intangible assets for the Spectrum acquisition was $0.4 million and $0.8 million for the three and six months ended June 30, 2018, respectively.
On February 1, 2017, we acquired a 50% interest in Repeat Precision for $6.0 million. Historically, the business has been a supplier to NCS. Our strategic purchase of 50% of this business ensures that we have continued access to these services and allows us greater control of the allocation of their capacity, ensuring that we can scale their operations together with ours. In addition, Repeat Precision also markets composite frac plugs and related products, providing an additional revenue opportunity.
Concurrent with entering into the transaction, the previous owner of the 50% interest repaid a $1.0 million promissory note to us. We also recorded an earn-out at the acquisition date as a contingent adjustment to the purchase price in the amount of $7.0 million. We estimated the fair value of the earn-out using a Monte Carlo simulation on the acquisition date. The earn-out equity value was based on Repeat Precision’s 2018 EBITDA, multiplied by three, which was then reduced by debt and increased by cash. The earn-out equity value was then discounted at the adjusted cost of equity. The earn-out is subject to re-measurement each reporting period using Level 3 inputs until it has been paid. Subsequent changes in the fair value of the liability are reflected in our condensed consolidated statements of operations as a change in fair value of contingent consideration. As of June 30, 2018, the earn-out had a value of $9.7 million, which is included in current contingent consideration on the condensed consolidated balance sheet. As of December 31, 2017, the earn-out had a value of $9.4 million, which is included in noncurrent contingent consideration on the condensed consolidated balance sheet. We recognized $0.1 million and $0.8 million during the three months ended June 30, 2018 and 2017,
14
NCS MULTISTAGE HOLDINGS, INC.
NOTES TO UNAUDITED CONDENSED CONSOLIDATED FINANCIAL STATEMENTS
respectively, in addition to $0.3 million and $0.8 million for the six months ended June 30, 2018 and 2017, respectively, as an increase in fair value of contingent consideration expense in the condensed consolidated statements of operations related to the change in fair value of the earn-out. The cash payment, if any, is expected to be paid during the first quarter of 2019 and will not exceed $10.0 million.
As NCS has the controlling voting interest in Repeat Precision, we determined that the transaction was a business combination and used the acquisition method of accounting and have included Repeat Precision in our condensed consolidated financial statements from the acquisition date. As a result, the other party’s ownership percentage is presented separately as a non-controlling interest.
The purchase price is allocated to the fair value of assets acquired and liabilities assumed as of the acquisition date and goodwill is recognized for the excess consideration transferred over the fair value of the net assets. By combining Repeat Precision’s expertise in providing high-quality machining services with NCS’s engineering capabilities, product development expertise and customer relationships, we believe that we have additional revenue opportunities for NCS to leverage the vertically integrated supply chain by developing and marketing new completions products. This expected synergy gives rise to goodwill being recorded as part of the purchase price of Repeat. The purchase price allocation was finalized during the first quarter of 2018. We have recognized $15.2 million of goodwill as a result of the transaction and expect the full amount to be deductible for tax purposes. We also incurred acquisition costs of $21 thousand and $0.3 million related to this acquisition for the three and six months ended June 30, 2017, respectively, which were included in general and administrative expense on our condensed consolidated statements of operations.
The following table summarizes the consideration and the assets acquired at the Repeat Precision closing date (in thousands):
|
|
|
|
|
|
Consideration |
|
|
|
|
Cash paid by NCS |
|
$ |
5,996 |
|
Earn-out liability recognized |
|
|
6,958 |
|
Total consideration |
|
$ |
12,954 |
|
Preliminary purchase price allocation |
|
|
|
|
Other net assets |
|
$ |
174 |
|
Inventory |
|
|
662 |
|
Property and equipment |
|
|
5,750 |
|
Intangible assets |
|
|
4,100 |
|
Goodwill |
|
|
15,222 |
|
Total assets acquired |
|
$ |
25,908 |
|
Less: non-controlling interest |
|
|
(12,954) |
|
Net assets acquired |
|
$ |
12,954 |
The unaudited pro forma operating results pursuant to ASC 805 related to the Repeat Precision acquisition have been excluded due to immateriality.
In connection with the Repeat Precision acquisition, we acquired intangible assets in the amount of $4.1 million related to customer relationships. The intangible assets are amortized over their estimated ten-year useful lives. Amortization expense for the Repeat Precision acquisition was $0.1 million for each of the three months ended June 30, 2018 and 2017, respectively, and $0.2 million for each of the six months ended June 30, 2018 and 2017, respectively.
Note 4. Inventories
Inventories consist of the following as of June 30, 2018 and December 31, 2017 (in thousands):
|
|
|
|
|
|
|
|
|
|
|
June 30, |
|
December 31, |
||
|
|
|
2018 |
|
2017 |
||
|
Raw materials |
|
$ |
2,812 |
|
$ |
2,412 |
|
Work in process |
|
|
746 |
|
|
623 |
|
Finished goods |
|
|
27,433 |
|
|
30,100 |
|
Total inventories |
|
$ |
30,991 |
|
$ |
33,135 |
15
NCS MULTISTAGE HOLDINGS, INC.
NOTES TO UNAUDITED CONDENSED CONSOLIDATED FINANCIAL STATEMENTS
Note 5. Property and Equipment
Property and equipment by major asset class consist of the following as of June 30, 2018 and December 31, 2017 (in thousands):
|
|
|
|
|
|
|
|
|
|
|
|
|
|
|
|
|
|
|
June 30, |
|
December 31, |
||
|
|
|
2018 |
|
2017 |
||
|
Land |
|
$ |
2,071 |
|
$ |
2,167 |
|
Building and improvements |
|
|
4,989 |
|
|
5,155 |
|
Machinery and equipment |
|
|
14,057 |
|
|
13,418 |
|
Computers and software |
|
|
2,093 |
|
|
2,157 |
|
Furniture and fixtures |
|
|
1,042 |
|
|
1,013 |
|
Vehicles |
|
|
6,809 |
|
|
5,751 |
|
Service equipment |
|
|
244 |
|
|
244 |
|
|
|
|
31,305 |
|
|
29,905 |
|
Less: Accumulated depreciation and amortization |
|
|
(8,265) |
|
|
(7,012) |
|
|
|
|
23,040 |
|
|
22,893 |
|
Construction in progress |
|
|
2,651 |
|
|
758 |
|
Property and equipment, net |
|
$ |
25,691 |
|
$ |
23,651 |
Note 6. Goodwill and Identifiable Intangibles
Changes in the carrying amount of goodwill are as follows (in thousands):
|
|
|
|
|
|
|
|
|
|
|
At December 31, 2016 |
|
$ |
122,077 |
|
Acquisitions |
|
|
55,409 |
|
Currency translation adjustment |
|
|
6,992 |
|
At December 31, 2017 |
|
$ |
184,478 |
|
Currency translation adjustment |
|
|
(4,959) |
|
At June 30, 2018 |
|
$ |
179,519 |
Identifiable intangibles by major asset class consist of the following (in thousands):
|
|
|
|
|
|
|
|
|
|
|
|
|
|
|
|
|
|
|
|
|
|
|
|
|
|
|
|
|
|
|
June 30, 2018 |
|||||||
|
|
|
Estimated |
|
Gross |
|
|
|
|
|
|
|
|
|
|
Useful |
|
Carrying |
|
Accumulated |
|
Net |
|||
|
|
|
Lives (Years) |
|
Amount |
|
Amortization |
|
Balance |
|||
|
Technology |
|
14 - 16 |
|
$ |
146,283 |
|
$ |
(56,068) |
|
$ |
90,215 |
|
Trademarks |
|
5 - 10 |
|
|
1,600 |
|
|
(133) |
|
|
1,467 |
|
Customer relationships |
|
10 - 21 |
|
|
40,458 |
|
|
(5,923) |
|
|
34,535 |
|
Internally developed software |
|
5 |
|
|
659 |
|
|
— |
|
|
659 |
|
Total identifiable intangibles |
|
|
|
$ |
189,000 |
|
$ |
(62,124) |
|
$ |
126,876 |
|
|
|
|
|
|
|
|
|
|
|
|
|
|
|
|
|
|
|
|
|
|
|
|
|
|
|
|
|
|
|
December 31, 2017 |
|||||||
|
|
|
Estimated |
|
Gross |
|
|
|
|
|
|
|
|
|
|
Useful |
|
Carrying |
|
Accumulated |
|
Net |
|||
|
|
|
Lives (Years) |
|
Amount |
|
Amortization |
|
Balance |
|||
|
Technology |
|
14 - 16 |
|
$ |
151,433 |
|
$ |
(52,730) |
|
$ |
98,703 |
|
Trademarks |
|
5 - 10 |
|
|
2,588 |
|
|
(1,042) |
|
|
1,546 |
|
Customer relationships |
|
10 - 21 |
|
|
41,058 |
|
|
(4,895) |
|
|
36,163 |
|
Total identifiable intangibles |
|
|
|
$ |
195,079 |
|
$ |
(58,667) |
|
$ |
136,412 |
16
NCS MULTISTAGE HOLDINGS, INC.
NOTES TO UNAUDITED CONDENSED CONSOLIDATED FINANCIAL STATEMENTS
Note 7. Accrued Expenses
Accrued expenses consist of the following as of June 30, 2018 and December 31, 2017 (in thousands):
|
|
|
|
|
|
|
|
|
|
|
|
|
|
|
|
|
|
|
June 30, |
|
December 31, |
||
|
|
|
2018 |
|
2017 |
||
|
Accrued payroll and bonus |
|
$ |
3,999 |
|
$ |
5,167 |
|
Property and franchise taxes accrual |
|
|
200 |
|
|
390 |
|
Accrued acquisition related costs |
|
|
— |
|
|
25 |
|
Accrued other miscellaneous liabilities |
|
|
1,093 |
|
|
1,091 |
|
Total accrued expenses |
|
$ |
5,292 |
|
$ |
6,673 |
Note 8. Debt
Our long-term debt consists of the following as of June 30, 2018 and December 31, 2017 (in thousands):
|
|
|
|
|
|
|
|
|
|
|
|
|
|
|
|
|
|
|
June 30, |
|
December 31, |
||
|
|
|
2018 |
|
2017 |
||
|
Senior Secured Credit Facility |
|
$ |
20,000 |
|
$ |
20,000 |
|
Promissory note |
|
|
448 |
|
|
3,313 |
|
Equipment notes |
|
|
1,133 |
|
|
1,295 |
|
Capital leases |
|
|
3,460 |
|
|
2,428 |
|
Total debt |
|
|
25,041 |
|
|
27,036 |
|
Less: current portion |
|
|
(2,801) |
|
|
(5,334) |
|
Long-term debt |
|
$ |
22,240 |
|
$ |
21,702 |
The estimated fair value of total debt for the periods ended June 30, 2018 and December 31, 2017 was $24.5 million and $26.7 million, respectively. The carrying value of the Senior Secured Credit Facility and the promissory note approximated the fair value of debt as it can be paid at any time. The fair value for the remaining debt was estimated using Level 2 inputs by calculating the sum of the discounted future interest and principal payments through the date of maturity.
Below is a description of our credit agreement and other financing arrangements.
Senior Secured Credit Facility
On May 4, 2017, we entered into an Amended and Restated Credit Agreement (the “Credit Agreement”) with Pioneer Investment, Inc., as borrower (the “U.S. Borrower”), NCS Multistage Inc., as borrower (the “Canadian Borrower”), Pioneer Intermediate, Inc. (together with the Company, the “Parent Guarantors”) and the lenders party thereto, Wells Fargo Bank, National Association as administrative agent in respect of the U.S. Facility (as defined below) and Wells Fargo Bank, National Association, Canadian Branch, as administrative agent in respect of the Canadian Facility (as defined below) (the senior secured revolving credit facilities provided thereunder, the “Senior Secured Credit Facility”). The Credit Agreement amended and restated the prior credit agreement in its entirety. The Senior Secured Credit Facility will mature on May 4, 2020.
The Senior Secured Credit Facility originally consisted of a (i) senior secured revolving credit facility in an aggregate principal amount of $25.0 million made available to the U.S. Borrower (the “U.S. Facility”), of which up to $5.0 million may be made available for letters of credit and up to $5.0 million may be made available for swingline loans and (ii) senior secured revolving credit facility in an aggregate principal amount of $25.0 million made available to the Canadian Borrower (the “Canadian Facility”).
We entered into Amendment No. 1 to the Credit Agreement on August 31, 2017, which increased the loan commitment available to the U.S. Borrower to $50.0 million from $25.0 million under the U.S. Facility. The loan commitment available under the Canadian Facility remained at $25.0 million. On February 16, 2018, we entered into Amendment No. 2 to the Credit Agreement, which amended certain negative covenants contained in the Credit Agreement. As of June 30, 2018 and December 31, 2017, we had $20.0 million in outstanding indebtedness under the U.S. Facility and no outstanding indebtedness under the Canadian Facility. We incurred interest expense related to the Senior Secured Credit Facility of $0.4 million and $0.7 million for the three and six months ended June 30, 2018, respectively.
Borrowings under the U.S. Facility may be made in U.S. dollars, Canadian dollars or Euros and bear interest at a rate equal to the Adjusted Base Rate or Eurocurrency Rate (each as defined in the Credit Agreement), in each case, plus an applicable interest margin
17
NCS MULTISTAGE HOLDINGS, INC.
NOTES TO UNAUDITED CONDENSED CONSOLIDATED FINANCIAL STATEMENTS
as set forth in the Credit Agreement. Borrowings under the Canadian Facility may be made in U.S. dollars or Canadian dollars and bear interest at the Canadian (Cdn) Base Rate, Canadian (U.S.) Base Rate, Eurocurrency Rate or Discount Rate (each as defined in the Credit Agreement), in each case, plus an applicable interest margin as set forth in the Credit Agreement. The Adjusted Base Rate, Canadian (U.S.) Base Rate and Canadian (Cdn) Base Rate applicable margin will be between 2.25% and 3.00% and Eurocurrency Rate applicable margin will be between 3.25% and 4.00%, in each case, depending on the Company’s leverage ratio. The applicable interest rate at June 30, 2018 was 6.25%.
The obligations of the U.S. Borrower under the U.S. Facility are guaranteed by the Parent Guarantors and each of the other existing and future direct and indirect restricted subsidiaries of the Company organized under the laws of the United States (subject to certain exceptions) and are secured by substantially all of the assets of the Parent Guarantors, the U.S. Borrower and such other subsidiary guarantors, in each case, subject to certain exceptions and permitted liens. The obligations of the Canadian Borrower under the Canadian Facility are guaranteed by the Parent Guarantors, the U.S. Borrower and each of the future direct and indirect restricted subsidiaries of the Company organized under the laws of the United States and Canada (subject to certain exceptions) and are secured by substantially all of the assets of the Parent Guarantors, the U.S. Borrower, the Canadian Borrower and such subsidiary guarantors, if any, in each case, subject to certain exceptions and permitted liens.
The Credit Agreement contains financial covenants that require (i) commencing with the fiscal quarter ending June 30, 2017, compliance with a leverage ratio test set at (A) 3.00 to 1.00 as of the last day of each fiscal quarter ending prior to March 31, 2018 and (B) 2.50 to 1.00 as of the last day of each fiscal quarter ending on or after March 31, 2018, (ii) commencing with the fiscal quarter ending June 30, 2017, compliance with an interest coverage ratio test set at 2.75 to 1.00 as of the last day of each fiscal quarter, (iii) if the leverage ratio as of the end of any fiscal quarter is greater than 2.00 to 1.00 and the amount outstanding under the Canadian Facility at any time during such fiscal quarter was greater than $0, compliance as of the end of such fiscal quarter with a Canadian asset coverage ratio test set at 1.00 to 1.00 and (iv) if the leverage ratio as of the end of any fiscal quarter is greater than 2.00 to 1.00 and the amount outstanding under the U.S. Facility at any time during such fiscal quarter was greater than $0, compliance as of the end of such fiscal quarter with a U.S. asset coverage ratio test set at 1.00 to 1.00. As of June 30, 2018, we were in compliance with these financial covenants. The Credit Agreement also contains customary affirmative and negative covenants, including, among other things, restrictions on the creation of liens, the incurrence of indebtedness, investments, dividends and other restricted payments, dispositions and transactions with affiliates. The Credit Agreement also includes customary events of default for facilities of this type (with customary grace periods, as applicable). If an event of default occurs, the lenders under each of the U.S. Facility and the Canadian Facility may elect (after the expiration of any applicable notice or grace periods) to declare all outstanding borrowings under such facility, together with accrued and unpaid interest and other amounts payable thereunder, to be immediately due and payable. The lenders under each of the U.S. Facility and the Canadian Facility also have the right upon an event of default thereunder to terminate any commitments they have to provide further borrowings under such facility. Further, following an event of default under each of the U.S. Facility and the Canadian Facility, the lenders thereunder will have the right to proceed against the collateral granted to them to secure such facility.
Direct costs of $1.0 million were incurred in connection with the Senior Secured Credit Facility. The costs were capitalized as an asset as they represent the benefit of being able to access capital over the contractual term. The costs are being amortized over the term of the Senior Secured Credit Facility using the straight-line method. Amortization expense of the deferred financing charges of $0.1 million and $0.2 million was included in interest expense, net for the three and six months ended June 30, 2018, respectively.
On February 27, 2017, Repeat Precision entered into a promissory note with Security State Bank & Trust, Fredericksburg, for an aggregate borrowing capacity of $3.8 million. The promissory note is secured against equipment, inventory and receivables. It bears interest at a variable interest rate based on prime plus 1.00%. Any principal amount not paid by the maturity date bears interest at the lesser of the maximum rate allowed per law or 18.00% per annum. The promissory note was renewed on February 16, 2018 for an aggregate borrowing capacity of $4.3 million and is scheduled to mature on February 16, 2019. No other terms were changed. As of June 30, 2018 and December 31, 2017, the outstanding balance on the promissory note was $0.4 million and $3.3 million, respectively.
Equipment Notes
In February 2017, Repeat Precision entered into an equipment note in the amount of $0.8 million with Security State Bank & Trust, Fredericksburg. The equipment note bears interest at prime plus 1.00%, matures on February 27, 2021 and is collateralized by certain property. Any principal amount not paid by the maturity date bears interest at the lesser of the maximum rate allowed per law or 18.00% per annum. As of June 30, 2018 and December 31, 2017, the outstanding balance on the equipment note was $0.5 million and $0.6 million, respectively.
18
NCS MULTISTAGE HOLDINGS, INC.
NOTES TO UNAUDITED CONDENSED CONSOLIDATED FINANCIAL STATEMENTS
In April 2017, Repeat Precision entered into another equipment note in the amount of $0.8 million with Security State Bank & Trust, Fredericksburg. The equipment note bears interest at prime plus 1.00%, matures on December 21, 2018 and is collateralized by certain property. Any principal amount not paid by the maturity date bears interest at the lesser of the maximum rate allowed per law or 18.00% per annum. As of June 30, 2018 and December 31, 2017, the outstanding balance on the equipment note was $0.6 million and $0.7 million, respectively.
Note 9. Commitments and Contingencies
Litigation
In the ordinary course of our business, from time to time, we have various claims, lawsuits and administrative proceedings that are pending or threatened with respect to commercial, intellectual property and employee matters.
On July 24, 2018, we filed a patent infringement lawsuit against Kobold Corporation, Kobold Completions Inc. and 2039974 Alberta Ltd. (“Kobold”) in the Federal Court of Canada, alleging that Kobold’s fracturing tools and methods infringe on several of our Canadian patents. We previously filed a breach of contract lawsuit on March 16, 2018, against Kobold Corporation in the Court of Queen’s Bench of Alberta, alleging breach of a prior settlement agreement. Both of these lawsuits seek unspecified monetary damages and injunctive relief.
While the outcome of any legal proceedings cannot be predicted with any certainty, based on a consideration of relevant facts and circumstances, our management currently does not expect that the results of these legal proceedings would have a material adverse effect on our financial position, results of operations or cash flows.
On March 3, 2017, we received $0.9 million resulting from an arbitration case that was decided in our favor in February 2017. This was recorded as other income, net in our condensed consolidated statements of operations for the six months ended June 30, 2017.
Note 10. Stockholders’ Equity
The holders of common stock are entitled to one vote for each share of common stock held. The holder, Cemblend Systems, Inc. (“Cemblend”), of the one share of preferred stock, designated as the “Special Voting Share” in our amended and restated certificate of incorporation, is entitled to vote on all matters that a holder of common stock is entitled to vote on and is entitled to cast a number of votes equal to the number of exchangeable shares of NCS Multistage, Inc. (“NCS Canada”), a subsidiary of the Company, then outstanding that are not owned by us, multiplied by the exchange ratio (as defined in the articles of incorporation of NCS Canada), which was adjusted from one to three in April 2017 in connection with our stock split. As of June 30, 2018 and December 31, 2017, one share of preferred stock was issued and outstanding. As of December 31, 2017, the number of shares of common stock issuable for the exchangeable shares totaled 1,769,247 and was held by Cemblend. On February 14, 2018, we issued 442,312 shares of common stock to Cemblend in exchange for shares of NCS Canada. As of June 30, 2018, the number of shares of common stock issuable for the exchangeable shares totaled 1,326,935. The exchangeable shares are convertible upon demand at the stock price on the conversion date. The holders of common stock are entitled to receive dividends as declared from time-to-time by our board of directors. The holder of the Special Voting Share is not entitled to receive dividends. No dividends were declared during the periods ended June 30, 2018 or December 31, 2017.
19
NCS MULTISTAGE HOLDINGS, INC.
NOTES TO UNAUDITED CONDENSED CONSOLIDATED FINANCIAL STATEMENTS
Note 11. Share-Based Compensation
During the first quarter of 2018, we granted 582,184 restricted stock units (“RSUs”) at a weighted average grant date fair value of $14.54. Of the RSUs granted, 536,014 will vest and settle ratably over three years on each anniversary of the date of grant and 46,170, which were granted to the non-employee members of the Board of Directors, will vest on the one year anniversary of the grant date. The RSUs for the members of the Board of Directors settle for shares of common stock on a one-for-one basis within thirty days following the earliest of (i) one year following the termination of the person’s service for any reason other than cause, (ii) a change of control or (iii) the fifth anniversary of the grant date.
During the first quarter of 2018, we also granted 156,516 of performance stock unit awards (“PSUs”) with a performance period from January 1, 2018 to December 31, 2020. The fair value of the PSUs of $17.37 was measured using a Monte Carlo simulation on the date the PSUs were granted. The number of PSUs ultimately issued under the program is dependent upon our total shareholder return relative to our performance peer group over a three-year performance period. In no event shall the participant earn more than 200% of the target PSUs. If the actual performance falls below the predefined target, the number of shares vested is reduced. If the actual performance falls below the threshold performance level, no PSUs will vest.
The total share-based compensation expense for all awards was $3.0 million and $1.5 million for the three months ended June 30, 2018 and 2017, respectively, and $5.3 million and $1.8 million for the six months ended June 30, 2018 and 2017, respectively.
Note 12. Income Taxes
The computation of the annual expected effective tax rate at each interim period requires certain estimates and assumptions including, but not limited to, the expected operating income (or loss) for the year, projections of the proportion of income (or loss) earned and taxed in foreign jurisdictions, permanent and temporary differences and the likelihood of recovering deferred tax assets generated in the current year. The accounting estimates used to compute the provision for income taxes may change as new events occur, more experience is acquired or additional information is obtained. The computation of the annual effective rate would include applicable modifications, which were projected for the year, such as certain book expenses not deductible for tax, tax credits and foreign deemed dividends.
We recorded a tax (benefit) of $(1.0) million and $(0.9) million for the three months ended June 30, 2018 and 2017, respectively. For the three months ended June 30, 2018 and 2017, our effective tax rates were (26.6)% and (15.3)%, respectively. For the six months ended June 30, 2018 and 2017, we recorded a tax (benefit) expense of $(0.1) million and $1.2 million, respectively. The effective tax rates for the six months ended June 30, 2018 and 2017 were (0.8)% and 43.7%, respectively. The income tax expense and effective tax rate for the three and six months ended June 30, 2018 were significantly impacted by the U.S. Tax Cuts and Jobs Act of 2017 (the “2017 Tax Act”) including administrative guidance issued by the Internal Revenue Service on April 2, 2018. This guidance along with other updates resulted in a change to the calculation of the mandatory one-time tax on accumulated earnings of foreign subsidiaries in 2017 and a tax benefit of $0.5 million and $2.6 million for the three and six months ended June 30, 2018, respectively, was recorded in tax expense with a corresponding reduction in the effective tax rate of 13.1% and 29.1%, respectively. Additionally, the effective tax rate for the six months ended June 30, 2018 included a tax benefit of $0.3 million for the tax effect of exercised stock option awards.
The 2017 Tax Act was signed into law on December 22, 2017. The 2017 Tax Act significantly revised the U.S. corporate income tax by, among other things, lowering the statutory corporate tax rate from 35% to 21%, eliminating certain deductions, imposing a mandatory one-time tax on accumulated earnings of foreign subsidiaries as of 2017, introducing new tax regimes, and changing how foreign earnings are subject to U.S. tax. Our preliminary estimate of the 2017 Tax Act and the remeasurement of our deferred tax assets and liabilities is subject to the finalization of management’s analysis related to certain matters, such as developing interpretations of the provisions of the 2017 Tax Act, changes to certain estimates and the filing of our tax returns. U.S. Treasury regulations, administrative interpretations or court decisions interpreting the 2017 Tax Act may require further adjustments and changes in our estimates. The final determination of the impact of the 2017 Tax Act and the remeasurement of our deferred assets and liabilities will be completed as additional information becomes available, but no later than one year from the enactment of the 2017 Tax Act in accordance with SAB 118. Those adjustments may impact our provision for income taxes in the period in which the adjustments are made.
For our calendar year beginning in 2018 we are subject to several provisions of the 2017 Tax Act including computations under Global Intangible Low Taxed Income (“GILTI”) and Foreign Derived Intangible Income (“FDII”). We were able to make a reasonable estimate of the impact of each provision of the 2017 Tax Act on our effective tax rate for the three and six months ended June 30, 2018. We will continue to refine our provisional estimates for our computations under the GILTI and FDII rules as we gather additional information.
20
NCS MULTISTAGE HOLDINGS, INC.
NOTES TO UNAUDITED CONDENSED CONSOLIDATED FINANCIAL STATEMENTS
ASC 740 clarifies the accounting for uncertainty in income taxes recognized in an enterprise’s financial statements. The impact of an uncertain income tax position on the income tax returns must be recognized at the largest amount that is more-likely-than-not to be required to be recognized upon audit by the relevant taxing authority. This standard also provides guidance on de-recognition, measurement, classification, interest and penalties, accounting for interim periods, disclosure and transition issues with respect to tax positions. We include interest and penalties as a component of other income, net in the condensed consolidated statements of operations and recognized $46 thousand and $2 thousand for the six months ended June 30, 2018 and 2017, respectively.
Note 13. (Loss) Earnings Per Common Share
The following table presents the reconciliation of the numerator and denominator for calculating (loss) earnings per common share from net (loss) income (in thousands, except per share data):
|
|
|
|
|
|
|
|
|
|
|
|
|
|
|
|
|
|
|
|
|
|
|
|
|
|
|
|
|
|
|
Three Months Ended |
|
Six Months Ended |
||||||||
|
|
|
June 30, |
|
June 30, |
||||||||
|
|
|
2018 |
|
2017 |
|
2018 |
|
2017 |
||||
|
Numerator—Basic |
|
|
|
|
|
|
|
|
|
|
|
|
|
Net (loss) income |
|
$ |
(2,818) |
|
$ |
(4,745) |
|
$ |
9,047 |
|
$ |
1,603 |
|
Less: income attributable to participating shares |
|
|
— |
|
|
— |
|
|
282 |
|
|
74 |
|
Less: income (loss) attributable to non-controlling interest |
|
|
1,235 |
|
|
(254) |
|
|
2,122 |
|
|
(456) |
|
Net (loss) income attributable to |
|
$ |
(4,053) |
|
$ |
(4,491) |
|
$ |
6,643 |
|
$ |
1,985 |
|
|
|
|
|
|
|
|
|
|
|
|
|
|
|
Numerator—Diluted |
|
|
|
|
|
|
|
|
|
|
|
|
|
Net (loss) income |
|
$ |
(2,818) |
|
$ |
(4,745) |
|
$ |
9,047 |
|
$ |
1,603 |
|
Less: income (loss) attributable to non-controlling interest |
|
|
1,235 |
|
|
(254) |
|
|
2,122 |
|
|
(456) |
|
Net (loss) income attributable to |
|
$ |
(4,053) |
|
$ |
(4,491) |
|
$ |
6,925 |
|
$ |
2,059 |
|
|
|
|
|
|
|
|
|
|
|
|
|
|
|
Denominator |
|
|
|
|
|
|
|
|
|
|
|
|
|
Basic weighted average number of shares |
|
|
44,778 |
|
|
40,198 |
|
|
44,517 |
|
|
37,119 |
|
Exchangeable shares for common stock |
|
|
— |
|
|
— |
|
|
1,434 |
|
|
1,803 |
|
Dilutive effect of stock options, RSUs, PSUs and ESPP |
|
|
— |
|
|
— |
|
|
1,235 |
|
|
1,266 |
|
Diluted weighted average number of shares |
|
|
44,778 |
|
|
40,198 |
|
|
47,186 |
|
|
40,188 |
|
|
|
|
|
|
|
|
|
|
|
|
|
|
|
(Loss) earnings per common share |
|
|
|
|
|
|
|
|
|
|
|
|
|
Basic |
|
$ |
(0.09) |
|
$ |
(0.11) |
|
$ |
0.15 |
|
$ |
0.05 |
|
Diluted |
|
$ |
(0.09) |
|
$ |
(0.11) |
|
$ |
0.15 |
|
$ |
0.05 |
|
|
|
|
|
|
|
|
|
|
|
|
|
|
|
Potentially dilutive securities excluded as anti-dilutive |
|
|
5,040 |
|
|
3,307 |
|
|
231 |
|
|
- |
Note 14. Segment and Geographic Information
We have determined that we operate in one reportable segment that has been identified based on how our chief operating decision maker manages our business.
21
Item 2. Management’s Discussion and Analysis of Financial Condition and Results of Operation
The following discussion and analysis of our financial condition and results of our operations should be read together with our financial statements and the related notes thereto included in this Quarterly Report on Form 10-Q (“Quarterly Report”) and with our audited financial statements and the related notes thereto included in our Annual Report on Form 10-K (“Annual Report”), filed with the Securities and Exchange Commission (the “SEC”). This discussion and analysis contains forward-looking statements regarding the industry outlook, estimates and assumptions concerning events and financial and industry trends that may affect our future results of operations or financial condition and other non-historical statements. These forward-looking statements are subject to numerous risks and uncertainties, including but not limited to the risks and uncertainties described in “—Cautionary Note Regarding Forward-Looking Statements” and “Risk Factors.” Our actual results may differ materially from those contained in or implied by these forward-looking statements. As used in this Quarterly Report, except where the context otherwise requires or where otherwise indicated, the terms “Company,” “NCS,” “we,” “our” and “us” refer to NCS Multistage Holdings, Inc.
We are a leading provider of highly engineered products and support services that facilitate the optimization of oil and natural gas well completions and field development strategies. We provide our products and services primarily to exploration and production (“E&P”) companies for use in onshore wells, predominantly wells that have been drilled with horizontal laterals in unconventional oil and natural gas formations. Our products and services are utilized in oil and natural gas basins throughout North America and in selected international markets, including Argentina, China and Russia. We have provided our products and services to various customers, including leading large independent oil and natural gas companies and major oil companies.
Our primary offering is our fracturing systems products and services, which enable efficient pinpoint stimulation: the process of individually stimulating each entry point into a formation targeted by an oil or natural gas well. Our fracturing systems products and services are typically utilized in cemented wellbores and enable our customers to precisely place stimulation treatments in a more controlled and repeatable manner as compared with traditional completion techniques. Our fracturing systems products and services are utilized in conjunction with third-party providers of pressure pumping, coiled tubing and other services.
In addition to our fracturing systems products and services, we sell other products for well construction, including our AirLock casing buoyancy system and liner hanger systems. We also provide tracer diagnostics for well completion and reservoir characterization that utilize downhole chemical and radioactive tracers and consult on reservoir strategies by providing engineering services. Repeat Precision, LLC (“Repeat Precision”), sells composite frac plugs and related products and provides third-party manufacturing services. We operate in one reportable segment.
Oil and Natural Gas Drilling and Completion Activity
Our products and services are primarily sold to North American E&P companies and our ability to generate revenues from our products and services depends upon oil and natural gas drilling and production activity in North America. Oil and natural gas drilling and production activity is directly related to oil and natural gas prices.
Over the past several years, North American E&P companies have been able to reduce their cost structures and have also utilized technologies, including ours, to increase efficiency and improve well performance. After a period of declining drilling and completion activity from late 2014 through early 2016, North American E&P companies began to increase activity levels beginning in the second quarter of 2016, as evidenced by increasing rig counts in the U.S. and Canada. The average U.S. land rig count improved from 874 in the second quarter of 2017 to 1,021 in the second quarter of 2018, while the average rig count in Canada, which exhibits a higher degree of seasonality than the U.S., decreased from 116 in the second quarter of 2017 to 105 in the second quarter of 2018. Over this time, the demand for our products and services has also increased.
Oil and natural gas prices remain volatile, with WTI crude oil pricing falling to below $43 per barrel in June 2017 before recovering to approximately $74 per barrel by the end of June 2018. Crude oil pricing has been supported by voluntary oil production reductions by members of the Organization of Petroleum Exporting Countries (“OPEC”), and certain other countries, including Russia. These supply reductions were announced in November 2016 and were initially implemented in 2017. In November 2017, OPEC and certain other countries, including Russia, announced their intent to extend the supply reductions through the end of 2018. These countries have reduced their supply by more than the targeted amounts through early 2018, reaching 152% of targeted supply reductions in May 2018. In June 2018, OPEC and certain other countries, including Russia, announced that they would strive to conform with the supply reductions at a level of 100% as of July 1, 2018, signaling an increase in production from recent levels. There can be no assurance that the countries involved will continue to comply with the intended reductions and the amount of oil supply that may be returned to the market if the supply reductions are not extended beyond the end of 2018 is unknown. Natural gas pricing has
22
been more stable, remaining close to $3.00 per mmBtu. Realized natural gas prices for Canadian E&P customers are typically at a discount to U.S. Henry Hub pricing. Spot pricing for Canadian natural gas at the AECO hub has been volatile since mid-2017, with wider-than-normal discounts to Henry Hub pricing resulting from infrastructure bottlenecks and elevated local storage levels. Some Canadian E&P customers have reacted to the lower prices by shutting in a portion of their natural gas production, negatively impacting their cash flows and planned capital spending and drilling activity. Sustained declines in commodity prices, combined with potential increases in the cost of drilling and completing wells resulting from high utilization in certain oilfield services categories could lead North American E&P companies to reduce drilling and completion activity, which could negatively impact our business.
Listed and depicted below are recent crude oil and natural gas pricing trends, as provided by the Energy Information Administration (“EIA”) of the U.S. Department of Energy:
|
|
|
|
|
|
|
|
|
|
|
|
|
|
Average Price |
|||||||
|
Quarter Ended |
|
WTI Crude (per bbl) |
|
Brent Crude |
|
Henry Hub Natural Gas |
|||
|
6/30/2017 |
|
$ |
48.10 |
|
$ |
49.55 |
|
$ |
3.08 |
|
9/30/2017 |
|
|
48.15 |
|
|
52.10 |
|
|
2.95 |
|
12/31/2017 |
|
|
55.27 |
|
|
61.40 |
|
|
2.91 |
|
3/31/2018 |
|
|
62.91 |
|
|
66.86 |
|
|
3.08 |
|
6/30/2018 |
|
|
68.07 |
|
|
74.45 |
|
|
2.85 |
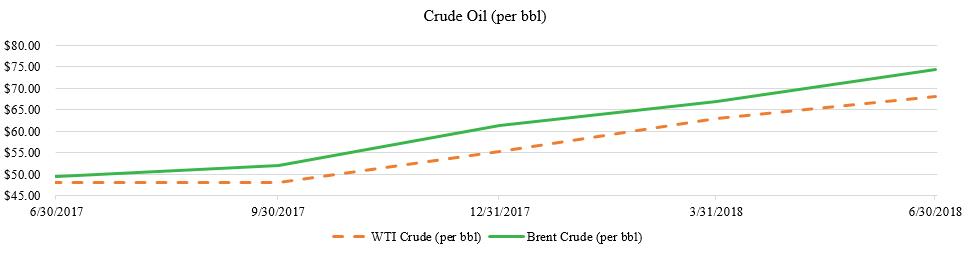
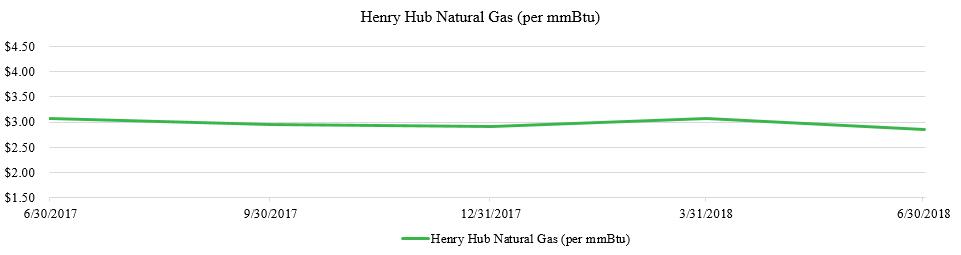
23
Listed and depicted below are the average number of operating onshore rigs in the U.S. and in Canada per quarter since the second quarter of 2017, as provided by Baker Hughes, a GE company:
|
|
|
|
|
|
|
|
|
|
|
Average Drilling Rig Count |
||||
|
Quarter Ended |
|
U.S. Land |
|
Canada Land |
|
North America Land |
|
6/30/2017 |
|
874 |
|
116 |
|
990 |
|
9/30/2017 |
|
927 |
|
207 |
|
1,134 |
|
12/31/2017 |
|
902 |
|
203 |
|
1,105 |
|
3/31/2018 |
|
965 |
|
267 |
|
1,232 |
|
6/30/2018 |
|
1,021 |
|
105 |
|
1,126 |
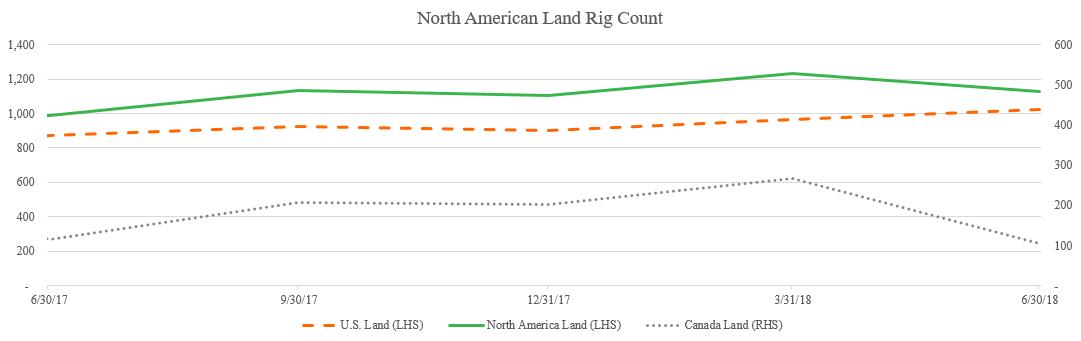
A substantial portion of our business is subject to quarterly variability. In Canada, we typically experience higher activity levels in the first quarter of each year, as our customers take advantage of the winter freeze to gain access to remote drilling and production areas. In the past, our revenue in Canada has declined during the second quarter due to warming weather conditions that result in thawing, softer ground, difficulty accessing drill sites and road bans that curtail drilling and completion activity. Access to well sites typically improves throughout the third and fourth quarters in Canada, leading to activity levels that are higher than in the second quarter, but lower than activity in the first quarter. In early 2018, Canada experienced higher than normal levels of precipitation, including snowfall, which resulted in a more protracted seasonal reduction in drilling and completion activity. Our business can also be impacted by a reduction in customer activity during the winter holidays in late December and early January.
The average Canadian rig count declined in the second quarter of 2018 relative to the second quarter of 2017. We believe this reduction in drilling activity was a result of low recent spot natural gas prices, greater discounts in Canadian crude oil pricing relative to U.S. benchmarks and the impact of the higher than normal levels of precipitation experienced in Canada in early 2018.
Based on the current commodity price environment, many U.S. E&P companies have indicated that they expect to increase their drilling and completions budgets in 2018, relative to 2017. In the first quarter of 2018 many E&P and oilfield services companies, including us, noted instances of supply chain disruptions related to material and labor availability, which resulted in temporary delays in planned drilling and completion activity. In addition, oil production from the Permian Basin is expected to exceed local refining demand and pipeline takeaway capacity from the second half of 2018 through the end of 2019, when additional pipelines are expected to be placed into service. This has led to reduced local crude oil pricing as compared to WTI and Brent-linked benchmarks. Some E&P companies have indicated that they plan to reduce their drilling and completion activity in the Permian Basin as a result of the lower realized prices and temporary limitations on takeaway capacity.
The market in Canada continues to be impacted by logistical constraints in moving oil and natural gas from areas of production activity to demand centers. These constraints have led to lower realized pricing for our Canadian customers, especially those that sell natural gas into the local market. As a result, industry capital spending in Canada in 2018 is currently forecasted to be in line with or below 2017 levels, with higher spending by producers of oil and liquids-rich natural gas offset by declines by producers of natural gas. During the second quarter of 2018, the average land drilling rig count in Canada, as provided by Baker Hughes, was nine percent lower than during the same period in 2017.
We expect that we will be able to leverage our technologically differentiated product and service offerings to continue to grow our business in 2018, especially in the United States, where industry activity is expected to grow and where we have greater opportunities for further market share penetration.
24
Increasing Adoption of Pinpoint Stimulation
Traditional well completion techniques, including plug and perf and ball drop, currently account for the majority of unconventional well completions in North America. We believe that pinpoint stimulation provides substantial benefits compared to these traditional well completion techniques and that pinpoint stimulation has become increasingly utilized by operators in North America, particularly in Canada. Our ability to grow our market share, as evidenced by the percentage of horizontal wells in North America completed using our products and services, will depend in large part on the industry’s continued adoption of pinpoint stimulation to complete wells.
Increasing Well Complexity and Focus on Completion Optimization
In recent years, E&P companies have drilled longer horizontal wells and completed more hydraulic fracturing stages per well to maximize the volume of hydrocarbon recoveries per well. This trend towards longer and more complex wells has resulted in us selling more sliding sleeves or composite frac plugs per well on average, which increases our revenue opportunity per well completion and has led to increased sales of our AirLock casing buoyancy systems. Additionally, E&P companies have become increasingly focused on well productivity through optimization of completion designs and we believe this trend may further the adoption of pinpoint stimulation, and in turn, increase the opportunity for sales of our products and services if our customers observe operational benefits and long-term production results from the application of pinpoint stimulation. This trend towards more complex well completions has also resulted in increased use of tracer diagnostics services, which can be utilized to assess the effectiveness of various well completion techniques in support of completion and field development optimization efforts.
We derive the majority of our revenues from the sale of our fracturing systems products and the provision of related services. The remainder of our revenues are generated from sales of our AirLock casing buoyancy system, liner hanger systems and tracer diagnostics and reservoir strategies services. Repeat Precision generates revenue through the sale of composite frac plugs and related products and the provision of third-party manufacturing services.
Product sales represented 64% and 80% of our revenue for the three months ended June 30, 2018 and 2017, respectively, and 68% and 79% for the six months ended June 30, 2018 and 2017, respectively. Most of our sales are on a just-in-time basis, as specified in individual purchase orders, with a fixed price for our products. We occasionally supply our customers with large orders that may be filled on negotiated terms. Services represented 36% and 20% of our revenues for the three months ended June 30, 2018 and 2017, respectively, and 32% and 21% for the six months ended June 30, 2018 and 2017, respectively. Services include our tool charges and associated services related to our fracturing systems offering and our tracer diagnostics services (which are classified together as “services” in our financial results). Services are provided at agreed rates we charge to our customers for the provision of our downhole frac isolation assembly, our personnel and for the provision of tracer diagnostics services.
During periods of low drilling and well completion activity we will, in certain instances, lower the prices of our products and services. Our revenues are also impacted by well complexity, with wells with more stages resulting in longer jobs and increased revenue attributable to selling more sliding sleeves or composite frac plugs and the provision of our services.
For the three months ended June 30, 2018 and 2017, approximately 32% and 45%, respectively, of our revenues were derived from sales in Canada and were denominated in Canadian dollars. For the six months ended June 30, 2018 and 2017, approximately 54% and 61%, respectively, of our revenues were attributable to our Canadian sales. Because our Canadian contracts are typically invoiced in Canadian dollars, the effects of foreign currency fluctuations impact our revenues and are regularly monitored.
Although most of our sales are to North American E&P companies, we do have sales to customers outside of North America and expect sales to international customers to increase over time. These international sales are typically made to our local operating partners on a free on board basis with a point of sale in the United States. Some of the locations in which we have operating partners or sales representatives include China, Russia and the Middle East. Our operating partners and representatives do not have authority to contractually bind our company, but market our products in their respective territories as part of their product or service offering.
Costs of Conducting our Business
Our cost of sales is comprised of expenses relating to the manufacture of our products in addition to the costs of our support services. Manufacturing cost of sales includes payments made to our suppliers for raw materials and payments made to machine shops for the manufacturing of components used in our products and costs related to our employees that perform quality control analysis, assemble and test our products. During the first quarter of 2017, we acquired Repeat Precision, which we believe will allow us to reduce our costs for certain product categories. We review forecasted activity levels in our business and either directly procure or ensure that our vendors procure the required raw materials with sufficient lead time to meet our business requirements. On March 8,
25
2018, the President of the United States signed an order to impose a tariff of 25% on steel imported from certain countries. On July 1, 2018, Canada implemented retaliatory tariffs on certain U.S. imports, including steel. While we and our suppliers have locked in pricing for certain raw materials required to support some of our anticipated business activity during 2018, we anticipate that the tariff could result in an increase in our cost of sales, beginning as early as the third quarter of 2018. We will strive to pass through some, if not all, of the increases in raw material costs directly resulting from the tariff to our customers, however there can be no assurance that we will be able to do so. Cost of sales for support services includes compensation and benefit-related expenses for employees who provide direct revenue generating services to customers in addition to the costs incurred by these employees for travel and subsistence while on site. Cost of sales includes other variable manufacturing costs, such as shrinkage, obsolescence and revaluation or scrap related to our existing inventory and costs related to the chemicals and laboratory analysis associated with our tracer diagnostics services.
Our selling, general and administrative (“SG&A”) expenses are comprised of compensation expense, which includes compensation and benefit-related expenses for our employees who are not directly involved in revenue generating activities, including those involved in our research and development activities, as well as our general operating costs. These general operating costs include, but are not limited to: rent and occupancy for our facilities, information technology infrastructure, software licensing, advertising and marketing, third party research and development, risk insurance and professional service fees for audit, legal and other consulting services. As a result of being a public company, our legal, accounting and other expenses have increased and will further increase for costs associated with our compliance with the Sarbanes-Oxley Act.
The percentage of our costs, defined as cost of sales, excluding depreciation and amortization, and including SG&A, denominated in Canadian dollars were approximately 19% and 35% for the three months ended June 30, 2018 and 2017, respectively, and approximately 21% and 31% for the six months ended June 30, 2018 and 2017, respectively.
26
Results of Operations
We made acquisitions in the first quarter and third quarter of 2017. For additional information about these acquisitions, see “Note 3. Acquisitions” in our unaudited condensed consolidated financial statements. Due to these acquisitions, our results of operations for the 2018 period presented may not be comparable to historical results of operations for the 2017 period. The following table summarizes our revenues and expenses for the periods presented (dollars in thousands):
|
|
|
|
|
|
|
|
|
|
|
|
|
|
|
|
|
|
|
|
|
|
|
|
|
|
|
|
|
|
|
|
|
|
|
|
|
|
|
|
|
|
|
|
|
|
|
|
|
|
|
|
|
|
|
Three Months Ended |
|
|
|
|
|
|
|
Six Months Ended |
|
|
|
|
|
|
||||||||
|
|
|
June 30, |
|
Variance |
|
June 30, |
|
Variance |
||||||||||||||||
|
|
|
2018 |
|
2017 |
|
$ |
|
% |
|
2018 |
|
2017 |
|
$ |
|
% |
||||||||
|
Revenues |
|
|
|
|
|
|
|
|
|
|
|
|
|
|
|
|
|
|
|
|
|
|
|
|
|
Product sales |
|
$ |
27,773 |
|
$ |
29,397 |
|
$ |
(1,624) |
|
(5.5) |
% |
|
$ |
77,881 |
|
$ |
74,971 |
|
$ |
2,910 |
|
3.9 |
% |
|
Services |
|
|
15,625 |
|
|
7,460 |
|
|
8,165 |
|
109.5 |
% |
|
|
36,203 |
|
|
20,522 |
|
|
15,681 |
|
76.4 |
% |
|
Total revenues |
|
|
43,398 |
|
|
36,857 |
|
|
6,541 |
|
17.7 |
% |
|
|
114,084 |
|
|
95,493 |
|
|
18,591 |
|
19.5 |
% |
|
Cost of sales |
|
|
|
|
|
|
|
|
|
|
|
|
|
|
|
|
|
|
|
|
|
|
|
|
|
Cost of product sales, exclusive of depreciation and amortization expense shown below |
|
|
12,622 |
|
|
15,733 |
|
|
(3,111) |
|
(19.8) |
% |
|
|
37,325 |
|
|
40,448 |
|
|
(3,123) |
|
(7.7) |
% |
|
Cost of services, exclusive of depreciation and amortization expense shown below |
|
|
7,290 |
|
|
3,152 |
|
|
4,138 |
|
131.3 |
% |
|
|
16,179 |
|
|
7,791 |
|
|
8,388 |
|
107.7 |
% |
|
Total cost of sales, exclusive of depreciation and amortization expense shown below |
|
|
19,912 |
|
|
18,885 |
|
|
1,027 |
|
5.4 |
% |
|
|
53,504 |
|
|
48,239 |
|
|
5,265 |
|
10.9 |
% |
|
Selling, general and administrative expenses |
|
|
22,125 |
|
|
16,163 |
|
|
5,962 |
|
36.9 |
% |
|
|
43,152 |
|
|
28,935 |
|
|
14,217 |
|
49.1 |
% |
|
Depreciation |
|
|
1,156 |
|
|
678 |
|
|
478 |
|
70.5 |
% |
|
|
2,255 |
|
|
1,242 |
|
|
1,013 |
|
81.6 |
% |
|
Amortization |
|
|
3,283 |
|
|
5,973 |
|
|
(2,690) |
|
(45.0) |
% |
|
|
6,604 |
|
|
11,995 |
|
|
(5,391) |
|
(44.9) |
% |
|
Change in fair value of contingent consideration |
|
|
213 |
|
|
767 |
|
|
(554) |
|
(72.2) |
% |
|
|
(1,140) |
|
|
767 |
|
|
(1,907) |
|
(248.6) |
% |
|
(Loss) income from operations |
|
|
(3,291) |
|
|
(5,609) |
|
|
2,318 |
|
41.3 |
% |
|
|
9,709 |
|
|
4,315 |
|
|
5,394 |
|
125.0 |
% |
|
Other income (expense) |
|
|
|
|
|
|
|
|
|
|
|
|
|
|
|
|
|
|
|
|
|
|
|
|
|
Interest expense, net |
|
|
(608) |
|
|
(2,007) |
|
|
1,399 |
|
69.7 |
% |
|
|
(1,065) |
|
|
(3,516) |
|
|
2,451 |
|
69.7 |
% |
|
Other (expense) income, net |
|
|
(44) |
|
|
64 |
|
|
(108) |
|
(168.8) |
% |
|
|
40 |
|
|
1,038 |
|
|
(998) |
|
(96.1) |
% |
|
Foreign currency exchange gain |
|
|
106 |
|
|
1,952 |
|
|
(1,846) |
|
(94.6) |
% |
|
|
289 |
|
|
1,011 |
|
|
(722) |
|
(71.4) |
% |
|
Total other (expense) income |
|
|
(546) |
|
|
9 |
|
|
(555) |
|
(6,166.7) |
% |
|
|
(736) |
|
|
(1,467) |
|
|
731 |
|
49.8 |
% |
|
(Loss) income before income tax |
|
|
(3,837) |
|
|
(5,600) |
|
|
1,763 |
|
31.5 |
% |
|
|
8,973 |
|
|
2,848 |
|
|
6,125 |
|
215.1 |
% |
|
Income tax (benefit) expense |
|
|
(1,019) |
|
|
(855) |
|
|
(164) |
|
(19.2) |
% |
|
|
(74) |
|
|
1,245 |
|
|
(1,319) |
|
(105.9) |
% |
|
Net (loss) income |
|
|
(2,818) |
|
|
(4,745) |
|
|
1,927 |
|
40.6 |
% |
|
|
9,047 |
|
|
1,603 |
|
|
7,444 |
|
464.4 |
% |
|
Net income (loss) attributable to noncontrolling interest |
|
|
1,235 |
|
|
(254) |
|
|
1,489 |
|
586.2 |
% |
|
|
2,122 |
|
|
(456) |
|
|
2,578 |
|
565.4 |
% |
|
Net (loss) income attributable to NCS Multistage Holdings, Inc. |
|
$ |
(4,053) |
|
$ |
(4,491) |
|
$ |
438 |
|
9.8 |
% |
|
$ |
6,925 |
|
$ |
2,059 |
|
$ |
4,866 |
|
236.3 |
% |
Three Months Ended June 30, 2018 compared to Three Months Ended June 30, 2017
Revenues
Revenues were $43.4 million for the three months ended June 30, 2018 as compared to $36.9 million for the three months ended June 30, 2017. This increase was primarily attributable to an increase in services revenue, including tracer diagnostics services, which we added in 2017 through the acquisition of Spectrum Tracer Services, LLC (“Spectrum”). We also experienced an increase in sales volumes of products utilized in well construction and in composite frac plugs. These increases were offset by lower volumes of
27
fracturing systems product sales, especially in Canada, which was impacted by reduced industry activity levels in 2018 as compared to 2017. Product sales for the three months ended June 30, 2018 were $27.8 million as compared to $29.4 million for the three months ended June 30, 2017. Our service revenue was $15.6 million for the three months ended June 30, 2018 as compared to $7.5 million for the three months ended June 30, 2017.
Cost of sales
Cost of sales was $19.9 million, or 45.9% of revenues, for the three months ended June 30, 2018 as compared to $18.9 million, or 51.2% of revenues, for the three months ended June 30, 2017. The increase in cost of sales was primarily a result of increased revenues for tracer diagnostics services, well construction products and composite frac plugs. Cost of sales was a lower percentage of revenues due to the relative increase in services revenue and higher sales volumes for well construction products and at Repeat Precision, which enabled better utilization of fixed costs. Cost of product sales was $12.6 million, or 45.4% of product sales revenue, and cost of services was $7.3 million, or 46.7% of service revenue, for the three months ended June 30, 2018. For the three months ended June 30, 2017, cost of product sales was $15.7 million, or 53.5% of product sales revenue, and cost of services was $3.2 million, or 42.3% of service revenue.
Selling, general and administrative expenses
Selling, general and administrative expenses were $22.1 million for the three months ended June 30, 2018 as compared to $16.2 million for the three months ended June 30, 2017. The increase was the direct result of headcount additions in substantially all functional areas, three months of tracer diagnostics operations resulting from our Spectrum acquisition and an increase in share-based compensation related to the issuance of restricted stock units and performance stock unit awards as well as amendments to certain stock options in connection with our initial public offering (“IPO”) during the second quarter of 2017. The increases were partially offset by non-capitalizable additional expenses incurred related to our IPO of $0.8 million and acquisition costs of $0.4 million incurred during the three months ended June 30, 2017.
Depreciation
Depreciation was $1.2 million for the three months ended June 30, 2018 as compared to $0.7 million for the three months ended June 30, 2017. The increase is attributable to a higher level of property and equipment, primarily related to our acquisitions.
Amortization
Amortization was $3.3 million for the three months ended June 30, 2018 as compared to $6.0 million for the three months ended June 30, 2017. The decrease in amortization was related to intangible assets that became fully amortized during the fourth quarter of 2017. The decrease was partially offset by an increase in amortizable intangible assets related to our acquisitions.
Change in fair value of contingent consideration
Change in fair value of contingent consideration was $0.2 million for the three months ended June 30, 2018 and $0.8 million for the three months ended June 30, 2017 due to the increase in the fair value of the earn-outs associated with our acquisitions.
Interest expense, net
Interest expense, net was $0.6 million for the three months ended June 30, 2018 as compared to $2.0 million for the three months ended June 30, 2017. The decrease in interest expense, net was primarily a result of prepaying our prior term loan in full in May 2017 by utilizing a portion of the proceeds from our IPO. The decrease was partially offset by higher interest expense due to borrowing $20.0 million under our Senior Secured Credit Facility in August 2017.
Foreign currency exchange gain
Foreign currency exchange gain was $0.1 million for the three months ended June 30, 2018 as compared to a gain of $2.0 million for the three months ended June 30, 2017. The change was primarily due to the impact of the retirement of our foreign currency denominated debt for the three months ended June 30, 2017 and movement in the foreign currency exchange rates between the periods.
Income tax (benefit) was $(1.0) million for the three months ended June 30, 2018 as compared to $(0.9) million for the three months ended June 30, 2017. For the three months ended June 30, 2018 and 2017, our effective income tax rates were (26.6)% and
28
(15.3)%, respectively. The income tax expense and effective tax rate for the three months ended June 30, 2018 was significantly impacted by the U.S. Tax Cuts and Jobs Act of 2017 (the “2017 Tax Act”) including administrative guidance issued by the Internal Revenue Service on April 2, 2018. This guidance resulted in a change to the calculation of the mandatory one-time tax on accumulated earnings of foreign subsidiaries in 2017 and a tax benefit of $0.5 million was recorded in tax expense with a corresponding reduction in the effective tax rate of 13.1%.
The 2017 Tax Act significantly changes how the U.S. taxes corporations. The 2017 Tax Act requires complex computations to be performed that were not previously required by U.S. tax law, significant judgments to be made in interpretation of the provisions of the 2017 Tax Act, significant estimates in calculations, and the preparation and analysis of information not previously relevant or regularly produced. The ultimate impact of the 2017 Tax Act may differ from our estimates, possibly materially, due to changes in the interpretations and assumptions made as well as additional regulatory guidance that may be issued and actions we may take as a result of the 2017 Tax Act.
The 2017 Tax Act was signed into law on December 22, 2017. The 2017 Tax Act significantly revised the U.S. corporate income tax by, among other things, lowering the statutory corporate tax rate from 35% to 21%, eliminating certain deductions, imposing a mandatory one-time tax on accumulated earnings of foreign subsidiaries as of 2017, introducing new tax regimes, and changing how foreign earnings are subject to U.S. tax. Our preliminary estimate of the 2017 Tax Act and the remeasurement of our deferred tax assets and liabilities is subject to the finalization of management’s analysis related to certain matters, such as developing interpretations of the provisions of the 2017 Tax Act, changes to certain estimates and the filing of our tax returns. U.S. Treasury regulations, administrative interpretations or court decisions interpreting the 2017 Tax Act may require further adjustments and changes in our estimates. The final determination of the impact of the 2017 Tax Act and the remeasurement of our deferred assets and liabilities will be completed as additional information becomes available, but no later than one year from the enactment of the 2017 Tax Act in accordance with SAB 118. Those adjustments may impact our provision for income taxes in the period in which the adjustments are made.
For our calendar year beginning in 2018 we are subject to several provisions of the 2017 Tax Act including computations under Global Intangible Low Taxed Income (“GILTI”) and Foreign Derived Intangible Income (“FDII”). We were able to make a reasonable estimate of the impact of each provision of the 2017 Tax Act on our effective tax rate for the three months ended June 30, 2018. We will continue to refine our provisional estimates for our computations under the GILTI and FDII rules as we gather additional information.
On a longer term basis, certain aspects of the 2017 Tax Act are expected to have a positive impact on our future income tax expense, including the reduction in the U.S. corporate income tax rate.
As a result of the geographic mix of earnings and losses, including discrete tax items, our tax rate has been and will continue to be volatile.
Six Months Ended June 30, 2018 compared to Six Months Ended June 30, 2017
Revenues
Revenues were $114.1 million for the six months ended June 30, 2018 as compared to $95.5 million for the six months ended June 30, 2017. This increase was primarily attributable to an increase in the volume of sales of our fracturing systems and well construction products and services due to higher customer drilling and well completion activity in North America as well as the contributions from Repeat Precision and tracer diagnostics services, both of which were added through acquisitions completed during 2017. Product sales for the six months ended June 30, 2018 were $77.9 million as compared to $75.0 million for the six months ended June 30, 2017. Our service revenue was $36.2 million for the six months ended June 30, 2018 as compared to $20.5 million for the six months ended June 30, 2017.
Cost of sales was $53.5 million, or 46.9% of revenues, for the six months ended June 30, 2018 as compared to $48.2 million, or 50.5% of revenues, for the six months ended June 30, 2017. The increase in cost of sales was primarily a result of higher product sales in addition to the inclusion of Repeat Precision and tracer diagnostics services. Cost of sales was a lower percentage of revenues due to the relative increase in services revenue and higher sales volumes for well construction products and at Repeat Precision, which enabled better utilization of fixed costs. Cost of product sales was $37.3 million, or 47.9% of product sales revenue, and cost of services was $16.2 million, or 44.7% of service revenue, for the six months ended June 30, 2018. For the six months ended June 30, 2017, cost of product sales was $40.4 million, or 54.0% of product sales revenue, and cost of services was $7.8 million, or 38.0% of service revenue.
29
Selling, general and administrative expenses
Selling, general and administrative expenses were $43.2 million for the six months ended June 30, 2018 as compared to $28.9 million for the six months ended June 30, 2017. The increase was the direct result of headcount additions in substantially all functional areas, six months of operations for tracer diagnostics services and an increase in share-based compensation related to the issuance of restricted stock units and performance stock unit awards as well as amendments to certain stock options in connection with our IPO during the second quarter of 2017. The increases were partially offset by significant non-capitalizable additional expenses incurred related to our IPO of $2.2 million and acquisition costs of $0.7 million incurred during the six months ended June 30, 2017.
Depreciation
Depreciation was $2.3 million for the six months ended June 30, 2018 as compared to $1.2 million for the six months ended June 30, 2017. The increase is attributable to a higher level of property and equipment, primarily related to our acquisitions.
Amortization
Amortization was $6.6 million for the six months ended June 30, 2018 as compared to $12.0 million for the six months ended June 30, 2017. The decrease in amortization was related to intangible assets that became fully amortized during the fourth quarter of 2017. The decrease was partially offset by an increase in amortizable intangible assets related to our acquisitions.
Change in fair value of contingent consideration
Change in fair value of contingent consideration was $(1.1) million for the six months ended June 30, 2018 compared to $0.8 million for the six months ended June 30, 2017 due to the change in the fair value of the earn-outs associated with our acquisitions.
Interest expense, net
Interest expense, net was $1.1 million for the six months ended June 30, 2018 as compared to $3.5 million for the six months ended June 30, 2017. The decrease in interest expense, net was primarily a result of prepaying our prior term loan in full in May 2017 by utilizing a portion of the proceeds from our IPO. The decrease was partially offset by higher interest expense due to borrowing $20.0 million under our Senior Secured Credit Facility in August 2017.
Other income, net
Other income, net was $40 thousand for the six months ended June 30, 2018 as compared to $1.0 million for the six months ended June 30, 2017. Other income, net was lower primarily due to the receipt of $0.9 million from an arbitration case that was decided in our favor in February 2017.
Foreign currency exchange gain
Foreign currency exchange gain was $0.3 million for the six months ended June 30, 2018 as compared to a gain of $1.0 million for the six months ended June 30, 2017. The change was primarily due to the impact of the retirement of our foreign currency denominated debt and movement in the foreign currency exchange rates between the periods.
Income tax (benefit) expense
Income tax (benefit) expense was $(0.1) million for the six months ended June 30, 2018 as compared to $1.2 million for the six months ended June 30, 2017. For the six months ended June 30, 2018 and 2017, our effective income tax rates were (0.8)% and 43.7%, respectively. The income tax expense and effective tax rate for the six months ended June 30, 2018 was significantly impacted by the U.S. Tax Cuts and Jobs Act of 2017 (the “2017 Tax Act”) including administrative guidance issued by the Internal Revenue Service on April 2, 2018. This guidance resulted in a change to the calculation of the mandatory one-time tax on accumulated earnings of foreign subsidiaries in 2017 and a tax benefit of $2.6 million was recorded in tax expense with a corresponding reduction in the effective tax rate of 29.1%. Additionally, the effective tax rate for June 30, 2018 included a tax benefit of $0.3 million for the tax effect of exercised stock option awards.
The 2017 Tax Act significantly changes how the U.S. taxes corporations. The 2017 Tax Act requires complex computations to be performed that were not previously required by U.S. tax law, significant judgments to be made in interpretation of the provisions of the 2017 Tax Act, significant estimates in calculations, and the preparation and analysis of information not previously relevant or regularly produced. The ultimate impact of the 2017 Tax Act may differ from our estimates, possibly materially, due to changes in the
30
interpretations and assumptions made as well as additional regulatory guidance that may be issued and actions we may take as a result of the 2017 Tax Act.
The 2017 Tax Act was signed into law on December 22, 2017. The 2017 Tax Act significantly revised the U.S. corporate income tax by, among other things, lowering the statutory corporate tax rate from 35% to 21%, eliminating certain deductions, imposing a mandatory one-time tax on accumulated earnings of foreign subsidiaries as of 2017, introducing new tax regimes, and changing how foreign earnings are subject to U.S. tax. Our preliminary estimate of the 2017 Tax Act and the remeasurement of our deferred tax assets and liabilities is subject to the finalization of management’s analysis related to certain matters, such as developing interpretations of the provisions of the 2017 Tax Act, changes to certain estimates and the filing of our tax returns. U.S. Treasury regulations, administrative interpretations or court decisions interpreting the 2017 Tax Act may require further adjustments and changes in our estimates. The final determination of the impact of the 2017 Tax Act and the remeasurement of our deferred assets and liabilities will be completed as additional information becomes available, but no later than one year from the enactment of the 2017 Tax Act in accordance with SAB 118. Those adjustments may impact our provision for income taxes in the period in which the adjustments are made.
For our calendar year beginning in 2018 we are subject to several provisions of the 2017 Tax Act including computations under Global Intangible Low Taxed Income (“GILTI”) and Foreign Derived Intangible Income (“FDII”). We were able to make a reasonable estimate of the impact of each provision of the 2017 Tax Act on our effective tax rate for the six months ended June 30, 2018. We will continue to refine our provisional estimates for our computations under the GILTI and FDII rules as we gather additional information.
On a longer term basis, certain aspects of the 2017 Tax Act are expected to have a positive impact on our future income tax expense, including the reduction in the U.S. corporate income tax rate.
As a result of the geographic mix of earnings and losses, including discrete tax items, our tax rate has been and will continue to be volatile.
Liquidity and Capital Resources
Our primary sources of liquidity are our existing cash and cash equivalents, cash provided by operating activities and borrowings under our Senior Secured Credit Facility. As of June 30, 2018, we had cash and cash equivalents of $33.5 million and availability under the Senior Secured Credit Facility of $55.0 million. Our total indebtedness was $25.0 million as of June 30, 2018.
Our principal liquidity needs have been, and are expected to continue to be, capital expenditures, working capital, debt service and potential mergers and acquisitions. Our capital expenditures for the six months ended June 30, 2018 and 2017 were $3.8 million and $3.9 million, respectively. We plan to incur approximately $15 million to $18 million in capital expenditures during 2018, which includes capital expenditures related to a new enterprise resource planning system, the establishment of a laboratory in Canada supporting our tracer diagnostics business, additional machining capacity at Repeat Precision and the remainder of the estimated spending for our research and development facility described below. We are investing in our owned facility in Canada to create a research and development facility for product development as well as to further demonstrate the capabilities and benefits of our products to our customers. We estimate total spending for the project to be approximately $11 million CAD ($8.4 million at June 30, 2018), which started in 2017 and which we expect will be completed in late 2018 or early 2019. We believe our cash on hand, cash flows from operations and potential borrowings under our Senior Secured Credit Facility will be sufficient to fund our capital expenditure and liquidity requirements for the next twelve months.
We anticipate that to the extent that we require additional liquidity, it will be funded through the incurrence of additional indebtedness, the proceeds of equity issuances, or a combination thereof. We cannot assure you that we will be able to obtain this additional liquidity on reasonable terms, or at all. Our liquidity and our ability to meet our obligations and fund our capital requirements are also dependent on our future financial performance, which is subject to general economic, financial and other factors that are beyond our control. Accordingly, we cannot assure you that our business will generate sufficient cash flow from operations or that funds will be available from additional indebtedness, the capital markets or otherwise to meet our liquidity needs. If we decide to pursue one or more significant acquisitions, we may incur additional debt or sell additional equity to finance such acquisitions, which could result in additional expenses or dilution.
31
Cash Flows
The following table provides a summary of cash flows from operating, investing and financing activities for the periods presented (in thousands):
|
|
|
|
|
|
|
|
|
|
|
|
|
|
|
|
|
|
|
Six Months Ended |
||||
|
|
|
June 30, |
||||
|
|
|
2018 |
|
2017 |
||
|
Net cash provided by operating activities |
|
$ |
7,495 |
|
$ |
7,040 |
|
Net cash used in investing activities |
|
|
(3,550) |
|
|
(8,732) |
|
Net cash (used in) provided by financing activities |
|
|
(2,909) |
|
|
63,362 |
|
Effect of exchange rate changes on cash and cash equivalents |
|
|
(1,368) |
|
|
46 |
|
Net change in cash and cash equivalents |
|
$ |
(332) |
|
$ |
61,716 |
Net cash provided by operating activities was $7.5 million and $7.0 million for the six months ended June 30, 2018 and 2017, respectively. The increase in 2018 was primarily related to higher net income as a result of increased business activity and changes in working capital including accounts receivable and inventories. The increase was partially offset by changes to income tax receivable/payable.
Investing Activities
Net cash used in investing activities was $3.6 million and $8.7 million for the six months ended June 30, 2018 and 2017, respectively. The decrease in cash used in investing activities during the six months ended June 30, 2018 as compared to the six months ended June 30, 2017 was primarily related to the $6.0 million funding of our 50% interest in Repeat Precision in 2017. See “Note 3. Acquisitions” in our unaudited condensed consolidated financial statements. The decrease was partially offset by a $1.0 million note receivable repayment during the six months ended June 30, 2017.
Financing Activities
The net cash used in financing activities for the six months ended June 30, 2018 was $2.9 million as compared to net cash provided by financing activities of $63.4 million. The change between net cash used in financing activities for the six months ended June 30, 2018 and net cash provided by financing activities for the six months ended June 30, 2017 was primarily related to net proceeds from the completion of our IPO on May 3, 2017 of $148.9 million, after deducting underwriting discounts and commissions and other offering expenses, which was partially offset by the $89.1 million repayment of the prior term loan under our prior senior secured credit facility during the second quarter of 2017.
On May 4, 2017, we entered into an Amended and Restated Credit Agreement (the “Credit Agreement”) with Pioneer Investment, Inc., as borrower (the “U.S. Borrower”), NCS Multistage Inc., as borrower (the “Canadian Borrower”), Pioneer Intermediate, Inc. (together with the Company, the “Parent Guarantors”) and the lenders party thereto, Wells Fargo Bank, National Association as administrative agent in respect of the U.S. Facility (as defined below) and Wells Fargo Bank, National Association, Canadian Branch as administrative agent in respect of the Canadian Facility (as defined below) (the senior secured revolving credit facilities provided thereunder, the “Senior Secured Credit Facility”). The Credit Agreement amended and restated the prior credit agreement in its entirety. The Senior Secured Credit Facility will mature on May 4, 2020.
The Senior Secured Credit Facility originally consisted of a (i) senior secured revolving credit facility in an aggregate principal amount of $25.0 million made available to the U.S. Borrower (the “U.S. Facility”), of which up to $5.0 million may be made available for letters of credit and up to $5.0 million may be made available for swingline loans and (ii) senior secured revolving credit facility in an aggregate principal amount of $25.0 million made available to the Canadian Borrower (the “Canadian Facility”). We entered into Amendment No. 1 to the Credit Agreement on August 31, 2017, which increased the loan commitment available to the U.S. Borrower to $50.0 million from $25.0 million under the U.S. Facility. The loan commitment available under the Canadian Facility remained at $25.0 million. On February 16, 2018, we entered into Amendment No. 2 to the Credit Agreement, which amended certain negative covenants contained in the Credit Agreement. At June 30, 2018, we had $20.0 million in outstanding indebtedness under the U.S. Facility and no outstanding indebtedness under the Canadian Facility.
Borrowings under the U.S. Facility may be made in U.S. dollars, Canadian dollars or Euros and bear interest at a rate equal to the Adjusted Base Rate or Eurocurrency Rate (each as defined in the Credit Agreement), in each case, plus an applicable interest margin
32
as set forth in the Credit Agreement. Borrowings under the Canadian Facility may be made in U.S. dollars or Canadian dollars and bear interest at the Canadian (Cdn) Base Rate, Canadian (U.S.) Base Rate, Eurocurrency Rate or Discount Rate (each as defined in the Credit Agreement), in each case, plus an applicable interest margin as set forth in the Credit Agreement. The Adjusted Base Rate, Canadian (U.S.) Base Rate and Canadian (Cdn) Base Rate applicable margin will be between 2.25% and 3.00% and Eurocurrency Rate applicable margin will be between 3.25% and 4.00%, in each case, depending on the Company’s leverage ratio. The applicable interest rate at June 30, 2018 was 6.25%.
The obligations of the U.S. Borrower under the U.S. Facility are guaranteed by the Parent Guarantors and each of the other existing and future direct and indirect restricted subsidiaries of the Company organized under the laws of the United States (subject to certain exceptions) and are secured by substantially all of the assets of the Parent Guarantors, the U.S. Borrower and such other subsidiary guarantors, in each case, subject to certain exceptions and permitted liens. The obligations of the Canadian Borrower under the Canadian Facility are guaranteed by the Parent Guarantors, the U.S. Borrower and each of the future direct and indirect restricted subsidiaries of the Company organized under the laws of the United States and Canada (subject to certain exceptions) and are secured by substantially all of the assets of the Parent Guarantors, the U.S. Borrower, the Canadian Borrower and such subsidiary guarantors, if any, in each case, subject to certain exceptions and permitted liens.
The Credit Agreement contains financial covenants that require (i) commencing with the fiscal quarter ending June 30, 2017, compliance with a leverage ratio test set at (A) 3.00 to 1.00 as of the last day of each fiscal quarter ending prior to March 31, 2018 and (B) 2.50 to 1.00 as of the last day of each fiscal quarter ending on or after March 31, 2018, (ii) commencing with the fiscal quarter ending June 30, 2017, compliance with an interest coverage ratio test set at 2.75 to 1.00 as of the last day of each fiscal quarter, (iii) if the leverage ratio as of the end of any fiscal quarter is greater than 2.00 to 1.00 and the amount outstanding under the Canadian Facility at any time during such fiscal quarter was greater than $0, compliance as of the end of such fiscal quarter with a Canadian asset coverage ratio test set at 1.00 to 1.00 and (iv) if the leverage ratio as of the end of any fiscal quarter is greater than 2.00 to 1.00 and the amount outstanding under the U.S. Facility at any time during such fiscal quarter was greater than $0, compliance as of the end of such fiscal quarter with a U.S. asset coverage ratio test set at 1.00 to 1.00. As of June 30, 2018, we were in compliance with these financial covenants. The Credit Agreement also contains customary affirmative and negative covenants, including, among other things, restrictions on the creation of liens, the incurrence of indebtedness, investments, dividends and other restricted payments, dispositions and transactions with affiliates. The Credit Agreement also includes customary events of default for facilities of this type (with customary grace periods, as applicable). If an event of default occurs, the lenders under each of the U.S. Facility and the Canadian Facility may elect (after the expiration of any applicable notice or grace periods) to declare all outstanding borrowings under such facility, together with accrued and unpaid interest and other amounts payable thereunder, to be immediately due and payable. The lenders under each of the U.S. Facility and the Canadian Facility also have the right upon an event of default thereunder to terminate any commitments they have to provide further borrowings under such facility. Further, following an event of default under each of the U.S. Facility and the Canadian Facility, the lenders thereunder will have the right to proceed against the collateral granted to them to secure such facility.
Contractual Obligations
Except for the $2.6 million reduction of income tax payable related to the 2017 Tax Act as discussed in “Note 12. Income Taxes” in our unaudited condensed consolidated financial statements, there have been no material changes in our contractual obligations and commitments disclosed in the Annual Report for the year ended December 31, 2017.
Off-Balance Sheet Arrangements
We have no off-balance sheet financing arrangements with the exception of operating leases.
Critical Accounting Policies
See “Note 1. Basis of Presentation” to our unaudited condensed consolidated financial statements for our new significant accounting policy. We have also updated our revenue recognition policies in conjunction with our adoption of ASU 2014-09 and its related amendments (collectively known as “ASC 606”) as further described in “Note 2. Revenues” in our unaudited condensed consolidated financial statements. There are no other material changes to our critical accounting policies from those included in the Annual Report for the year ended December 31, 2017.
Recently Issued Accounting Pronouncements
See “Note 1. Basis of Presentation” to our unaudited condensed consolidated financial statements for discussion of the accounting pronouncements we recently adopted and the accounting pronouncements recently issued by the Financial Accounting Standards Board.
33
Jumpstart Our Business Act of 2012
We are an “emerging growth company” as defined in the Jumpstart Our Business Startups Act of 2012 (the “JOBS Act”). We will remain an emerging growth company until the earlier of (1) the last day of our fiscal year (a) following the fifth anniversary of the completion of our IPO, (b) in which we have total annual gross revenue of at least $1.07 billion, or (c) in which we are deemed to be a large accelerated filer, which means the market value of our common stock that is held by non-affiliates exceeds $700.0 million as of the last business day of our most recently completed second fiscal quarter, and (2) the date on which we have issued more than $1.0 billion in non-convertible debt securities during the prior three-year period. An emerging growth company may take advantage of specified reduced reporting and other burdens that are otherwise applicable generally to public companies.
Cautionary Note Regarding Forward-Looking Statements
This Quarterly Report contains forward-looking statements within the meaning of the Private Securities Litigation Reform Act of 1995. Forward-looking statements can be identified by words such as “anticipates,” “intends,” “plans,” “seeks,” “believes,” “estimates,” “expects” and similar references to future periods, or by the inclusion of forecasts or projections. Examples of forward-looking statements include, but are not limited to, statements we make regarding the outlook for our future business and financial performance, such as those contained in Item 2. “Management’s Discussion and Analysis of Financial Condition and Results of Operations.”
Forward-looking statements are based on our current expectations and assumptions regarding our business, the economy and other future conditions. Because forward-looking statements relate to the future, by their nature, they are subject to inherent uncertainties, risks and changes in circumstances that are difficult to predict. As a result, our actual results may differ materially from those contemplated by the forward-looking statements. Important factors that could cause our actual results to differ materially from those in the forward-looking statements include regional, national or global political, economic, business, competitive, market and regulatory conditions and the following:
|
· |
declines in the level of oil and natural gas exploration and production activity within Canada and the United States; |
|
· |
oil and natural gas price fluctuations; |
|
· |
loss of significant customers; |
|
· |
inability to successfully implement our strategy of increasing sales of products and services into the United States; |
|
· |
significant competition for our products and services; |
|
· |
our inability to successfully develop and implement new technologies, products and services; |
|
· |
our inability to protect and maintain critical intellectual property assets; |
|
· |
currency exchange rate fluctuations; |
|
· |
impact of severe weather conditions; |
|
· |
restrictions on the availability of our customers to obtain water essential to the drilling and hydraulic fracturing processes; |
|
· |
our failure to identify and consummate potential acquisitions; |
|
· |
our inability to integrate or realize the expected benefits from acquisitions; |
|
· |
our inability to meet regulatory requirements for use of certain chemicals by our tracer diagnostics business; |
|
· |
our inability to accurately predict customer demand; |
|
· |
losses and liabilities from uninsured or underinsured drilling and operating activities; |
|
· |
changes in legislation or regulation governing the oil and natural gas industry, including restrictions on emissions of greenhouse gases; |
|
· |
changes in trade policy, including the impact of additional tariffs; |
|
· |
failure to comply with or changes to federal, state and local and non-U.S. laws and other regulations, including environmental regulations and the 2017 Tax Act; |
|
· |
loss of our information and computer systems; |
|
· |
system interruptions or failures, including cyber-security breaches, identity theft or other disruptions that could compromise our information; |
|
· |
our failure to establish and maintain effective internal control over financial reporting; |
|
· |
complications with the design and implementation of our new enterprise resource planning system; |
34
|
· |
our success in attracting and retaining qualified employees and key personnel; and |
|
· |
our inability to satisfy technical requirements and other specifications under contracts and contract tenders. |
For the reasons described above, as well as factors identified in “Item 1A. Risk Factors” in this Quarterly Report and the section of the Annual Report entitled “Risk Factors,” we caution you against relying on any forward-looking statements. Any forward-looking statement made by us in this Quarterly Report speaks only as of the date on which we make it. Factors or events that could cause our actual results to differ may emerge from time to time, and it is not possible for us to predict all of them. We undertake no obligation to publicly update or revise any forward-looking statement, whether as a result of new information, future developments or otherwise, except as may be required by law.
Item 3. Qualitative and Quantitative Disclosures About Market Risk
For our quantitative and qualitative disclosures about market risk, see Item 7A, “Quantitative and Qualitative Disclosures About Market Risk,” of our Annual Report for the fiscal year ended December 31, 2017. Our exposure to market risk has not changed materially since December 31, 2017.
Item 4. Controls and Procedures
Disclosure Controls and Procedures
Under the supervision and with the participation of our management, including the Chief Executive Officer and Chief Financial Officer, we conducted an evaluation of the effectiveness of our disclosure controls and procedures (as such term is defined in Rules 13a-15(e) and 15d-15(e) under the Securities Exchange Act of 1934, as amended (the “Exchange Act”)) as of the end of the period covered by this report. Based on this evaluation, our Chief Executive Officer and Chief Financial Officer concluded that, as of June 30, 2018, our disclosure controls and procedures were effective to provide reasonable assurance that information required to be disclosed in the reports we file or submit under the Exchange Act is recorded, processed, summarized and reported within the time periods specified in the SEC’s rules and forms and that such information is accumulated and communicated to management, including the Chief Executive Officer and Chief Financial Officer, to allow timely decisions regarding required disclosure.
Changes in Internal Control Over Financial Reporting
There were no changes to our internal control over financial reporting that occurred during the quarter ended June 30, 2018 that have materially affected, or are reasonably likely to materially affect, our internal control over financial reporting.
We are in the process of implementing our new enterprise resource planning (“ERP”) system designed to upgrade our technology and improve our financial and operational information, which is expected to be completed during 2018. In connection with this ERP system implementation, we will update our internal controls over financial reporting, as necessary, to accommodate modifications to our business processes and accounting procedures.
35
In the ordinary course of our business, from time to time, we have various claims, lawsuits and administrative proceedings that are pending or threatened with respect to commercial, intellectual property and employee matters.
On July 24, 2018, we filed a patent infringement lawsuit against Kobold Corporation, Kobold Completions Inc. and 2039974 Alberta Ltd. (“Kobold”) in the Federal Court of Canada, alleging that Kobold’s fracturing tools and methods infringe on several of our Canadian patents. We previously filed a breach of contract lawsuit on March 16, 2018, against Kobold Corporation in the Court of Queen’s Bench of Alberta, alleging breach of a prior settlement agreement. Both of these lawsuits seek unspecified monetary damages and injunctive relief.
While the outcome of any legal proceedings cannot be predicted with any certainty, based on a consideration of relevant facts and circumstances, our management currently does not expect that the results of these legal proceedings would have a material adverse effect on our financial position, results of operations or cash flows.
There have been no material changes from the risk factors disclosed in our Annual Report for the year ended December 31, 2017, except as set forth below:
Our competitors may infringe upon, misappropriate, violate or challenge the validity or enforceability of our intellectual property and we may not be able to adequately protect or enforce our intellectual property rights in the future.
We currently hold multiple U.S. and international patents and have multiple pending patent applications for products and processes. Patent rights give the owner of a patent the right to exclude third parties from making, using, selling, and offering for sale the inventions claimed in the patents in the applicable country. Patent rights do not necessarily grant the owner of a patent the right to practice the invention claimed in a patent, but merely the right to exclude others from practicing the invention claimed in the patent. It may be possible for a third-party to design around our patents. Furthermore, patent rights have strict territorial limits. We may not be able to enforce our patents against infringement occurring in “non-covered” territories. Also, we do not have patents in every jurisdiction in which we conduct business and our patent portfolio will not protect all aspects of our business and may relate to obsolete or unusual methods, which would not prevent third parties from entering the same market.
Despite our efforts to safeguard our intellectual property rights, we may not be successful in doing so, or the steps taken by us in this regard may not be adequate to detect or deter misappropriation of our technology or to prevent an unauthorized third party from copying or otherwise obtaining and using our products, technology or other information that we regard as proprietary. Moreover, our competitors may independently develop equivalent knowledge, methods and know‑how. Competitors could purchase our products and attempt to replicate some or all of the competitive advantages we derive from our development efforts, infringe our intellectual property rights, design around our protected technology or develop their own competitive technologies that fall outside of our intellectual property rights. For example, on July 24, 2018, we filed a patent infringement lawsuit against Kobold in the Federal Court of Canada, alleging that Kobold’s fracturing tools and methods infringe on several of our Canadian patents. We also previously filed a breach of contract lawsuit on March 16, 2018, against Kobold Corporation in the Court of Queen’s Bench of Alberta, alleging breach of a prior settlement agreement. If we do not prevail in the Federal Court lawsuit, it could impact the strength or validity of the patents in question. Our inability to adequately protect our intellectual property could allow our competitors, including Kobold, and other third parties to produce products based on our patented or proprietary technology and other intellectual property rights, providing increased competition and pricing pressure, which could substantially impair our ability to compete.
In addition, by customarily entering into employment, confidentiality and/or license agreements with our employees, customers and potential customers and suppliers, we attempt to limit access to and distribution of our technology. Our rights in our confidential information, trade secrets, and confidential know-how will not prevent third parties from independently developing similar information. Publicly available information (e.g. information in expired issued patents, published patent applications, and scientific literature) can also be used by third parties to independently develop technology. This independently developed technology may be equivalent or superior to our proprietary technology.
Confidential information shared with employees, customers and potential customers and suppliers may be used by those parties in a manner inconsistent with their employment, confidentiality and/or license agreements and we may not be able to adequately protect against or stop such behavior. We may not be able to determine if competitive technology offered by third parties was independently
36
developed or resulted from breach of our agreements. When we do become aware of breaches, we may become involved in legal proceedings from time to time to protect our legal interests and enforce such agreements.
Changes in trade policies, including the imposition of additional tariffs, could negatively impact our business, financial condition and results of operations.
The current United States administration has signaled support for implementing, and in some instances, has already proposed or taken action with respect to, major changes to certain trade policies, such as the imposition of additional tariffs on imported products and the withdrawal from or renegotiation of certain trade agreements, including the North American Free Trade Agreement. On March 8, 2018, the President of the United States signed an order to impose a tariff of 25% on steel imported from certain countries. On July 1, 2018, Canada implemented retaliatory tariffs on certain U.S. imports, including steel. We anticipate that the tariff could result in an increase in our cost of sales, beginning as early as the third quarter of 2018, and there can be no assurance that we will be able to pass any of the increases in raw material costs directly resulting from the tariff to our customers.
In addition, there could be additional tariffs imposed by the United States and these could also result in additional retaliatory actions by the United States’ trade partners. Given that we procure many of the raw materials that we use to create our products directly or indirectly from outside of the United States, the imposition of tariffs and other potential changes in U.S. trade policy could increase the cost or limit the availability of such raw materials, which could hurt our competitive position and adversely impact our business, financial condition and results of operations. In addition, we sell a significant proportion of our products to customers outside of the United States. Retaliatory actions by other countries could result in increases in the price of our products, which could limit demand for such products, hurt our global competitive position and have a material adverse effect on our business, financial condition and results of operations.
Complications with the design or implementation of our new enterprise resource planning system could adversely impact our business and operations.
We rely extensively on information systems and technology to manage our business and summarize operating results. We are in the process of the implementation of a new ERP system. This ERP system will replace our existing operating and financial systems. The ERP system is designed to accurately maintain our financial records, enhance operational functionality and provide timely information to our management team related to the operation of the business. The ERP system implementation process has required, and will continue to require, the investment of significant personnel and financial resources. We may not be able to successfully implement the ERP system without experiencing delays, increased costs and other difficulties. If we are unable to successfully design and implement the new ERP system as planned, it could have a material adverse effect on our business, financial condition and results of operations. Additionally, if we do not effectively implement the ERP system as planned or the ERP system does not operate as intended, the effectiveness of our internal control over financial reporting could be adversely affected or our ability to assess those controls adequately could be delayed.
37
|
|
|
|
|
|
Exhibit |
|
|
|
|
No. |
|
Description |
|
|
* |
|
Certification of Chief Executive Officer Pursuant to Section 302 of the Sarbanes-Oxley Act of 2002. |
|
|
* |
|
Certification of Chief Financial Officer Pursuant to Section 302 of the Sarbanes-Oxley Act of 2002. |
|
|
** |
|
Certification of Chief Executive Officer Pursuant to Section 906 of the Sarbanes-Oxley Act of 2002. |
|
|
** |
|
Certification of Chief Financial Officer Pursuant to Section 906 of the Sarbanes-Oxley Act of 2002. |
|
|
*** |
101.INS |
|
XBRL Instance Document |
|
*** |
101.SCH |
|
XBRL Taxonomy Extension Schema |
|
*** |
101.CAL |
|
XBRL Taxonomy Extension Calculation Linkbase |
|
*** |
101.DEF |
|
XBRL Taxonomy Extension Definition Linkbase |
|
*** |
101.LAB |
|
XBRL Taxonomy Extension Label Linkbase |
|
*** |
101.PRE |
|
XBRL Taxonomy Extension Presentation Linkbase |
|
|
|
|
|
|
* |
Filed herewith. |
||
|
** |
Furnished herewith. |
||
|
*** |
Submitted electronically with this Report. |
||
38
Pursuant to the requirements of Securities Exchange Act of 1934, the registrant has duly caused this report to be signed on its behalf by the undersigned thereunto duly authorized.
|
|
|
|
|
|
|
|
|
|
|
Date: August 8, 2018 |
|
NCS Multistage Holdings, Inc. |
|
|
|
|
|
|
|
|
|
By: |
/s/ Robert Nipper |
|
|
|
|
Robert Nipper |
|
|
|
|
Chief Executive Officer |
|
|
|
|
|
|
|
|
|
(Principal Executive Officer and Authorized |
|
|
|
|
Signatory) |
39