Attached files
| file | filename |
|---|---|
| EX-99.1 - EXHIBIT 99.1 - KELLY SERVICES INC | a20182qearningsreleaseform.htm |
| 8-K - 8-K - KELLY SERVICES INC | form8-k2018secondquarter.htm |

Exhibit 99.2 Second Quarter 2018 August 8, 2018

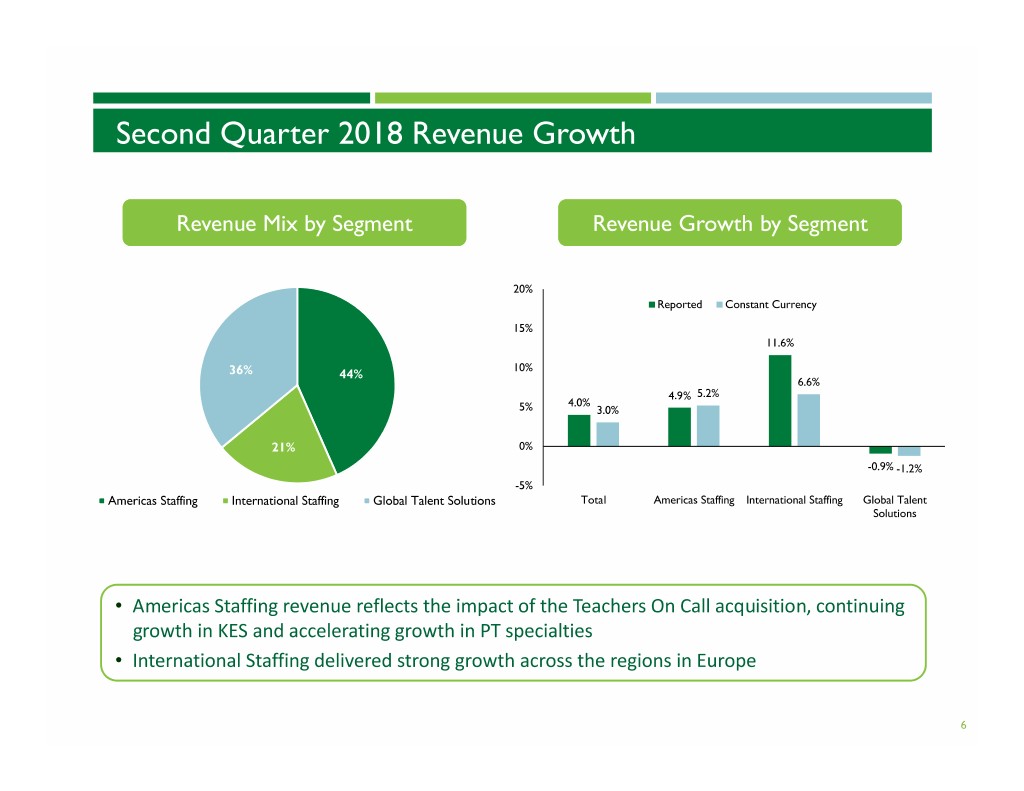
Second Quarter Takeaways DELIVERING GROWTH CONTINUED TOP‐LINE GROWTH in Staffing Segments Revenue up 4.0%; Americas revenue up 5% 3.0% in constant International revenue up currency 12%; 7% in constant currency FOCUSING ON OUR FUTURE Kelly Innovation Fund makes inaugural investment in Kenzie Academy Aligning resources with growth 2

Second Quarter 2018 Financial Summary Constant Currency Actual Results Change Change(1) Revenue $1.4B 4.0% 3.0% GP % 17.3% 10 bps Earnings from Operations $20.4M 0.1% (3.2)% ROS %1.5% ‐ EPS ($0.40) ($0.87) • Revenue increase reflects continued growth in Americas Staffing and continued, although slowing, performance in International Staffing • GP rate improvement from structural improvement in GTS GP rates and higher perm fees, which was partially offset by customer mix in Americas Staffing and International Staffing • Earnings from operations on par with last year as GP increases are offset by expense increases • EPS includes $0.94 unfavorable non‐cash impact from loss on equity investment due to adoption of a required accounting standard effective in Q1 2018 ----- (1)Constant Currency represent year-over-year changes resulting from translating 2018 financial data into USD using 2017 exchange rates. 3

Second Quarter 2018 Financial Summary (Excluding Loss on investment in Persol Holdings) Constant Currency Actual Results Change Change(2) Revenue $1.4B 4.0% 3.0% GP % 17.3% 10 bps Earnings from Operations $20.4M 0.1% (3.2)% ROS % 1.5% ‐ EPS(1) $0.54 $ 0.07 • Revenue increase reflects continued growth in Americas Staffing and continued, although slowing, performance in International Staffing • GP rate improvement from structural improvement in GTS GP rates and higher perm fees, which was partially offset by customer mix in Americas Staffing and International Staffing • Earnings from operations on par with last year as GP increases are offset by expense increases • EPS improves $0.07 or 15% ----- (1)Excludes $52.5 million loss on investment, $36.3 million net of income tax benefit or $0.94 per share, in Q2 2018. (2)Constant Currency represents year-over-year changes resulting from translating 2018 financial data into USD using 2017 exchange rates. 4

Second Quarter 2018 EPS Summary $ in Millions except per share data Second Quarter 2018 2017 Amount Per Share Amount Per Share Net earnings (loss) $ (15.4) $ (0.40) $ 18.7 $ 0.47 Loss on investment in Persol Holdings, net of taxes (1) 36.3 0.94 ‐ ‐ Adjusted net earnings $ 20.9 $ 0.54 $ 18.7 $ 0.47 • As adjusted, net earnings and EPS improve based on an improving income tax rate. Earnings from Operations were flat as revenue growth and modest GP rate improvement were offset by expense increases ----- (1)Loss on investment in Persol Holdings of $52.5 million, $36.3 million net of tax benefit or $0.94 per share in Q2 2018. 5

Second Quarter 2018 Revenue Growth Revenue Mix by Segment Revenue Growth by Segment 20% Reported Constant Currency 15% 11.6% 10% 36% 44% 6.6% 4.9% 5.2% 4.0% 5% 3.0% 21% 0% -0.9% -1.2% -5% Americas Staffing International Staffing Global Talent Solutions Total Americas Staffing International Staffing Global Talent Solutions • Americas Staffing revenue reflects the impact of the Teachers On Call acquisition, continuing growth in KES and accelerating growth in PT specialties • International Staffing delivered strong growth across the regions in Europe 6

Second Quarter 2018 Gross Profit Growth Gross Profit Mix by Segment Gross Profit Growth by Segment Reported Constant Currency 15% 39% 45% 10% 8.3% 5.1% 4.5% 4.7% 4.5% 5% 4.2% 3.5% 4.0% 17% 0% Total Americas Staffing International Global Talent Staffing Solutions Americas Staffing International Staffing Global Talent Solutions -5% • Americas Staffing and International Staffing GP progress reflects top‐line growth and the impact of higher perm fees, which was partially offset by GP rate declines due to changes in customer mix • GTS GP reflects GP structural rate improvement on flat revenue 7

Second Quarter 2018 Gross Profit Rate 20.0% 19.5% 19.0% 18.5% 18.0% 20 bps 30 bps 17.5% 17.2% 17.3% (20 bps) (10 bps) 17.0% (10 bps) 16.5% 16.0% 15.5% 15.0% Q2 2017 GP Rate Global Talent Permanent Americas Staffing International FX Q2 2018 GP Rate Solutions Placement Income Staffing • GTS GP rates reflects a return to structural GP rate improvement from product mix • Higher perm fees in both Americas Staffing and International Staffing segments were offset by declines in each segment’s temporary staffing GP rate 8

Second Quarter 2018 SG&A $ in Millions $240 $235 $230 $225 $7 $220 $220 $215 $2 $1 $1 $210 $209 $205 $200 $195 $190 Q2 2017 SG&A FX Global Talent Solutions Corporate Americas Staffing Q2 2018 SG&A • Americas Staffing expenses were up due to additional resources added as a result of the current talent supply environment, as well as the addition of Teachers On Call • Corporate expense reflects the impact of a one‐time $2.5 million benefit in 2017 executive compensation expenses 9

Second Quarter 2018 Conversion Rate $ in Millions 2018 2017 Gross Earnings Conversion Gross Earnings Conversion Change Profit from Ops Rate(1) Profit from Ops Rate(1) (bps) Americas Staffing $ 108.5 $ 17.8 16.4%$ 103.8 $ 20.4 19.7% (330) Global Talent Solutions 92.7 17.7 19.1% 88.7 15.3 17.2% 190 International Staffing 39.9 6.4 16.0% 36.8 4.1 11.2% 480 Total Company $ 240.5 $ 20.4 8.5%$ 228.8 $ 20.3 8.9% (40) • Americas Staffing conversion rate reflects the impact of higher expenses – although top line growth continues • GTS conversion rate reflects improved GP rate combined with improved leverage • International Staffing conversion rate reflects growing GP and effective cost management • Total Company conversion rate decline reflects the impact of modest GP rate improvement which was more than offset by higher expenses ----- (1)Conversion rate represents earnings from operations as a percent of gross profit, or return on gross profit. 10

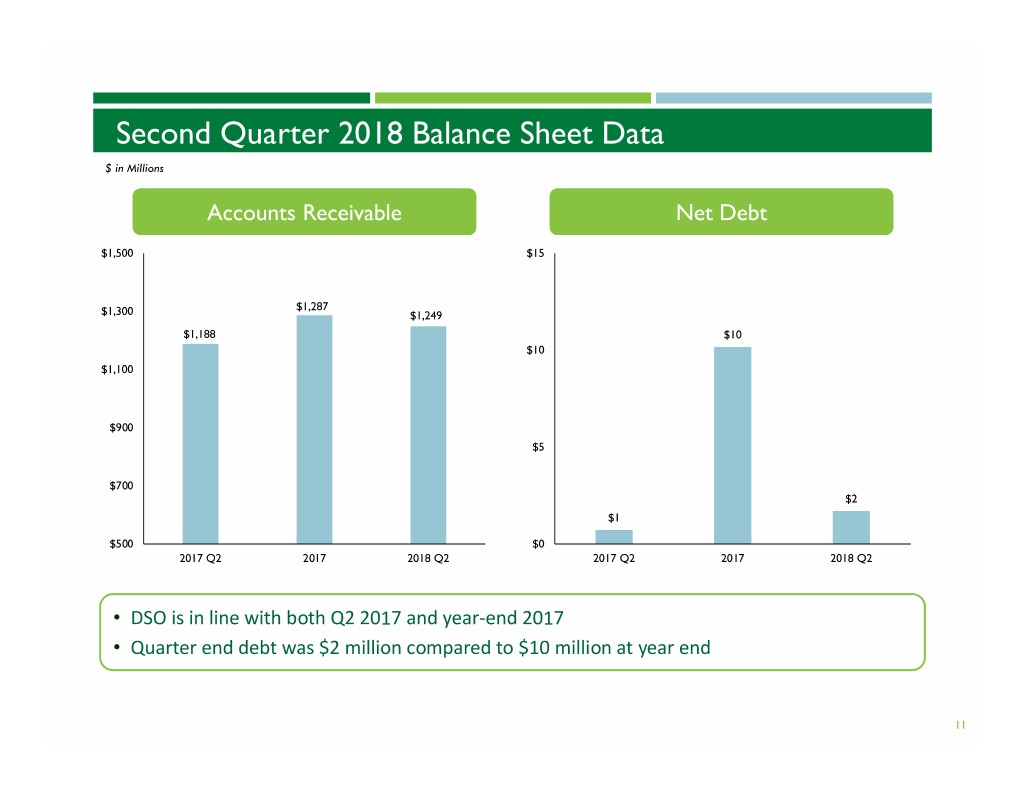
Second Quarter 2018 Balance Sheet Data $ in Millions Accounts Receivable Net Debt $1,500 $15 $1,287 $1,300 $1,249 $1,188 $10 $10 $1,100 $900 $5 $700 $2 $1 $500 $0 2017 Q2 2017 2018 Q2 2017 Q2 2017 2018 Q2 • DSO is in line with both Q2 2017 and year‐end 2017 • Quarter end debt was $2 million compared to $10 million at year end 11

Outlook – Third Quarter 2018 Revenue up 2% to 3% YOY • 50 basis point unfavorable impact due to currency • Includes impact from the sale of our healthcare staffing business • Impact of revenue recognition not expected to be material Gross profit rate up YOY and sequentially SG&A up 4% to 5% YOY Impact of the new standard related to accounting for equity investments effective in Q1 2018 is recognized below Earnings from Operations and is not included in the 2018 Outlook 12

2018 Outlook – Full Year Revenue up 3.5% to 4.5% YOY • 70 basis point improvement due to currency • Includes impact from acquisition of Teachers On Call, net of the sale of our healthcare staffing business • Impact of revenue recognition not expected to be material Gross profit rate flat YOY SG&A up 3.0% to 4.0% YOY • Includes impact of additional spending on technology and efficiency initiatives Annual tax rate in middle single digits • Reflects impact of Tax Cuts and Jobs Act • Excludes investment in Persol Holdings gain/loss Impact of the new standard related to accounting for equity investments effective in Q1 2018 is recognized below Earnings from Operations and is not included in the 2018 Outlook 13

Developments and Initiatives Driving Improvement Acquired Teachers On Call (6th largest educational staffing firm in the U.S.) in September 2017 Further strengthens Kelly’s #1 leadership position in the K‐12 staffing market Complements KES geographic footprint and opens doors for new services and revenue, including early child care centers Formed partnership with InGenesis in sale of US healthcare staffing business in Q1 2018 Partnership allowed Kelly to monetize business and deploy resources towards other areas where Kelly has scale or specialization Seed funding provided to Kenzie Academy, a tech apprenticeship program that develops modern tech workers Inaugural investment from the Kelly Innovation Fund 14

Non-GAAP Measures Management believes that the non‐GAAP (Generally Accepted Accounting Principles) information excluding 2018 loss on investment in Persol Holdings is useful to understand the Company's fiscal 2018 financial performance and increases comparability. Specifically, Management believes that removing the impact of this item allows for a more meaningful comparison of current period operating performance with the operating results of prior periods. This non‐GAAP measures may have limitations as analytical tools because it excludes items which can have a material impact on cash flow and earnings per share. As a result, Management considers this measure, along withreportedresults,whenitreviewsandevaluatesthe Company's financial performance. Management believes that this measure provides greater transparency to investors and provides insight into how Management is evaluating the Company's financial performance. Non‐GAAP measures should not be considered a substitute for, or superior to, measures of financial performance prepared in accordance with GAAP. A reconciliation to the most comparable GAAP measures is included with our earnings release dated August 8, 2018 and is available on our Investor Relations website. 15

Safe Harbor Statement This release contains statements that are forward looking in nature and, accordingly, are subject to risks and uncertainties. These factors include, but are not limited to, competitive market pressures including pricing and technology introductions and disruptions, changing market and economic conditions, our ability to achieve our business strategy, the risk of damage to our brand, the risk our intellectual property assets could be infringed upon or compromised, our ability to successfully develop new service offerings, our exposure to risks associated with services outside traditional staffing, including business process outsourcing, our increasing dependency on third parties for the execution of critical functions, the risks associated with past and future acquisitions, exposure to risks associated with investments in equity affiliates including PersolKelly Asia Pacific, material changes in demand from or loss of large corporate customers as well as changes in their buying practices, risks particular to doing business with government or government contractors, risks associated with conducting business in foreign countries, including foreign currency fluctuations, the exposure to potential market and currency exchange risks relating to our investment in Persol Holdings, risks associated with violations of anti‐corruption, trade protection and other laws and regulations, availability of qualified full‐time employees, availability of temporary workers with appropriate skills required by customers, liabilities for employment‐related claims and losses, including class action lawsuits and collective actions, risks arising from failure to preserve the privacy of information entrusted to us or to meet our obligations under global privacy laws, the risk of cyber attacks or other breaches of network or information technology security, our ability to sustain critical business applications through our key data centers, our ability to effectively implement and manage our information technology projects, our ability to maintain adequate financial and management processes and controls, risk of potential impairment charges triggered by adverse industry developments or operational circumstances, unexpected changes in claim trends on workers’ compensation, unemployment, disability and medical benefit plans, the impact of changes in laws and regulations (including federal, state and international tax laws), competition law risks, the risk of additional tax or unclaimed property liabilities in excess of our estimates, our ability to maintain specified financial covenants in our bank facilities to continue to access credit markets, and other risks, uncertainties and factors discussed in this release and in the Company’s filings with the Securities and Exchange Commission. Actual results may differ materially from any forward‐looking statements contained herein, and we have no intention to update these statements. 16
