Attached files
| file | filename |
|---|---|
| 8-K - 8-K - FORD MOTOR CO | jpmorganconference8-kdated.htm |

J.P. Morgan Conference Hau Thai-Tang Executive Vice President Product Development and Purchasing, Ford Motor Company
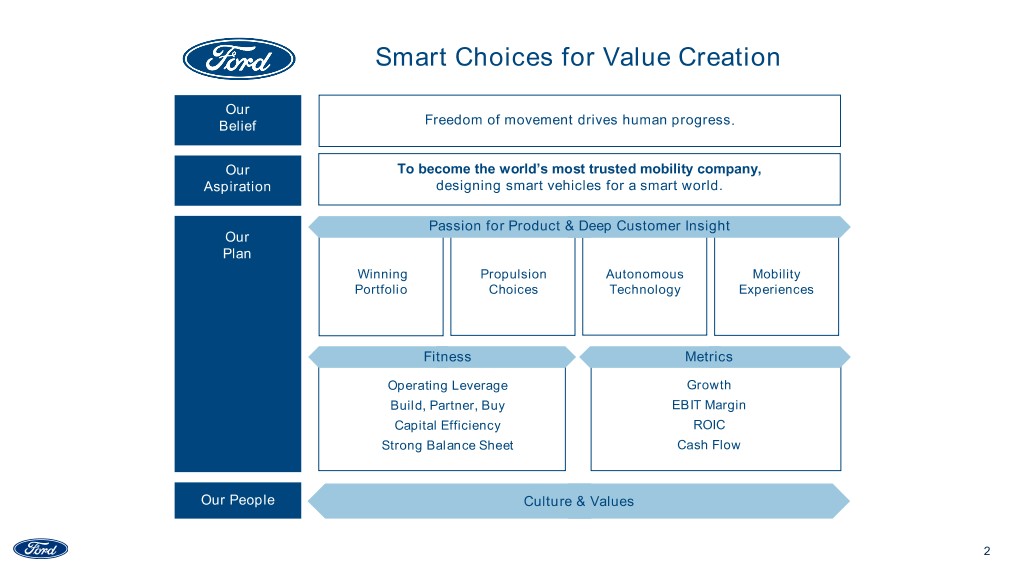
Smart Choices for Value Creation Our Belief Freedom of movement drives human progress. Our To become the world’s most trusted mobility company, Aspiration designing smart vehicles for a smart world. Passion for Product & Deep Customer Insight Our Plan Winning Propulsion Autonomous Mobility Portfolio Choices Technology Experiences Fitness Metrics Operating Leverage Growth Build, Partner, Buy EBIT Margin Capital Efficiency ROIC Strong Balance Sheet Cash Flow Our People Culture & Values 2

Focusing Capital On High-Margin, High-Growth Businesses ROIC (%) H I G H L Y A C C R E T I V E + Circle size = Actual 2017 +/- EBIT (Bils) 50% 150% of Company 40% EBIT 30% High Performing $14.5B 20% 10% Profitable $1B - + EBIT Expense For (15)% (10)% 10% 20% Margin Future Growth (10)% (20)% Low Performing $(4)B (30)% H I G H L Y D I L U T I V E - Note: All references to EBIT and EBIT Margin are on an adjusted basis 3

Shifting Spending To More Profitable Vehicles 60% 39% 37% 29% 24% 11% 2015 Plan 2018 Plan (2016 - 2020) (2019 - 2023) Utilities Trucks and Commercial Vehicles Cars 4

Listening To Our Customers CONNECTIVITY EFFICIENCY UTILITY AFFORDABILITY 5

Leveraging Ford’s Strengths WORK ADVENTURE HUMAN PERFORMANCE CONNECTION 6

Freshest Lineup In U.S. By 2020 Including New Silhouettes AVERAGE AGE OF PORTFOLIO FORD SHIFTING PORTFOLIO ( Y E A R S ) 100% COMMERCIAL VEHICLES 5.7 5.3 PICKUP TRUCKS 4.7 75% 4.1 3.3 50% SUVs 25% CARS COMPETITOR COMPETITOR Competitor Competitor A B a B 0% 2018 2019 2020 2020 2020 7

Improving Operating Leverage Engineering / Product Development $7B Material Cost $12B $25.5B Cost & Efficiencies Identified Marketing & Sales $5B IT Manufacturing $0.2B $1.3B Cumulative Benefit Over 2018 - 2022 Plan Period Versus Original Planned Spend 8

Expected PD Fitness Impact Over 5 Year Plan Period ~$7B 20%+ ~$1B ~$12B Engineering / Less Time Manufacturing Improved PD Cost From Sketch Cost Material Cost Reduction To Showroom Reduction 9

Shaping The Vision For Product Development Fitness Improve engineering Hardware at Product efficiency by 20 - 40% Speed of Co-Creation Software Vehicle program Increase product Collaborative product Best-in-class speed output innovation to market Customer Needs Faster time to market Modular Architecture Lower product Portfolio investment cost Cover bandwidth of portfolio; deliver customer needs and cost targets Lower labor cost 10
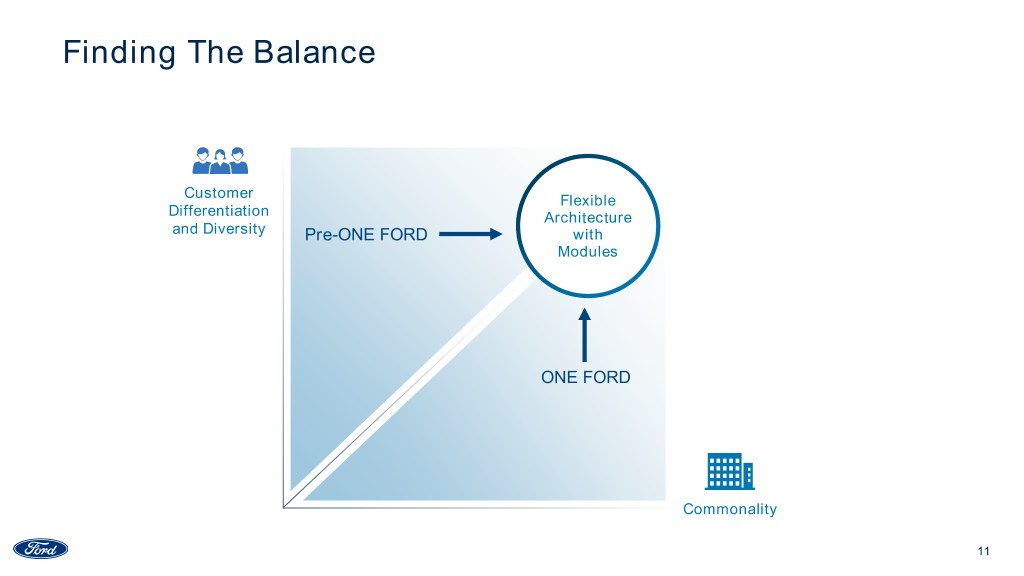
Finding The Balance Customer Flexible Differentiation Architecture and Diversity Pre-ONE FORD with Modules ONE FORD Commonality 11

Building And Evolving From One Ford Flexible Platforms Architectures With Modules Portfolio Requirements 9 5 Engineering & Investment Efficiency ✓ ✓✓ Global / Regional / Local Market Scale ✓ ✓✓✓ Customer Wants & Willingness To Pay ✓ ✓✓ Material Cost Savings -- ✓ Supply Base Operating Efficiency -- ✓ 12

Implementing Five Flexible Architectures Customer Architecture Differentiators Flexible Architectures Consumer ICE*: RWD / AWD Experience 1 Body-On-Frame Energy ICE*: FWD / AWD Regulatory 2 Requirements Unibody ICE*: Commercial 3 Propulsion / Drive Van Unibody ICE*: RWD / AWD 4 Unibody BEV: All drive 5 Body / Frame types Unibody * BEV capable 13
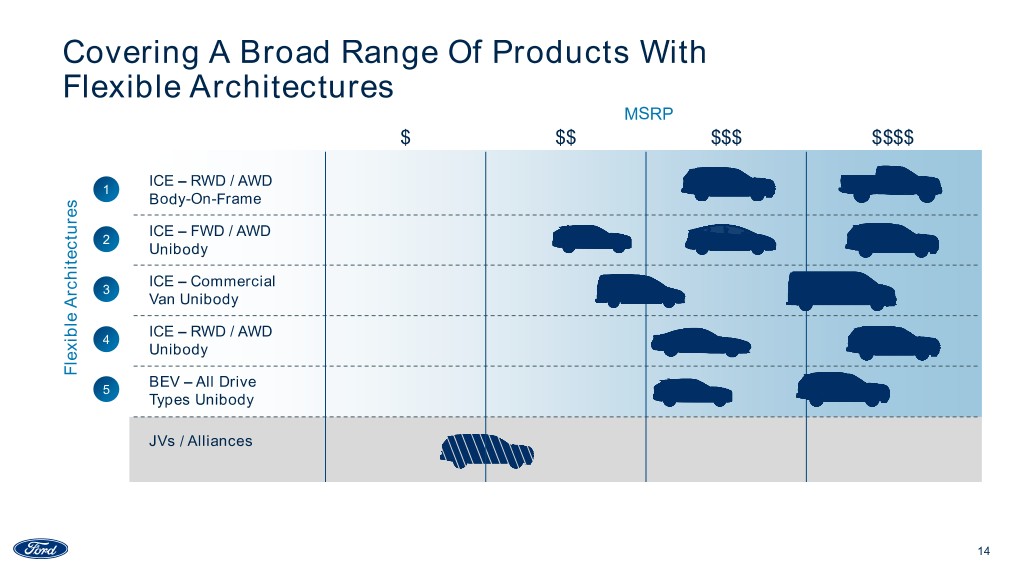
Covering A Broad Range Of Products With Flexible Architectures MSRP $ $$ $$$ $$$$ ICE – RWD / AWD 1 Body-On-Frame ICE – FWD / AWD 2 Unibody ICE – Commercial 3 Van Unibody ICE – RWD / AWD 4 Unibody Flexible Architectures Flexible BEV – All Drive 5 Types Unibody JVs / Alliances 14

Innovating Through Strategic Alliances 15

Improving Efficiency And Effectiveness Through Module Reuse Flexible architectures RWD / AWD Comm. Van RWD / AWD FWD / AWD Unibody BEV Body On Frame Unibody Unibody Focus Escape Transit Connect Current Future Architecture common modules, e.g. cross-car beam, suspension Cross-architecture common modules, e.g. center display and human machine interface 16
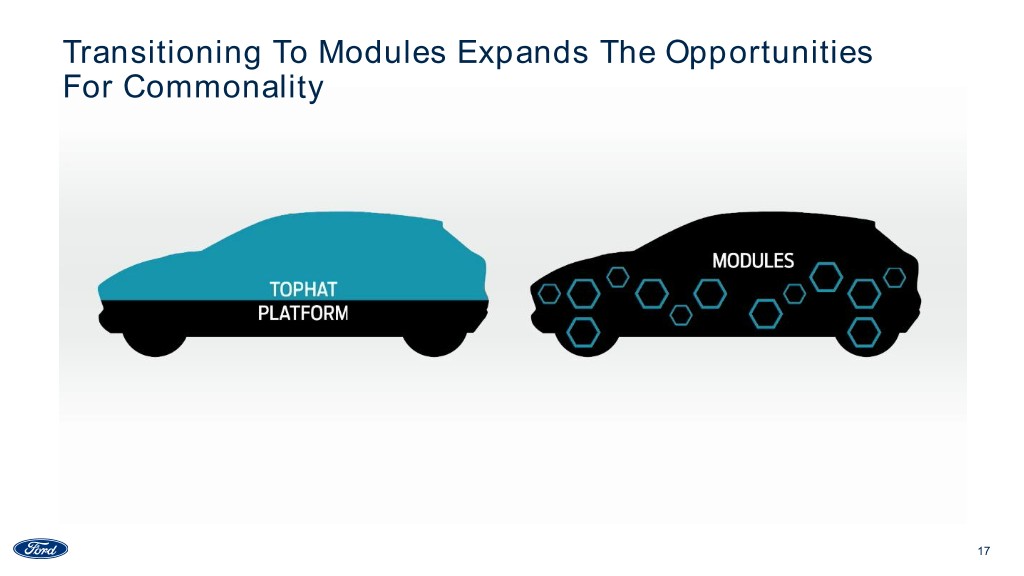
Transitioning To Modules Expands The Opportunities For Commonality 17
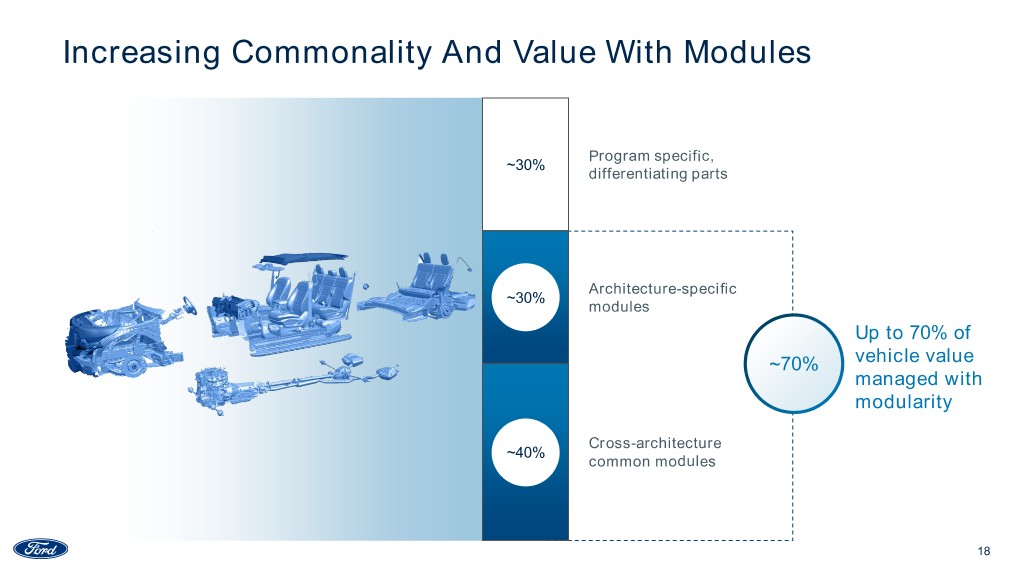
Increasing Commonality And Value With Modules Program specific, ~30% differentiating parts Architecture-specific ~30% modules Up to 70% of ~70% vehicle value managed with modularity Cross-architecture ~40% common modules 18

NextGen In-Vehicle Experience 19
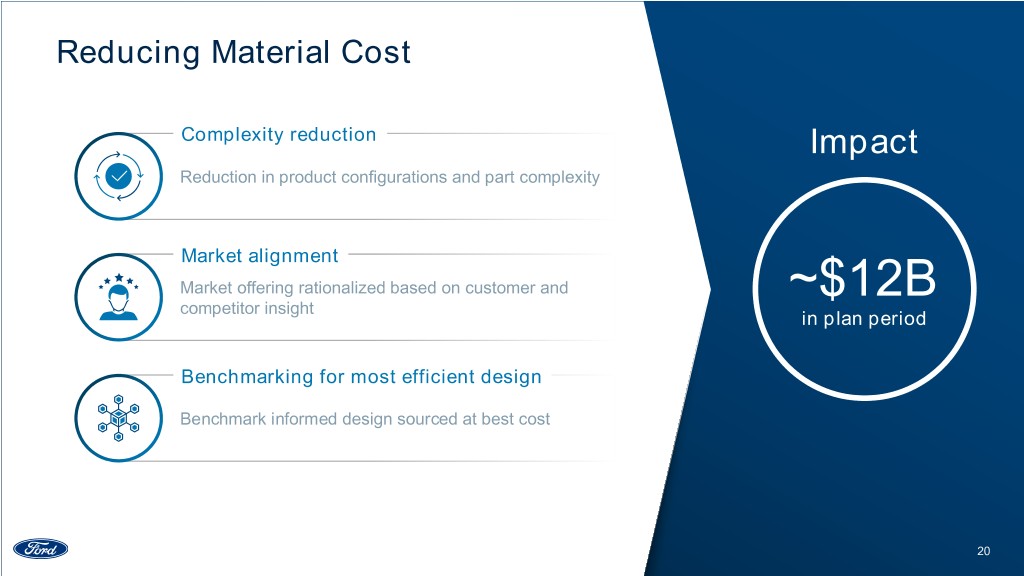
Reducing Material Cost Complexity reduction Impact Reduction in product configurations and part complexity Market alignment Market offering rationalized based on customer and ~$12B competitor insight in plan period Benchmarking for most efficient design Benchmark informed design sourced at best cost 20

Winning Portfolio 21
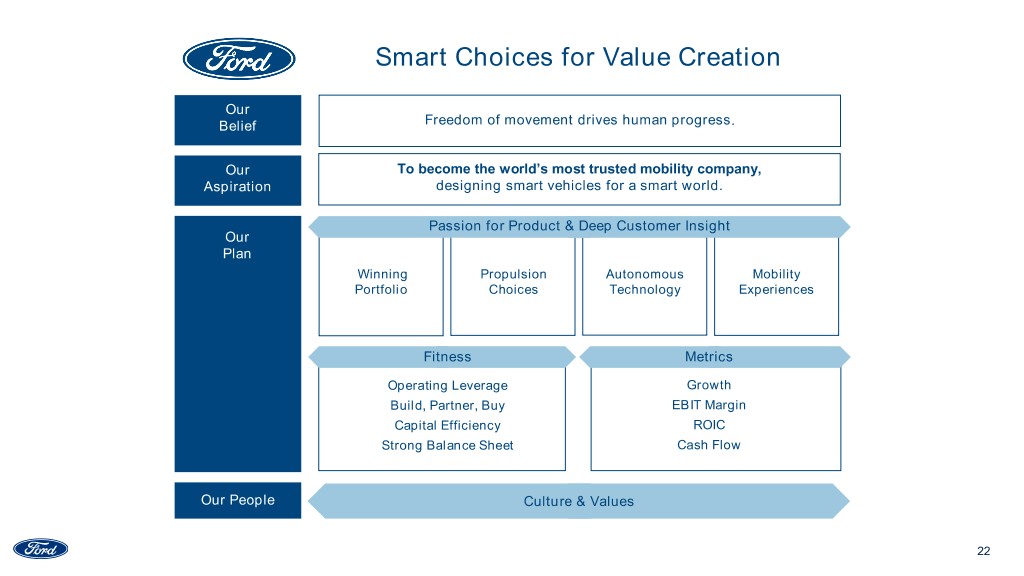
Smart Choices for Value Creation Our Belief Freedom of movement drives human progress. Our To become the world’s most trusted mobility company, Aspiration designing smart vehicles for a smart world. Passion for Product & Deep Customer Insight Our Plan Winning Propulsion Autonomous Mobility Portfolio Choices Technology Experiences Fitness Metrics Operating Leverage Growth Build, Partner, Buy EBIT Margin Capital Efficiency ROIC Strong Balance Sheet Cash Flow Our People Culture & Values 22
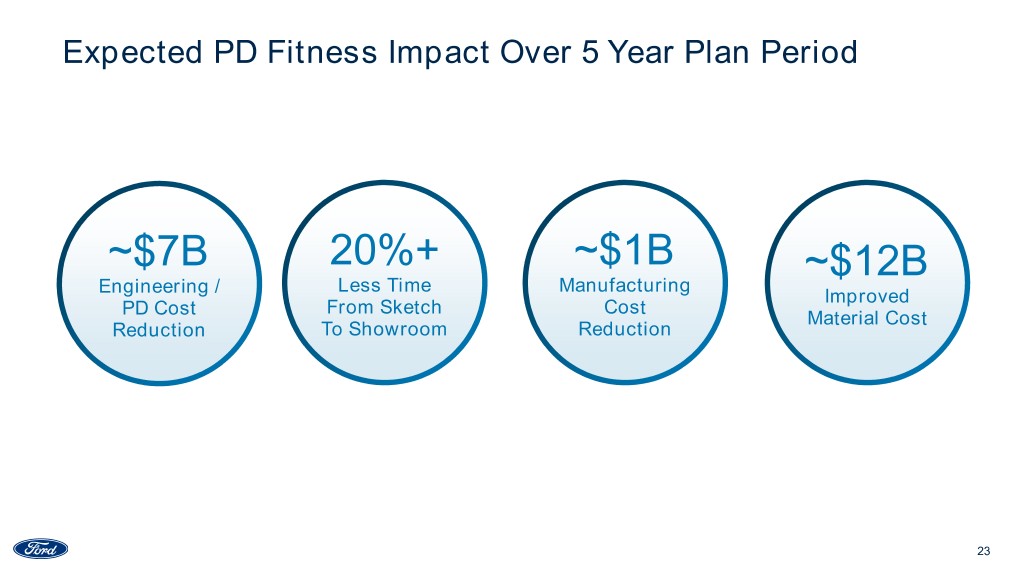
Expected PD Fitness Impact Over 5 Year Plan Period ~$7B 20%+ ~$1B ~$12B Engineering / Less Time Manufacturing Improved PD Cost From Sketch Cost Material Cost Reduction To Showroom Reduction 23
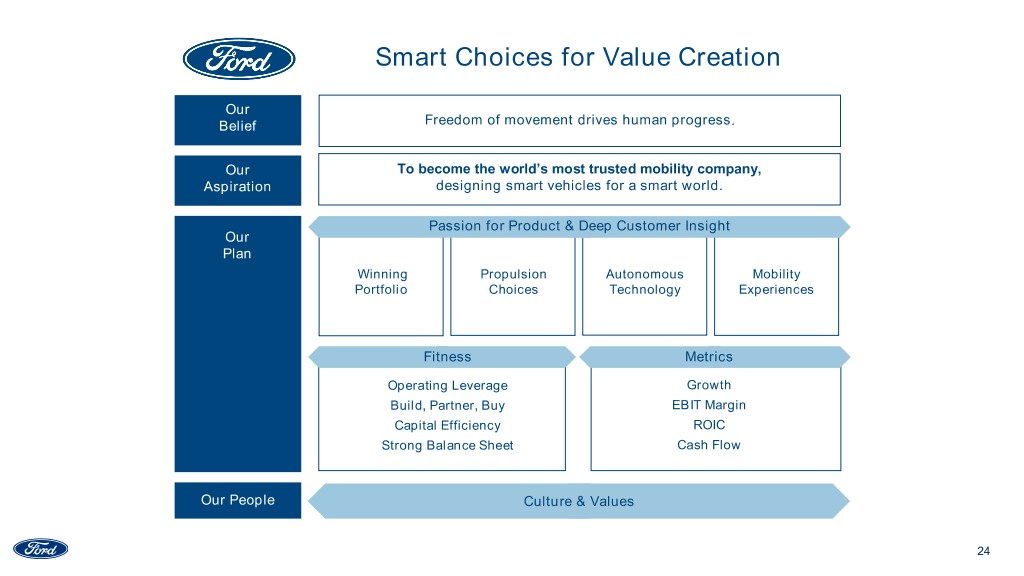
Smart Choices for Value Creation Our Belief Freedom of movement drives human progress. Our To become the world’s most trusted mobility company, Aspiration designing smart vehicles for a smart world. Passion for Product & Deep Customer Insight Our Plan Winning Propulsion Autonomous Mobility Portfolio Choices Technology Experiences Fitness Metrics Operating Leverage Growth Build, Partner, Buy EBIT Margin Capital Efficiency ROIC Strong Balance Sheet Cash Flow Our People Culture & Values 24

Q&A

Cautionary Note On Forward-Looking Statements Statements included or incorporated by reference herein may constitute “forward-looking statements” within the meaning of the Private Securities Litigation Reform Act of 1995. Forward-looking statements are based on expectations, forecasts, and assumptions by our management and involve a number of risks, uncertainties, and other factors that could cause actual results to differ materially from those stated, including, without limitation: • Ford’s long-term competitiveness depends on the successful execution of fitness actions; • Industry sales volume, particularly in the United States, Europe, or China, could decline if there is a financial crisis, recession, or significant geopolitical event; • Ford’s new and existing products and mobility services are subject to market acceptance; • Ford’s results are dependent on sales of larger, more profitable vehicles, particularly in the United States; • Ford may face increased price competition resulting from industry excess capacity, currency fluctuations, or other factors; • Fluctuations in commodity prices, foreign currency exchange rates, and interest rates can have a significant effect on results; • With a global footprint, Ford’s results could be adversely affected by economic, geopolitical, protectionist trade policies, or other events; • Ford’s production, as well as Ford’s suppliers’ production, could be disrupted by labor disputes, natural or man-made disasters, financial distress, production difficulties, or other factors; • Ford’s ability to maintain a competitive cost structure could be affected by labor or other constraints; • Pension and other postretirement liabilities could adversely affect Ford’s liquidity and financial condition; • Economic and demographic experience for pension and other postretirement benefit plans (e.g., discount rates or investment returns) could be worse than Ford has assumed; • Ford’s vehicles could be affected by defects that result in delays in new model launches, recall campaigns, or increased warranty costs; • Safety, emissions, fuel economy, and other regulations affecting Ford may become more stringent; • Ford could experience unusual or significant litigation, governmental investigations, or adverse publicity arising out of alleged defects in products, perceived environmental impacts, or otherwise; • Ford’s receipt of government incentives could be subject to reduction, termination, or clawback; • Operational systems, security systems, and vehicles could be affected by cyber incidents; • Ford Credit’s access to debt, securitization, or derivative markets around the world at competitive rates or in sufficient amounts could be affected by credit rating downgrades, market volatility, market disruption, regulatory requirements, or other factors; • Ford Credit could experience higher-than-expected credit losses, lower-than-anticipated residual values, or higher-than-expected return volumes for leased vehicles; • Ford Credit could face increased competition from banks, financial institutions, or other third parties seeking to increase their share of financing Ford vehicles; and • Ford Credit could be subject to new or increased credit regulations, consumer or data protection regulations, or other regulations. We cannot be certain that any expectation, forecast, or assumption made in preparing forward-looking statements will prove accurate, or that any projection will be realized. It is to be expected that there may be differences between projected and actual results. Our forward-looking statements speak only as of the date of their initial issuance, and we do not undertake any obligation to update or revise publicly any forward-looking statement, whether as a result of new information, future events, or otherwise. For additional discussion, see “Item 1A. Risk Factors” in our Annual Report on Form 10-K for the year ended December 31, 2017, as updated by subsequent Quarterly Reports on Form 10-Q and Current Reports on Form 8-K. 26
