Attached files
| file | filename |
|---|---|
| 8-K - FORM 8-K - CITIZENS & NORTHERN CORP | tv500476_8k.htm |
Exhibit 99.1

August 9, 2018 Boenning & Scattergood Community Bank Conference
Safe Harbor This presentation contains statements which, to the extent that they are not recitations of historical fact may constitute fo rwa rd - looking statements for purposes of the Securities Act of 1933, as amended, and the Securities Exchange Act of 1934, as amended. Such for ward - looking statements may include financial and other projections as well as statements regarding Citizens & Northern Corporation (the “ Cor poration”) that may include future plans, objectives, performance, revenues, growth, profits, operating expenses or the Corporation’s underly ing assumptions. The words “may”, “would”, “should”, “could”, “will”, “likely”, “possibly”, “expect,” “anticipate,” “intend”, “estimate”, “tar get ”, “potentially”, “probably”, “outlook”, “predict”, “contemplate”, “continue”, “strategic”, “objective”, “plan”, “forecast”, “project” and “bel iev e” or other similar words, phrases or concepts may identify forward - looking statements. Persons reading or present at this presentation are cautione d that such statements are only predictions, and that the Corporation’s actual future results or performance may be materially different. Such forward - looking statements involve known and unknown risks and uncertainties. A number of factors, many of which are beyond the Corporation’s control, could cause our actual results, events or developments, or industry results, to be materially differen t f rom any future results, events or developments expressed, implied or anticipated by such forward - looking statements, and so our business and fi nancial condition and results of operations could be materially and adversely affected. Such factors include, among others, that the execution of any mergers with the Corporation may take longer than anticipated o r b e more costly to complete and that the anticipated benefits, including any anticipated cost savings or strategic gains, may be significantl y h arder to achieve or take longer than anticipated or may not be achieved, our need for capital, our ability to control operating costs and expense s, and to manage loan and lease delinquency rates; the credit risks of lending activities and overall quality of the composition of our loan a nd securities portfolio; the impact of economic conditions, consumer and business spending habits, and real estate market conditions on our business and in our market area; changes in the levels of general interest rates, deposit interest rates, or net interest margin and funding sour ces ; changes in banking regulations and policies and the possibility that any banking agency approvals we might require for certain activitie s w ill not be obtained in a timely manner or at all or will be conditioned in a manner that would impair our ability to implement our business plans ; c hanges in accounting policies and practices; the inability of key third - party providers to perform their obligations to us; our ability to attract and retain key personnel; competition in our marketplace; war or terrorist activities; material differences in the actual financial results, co st savings and revenue enhancements associated with our acquisitions; and other factors as described in our securities filings. All forward - loo king statements and information made herein are based on management’s current beliefs and assumptions as of August 9, 2018 and speak only as of that date. The Corporation does not undertake to update forward - looking statements. For a complete discussion of the assumptions, risks and uncertainties related to our business, you are encouraged to review o ur filings with the Securities and Exchange Commission, including our most recent annual report on Form 10 - K, as well as any changes in risk factors that we may identify in our quarterly or other reports subsequently filed with the SEC. 2

Table of Contents • Who We Are……………………………………………..4 - 8 • Current Strategic Focus……………………………9 - 10 • Selected Financial Data………………………….11 - 26 • Investment Considerations…………….……..27 - 28 • Contact Information……………………………………29 • Supplemental Schedule..…..………………..… 30 - 32 3

Citizens & Northern Franchise Overview • Bank holding company with assets of approximately $1.284 billion • Headquarters in Wellsboro, PA • Banking services are provided by its subsidiary, Citizens & Northern Bank, from 26 full service offices in Bradford, Cameron, Lycoming, McKean, Potter, Sullivan and Tioga Counties in Pennsylvania and Steuben County in New York. • Citizens & Northern Bank’s most recently opened location, in Elmira, New York, offers commercial, residential and consumer lending services. • Investment and insurance products are offered through C&N Financial Services Corporation. Trust services are offered by Citizens & Northern Bank through the C&N Trust and Financial Management Group. • Citizens & Northern Corporation common stock trades on the NASDAQ Capital Market Securities under the symbol CZNC. 4

Summary Statistics June 30, 2018 Total Assets $1.284 Billion Net Loans $809.8 Million Total Deposits $1.041 Billion Tangible Common Equity 1 $177.2 Million Tang. Common Equity / Tang. Assets 1 13.93% Tier 1 Leverage Ratio 14.52% Total Risk Based Capital 23.82% NPAs 2 / Assets 1.35% LTM Return on Average Assets 1 1.32% LTM Return on Average Assets, Excluding Net Gains on Securities and Tax Charge 1,3 1.40% LTM Efficiency Ratio 1 60.7% LTM Earnings Per Share 1 $1.36 LTM Earnings Per Share, Excluding Net Gains on Securities and Tax Charge 1,3 $1.44 Tangible Book Value Per Share 1 $14.43 ¹ See calculations of non - U.S. GAAP amounts and ratios, and other ratios, on supplemental schedule ² Defined as non - accrual loans + all loans that are 90 past due + OREO ³ Excludes net gains on securities, net of income tax of 35% in 2017 and 21% in 2018. Also, excludes tax provision recorded in 4 th Qtr 2017 related to reduction in value of deferred tax asset as a result of reduction in corporate income tax rate 4 SOURCE: Company documents 5

Current Footprint 6

Strong Deposit Market Share in Legacy Markets 1 The Elmira, NY Loan Production Office is located in Chemung County, within 20 miles of 2 full - service branch offices 2 Source: FDIC Summary of Deposits, information as of June 30, 2017 County % of CZNC Deposits Market Rank Market Share (%) Number of Branches Total County Deposits ($ Millions) Bradford, PA 35.76% 1 32.53% 7 $1,104 Tioga, PA 28.21% 2 37.32% 6 759 Lycoming, PA 15.22% 7 6.46% 6 2,365 Sullivan, PA 7.67% 1 56.38% 2 136 Potter, PA 5.75% 3 20.50% 1 281 Steuben, NY 4.14% 11 3.78% 2 1,099 Cameron, PA 2.22% 2 31.35% 1 71 McKean, PA 1.04% 7 1.34 % 1 779 Chemung, NY 1 1,040 7
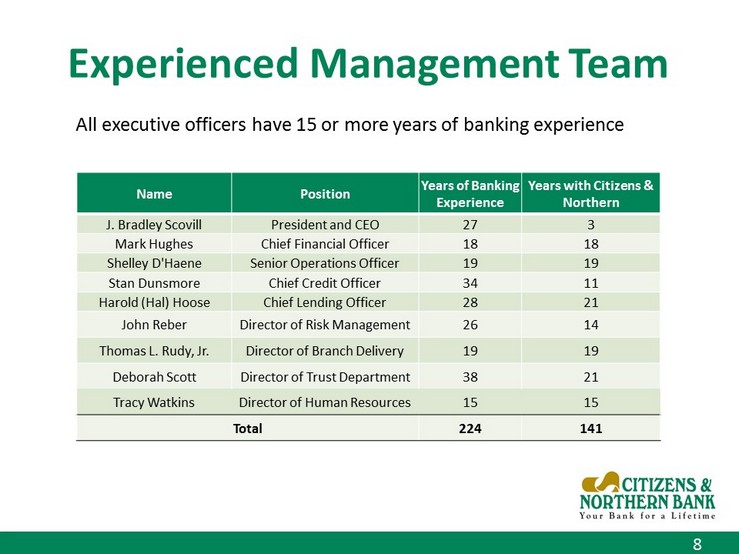
Experienced Management Team All executive officers have 15 or more years of banking experience Name Position Years of Banking Experience Years with Citizens & Northern J. Bradley Scovill President and CEO 27 3 Mark Hughes Chief Financial Officer 18 18 Shelley D'Haene Senior Operations Officer 19 19 Stan Dunsmore Chief Credit Officer 34 11 Harold (Hal) Hoose Chief Lending Officer 28 21 John Reber Director of Risk Management 26 14 Thomas L. Rudy, Jr. Director of Branch Delivery 19 19 Deborah Scott Director of Trust Department 38 21 Tracy Watkins Director of Human Resources 15 15 Total 224 141 8

Current Strategic Focus • Alignment to Drive Growth • Strategic Investments – Development of employees – Sales and Relationship management system – Facilities renovations in targeted locations to accommodate newer technology solutions that many customers desire – Online and mobile solutions • Proactive M&A Strategy – Evaluation of new market opportunities • Target markets • Individuals and/or teams – Focus on preparedness 9

Current Strategic Focus (cont’d) • Capital Deployment – Current dividend yield of 4.18% – Stock buyback program in place, not used since commencement in April 2016 • Risk Management – Continue to strengthen enterprise risk management programs consistent with size and complexity of the company 10

Six Months Ended June 30, 2018 Highlights 11 Earnings Performance (Unaudited) As of or for the six months ended June 30 % Increase/ (Decrease) 2018 2017 Net Income $10,746 $7,555 42.24% Diluted Earnings per Share $0.87 $0.62 40.32% Return on Average Assets (Annualized) 1.70% 1.22% 39.34% Return on Average Equity (Annualized) 11.56% 8.07% 43.25% Balance Sheet Highlights (Unaudited) Total Assets $1,284,007 $1,243,401 3.27% Available - for - Sale Debt Securities 348,044 363,776 - 4.32% Loans (Net) 809,816 771,057 5.03% Allowance for Loan Losses 8,831 8,635 2.27% Deposits 1,040,899 997,262 4.38% Off - Balance Sheet (Unaudited) Trust Assets Under Management $927,089 $894,669 3.62% Outstanding Balance of Mortgage Loans Sold with Servicing Retained 171,543 165,789 3.47% Dollars in thousands, except share data

Six Months Ended June 30, 2018 and 2017 Year over Year Comparisons • Increase in EPS of $0.25, or 40.3% • Increase in net income of $3,191,000, or 42.2% • 2018 results included after - tax gain on a restricted equity security (Visa Class B stock) of $1,382,000 and an after - tax loss on available - for - sale debt securities of $223,000. Net income excluding net gains and losses on securities increased $2,196,000 and EPS increased by $0.17 (27.9%) • Decrease in income tax provision of $240,000 – Effective tax rate of 16.5% as compared to 23.8% last year – Reduction in effective tax rate reflects the impact of reduction in federal corporate income tax rate to 21% from 35%, effective January 1, 2018 – Pre - tax income, excluding gains and losses on securities, increased $1,735,000 (18.0%) 12

Six Months Ended June 30, 2018 and 2017 Year over Year Comparisons (cont’d) • Increase in net interest income (tax equivalent) of $909,000, or 4.2% – Net interest margin of 3.86%, up 0.05%, including increase in annualized yield on average earning assets of 0.07% and increase in annualized rate on average interest - bearing liabilities of 0.03% – Average rate on interest - bearing deposits of 0.42%, up 0.12%, while average rate on borrowed funds decreased to 1.69% from 2.42% last year • Increase in noninterest income, excluding gains and losses on securities, of $1,125,000 (14.1%) – Increase in service charges on deposit accounts of $293,000 (13.2%) – Increase in trust revenue of $271,000 (10.1%) • Increase in noninterest expense of $1,205,000 (6.6%) – Increase in total wages and benefits of $626,000 (6.0%) • Includes increase in average number of FTEs to 295 vs. 290 last year – Increase in total professional fees and data processing of $325,000 • Includes costs associated with new mortgage/consumer loan origination system 13

Commercial 43.1% Consumer 1.9% Residential 54.9% Loan Portfolio Diversification and Yield LOAN PORTFOLIO – as of 6/30/18 Dollars in thousands Amount % of Total Residential mortgage loans - first liens $361,592 44.2% Residential mortgage loans - junior liens 26,594 3.2% Home equity lines of credit 34,852 4.3% 1 - 4 Family residential construction 26,722 3.3% Total Residential Mortgage 449,760 54.9% Commercial loans secured by real estate 159,392 19.5% Commercial and industrial 88,499 10.8% Political subdivisions 56,690 6.9% Commercial construction and land 13,066 1.6% Loans secured by farmland 7,397 0.9% Multi - family (5 or more) residential 7,860 1.0% Agricultural loans 5,622 0.7% Other commercial loans 14,455 1.8% Total Commercial 352,981 43.1% Total Consumer 15,906 1.9% TOTAL $818,647 100.0% Total participation loans¹ $62,949 7.7% ¹ Participation loans are included in the commercial segment in the table above. Source: Company documents 14 Average Loans and Yield Info (Dollars in thousands) YTD June 2018 YTD June 2017 % Increase Taxable $744,292 $700,501 6.3% Tax - Exempt 76,933 64,907 18.5% Average Total Loans $821,225 $765,408 7.3% Annualized Yields²: Taxable 5.09% 4.89% Tax - Exempt 3.69% 4.51% Avg. Yield on Ttl Loans 4.96% 4.86% ² Annualized yields on loans are presented on a fully taxable - equivalent basis, using the Corporation’s marginal tax income tax rate of 21% in 2018 and 35% in 2017. Nonaccrual loans have been included with loans for the purpose of analyzing interest earnings.

Deposit Composition and Cost of Funds Source: Company documents Deposits - as of June 30, 2018 (Amounts in thousands) Amount % of Total Noninterest - bearing demand $248,502 23.9% Interest c hecking 215,808 20.7% Savings and money market 337,022 32.4% Time deposits of less than $250,000 207,195 19.9% Time deposits of $250,000 or more 32,372 3.1% Total deposits $1,040,899 100.0% Time deposits of less than $250,000 19.9% Time deposits of $250,000 or more 3.1% Noninterest - bearing Demand 23.9% Interest checking 20.7% Savings and money market 32.4% 15 Average Deposits and Cost of Funds Information (Amounts in thousands) YTD June 2018 YTD June 2017 % Increase Noninterest - bearing demand $242,093 $225,127 7.5% Interest - bearing 771,020 748,513 3.0% Average Total Deposits $1,013,113 $973,640 4.1% Avg rate on interest - bearing deposits¹ 0.42% 0.30% Average rate on total deposits¹ 0.32% 0.23% ¹ Average rates are annualized
Wealth Management Division • Largest locally - based wealth management department with integrated broker/dealer and insurance sales • Team comprised of over 30 professionals • $927m in Trust assets under management at 6/30/18 • Trust and brokerage revenues totaled $3.4m YTD June 30, 2018, or 10.8% of total taxable equivalent revenues excluding securities gains and losses • Trust and brokerage revenues totaled $6.2m in 2017, or 10.2% of total taxable equivalent revenues excluding securities gains and losses 16

Service Charges, Interchange & Other Fees 43% Trust, Brokerage & Insurance Revenue 38% Other Non Interest Income 19% Noninterest Income Diversified Noninterest Income Noninterest Income 29% Net Interest Income (Tax Equivalent) 71% Six Months Ended June 30, 2018 Source: Company records – Six months ended June 30, 2018 unaudited financial information. See supplemental schedule detailing the components of noninterest income and total revenue. 17

Very Strong Capital Position High capital positions us for growth – organically and by entry into new markets via acquisition or other means June 30, 2018 Actual Data ¹ See calculation of non - U.S. GAAP ratio on supplemental schedule. ² Source: Company documents 13.9% 14.5% 22.7% 23.8% 0.00% 5.00% 10.00% 15.00% 20.00% 25.00% TCE/TA¹ Tier 1 Leverage Tier 1 RBC Total RBC Basel III Requirements plus Capital Conservation Buffer Total RBC Ratio 10.5 Tier 1 Ratio 8.5 CET 1 Ratio 7.0 18
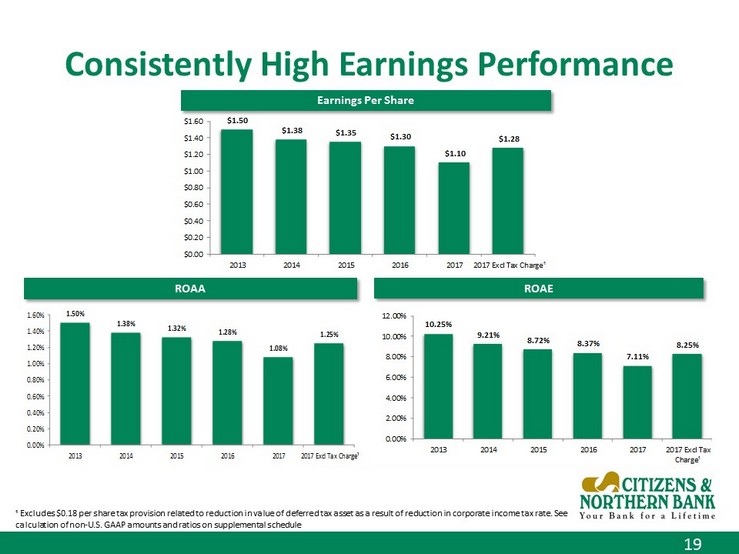
$1.50 $1.38 $1.35 $1.30 $1.10 $1.28 $0.00 $0.20 $0.40 $0.60 $0.80 $1.00 $1.20 $1.40 $1.60 2013 2014 2015 2016 2017 2017 Excl Tax Charge¹ Consistently High Earnings Performance Earnings Per Share 1.50% 1.38% 1.32% 1.28% 1.08% 1.25% 0.00% 0.20% 0.40% 0.60% 0.80% 1.00% 1.20% 1.40% 1.60% 2013 2014 2015 2016 2017 2017 Excl Tax Charge¹ ROAE ROAA 10.25% 9.21% 8.72% 8.37% 7.11% 8.25% 0.00% 2.00% 4.00% 6.00% 8.00% 10.00% 12.00% 2013 2014 2015 2016 2017 2017 Excl Tax Charge¹ ¹ Excludes $0.18 per share tax provision related to reduction in value of deferred tax asset as a result of reduction in corp ora te income tax rate. See calculation of non - U.S. GAAP amounts and ratios on supplemental schedule 19

Peer Group Comparison: Return on Assets (1) BHC Peer Group: Bank Holding Companies in Philadelphia Federal Reserve District with consolidated assets $1B - $3B at March 31, 20 18 (2) Source: Bank Holding Company Performance Report March 31, 2018 – FR BHCPR 20 1.38% 1.33% 1.29% 1.08% 1.38% 0.91% 0.92% 0.92% 0.86% 1.07% 0.00% 0.50% 1.00% 1.50% YE 2014 YE 2015 YE 2016 YE 2017 Q1 2018 Return on Average Assets CZNC BHC Peer Group 2.09% 2.00% 1.95% 1.87% 1.72% 1.27% 1.31% 1.31% 1.38% 1.36% 0.00% 0.50% 1.00% 1.50% 2.00% 2.50% YE 2014 YE 2015 YE 2016 YE 2017 Q1 2018 Pre - Tax Income (Tax Equivalent) - % of Average Assets CZNC BHC Peer Group

Peer Group Comparison: Net Interest Income (Tax Equivalent) - % of Average Assets (1) BHC Peer Group: Bank Holding Companies in Philadelphia Federal Reserve District with consolidated assets $1B - $3B at March 31, 20 18 (2) Source: Bank Holding Company Performance Report March 31, 2018 – FR BHCPR 21 3.55% 3.46% 3.52% 3.58% 3.54% 3.37% 3.33% 3.33% 3.41% 3.42% 3.20% 3.25% 3.30% 3.35% 3.40% 3.45% 3.50% 3.55% 3.60% YE 2014 YE 2015 YE 2016 YE 2017 Q1 2018 CZNC BHC Peer Group

Peer Group Comparison: Interest Expense as % of Interest - bearing Deposits 22 0.28% 0.26% 0.28% 0.32% 0.38% 0.43% 0.41% 0.44% 0.53% 0.61% 0.00% 0.10% 0.20% 0.30% 0.40% 0.50% 0.60% 0.70% YE 2014 YE 2015 YE 2016 YE 2017 Q1 2018 CZNC BHC Peer Group (1) BHC Peer Group: Bank Holding Companies in Philadelphia Federal Reserve District with consolidated assets $1B - $3B at March 31, 20 18 (2) Source: Bank Holding Company Performance Report March 31, 2018 – FR BHCPR

Peer Group Comparison: Loan Growth & Credit Quality (1) BHC Peer Group: Bank Holding Companies in Philadelphia Federal Reserve District with consolidated assets $1B - $3B at March 31, 20 18 (2) Source: Bank Holding Company Performance Report March 31, 2018 – FR BHCPR 23 - 1.96% 11.88% 6.63% 8.62% 7.31% 12.43% 11.46% 9.80% 9.85% 9.56% -5.00% 0.00% 5.00% 10.00% 15.00% YE 2014 YE 2015 YE 2016 YE 2017 Q1 2018 Net Loans – Growth Rate CZNC BHC Peer Group 2.18% 1.81% 1.45% 1.83% 1.79% 1.46% 1.14% 1.00% 0.80% 0.79% 0.00% 0.50% 1.00% 1.50% 2.00% 2.50% YE 2013 YE 2014 YE 2015 YE 2016 Q1 2018 Nonaccrual Loans + OREO/Total Loans + OREO CZNC BHC Peer Group 0.29% 0.04% 0.09% 0.05% 0.05% 0.15% 0.09% 0.10% 0.10% 0.05% 0.00% 0.10% 0.20% 0.30% 0.40% YE 2014 YE 2015 YE 2016 YE 2017 Q1 2018 Net Loan Charge - offs as a % of Average Loans CZNC BHC Peer Group

Peer Group Comparison: Noninterest Revenue & Expense Data (1) BHC Peer Group: Bank Holding Companies in Philadelphia Federal Reserve District with consolidated assets $1B - $3B at March 31, 20 18 (2) Source: Bank Holding Company Performance Report March 31, 2018 – FR BHCPR 24 1.26% 1.25% 1.26% 1.28% 1.41% 0.93% 0.93% 0.91% 0.86% 0.84% 0.00% 0.50% 1.00% 1.50% YE 2014 YE 2015 YE 2016 YE 2017 Q1 2018 Noninterest Income as a % of Average Assets CZNC BHC Peer Group 2.77% 2.88% 2.83% 2.95% 3.13% 3.05% 2.95% 2.89% 2.83% 2.85% 2.40% 2.60% 2.80% 3.00% 3.20% YE 2014 YE 2015 YE 2016 YE 2017 Q1 2018 Noninterest Expense as a % of Average Assets CZNC BHC Peer Group 57.68% 61.08% 59.19% 60.65% 63.31% 69.80% 68.59% 67.14% 65.61% 66.15% 0.00% 20.00% 40.00% 60.00% 80.00% YE 2014 YE 2015 YE 2016 YE 2017 Q1 2018 Efficiency Ratio (Tax Equivalent) CZNC BHC Peer Group

Strategic Investments • People – Modest increase in personnel to support growth and advancement – mainly lending, lending support, HR & training, marketing – Increased spending in employee development and training – Health insurance expense has increased due to higher claims on partially self - insured plan 25 Personnel As of 12/31 # of FTEs 2012 292 2013 287 2014 278 2015 283 2016 291 2017 296 6/30/2018 296 Health Insurance Expense Year Expense 2013 $1.2m 2014 $1.7m 2015 $1.3m 2016 $1.5m 2017 $2.1m

Strategic Investments (cont’d) • Infrastructure & Technology – Capital expenditures increased to support 2 office renovations, acquisition of Elmira property, new phone system, interactive teller machines and upgrades to IT network, data storage and disaster recovery systems – Expenses for software purchased as a service, professional fees and training – including marketing - related systems, document imaging and mortgage/consumer loan origination system • Targeted Professional Services Engagements – Payments growth initiative to increase debit card revenue • Interchange revenue from debit card transactions increased $278,000, or 14.3%, in 2017 over 2016 • YTD June 30, 2018 interchange revenue from debit card transactions increased $132,000, or 12.1%, over the six months ended June 30, 2017 – Refresh of Overdraft Privilege Program resulting in increased income of $295,000 in the first six months of 2018 vs. the first six months of 2017, review and refinement of program compliance monitoring 26
Investment Considerations • Leading deposit market share among community banks in North Central Pennsylvania • Experienced senior leadership team • Consistently high earnings performance, with diverse revenue sources • Very strong capital position • Well - established core deposit franchise with noninterest - bearing checking of approximately 24% of average total deposits in the first six months of 2018 creating a low cost of total deposits of 0.32% • Significant loan growth in 2015 - 2017 • Disciplined credit culture and risk management profile • Opportunity for growth in existing and new markets organically and through market dislocation 27
Investment Considerations (cont’d) • Well - established trust and financial management team • Quarterly dividends declared of $0.27 per share in each of the first 3 quarters of 2018, resulting in an annualized yield of 4.18% based on market data as of 6/30/2018 1 • Attractive currency with valuation of 16x most recent Street estimate 2 ¹Source: NASDAQ.com ²Stock price based on closing price on June 30, 2018. 28

Contact Information President and CEO Brad Scovill BradleyS@cnbankpa.com 570 - 723 - 2102 Treasurer and CFO Mark Hughes MarkH@cnbankpa.com 570 - 724 - 8533 29 Online www.cnbankpa.com www.cntrustpa.com

Supplemental Schedule Reconcilements and Non - U.S. GAAP Information This presentation contains financial information determined by methods other than accounting principles generally accepted in th e United States (“U.S. GAAP”). The Company’s management believes that these non - U.S. GAAP measures provide a greater understanding of ong oing operations, enhance comparability of results of operations with prior periods and show the effects of significant gains and c har ges in the periods presented. The Company’s management believes that investors may use these non - U.S. GAAP measures to analyze the Company’ s financial performance without the impact of unusual items or events that may obscure trends in the Company’s underlying perfo rma nce. Further, the Company’s management believes tangible book value per common share and tangible common equity as a percentage of tangible assets, which are non - U.S. GAAP ratios, provide information that is helpful in evaluating the strength of the Company’s capital and in providing an alternative, conservative valuation of the Company’s net worth. This non - U.S. GAAP data should be considered in add ition to information prepared in accordance with U.S. GAAP, and is not a substitute for, or superior to, U.S. GAAP information. 30 Tangible Common Equity/Tangible Assets (Dollars in thousands, except per share data) June 30, 2018 Total Assets $1,284,007 Less: Intangible Assets, Primarily Goodwill (11,952) Tangible Assets $1,272,055 Total Shareholders' Equity $189,179 Less: Intangible Assets, Primarily Goodwill (11,952) Tangible Common Equity $177,227 Tangible Common Equity as a % of Tangible Assets (TCE/TA) 13.93% Common Shares Outstanding, End of Period 12,280,538 Tangible Common Book Value per Share $14.43 LTM Return on Average Assets (Dollars in thousands) 3rd Q 4th Q 1st Q 2nd Q 2017 2017 2018 2018 LTM Average assets $1,253,220 $1,260,554 $1,257,704 $1,269,179 $1,260,164 (Average) Net income $3,936 $1,943 $4,375 $6,371 $16,625 ROAA - Annualized 1.26% 0.62% 1.39% 2.01% 1.32% LTM Return on Average Assets - Excluding Net Gains on Securities and Tax Charge Average assets $1,253,220 $1,260,554 $1,257,704 $1,269,179 $1,260,164 (Average) Net income, as reported $3,936 $1,943 $4,375 $6,371 $16,625 Less net gains on securities, net of income tax at 35% in 2017 and 21% in 2018 (3) (1,159) (1,162) Additional income tax provision resulting from change in tax rate 2,159 2,159 Net income, excluding net gains on securities and additional tax charge $3,933 $4,102 $4,375 $5,212 $17,622 Annualized ROAA, excluding net gains on securities and additional tax provision resulting from change in tax rate 1.26% 1.30% 1.39% 1.64% 1.40%

Supplemental Schedule (cont’d) 31 LTM Efficiency Ratio (Amounts in thousands) 3rd Q 4th Q 1st Q 2nd Q 2017 2017 2018 2018 LTM Total noninterest expenses (a) $9,192 $9,401 $9,895 $9,684 $38,172 Net interest income, FTE $11,337 $11,468 $11,226 $11,586 $45,617 Total noninterest income * 4,066 4,117 4,406 4,689 17,278 Total revenue (b) $15,403 $15,585 $15,632 $16,275 $62,895 Efficiency Ratio (a) / (b) 59.68% 60.32% 63.30% 59.50% 60.69% * Total noninterest income amounts exclude gains and losses on securities LTM EPS (In thousands, except share and per share amounts) 3rd Q 4th Q 1st Q 2nd Q 2017 2017 2018 2018 LTM EPS - Diluted $0.32 $0.16 $0.36 $0.52 $1.36 LTM EPS - Excluding Net Gains on Securities and Tax Charge Net income, as reported $3,936 $1,943 $4,375 $6,371 $16,625 Less net gains on securities, net of income tax at 35% in 2017 and 21% in 2018 (3) (1,159) (1,162) Additional income tax provision resulting from change in tax rate 2,159 2,159 Net income, excluding additional tax charge $3,933 $4,102 $4,375 $5,212 $17,622 Weighted average common shares outstanding - diluted 12,162,263 12,178,853 12,222,256 12,248,145 12,202,879 (Average) EPS, excluding net gains on securities and additional tax provision resulting from change in tax rate $0.32 $0.34 $0.36 $0.43 $1.44 Noninterest Income * - Six Months Ended June 30, 2018 (Dollars in thousands) Six Months Ended % of Total June 30, Noninterest 2018 Income Service charges on deposit accounts $2,506 27.6% Interchange revenue from debit card transactions 1,220 13.4% Other service charges and fees 168 1.8% Total Service Charges, Interchange & Other Fees 3,894 42.8% Trust and financial management revenue 2,948 32.4% Brokerage revenue 483 5.3% Insurance commissions, fees and premiums 57 0.6% Total Trust, Brokerage & Insurance Revenue 3,488 38.4% Net gains from sale of loans 350 3.8% Loan servicing fees, net 189 2.1% Increase in cash surrender value of life insurance 195 2.1% Other noninterest income 979 10.8% Total Other Noninterest Income 1,713 18.8% Total noninterest income * $9,095 100.0% Six Months Ended % of Total Revenue - Six Months Ended June 30, 2018 June 30, Noninterest (Dollars in thousands) 2018 Income Net interest income (tax equivalent) $22,812 71.5% Noninterest income * 9,095 28.5% Total revenue $31,907 100.0%

Supplemental Schedule (cont’d) 32 2017 Return on Average Assets (Amounts in thousands) Average assets $1,247,759 Net income $13,434 ROAA 1.08% 2017 Return on Average Assets - Excluding Tax Charge Average assets $1,247,759 Net income, as reported $13,434 Additional income tax provision resulting from change in tax rate 2,159 Net income, excluding additional tax charge $15,593 ROAA, excluding additional tax provision resulting from change in tax rate 1.25% 2017 Return on Average Equity (Amounts in thousands) Average equity $188,958 Net income $13,434 ROAE 7.11% 2017 Return on Average Equity - Excluding Tax Charge Average equity $188,958 Net income, as reported $13,434 Additional income tax provision resulting from change in tax rate 2,159 Net income, excluding additional tax charge $15,593 ROAE, excluding additional tax provision resulting from change in tax rate 8.25%