Attached files
| file | filename |
|---|---|
| 8-K - 8-K - ACNB CORP | a18-18377_18k.htm |
ACNB Corporation ACNB Corporation 16 Lincoln Square, P.O. Box 3129 Gettysburg PA 17325 717-331-3161 / 888-334-2262 www.acnb.com August 8, 2018 ACNB Listed: Nasdaq
During the course of this presentation, there may be projections and forward-looking statements regarding events or the future financial performance of ACNB Corporation. We wish to caution you that these forward-looking statements involve certain risks and uncertainties, including a variety of factors that may cause actual results to differ materially from the anticipated results expressed in these forward-looking statements. ACNB Corporation assumes no duty to update the forward-looking statements made in this presentation. You are encouraged to review the risk factors and other cautionary statements regarding forward-looking information described in other documents ACNB Corporation files from time to time with the Securities and Exchange Commission including the Annual Reports on Form 10-K, Quarterly Reports on Form 10-Q, and any Current Reports on Form 8-K. Special Cautionary Notice Regarding Forward-Looking Statements
Presenters Jim Helt, President & CEO Dave Cathell, EVP Chief Financial Officer Laurie Laub, EVP Chief Credit & Operations Officer Tom Rasmussen, EVP Market President
Company Profile Headquartered in Gettysburg, PA Stock Symbol: ACNB (Nasdaq) Market includes South Central Pennsylvania (Franklin, Cumberland, Adams, and York counties) and Central Maryland 29 locations in Pennsylvania and Maryland 14 locations in Adams 6 locations in York 2 locations in Franklin 1 locations in Cumberland 7 locations in Carroll, MD Market Capitalization ~$240mm Russell Insurance Group, Inc. agency subsidiary Wealth Management Division
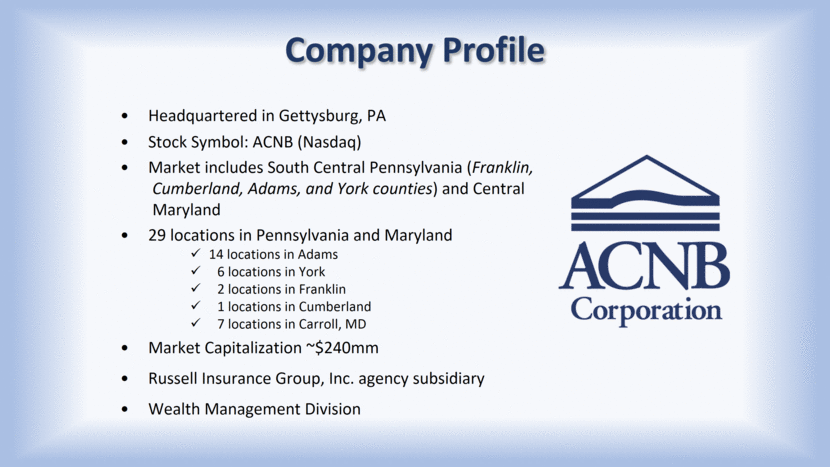
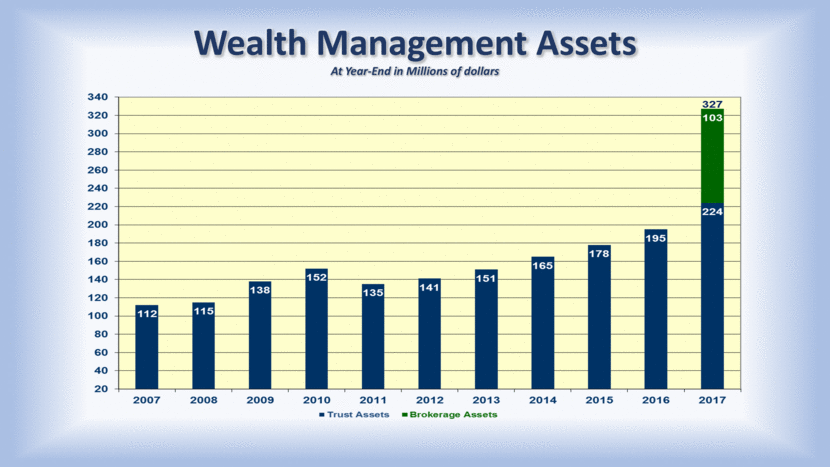
Founded in 1857, the largest independent financial institution headquartered in Adams County, PA. Rank among top 15 banks headquartered in Pennsylvania by asset size. $1.62 billion in total assets* $1.25 billion in total loans* $1.33 billion in total deposits* $333 million in wealth management assets* Russell Insurance Group, Inc. subsidiary is a $40 million Gross Commission agency & exceeds $5.0 million in revenue. Voted #1 Bank for the sixth consecutive year in the Gettysburg Times Pick of the County annual award. Named to Central Penn Business Journal’s list of the Top 50 Fastest Growing Companies in Central Pennsylvania for 2018. * As of June 30, 2018 Our Organization Today
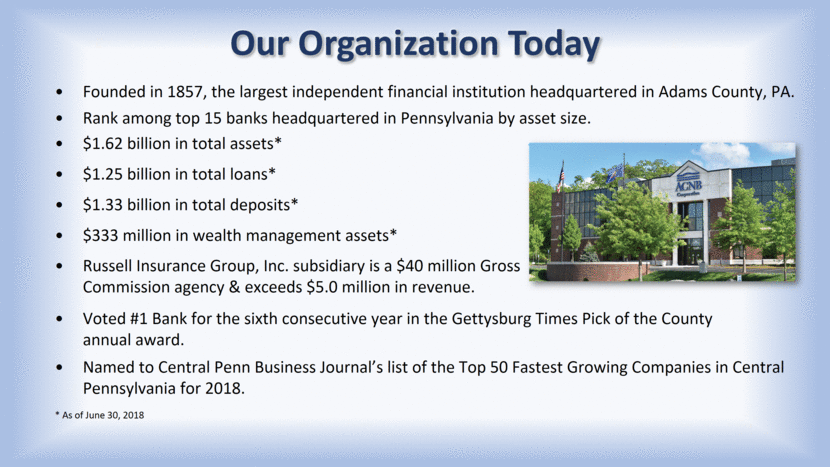
ACNB Executive Management Name/Title Banking Experience Joined ACNB Bank Experience/Disciplines Prior Experience James P. Helt President & CEO 29 Years 2008 Strategy, Sales, Lending, Credit, Executive FB&T, Financial Trust, CMTY, SUSQ David W. Cathell EVP/Treasurer & CFO 40 Years 2005 Finance, Treasury, Strategy, Executive Garret National Bank, WM Bancorp, Keystone Financial, Fulton County National Bank, PA State Bank Lynda L. Glass EVP/Secretary and Chief Risk & Governance Officer 36 Years 1984 Risk, Governance, Strategy, Executive Meridian Laurie A. Laub EVP/Chief Credit & Operations Officer 18 Years 2005 Credit, Risk, Operations, Technology, Executive Waypoint, Sovereign Tom N. Rasmussen EVP/Market President 34 Years 2017 Strategy, Lending, Operations, Executive FCNB Bank, New Windsor State Bank Douglas A. Seibel EVP/Chief Lending & Revenue Officer 36 Years 2008 Lending, Sales, Credit, Executive FB&T, Meridian, Allfirst, M&T, CMTY, SUSQ Thomas R. Stone EVP/Chief Community Banking Officer 37 Years 2009 Retail, Facilities, Marketing, Human Resources, Executive York Bank & Trust Co., Allfirst, M&T, CMTY, SUSQ
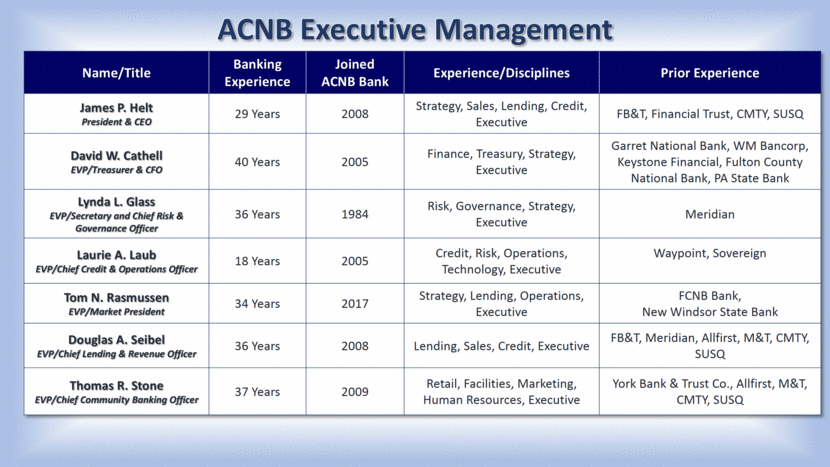
Ranked #1 in Adams County market area with deposit market share of 53.55%*. ACNB Bank has the #1 deposit market share in 6 out of 13 defined market areas in PA*. Gettysburg Carroll Valley Upper Adams East Berlin McSherrystown Newville NWSB has posted 3-year and 5-year growth rates of 20.91% and 17.95% respectively. Solid historical loan growth 2012 – 2017 (organic) = 38.5% 2017 (organic) = 8% 2017 (total) = 37% * According to the June 30, 2017 FDIC Deposit Market Share Report Market Overview
Focused On Prudent Growth Through Both Organic And Inorganic Strategies Organic Strategies: Acquisition of top tier and experienced HR talent due to market disruption. Focused on balance sheet growth driven by loan growth via commercial lending. Expansion into new markets Loan Production Offices (Hunt Valley, MD) Full Service Offices Wealth Management Division Trust and Fiduciary Services (~$223M assets under management) Retail Brokerage Services (~$110M assets under management) Russell Insurance Agency Growth Opportunities
Focused On Prudent Growth Through Both Organic And Inorganic Strategies Inorganic Strategies: Strategically positioned in one of the fast growing regions along the East Coast, within a short drive of Baltimore, Philadelphia, and Washington, D.C. The southcentral PA and northern MD markets are home to a diverse mix of businesses and industries. Expansion into new markets based on strong demographics and the enhancement of long-term shareholder value. Growth Markets Franklin and York in PA & Frederick and Baltimore in MD Strategic Fit Cultural Fit Earnings Growth Opportunity Expense Savings Growth Opportunities
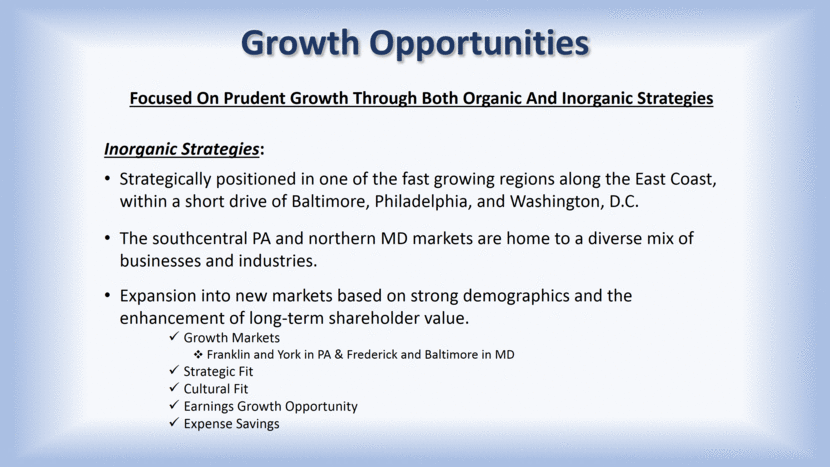
One Stop Financial Marketplace Traditional Loan and Deposit Products Trust and Retail Investments Insurance Products The Successful Community Bank of the Future
Well established South Central Pennsylvania Community Bank. Experienced Management Team with strong operational ability. Financial performance historically above peers. Strategic plans in place to drive core earnings growth. Well positioned for future growth throughout market. Long-term investment focus centered on generating shareholder value via efficient capital management. Investment Considerations ACNB Corporation (ACNB) Total Assets = $1.62B Market Cap of ~$240M
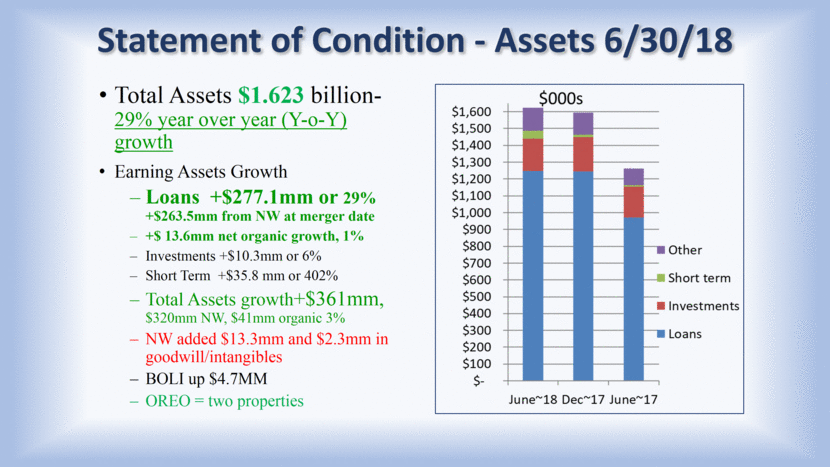
Statement of Condition - Assets 6/30/18 Total Assets $1.623 billion- 29% year over year (Y-o-Y) growth Earning Assets Growth Loans +$277.1mm or 29% +$263.5mm from NW at merger date +$ 13.6mm net organic growth, 1% Investments +$10.3mm or 6% Short Term +$35.8 mm or 402% Total Assets growth+$361mm, $320mm NW, $41mm organic 3% NW added $13.3mm and $2.3mm in goodwill/intangibles BOLI up $4.7MM OREO = two properties
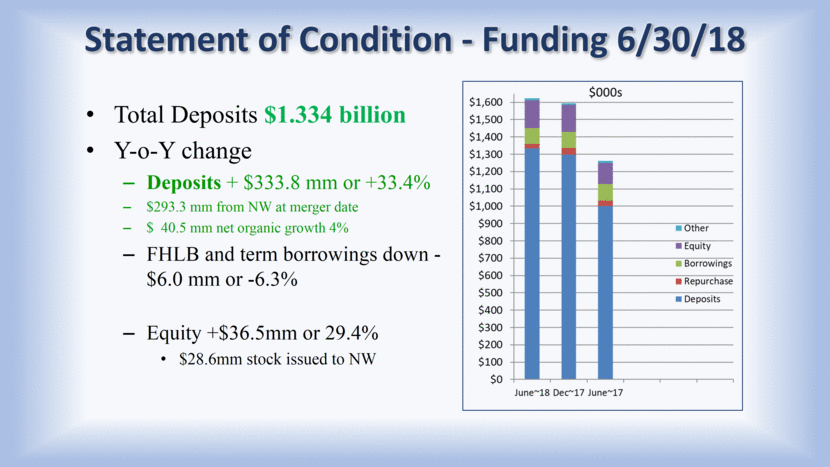
Statement of Condition - Funding 6/30/18 Total Deposits $1.334 billion Y-o-Y change Deposits + $333.8 mm or +33.4% $293.3 mm from NW at merger date $ 40.5 mm net organic growth 4% FHLB and term borrowings down -$6.0 mm or -6.3% Equity +$36.5mm or 29.4% $28.6mm stock issued to NW
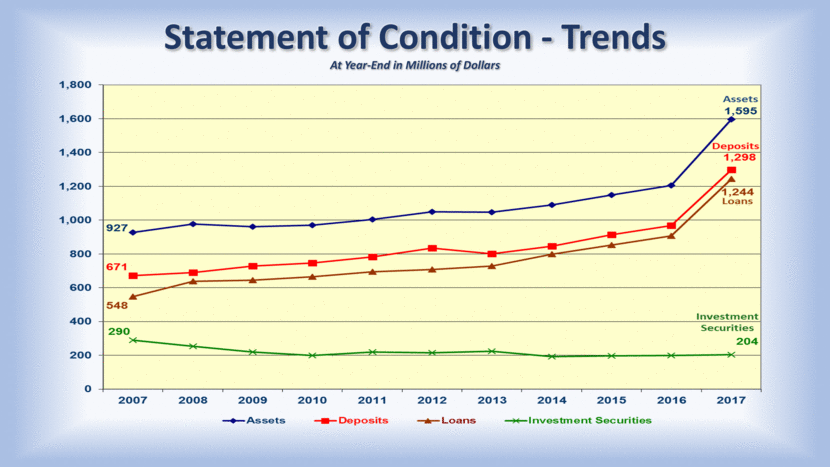
Statement of Condition - Trends At Year-End in Millions of Dollars
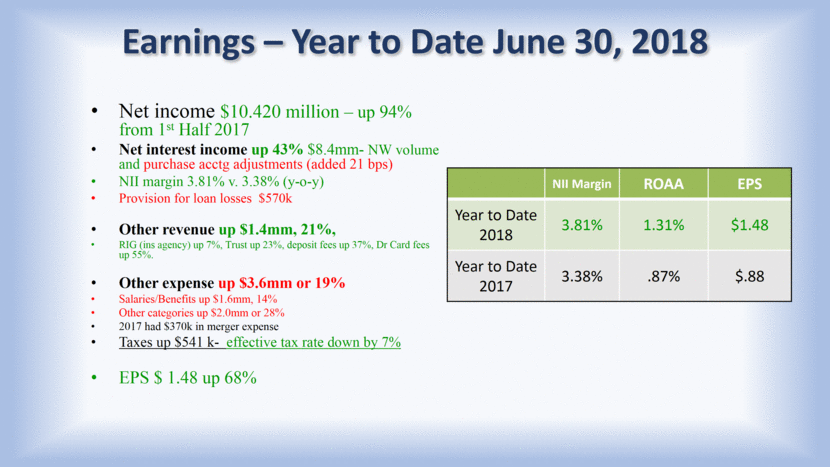
Earnings – Year to Date June 30, 2018 NII Margin ROAA EPS Year to Date 2018 3.81% 1.31% $1.48 Year to Date 2017 3.38% .87% $.88 Net income $10.420 million – up 94% from 1st Half 2017 Net interest income up 43% $8.4mm- NW volume and purchase acctg adjustments (added 21 bps) NII margin 3.81% v. 3.38% (y-o-y) Provision for loan losses $570k Other revenue up $1.4mm, 21%, RIG (ins agency) up 7%, Trust up 23%, deposit fees up 37%, Dr Card fees up 55%. Other expense up $3.6mm or 19% Salaries/Benefits up $1.6mm, 14% Other categories up $2.0mm or 28% 2017 had $370k in merger expense Taxes up $541 k- effective tax rate down by 7% EPS $ 1.48 up 68%
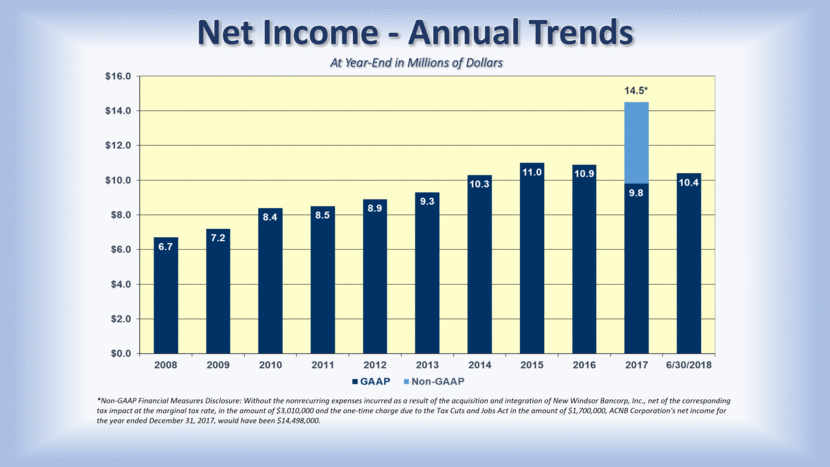
Net Income - Annual Trends At Year-End in Millions of Dollars *Non-GAAP Financial Measures Disclosure: Without the nonrecurring expenses incurred as a result of the acquisition and integration of New Windsor Bancorp, Inc., net of the corresponding tax impact at the marginal tax rate, in the amount of $3,010,000 and the one-time charge due to the Tax Cuts and Jobs Act in the amount of $1,700,000, ACNB Corporation's net income for the year ended December 31, 2017, would have been $14,498,000. 14.5*
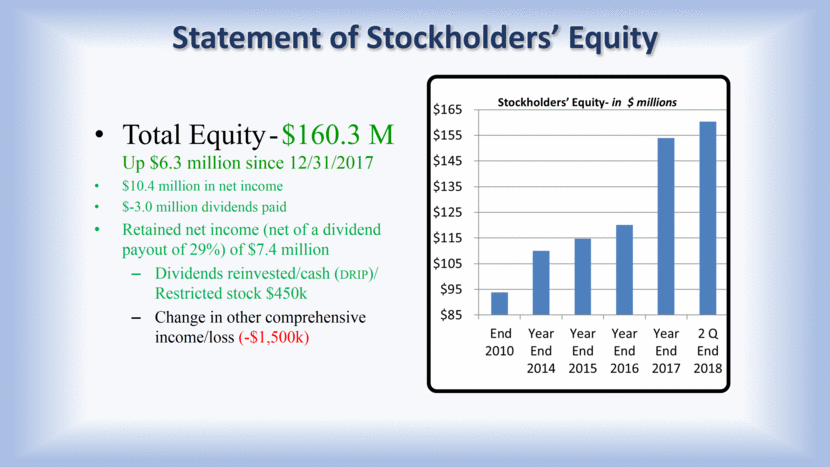
Statement of Stockholders’ Equity Total Equity - $160.3 M Up $6.3 million since 12/31/2017 $10.4 million in net income $-3.0 million dividends paid Retained net income (net of a dividend payout of 29%) of $7.4 million Dividends reinvested/cash (DRIP)/ Restricted stock $450k Change in other comprehensive income/loss (-$1,500k)
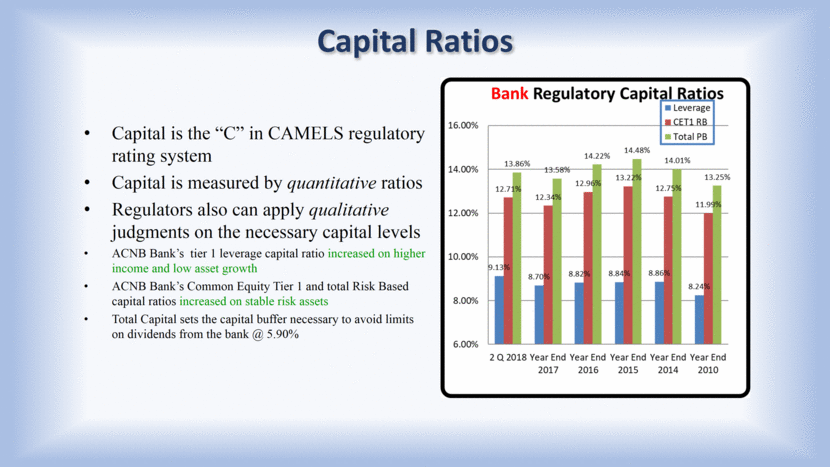
Capital Ratios Capital is the “C” in CAMELS regulatory rating system Capital is measured by quantitative ratios Regulators also can apply qualitative judgments on the necessary capital levels ACNB Bank’s tier 1 leverage capital ratio increased on higher income and low asset growth ACNB Bank’s Common Equity Tier 1 and total Risk Based capital ratios increased on stable risk assets Total Capital sets the capital buffer necessary to avoid limits on dividends from the bank @ 5.90%
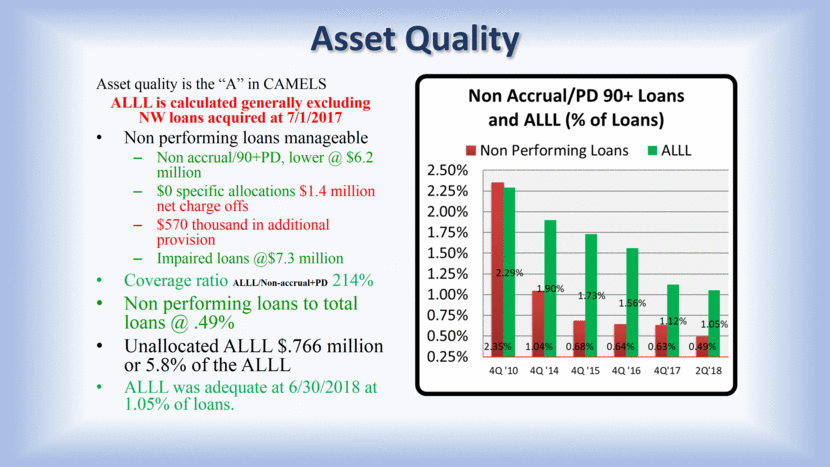
Asset Quality Asset quality is the “A” in CAMELS ALLL is calculated generally excluding NW loans acquired at 7/1/2017 Non performing loans manageable Non accrual/90+PD, lower @ $6.2 million $0 specific allocations $1.4 million net charge offs $570 thousand in additional provision Impaired loans @$7.3 million Coverage ratio ALLL/Non-accrual+PD 214% Non performing loans to total loans @ .49% Unallocated ALLL $.766 million or 5.8% of the ALLL ALLL was adequate at 6/30/2018 at 1.05% of loans.
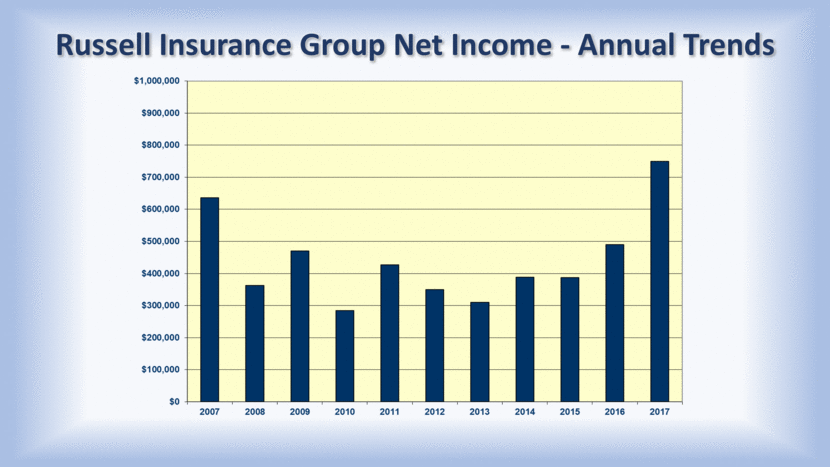
Russell Insurance Group Net Income - Annual Trends
Wealth Management Assets At Year-End in Millions of dollars
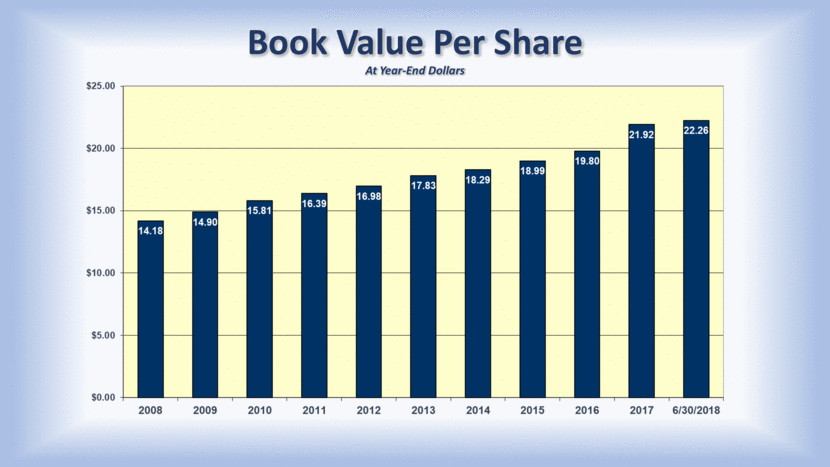
Book Value Per Share At Year-End Dollars
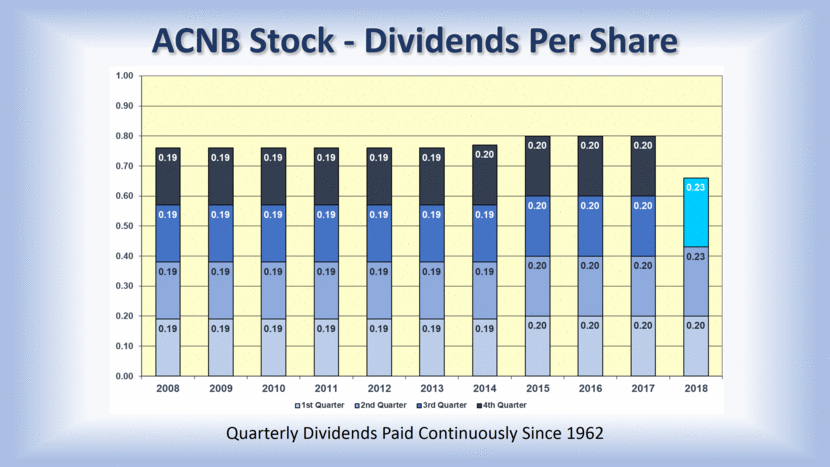
ACNB Stock - Dividends Per Share Quarterly Dividends Paid Continuously Since 1962
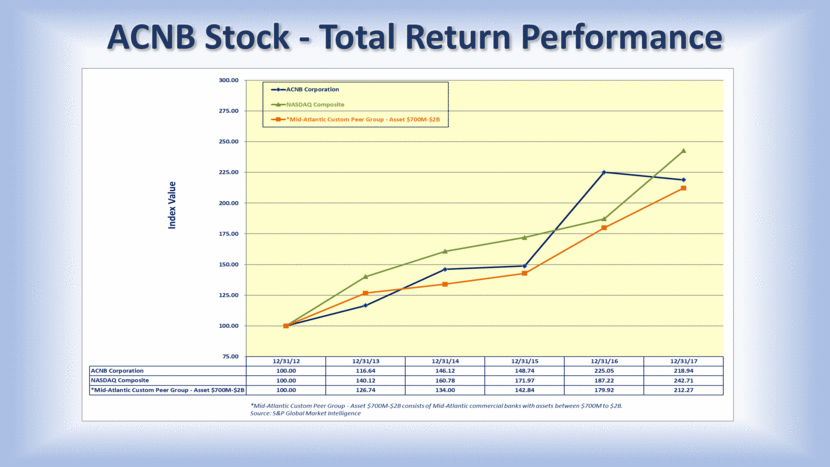
ACNB Stock - Total Return Performance
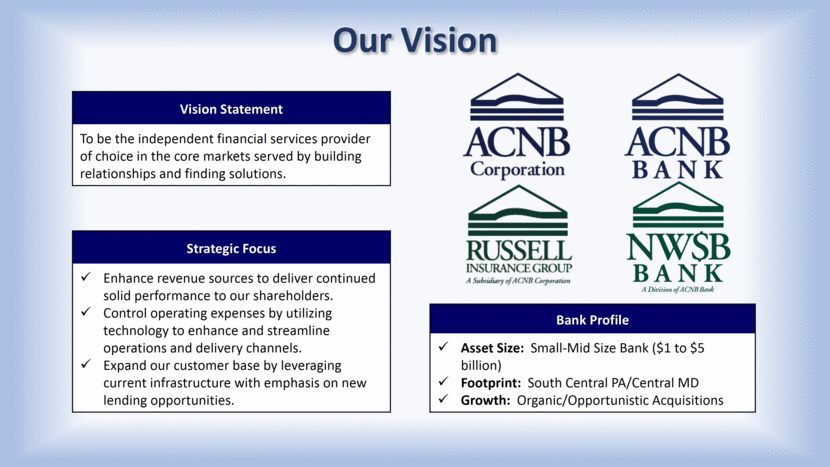
Our Vision Vision Statement To be the independent financial services provider of choice in the core markets served by building relationships and finding solutions. Strategic Focus Enhance revenue sources to deliver continued solid performance to our shareholders. Control operating expenses by utilizing technology to enhance and streamline operations and delivery channels. Expand our customer base by leveraging current infrastructure with emphasis on new lending opportunities. Bank Profile Asset Size: Small-Mid Size Bank ($1 to $5 billion) Footprint: South Central PA/Central MD Growth: Organic/Opportunistic Acquisitions
