Attached files
| file | filename |
|---|---|
| EX-32.02 - EXHIBIT 32.02 - NuStar Energy L.P. | ns2q1810-qex3202.htm |
| EX-32.01 - EXHIBIT 32.01 - NuStar Energy L.P. | ns2q1810-qex3201.htm |
| EX-31.02 - EXHIBIT 31.02 - NuStar Energy L.P. | ns2q1810-qex3102.htm |
| EX-31.01 - EXHIBIT 31.01 - NuStar Energy L.P. | ns2q1810-qex3101.htm |
| EX-12.01 - EXHIBIT 12.01 - NuStar Energy L.P. | ns2q1810-qex1201.htm |
| EX-10.05 - EXHIBIT 10.05 - NuStar Energy L.P. | ns2q1810-qex1005.htm |
UNITED STATES
SECURITIES AND EXCHANGE COMMISSION
Washington, D.C. 20549
_________________________________________
FORM 10-Q
_________________________________________
(Mark One)
x | QUARTERLY REPORT PURSUANT TO SECTION 13 OR 15(d) OF THE SECURITIES EXCHANGE ACT OF 1934 |
For the quarterly period ended June 30, 2018 | |
OR
o | TRANSITION REPORT PURSUANT TO SECTION 13 OR 15(d) OF THE SECURITIES EXCHANGE ACT OF 1934 |
For the transition period from _______ to _______ | |
Commission File Number 1-16417
_________________________________________

NUSTAR ENERGY L.P.
(Exact name of registrant as specified in its charter)
_________________________________________
Delaware | 74-2956831 | |
(State or other jurisdiction of incorporation or organization) | (I.R.S. Employer Identification No.) | |
19003 IH-10 West San Antonio, Texas | 78257 | |
(Address of principal executive offices) | (Zip Code) | |
Registrant’s telephone number, including area code (210) 918-2000
_________________________________________
Indicate by check mark whether the registrant (1) has filed all reports required to be filed by Section 13 or 15(d) of the Securities Exchange Act of 1934 during the preceding 12 months (or for such shorter period that the registrant was required to file such reports), and (2) has been subject to such filing requirements for the past 90 days. Yes x No o
Indicate by check mark whether the registrant has submitted electronically and posted on its corporate Web site, if any, every Interactive Data File required to be submitted and posted pursuant to Rule 405 of Regulation S-T (§232.405 of this chapter) during the preceding 12 months (or for such shorter period that the registrant was required to submit and post such files). Yes x No o
Indicate by check mark whether the registrant is a large accelerated filer, an accelerated filer, a non-accelerated filer, or a smaller reporting company. See the definitions of “large accelerated filer,” “accelerated filer” and “smaller reporting company” in Rule 12b-2 of the Exchange Act:
Large accelerated filer | x | Accelerated filer | o | ||
Non-accelerated filer | o (Do not check if a smaller reporting company) | Smaller reporting company | o | ||
Emerging growth company | o | ||||
If an emerging growth company, indicate by check mark if the registrant has elected not to use the extended transition period for complying with any new or revised financial accounting standards provided pursuant to Section 13(a) of the Exchange Act. o
Indicate by check mark whether the registrant is a shell company (as defined in Rule 12b-2 of the Exchange Act). Yes o No x
The number of common units outstanding as of July 31, 2018 was 107,042,618.
NUSTAR ENERGY L.P.
FORM 10-Q
TABLE OF CONTENTS
Item 1. | ||
Item 2. | ||
Item 3. | ||
Item 4. | ||
Item 6. | ||
2
PART I – FINANCIAL INFORMATION
Item 1. | Financial Statements |
NUSTAR ENERGY L.P. AND SUBSIDIARIES
CONSOLIDATED BALANCE SHEETS
(Thousands of Dollars, Except Unit Data)
June 30, 2018 | December 31, 2017 | ||||||
(Unaudited) | |||||||
Assets | |||||||
Current assets: | |||||||
Cash and cash equivalents | $ | 20,344 | $ | 24,292 | |||
Accounts receivable, net of allowance for doubtful accounts of $10,419 and $9,948 as of June 30, 2018 and December 31, 2017, respectively | 141,872 | 176,570 | |||||
Receivable from related party | 279 | 205 | |||||
Inventories | 28,071 | 26,857 | |||||
Other current assets | 26,526 | 22,508 | |||||
Total current assets | 217,092 | 250,432 | |||||
Property, plant and equipment, at cost | 6,514,589 | 6,243,481 | |||||
Accumulated depreciation and amortization | (2,054,908 | ) | (1,942,548 | ) | |||
Property, plant and equipment, net | 4,459,681 | 4,300,933 | |||||
Intangible assets, net | 758,767 | 784,479 | |||||
Goodwill | 1,094,661 | 1,097,475 | |||||
Deferred income tax asset | — | 233 | |||||
Other long-term assets, net | 116,768 | 101,681 | |||||
Total assets | $ | 6,646,969 | $ | 6,535,233 | |||
Liabilities, Mezzanine Equity and Partners’ Equity | |||||||
Current liabilities: | |||||||
Accounts payable | $ | 127,801 | $ | 145,932 | |||
Short-term debt | 63,000 | 35,000 | |||||
Current portion of long-term debt | — | 349,990 | |||||
Accrued interest payable | 36,192 | 40,449 | |||||
Accrued liabilities | 64,719 | 61,578 | |||||
Taxes other than income tax | 16,220 | 14,385 | |||||
Income tax payable | 3,357 | 4,172 | |||||
Total current liabilities | 311,289 | 651,506 | |||||
Long-term debt, less current portion | 3,380,366 | 3,263,069 | |||||
Deferred income tax liability | 23,113 | 22,272 | |||||
Other long-term liabilities | 105,013 | 118,297 | |||||
Total liabilities | 3,819,781 | 4,055,144 | |||||
Commitments and contingencies (Note 6) | |||||||
Series D preferred limited partners (15,760,441 preferred units outstanding as of June 30, 2018) (Note 11) | 370,711 | — | |||||
Partners’ equity (Note 12): | |||||||
Preferred limited partners (9,060,000 Series A preferred units, 15,400,000 Series B preferred units and 6,900,000 Series C preferred units outstanding as of June 30, 2018 and December 31, 2017) | 756,334 | 756,603 | |||||
Common limited partners (93,597,181 and 93,176,683 common units outstanding as of June 30, 2018 and December 31, 2017, respectively) | 1,740,768 | 1,770,587 | |||||
General partner | 25,999 | 37,826 | |||||
Accumulated other comprehensive loss | (66,624 | ) | (84,927 | ) | |||
Total partners’ equity | 2,456,477 | 2,480,089 | |||||
Total liabilities, mezzanine equity and partners’ equity | $ | 6,646,969 | $ | 6,535,233 | |||
See Condensed Notes to Consolidated Financial Statements.
3
NUSTAR ENERGY L.P. AND SUBSIDIARIES
CONDENSED CONSOLIDATED STATEMENTS OF COMPREHENSIVE INCOME
(Unaudited, Thousands of Dollars, Except Unit and Per Unit Data)
Three Months Ended June 30, | Six Months Ended June 30, | ||||||||||||||
2018 | 2017 | 2018 | 2017 | ||||||||||||
Revenues: | |||||||||||||||
Service revenues | $ | 302,131 | $ | 283,700 | $ | 593,544 | $ | 550,162 | |||||||
Product sales | 184,073 | 151,788 | 368,541 | 372,756 | |||||||||||
Total revenues | 486,204 | 435,488 | 962,085 | 922,918 | |||||||||||
Costs and expenses: | |||||||||||||||
Costs associated with service revenues: | |||||||||||||||
Operating expenses (excluding depreciation and amortization expense) | 131,672 | 116,400 | 240,556 | 217,426 | |||||||||||
Depreciation and amortization expense | 73,613 | 65,402 | 143,510 | 120,073 | |||||||||||
Total costs associated with service revenues | 205,285 | 181,802 | 384,066 | 337,499 | |||||||||||
Cost of product sales | 170,849 | 144,479 | 347,577 | 352,285 | |||||||||||
General and administrative expenses (excluding depreciation and amortization expense) | 27,981 | 33,604 | 47,755 | 58,199 | |||||||||||
Other depreciation and amortization expense | 2,251 | 2,199 | 4,369 | 4,392 | |||||||||||
Total costs and expenses | 406,366 | 362,084 | 783,767 | 752,375 | |||||||||||
Operating income | 79,838 | 73,404 | 178,318 | 170,543 | |||||||||||
Interest expense, net | (48,936 | ) | (45,612 | ) | (96,708 | ) | (82,026 | ) | |||||||
Other income, net | 1,412 | 88 | 81,164 | 228 | |||||||||||
Income before income tax expense | 32,314 | 27,880 | 162,774 | 88,745 | |||||||||||
Income tax expense | 2,915 | 1,630 | 7,242 | 4,555 | |||||||||||
Net income | $ | 29,399 | $ | 26,250 | $ | 155,532 | $ | 84,190 | |||||||
Basic net income per common unit (Note 14) | $ | 0.15 | $ | 0.05 | $ | 1.30 | $ | 0.51 | |||||||
Basic weighted-average common units outstanding | 93,192,238 | 90,345,469 | 93,187,038 | 84,526,506 | |||||||||||
Comprehensive income | $ | 26,778 | $ | 27,381 | $ | 173,835 | $ | 89,084 | |||||||
See Condensed Notes to Consolidated Financial Statements.
4
NUSTAR ENERGY L.P. AND SUBSIDIARIES
CONSOLIDATED STATEMENTS OF CASH FLOWS
(Unaudited, Thousands of Dollars)
Six Months Ended June 30, | |||||||
2018 | 2017 | ||||||
Cash Flows from Operating Activities: | |||||||
Net income | $ | 155,532 | $ | 84,190 | |||
Adjustments to reconcile net income to net cash provided by operating activities: | |||||||
Depreciation and amortization expense | 147,879 | 124,465 | |||||
Unit-based compensation expense | 4,277 | 5,117 | |||||
Amortization of debt related items | 3,965 | 3,146 | |||||
Gain from sale or disposition of assets | (1,218 | ) | (36 | ) | |||
Gain from insurance recoveries | (78,756 | ) | — | ||||
Deferred income tax expense | 1,142 | 23 | |||||
Changes in current assets and current liabilities (Note 15) | 42,733 | (15,344 | ) | ||||
(Increase) decrease in other long-term assets | (11,224 | ) | 2,698 | ||||
(Decrease) increase in other long-term liabilities | (20,073 | ) | 5,494 | ||||
Other, net | (407 | ) | (765 | ) | |||
Net cash provided by operating activities | 243,850 | 208,988 | |||||
Cash Flows from Investing Activities: | |||||||
Capital expenditures | (248,521 | ) | (108,849 | ) | |||
Change in accounts payable related to capital expenditures | (19,320 | ) | 6,851 | ||||
Proceeds from sale or disposition of assets | 2,097 | 1,966 | |||||
Proceeds from Axeon term loan | — | 110,000 | |||||
Proceeds from insurance recoveries | 78,419 | — | |||||
Acquisitions | (37,502 | ) | (1,476,719 | ) | |||
Net cash used in investing activities | (224,827 | ) | (1,466,751 | ) | |||
Cash Flows from Financing Activities: | |||||||
Proceeds from long-term debt borrowings | 677,272 | 1,037,161 | |||||
Proceeds from short-term debt borrowings | 456,000 | 565,000 | |||||
Proceeds from note offering, net of issuance costs | — | 543,313 | |||||
Long-term debt repayments | (905,521 | ) | (1,122,239 | ) | |||
Short-term debt repayments | (428,000 | ) | (574,000 | ) | |||
Proceeds from issuance of Series D preferred units | 400,000 | — | |||||
Payment of issuance costs for Series D preferred units | (29,289 | ) | — | ||||
Proceeds from issuance of other preferred units, net of issuance costs | — | 371,802 | |||||
Proceeds from issuance of common units, net of issuance costs | 10,000 | 643,858 | |||||
Contributions from general partner | — | 13,597 | |||||
Distributions to preferred unitholders | (32,713 | ) | (10,696 | ) | |||
Distributions to common unitholders and general partner | (172,324 | ) | (216,139 | ) | |||
Proceeds from termination of interest rate swaps | 8,048 | — | |||||
(Decrease) increase in cash book overdrafts | (436 | ) | 1,321 | ||||
Other, net | (5,587 | ) | (2,615 | ) | |||
Net cash (used in) provided by financing activities | (22,550 | ) | 1,250,363 | ||||
Effect of foreign exchange rate changes on cash | (421 | ) | 649 | ||||
Net decrease in cash and cash equivalents | (3,948 | ) | (6,751 | ) | |||
Cash and cash equivalents as of the beginning of the period | 24,292 | 35,942 | |||||
Cash and cash equivalents as of the end of the period | $ | 20,344 | $ | 29,191 | |||
See Condensed Notes to Consolidated Financial Statements.
5
NUSTAR ENERGY L.P. AND SUBSIDIARIES
CONDENSED NOTES TO CONSOLIDATED FINANCIAL STATEMENTS
1. ORGANIZATION AND BASIS OF PRESENTATION
Organization and Operations
NuStar Energy L.P. (NYSE: NS) is a publicly held Delaware limited partnership engaged in the transportation of petroleum products and anhydrous ammonia, and the terminalling, storage and marketing of petroleum products. Unless otherwise indicated, the terms “NuStar Energy,” “NS,” “the Partnership,” “we,” “our” and “us” are used in this report to refer to NuStar Energy L.P., to one or more of our consolidated subsidiaries or to all of them taken as a whole. As of June 30, 2018, NuStar GP Holdings, LLC (NuStar GP Holdings or NSH) owned our general partner, Riverwalk Logistics, L.P., and an approximate 11% common limited partner interest in us. As a result of the merger described below, NSH became a wholly owned subsidiary of ours on July 20, 2018.
We conduct our operations through our subsidiaries, primarily NuStar Logistics, L.P. (NuStar Logistics) and NuStar Pipeline Operating Partnership L.P. (NuPOP). We have three business segments: pipeline, storage and fuels marketing.
Recent Developments
Merger. On July 20, 2018, we completed the merger of NSH with a subsidiary of NS. Under the terms of the merger agreement, NSH unitholders are entitled to receive 0.55 of a common unit representing a limited partner interest in NS in exchange for each NSH unit owned at the effective time of the merger. See Note 2 for further discussion of the merger.
Issuance of units. On June 29, 2018, we issued 15,760,441 Series D Cumulative Convertible Preferred Units (Series D Preferred Units) at a price of $25.38 per unit in a private placement for net proceeds of $370.7 million. On July 13, 2018, we issued an additional 7,486,209 Series D Preferred Units at a price of $25.38 per unit in a private placement for net proceeds of $185.2 million. See Note 11 for further discussion. On June 29, 2018, we issued 413,736 common units at a price of $24.17 per unit to William E. Greehey, Chairman of the Board of Directors of NuStar GP, LLC.
Hurricane Activity. In the third quarter of 2017, several of our facilities were affected by the hurricanes in the Caribbean and Gulf of Mexico, including our St. Eustatius terminal, which experienced the most damage and was temporarily shut down. The damage caused by the Caribbean hurricane resulted in lower revenues for our bunker fuel operations in our fuels marketing segment and lower throughput and associated handling fees in our storage segment in 2017 and in the first quarter of 2018. In January 2018, we received $87.5 million of insurance proceeds in settlement of our property damage claim for our St. Eustatius terminal, of which $9.1 million related to business interruption. Proceeds from business interruption insurance are included in “Operating expenses” in the consolidated statements of income and in “Cash flows from operating activities” in the consolidated statements of cash flows. We recorded a $78.8 million gain in “Other income, net” in the consolidated statements of income in the first quarter of 2018 for the amount by which the insurance proceeds exceeded our expenses incurred during the period. We expect that the costs to repair the property damage at the terminal will not exceed the amount of insurance proceeds received.
Basis of Presentation
These unaudited condensed consolidated financial statements include the accounts of the Partnership and subsidiaries in which the Partnership has a controlling interest. Inter-partnership balances and transactions have been eliminated in consolidation.
These unaudited condensed consolidated financial statements have been prepared in accordance with U.S. generally accepted accounting principles (GAAP) for interim financial information and with the instructions to the Quarterly Report on Form 10-Q and Article 10 of Regulation S-X of the Securities Exchange Act of 1934. Accordingly, they do not include all of the information and notes required by GAAP for complete consolidated financial statements. In the opinion of management, all adjustments considered necessary for a fair presentation have been included, and all disclosures are adequate. All such adjustments are of a normal recurring nature unless disclosed otherwise. Financial information for the three and six months ended June 30, 2018 and 2017 included in these Condensed Notes to Consolidated Financial Statements is derived from our unaudited condensed consolidated financial statements. Operating results for the three and six months ended June 30, 2018 are not necessarily indicative of the results that may be expected for the year ending December 31, 2018. The consolidated balance sheet as of December 31, 2017 has been derived from the audited consolidated financial statements as of that date. These unaudited condensed consolidated financial statements should be read in conjunction with the audited consolidated financial statements and notes thereto included in our Annual Report on Form 10-K for the year ended December 31, 2017.
Certain previously reported amounts in the 2017 consolidated financial statements have been reclassified to conform to the 2018 presentation.
6
NUSTAR ENERGY L.P. AND SUBSIDIARIES
CONDENSED NOTES TO CONSOLIDATED FINANCIAL STATEMENTS – (Continued)
2. MERGER
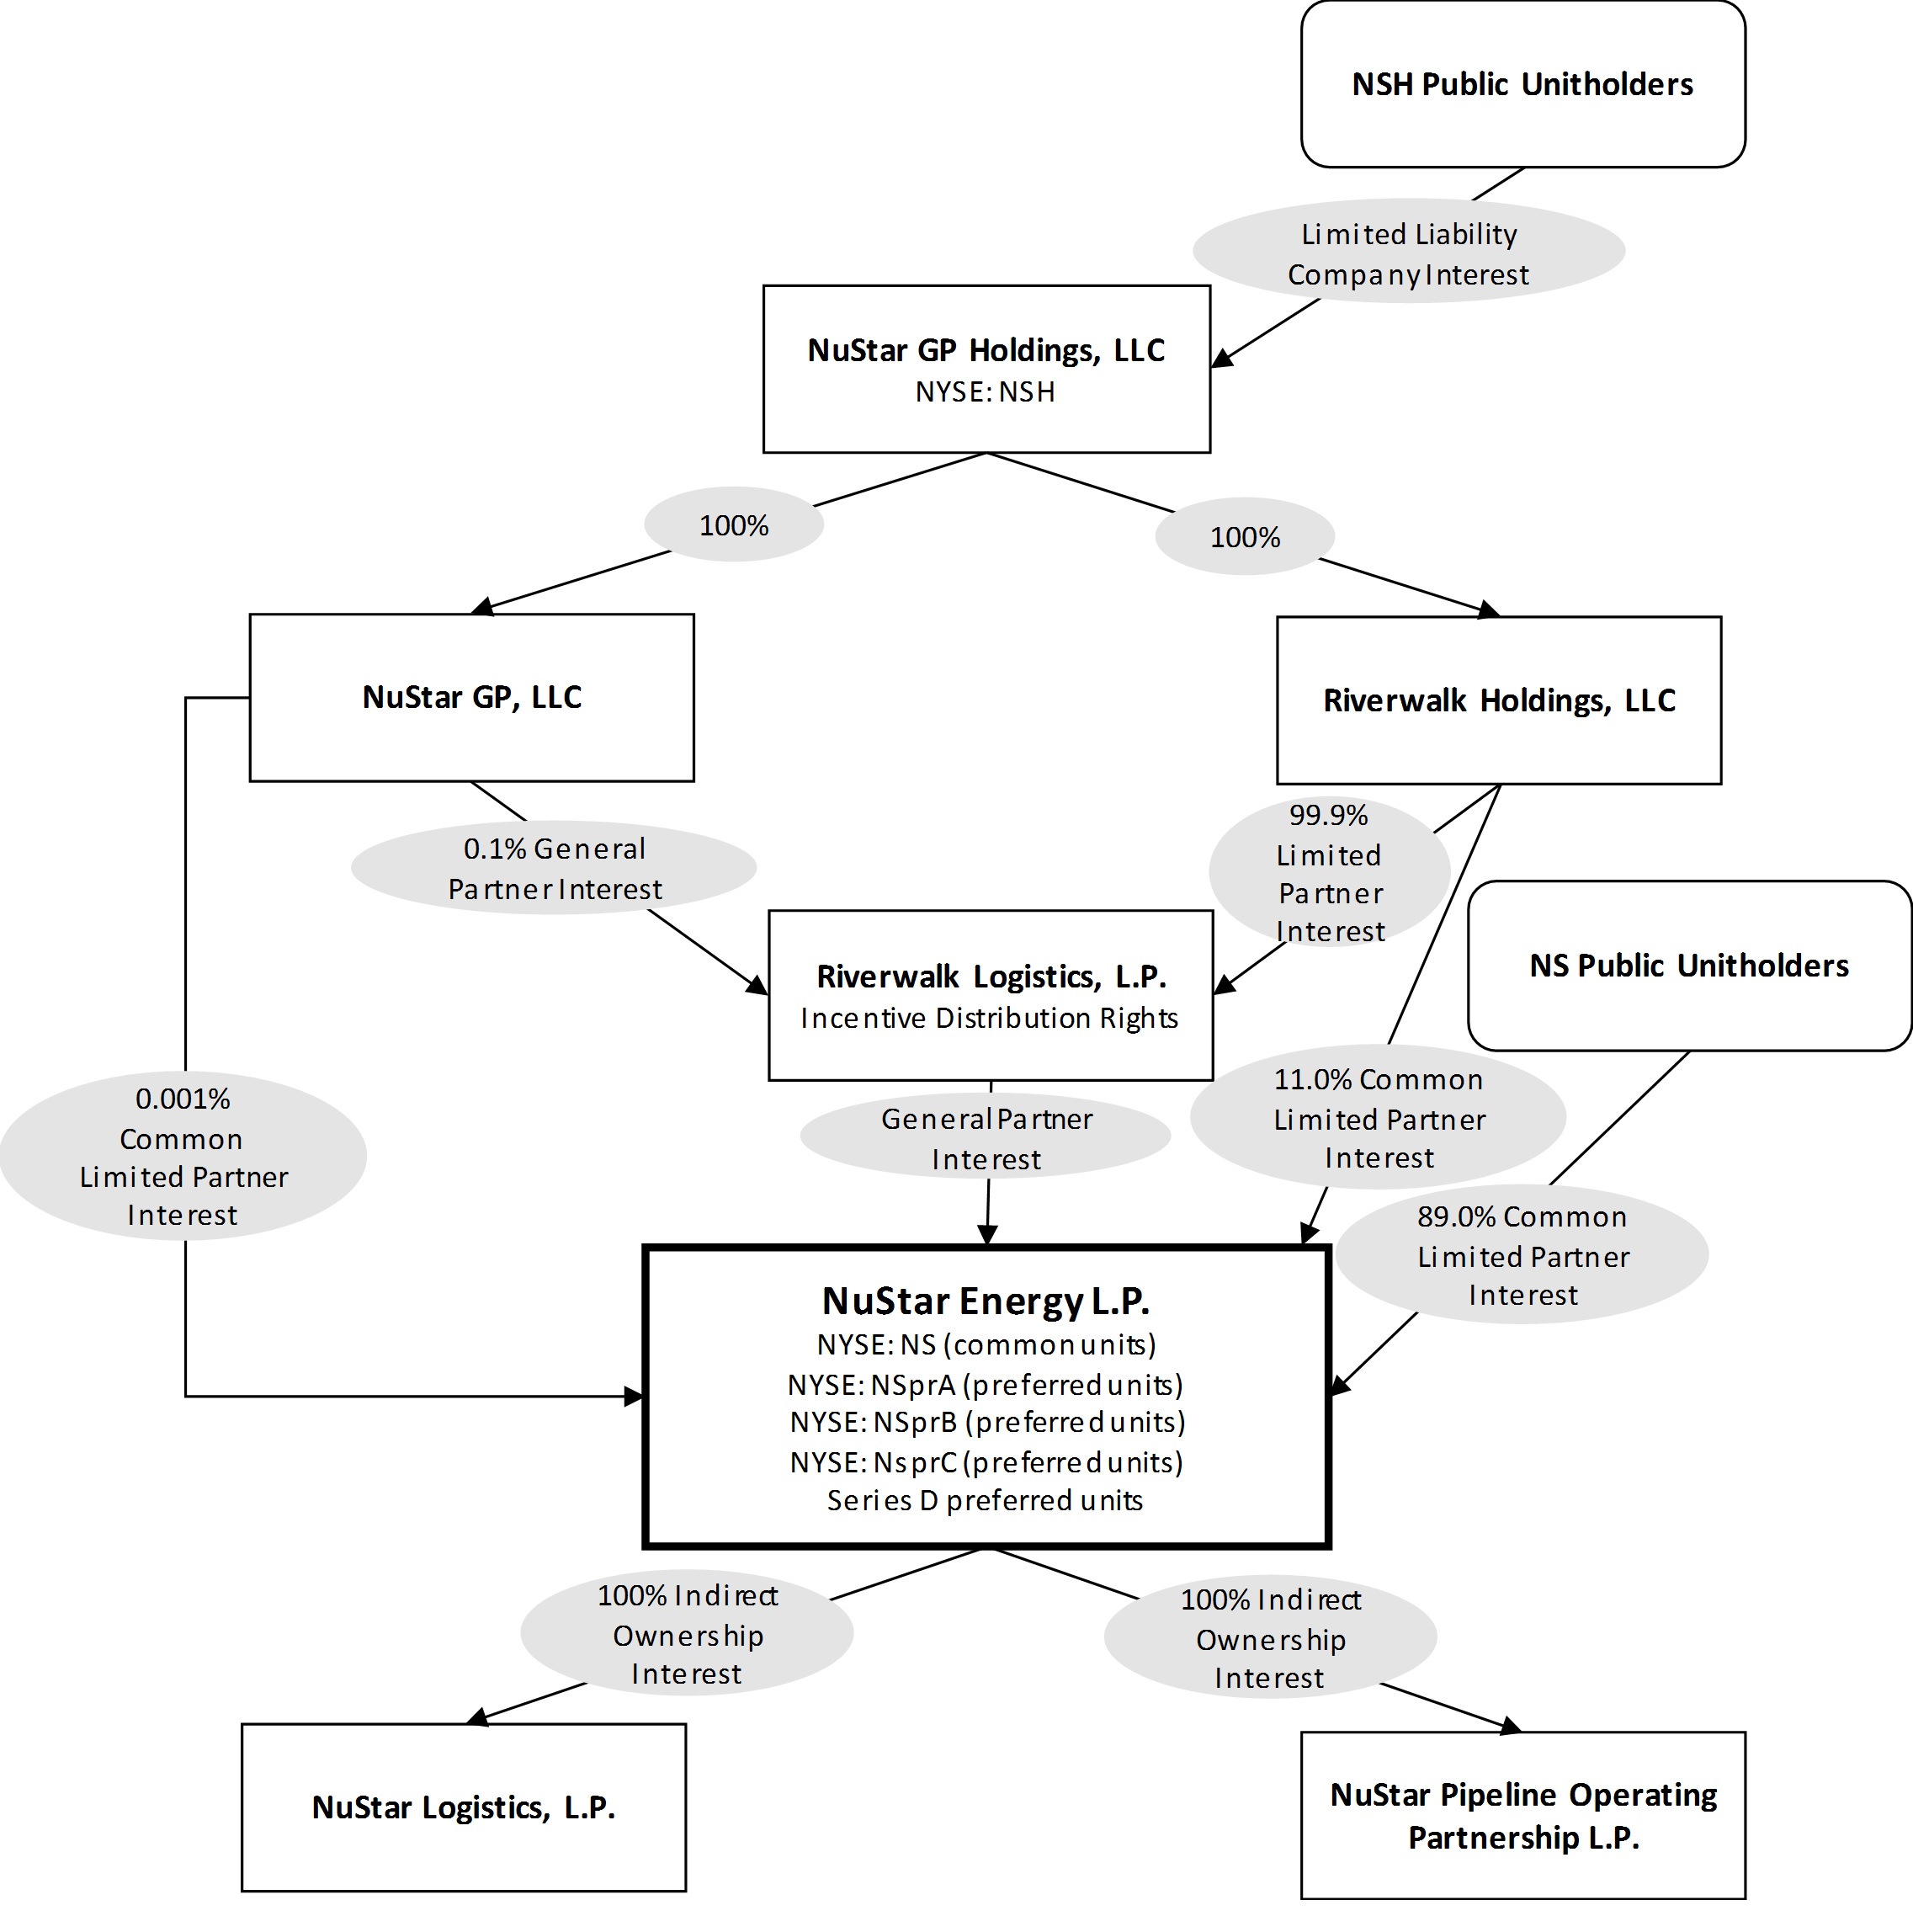
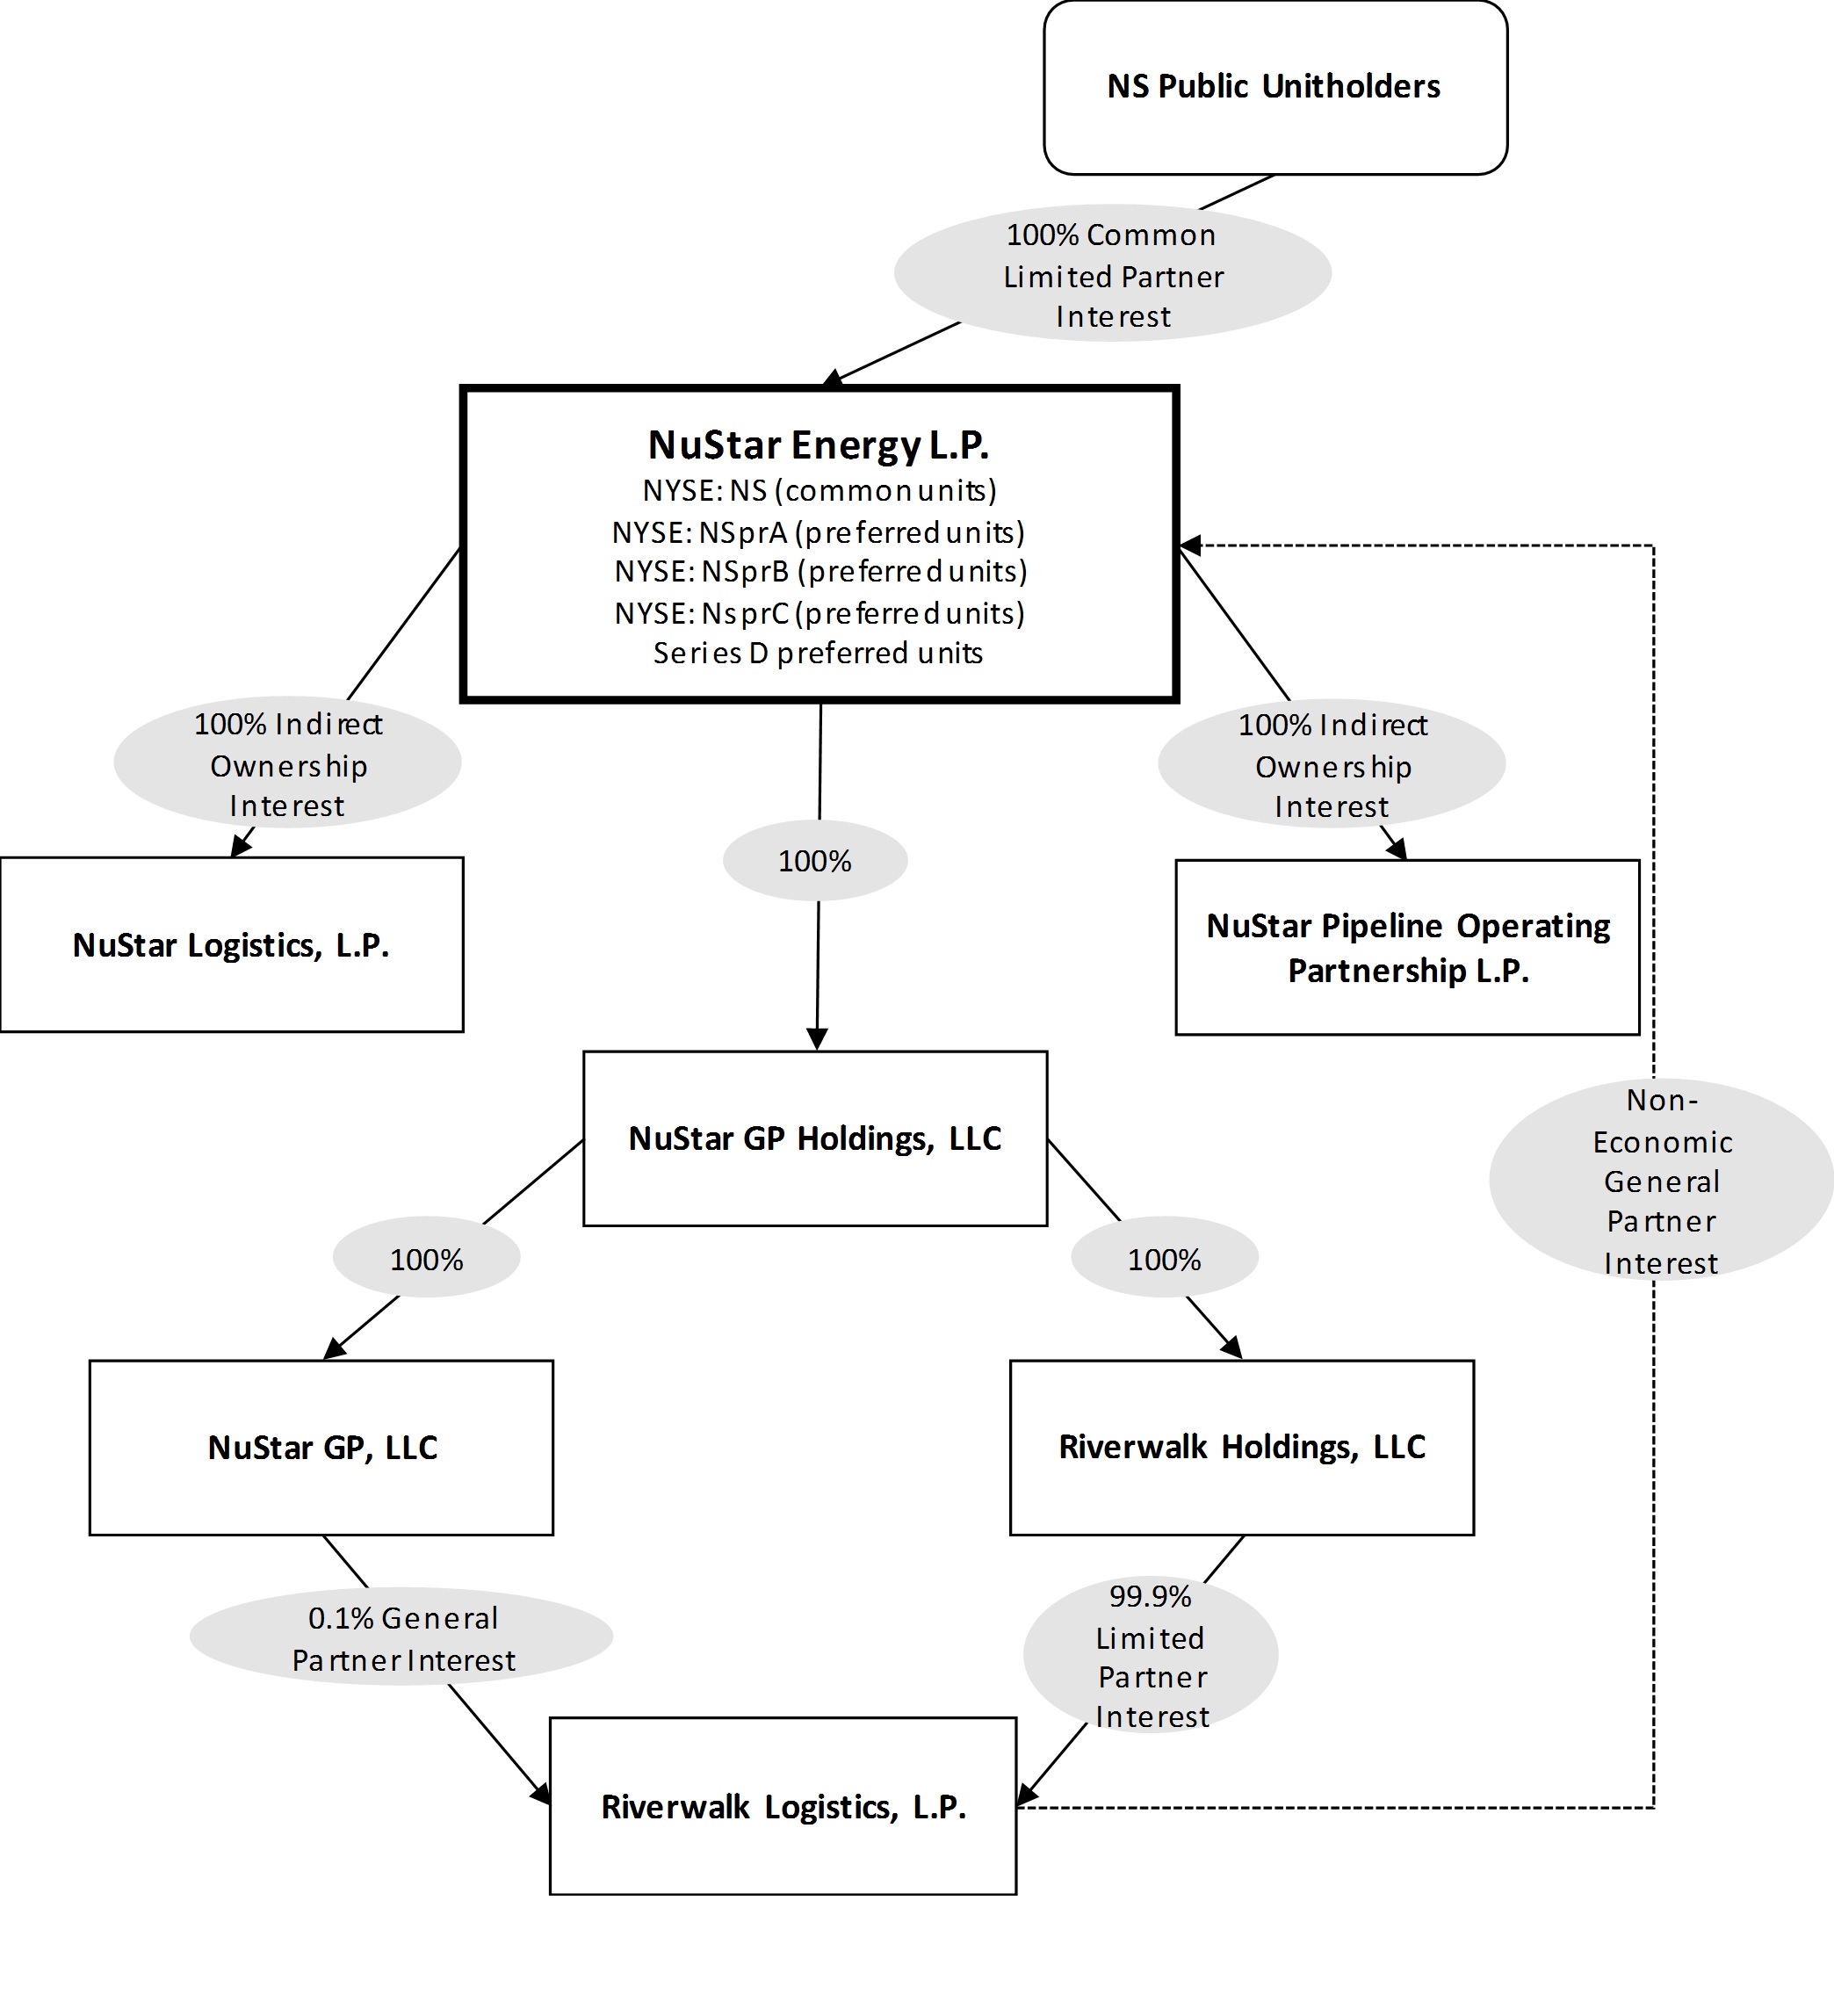
On February 7, 2018, NuStar Energy, Riverwalk Logistics, L.P., NuStar GP, LLC, Marshall Merger Sub LLC, a wholly owned subsidiary of NuStar Energy (Merger Sub), Riverwalk Holdings, LLC and NuStar GP Holdings entered into an Agreement and Plan of Merger (the Merger Agreement). Pursuant to the Merger Agreement, Merger Sub merged with and into NuStar GP Holdings with NuStar GP Holdings being the surviving entity (the Merger), such that NuStar Energy is the sole member of NuStar GP Holdings following the Merger (refer to the next two pages for charts depicting our organizational structure before and after the Merger). The Merger closed on July 20, 2018. Pursuant to the Merger Agreement and at the effective time of the Merger, NuStar Energy’s partnership agreement was amended and restated to, among other things, (i) cancel the incentive distribution rights held by our general partner, (ii) convert the 2% general partner interest in NuStar Energy held by our general partner into a non-economic management interest and (iii) provide the holders of our common units with voting rights in the election of the members of the board of directors of NuStar GP, LLC at an annual meeting, beginning in 2019.
At the effective time of the Merger, each outstanding NuStar GP Holdings common unit was converted into the right to receive 0.55 of a NuStar Energy common unit and all NuStar GP Holdings common units ceased to be outstanding. No fractional NuStar Energy common units were issued in the Merger; instead, each holder of NuStar GP Holdings’ common units otherwise entitled to receive a fractional NuStar Energy common unit is receiving cash in lieu thereof. As a result of the Merger, we issued approximately 23.6 million NuStar Energy common units and cancelled the 10.2 million NuStar Energy common units owned by subsidiaries of NuStar GP Holdings, resulting in approximately 13.4 million incremental NuStar Energy common units outstanding after the Merger.
Also at the effective time of the Merger, each outstanding award of NuStar GP Holdings restricted units was converted, on the same terms and conditions as were applicable to the awards immediately prior to the Merger, into an award of NuStar Energy restricted units. The number of NuStar Energy restricted units subject to the converted awards was determined pursuant to the 0.55 exchange ratio provided in the Merger Agreement.
Following the completion of the Merger, the NuStar GP, LLC board of directors consists of nine members, currently composed of the six members of the NuStar GP, LLC board of directors prior to the Merger and the three independent directors who served prior to the Merger on NuStar GP Holdings’ board of directors.
We plan to account for the Merger as an equity transaction similar to a redemption or induced conversion of preferred stock. The excess of (1) the fair value of the consideration transferred in exchange for the outstanding NSH units over (2) the carrying value of the general partner interest in the Partnership will be subtracted from net income available to common unitholders in the calculation of net income per unit. The consideration transferred includes the fair value of the incremental NS units issued, assumed NSH debt of $51.5 million and estimated transaction costs of approximately $10.0 million, resulting in an estimated reduction of $3.55 per common unit in the third quarter of 2018.
7
NUSTAR ENERGY L.P. AND SUBSIDIARIES
CONDENSED NOTES TO CONSOLIDATED FINANCIAL STATEMENTS – (Continued)
The following chart depicts a summary of our organizational structure at June 30, 2018, before the Merger:
8
NUSTAR ENERGY L.P. AND SUBSIDIARIES
CONDENSED NOTES TO CONSOLIDATED FINANCIAL STATEMENTS – (Continued)
The following chart depicts a summary of our organizational structure after the Merger:
3. NEW ACCOUNTING PRONOUNCEMENTS
Unit-Based Payments to Nonemployees
In June 2018, the Financial Accounting Standards Board (FASB) issued amended guidance which aligns the measurement and classification guidance for unit-based payments to nonemployees with the guidance for unit-based payments to employees, with certain exceptions. Under the amended guidance, unit-based payment awards to nonemployees will be measured at their grant date fair value. The guidance is effective for annual and interim periods beginning after December 15, 2018, with early adoption permitted. The amended guidance should be applied by means of a cumulative-effect adjustment to the balance sheet as of the beginning of the fiscal year of adoption. We are currently evaluating whether we will adopt these provisions early, but we do not expect the guidance to have a material impact on our financial position, results of operations or disclosures.
9
NUSTAR ENERGY L.P. AND SUBSIDIARIES
CONDENSED NOTES TO CONSOLIDATED FINANCIAL STATEMENTS – (Continued)
Comprehensive Income
In February 2018, the FASB issued amended guidance which provides an entity the option to reclassify stranded tax effects caused by the Tax Cuts and Jobs Act of 2017 from accumulated other comprehensive income to retained earnings, and also requires certain additional disclosures about those stranded tax effects. The guidance is effective for annual and interim periods beginning after December 15, 2018, with early adoption permitted. The new requirements should be applied using one of two retrospective transition methods. We are currently evaluating whether we will adopt these provisions early, but we do not expect the guidance to have a material impact on our financial position, results of operations or disclosures.
Derivatives and Hedging
In August 2017, the FASB issued amended guidance intended to improve the financial reporting of hedging relationships to better portray the economic results of an entity’s risk management activities in its financial statements. The amended guidance also makes certain targeted improvements to simplify the application of current hedge accounting guidance. The guidance is effective for annual and interim periods beginning after December 15, 2018, with early adoption permitted. Certain of the new requirements should be applied prospectively while others should be applied using a modified retrospective transition method. We currently expect to adopt the amended guidance on January 1, 2019. We do not expect the guidance to have a material impact on our financial position or results of operations, and we are assessing the impact on our disclosures.
Defined Benefit Plans
In March 2017, the FASB issued amended guidance that changes the presentation of net periodic pension cost related to defined benefit plans. Under the amended guidance, the service cost component of net periodic benefit cost will be presented in the same income statement line items as other current employee compensation costs, but the remaining components of net periodic benefit cost will be presented outside of operating income. The changes are effective for annual and interim periods beginning after December 15, 2017, and amendments should be applied retrospectively. We began reporting the remaining components of net periodic benefit cost in “Other income, net” in the consolidated statements of comprehensive income upon adoption of the amended guidance on January 1, 2018. We applied the amended guidance prospectively as it did not have a material impact on previous periods.
Goodwill
In January 2017, the FASB issued amended guidance that simplifies the accounting for goodwill impairment by eliminating step 2 of the goodwill impairment test. Under the amended guidance, goodwill impairment will be measured as the excess of the reporting unit’s carrying value over its fair value, not to exceed the carrying amount of goodwill for that reporting unit. The changes are effective for annual and interim periods beginning after December 15, 2019, and amendments should be applied prospectively. Early adoption is permitted for any impairment tests performed after January 1, 2017, and we are currently evaluating whether we will adopt these provisions early. Regardless of our decision, we do not expect the guidance to have a material impact on our financial position, results of operations or disclosures.
Credit Losses
In June 2016, the FASB issued amended guidance that requires the use of a “current expected loss” model for financial assets measured at amortized cost and certain off-balance sheet credit exposures. Under this model, entities will be required to estimate the lifetime expected credit losses on such instruments based on historical experience, current conditions, and reasonable and supportable forecasts. This amended guidance also expands the disclosure requirements to enable users of financial statements to understand an entity’s assumptions, models and methods for estimating expected credit losses. The changes are effective for annual and interim periods beginning after December 15, 2019, and amendments should be applied using a modified retrospective approach. We currently expect to adopt the amended guidance on January 1, 2020, and we are assessing the impact of this amended guidance on our financial position, results of operations and disclosures. We plan to provide additional information about the expected financial impact at a future date.
Leases
In February 2016, the FASB issued amended guidance that requires lessees to recognize the assets and liabilities that arise from most leases on the balance sheet. For lessors, this amended guidance modifies the classification criteria and the accounting for sales-type and direct financing leases. The changes are effective for annual and interim periods beginning after December 15, 2018, and amendments should be applied using a modified retrospective approach for leases that exist or are entered into after the beginning of the earliest comparative period in the financial statements, with the option to use certain practical expedients including those for land easements. In July 2018, the FASB issued amended guidance that, among other things, provides another transition method option which allows entities to initially apply the new lease guidance at the adoption date through a cumulative-effect adjustment to the opening balance of retained earnings in the period of adoption. We currently expect to adopt these provisions on January 1, 2019 using this optional transition method.
10
NUSTAR ENERGY L.P. AND SUBSIDIARIES
CONDENSED NOTES TO CONSOLIDATED FINANCIAL STATEMENTS – (Continued)
We have identified our lease arrangements, continue the process of system implementation, and have begun to evaluate internal processes and controls. We are evaluating the impact of the amended guidance on our balance sheet, results of operations, disclosures and internal controls and plan to provide additional information about the expected impact once known.
Revenue Recognition
In May 2014, the FASB and the International Accounting Standards Board jointly issued a comprehensive new revenue recognition standard that requires an entity to recognize revenue when it transfers promised goods or services to customers in an amount that reflects the consideration the entity expects to be entitled to in exchange for those goods or services. The standard is effective for public entities for annual and interim periods beginning after December 15, 2017, using one of two retrospective transition methods. We adopted these provisions January 1, 2018 using the modified retrospective approach. The transition adjustment related to the adoption was immaterial, and we do not expect the adoption of this standard to materially impact the amount or timing of our revenue going forward. Please refer to Note 13 for further discussion.
4. ACQUISITIONS
Council Bluffs Acquisition
On April 16, 2018, we acquired CHS Inc.’s Council Bluffs pipeline system, comprised of a 227-mile pipeline and 18 storage tanks, for approximately $37.5 million (the Council Bluffs Acquisition). The assets acquired and the results of operations are included in our pipeline segment from the date of acquisition. We accounted for this acquisition as an asset purchase.
Navigator Acquisition
On April 11, 2017, we entered into a Membership Interest Purchase and Sale Agreement (the Acquisition Agreement) with FR Navigator Holdings LLC to acquire (the Navigator Acquisition) all of the issued and outstanding limited liability company interests in Navigator Energy Services, LLC (Navigator) for approximately $1.5 billion. We closed the Navigator Acquisition on May 4, 2017. We acquired crude oil transportation, pipeline gathering and storage assets located in the Midland Basin in West Texas that we collectively refer to as our Permian Crude System. The assets acquired are included in our pipeline segment. The condensed consolidated statements of comprehensive income include the results of operations for Navigator commencing on May 4, 2017.
We accounted for the Navigator Acquisition using the acquisition method. The following table reflects the final purchase price allocation:
Purchase Price Allocation | |||
(Thousands of Dollars) | |||
Accounts receivable | $ | 4,747 | |
Other current assets | 2,359 | ||
Property, plant and equipment, net | 376,690 | ||
Intangible assets (a) | 700,000 | ||
Goodwill (b) | 398,024 | ||
Other long-term assets, net | 2,199 | ||
Current liabilities | (22,300 | ) | |
Purchase price allocation, net of cash acquired | $ | 1,461,719 | |
(a) | Intangible assets, which consist of customer contracts and relationships, are amortized on a straight-line basis over a period of 20 years. |
(b) | The goodwill acquired represents the expected benefit from entering new geographic areas and the anticipated opportunities to generate future cash flows from the assets acquired and potential future projects. |
11
NUSTAR ENERGY L.P. AND SUBSIDIARIES
CONDENSED NOTES TO CONSOLIDATED FINANCIAL STATEMENTS – (Continued)
The unaudited pro forma information for the three and six months ended June 30, 2017 below presents the combined historical financial information for Navigator and the Partnership for those periods. This information assumes:
• | we completed the Navigator Acquisition on January 1, 2017; |
• | we issued approximately 14.4 million common units; |
• | we received a contribution from our general partner of $13.6 million to maintain its 2% interest; |
• | we issued 15.4 million Series B Preferred Units; |
• | we issued $550.0 million of 5.625% senior notes; |
• | additional depreciation and amortization that would have been incurred assuming the fair value adjustments to property, plant and equipment and intangible assets reflected in the purchase price allocation above; and |
• | we satisfied Navigator’s outstanding obligations under its revolving credit agreement. |
Three Months Ended June 30, 2017 | Six Months Ended June 30, 2017 | ||||||
(Thousands of Dollars, Except Per Unit Data) | |||||||
Revenues | $ | 439,933 | $ | 937,317 | |||
Net income | $ | 21,211 | $ | 63,659 | |||
Basic net (loss) income per common unit | $ | (0.03 | ) | $ | 0.16 | ||
The pro forma information for the three and six months ended June 30, 2017 includes transaction costs of approximately $14.0 million, which were directly attributable to the Navigator Acquisition and paid in the second quarter of 2017. The pro forma information is unaudited and is not necessarily indicative of the results of operations that would have resulted had the Navigator Acquisition occurred on January 1, 2017 or that may result in the future.
5. DEBT
Revolving Credit Agreement
On June 29, 2018, NuStar Logistics amended its revolving credit agreement (the Revolving Credit Agreement) to exclude the Series D Preferred Units from the definition of “Indebtedness.” Additionally, the amendment reduced the total amount available for borrowing from $1.75 billion to $1.575 billion, effective June 29, 2018, with a further reduction to $1.4 billion, effective December 28, 2018. The Revolving Credit Agreement was also amended to, among other things, add a consolidated interest coverage ratio (as defined in the Revolving Credit Agreement), which must not be less than 1.75-to-1.00 for each rolling period of four quarters, beginning with the rolling period ending June 30, 2018.
On March 28, 2018, NuStar Logistics amended the Revolving Credit Agreement to increase the maximum allowed consolidated debt coverage ratio (as defined in the Revolving Credit Agreement) to 5.25-to-1.00 for the rolling periods ending June 30, 2018 through December 31, 2018. For any rolling periods ending on or after March 31, 2019, the maximum allowed consolidated debt coverage ratio may not exceed 5.00-to-1.00. The Revolving Credit Agreement was also amended to, among other things, provide that the definition of “Change in Control” in the Revolving Credit Agreement excludes the Merger discussed in Note 2.
The maximum consolidated debt coverage ratio and minimum consolidated interest coverage ratio requirements may limit the amount we can borrow under the Revolving Credit Agreement to an amount less than the total amount available for borrowing. As of June 30, 2018, we had $553.7 million available for borrowing, and we believe that we are in compliance with the covenants in the Revolving Credit Agreement.
The Revolving Credit Agreement bears interest, at our option, based on an alternative base rate, a LIBOR-based rate or a EURIBOR-based rate. The interest rate on the Revolving Credit Agreement is subject to adjustment if our debt rating is downgraded (or upgraded) by certain credit rating agencies. In February 2018, Moody’s Investor Service Inc. (Moody’s) lowered our credit rating from Ba1 to Ba2. This rating downgrade caused the interest rate on our Revolving Credit Agreement to increase by 0.25% effective February 2018. As of June 30, 2018, our weighted-average interest rate related to borrowings under the Revolving Credit Agreement was 3.9%, and we had $1.0 billion outstanding.
NuStar Logistics Senior Notes
The credit rating downgrade by Moody’s in February 2018 increased the interest rate on our $350.0 million of 7.65% senior notes by 0.25%, resulting in an interest rate of 8.65% applicable to the interest payment due April 15, 2018. We repaid these notes on April 15, 2018 with borrowings under our Revolving Credit Agreement.
12
NUSTAR ENERGY L.P. AND SUBSIDIARIES
CONDENSED NOTES TO CONSOLIDATED FINANCIAL STATEMENTS – (Continued)
NuStar Logistics Subordinated Notes
Effective January 15, 2018, the interest rate on NuStar Logistics’ $402.5 million of fixed-to-floating rate subordinated notes due January 15, 2043 switched from a fixed annual rate of 7.625%, payable quarterly in arrears, to an annual rate equal to the sum of the three-month LIBOR for the related quarterly interest period, plus 6.734% payable quarterly, commencing with the interest payment due April 15, 2018. As of June 30, 2018, the interest rate was 9.1%.
Receivables Financing Agreement
NuStar Energy and NuStar Finance LLC (NuStar Finance), a special purpose entity and wholly owned subsidiary of NuStar Energy, are parties to a $125.0 million receivables financing agreement with third-party lenders (the Receivables Financing Agreement) and agreements with certain of NuStar Energy’s wholly owned subsidiaries (collectively with the Receivables Financing Agreement, the Securitization Program). NuStar Finance’s sole activity consists of purchasing receivables from NuStar Energy’s wholly owned subsidiaries that participate in the Securitization Program and providing these receivables as collateral for NuStar Finance’s revolving borrowings under the Securitization Program. NuStar Finance is a separate legal entity and the assets of NuStar Finance, including these accounts receivable, are not available to satisfy the claims of creditors of NuStar Energy, its subsidiaries selling receivables under the Securitization Program or their affiliates. The amount available for borrowing is based on the availability of eligible receivables and other customary factors and conditions. The March 28, 2018 amendment to the Revolving Credit Agreement also limits the amount of borrowings under the Receivables Financing Agreement to $125.0 million.
Borrowings by NuStar Finance under the Receivables Financing Agreement bear interest at the applicable bank rate, as defined under the Receivables Financing Agreement. The weighted average interest rate related to outstanding borrowings under the Securitization Program as of June 30, 2018 was 3.0%. As of June 30, 2018, $103.2 million of our accounts receivable, net of allowance for doubtful accounts, are included in the Securitization Program. The amount of borrowings outstanding under the Receivables Financing Agreement totaled $56.4 million as of June 30, 2018, which is included in “Long-term debt” on the consolidated balance sheet. On March 28, 2018, the Receivables Financing Agreement was amended to change the definition of Change in Control in the Receivables Financing Agreement such that the Merger discussed in Note 2 would not be a Change in Control for purposes of the Receivables Financing Agreement.
6. COMMITMENTS AND CONTINGENCIES
We have contingent liabilities resulting from various litigation, claims and commitments. We record accruals for loss contingencies when losses are considered probable and can be reasonably estimated. Legal fees associated with defending the Partnership in legal matters are expensed as incurred. We accrued $2.7 million for contingent losses as of June 30, 2018 and $7.3 million as of December 31, 2017. The amount that will ultimately be paid related to such matters may differ from the recorded accruals, and the timing of such payments is uncertain. We evaluate each contingent loss at least quarterly, and more frequently as each matter progresses and develops over time, and we do not believe that the resolution of any particular claim or proceeding, or all matters in the aggregate, would have a material adverse effect on our results of operations, financial position or liquidity.
7. FAIR VALUE MEASUREMENTS
We segregate the inputs used in measuring fair value into three levels: Level 1, defined as observable inputs, such as quoted prices for identical assets or liabilities in active markets; Level 2, defined as inputs other than quoted prices in active markets that are either directly or indirectly observable, such as quoted prices for similar assets or liabilities in active markets or quoted prices for identical assets or liabilities in markets that are not active; and Level 3, defined as unobservable inputs for which little or no market data exists. We consider counterparty credit risk and our own credit risk in the determination of all estimated fair values.
13
NUSTAR ENERGY L.P. AND SUBSIDIARIES
CONDENSED NOTES TO CONSOLIDATED FINANCIAL STATEMENTS – (Continued)
Recurring Fair Value Measurements
The following assets and liabilities are measured at fair value on a recurring basis:
June 30, 2018 | |||||||||||||||
Level 1 | Level 2 | Level 3 | Total | ||||||||||||
(Thousands of Dollars) | |||||||||||||||
Assets: | |||||||||||||||
Other long-term assets, net: | |||||||||||||||
Interest rate swaps | $ | — | $ | 4,491 | $ | — | $ | 4,491 | |||||||
Liabilities: | |||||||||||||||
Accrued liabilities: | |||||||||||||||
Commodity derivatives | $ | (247 | ) | $ | — | $ | — | $ | (247 | ) | |||||
December 31, 2017 | |||||||||||||||
Level 1 | Level 2 | Level 3 | Total | ||||||||||||
(Thousands of Dollars) | |||||||||||||||
Assets: | |||||||||||||||
Other current assets: | |||||||||||||||
Product imbalances | $ | 3,890 | $ | — | $ | — | $ | 3,890 | |||||||
Liabilities: | |||||||||||||||
Accrued liabilities: | |||||||||||||||
Product imbalances | $ | (1,534 | ) | $ | — | $ | — | $ | (1,534 | ) | |||||
Commodity derivatives | (878 | ) | — | — | (878 | ) | |||||||||
Interest rate swaps | — | (5,394 | ) | — | (5,394 | ) | |||||||||
Other long-term liabilities: | |||||||||||||||
Interest rate swaps | — | (4,594 | ) | — | (4,594 | ) | |||||||||
Total liabilities | $ | (2,412 | ) | $ | (9,988 | ) | $ | — | $ | (12,400 | ) | ||||
Product Imbalances. Pursuant to the new revenue recognition standard we adopted January 1, 2018, we no longer recognize the fair value of product imbalances on our consolidated balance sheets. Prior to adoption, we valued our assets and liabilities related to product imbalances using quoted market prices in active markets as of the reporting date; accordingly, we included these product imbalances in Level 1 of the fair value hierarchy.
Commodity Derivatives. We base the fair value of certain of our commodity derivative instruments on quoted prices on an exchange; accordingly, we include these items in Level 1 of the fair value hierarchy. See Note 8 for a discussion of our derivative instruments.
Interest Rate Swaps. Because we estimate the fair value of our forward-starting interest rate swaps using discounted cash flows, which use observable inputs such as time to maturity and market interest rates, we include these interest rate swaps in Level 2 of the fair value hierarchy.
Fair Value of Financial Instruments
We recognize cash equivalents, receivables, payables and debt in our consolidated balance sheets at their carrying amounts. The fair values of these financial instruments, except for long-term debt, approximate their carrying amounts.
The estimated fair values and carrying amounts of long-term debt, including the current portion, were as follows:
June 30, 2018 | December 31, 2017 | ||||||
(Thousands of Dollars) | |||||||
Fair value | $ | 3,394,956 | $ | 3,677,622 | |||
Carrying amount | $ | 3,380,366 | $ | 3,613,059 | |||
14
NUSTAR ENERGY L.P. AND SUBSIDIARIES
CONDENSED NOTES TO CONSOLIDATED FINANCIAL STATEMENTS – (Continued)
We have estimated the fair value of our publicly traded notes based upon quoted prices in active markets; therefore, we determined that the fair value of our publicly traded notes falls in Level 1 of the fair value hierarchy. With regard to our other debt, for which a quoted market price is not available, we have estimated the fair value using a discounted cash flow analysis using current incremental borrowing rates for similar types of borrowing arrangements and determined that the fair value falls in Level 2 of the fair value hierarchy.
8. DERIVATIVES AND RISK MANAGEMENT ACTIVITIES
We utilize various derivative instruments to manage our exposure to interest rate risk and commodity price risk. Our risk management policies and procedures are designed to monitor interest rates, futures and swap positions and over-the-counter positions, as well as physical commodity volumes, grades, locations and delivery schedules, to help ensure that our hedging activities address our market risks.
Interest Rate Risk
We are a party to certain interest rate swap agreements to manage our exposure to changes in interest rates, which include forward-starting interest rate swap agreements related to forecasted debt issuances in 2020. We entered into these swaps in order to hedge the risk of fluctuations in the required interest payments attributable to changes in the benchmark interest rate during the period from the effective date of the swap to the issuance of the forecasted debt. Under the terms of the swaps, we pay a fixed rate and receive a rate based on the three-month USD LIBOR. These swaps qualify as cash flow hedges, and we designate them as such. We record the effective portion of mark-to-market adjustments as a component of “Accumulated other comprehensive income (loss)” (AOCI), and the amount in AOCI will be recognized in “Interest expense, net” as the forecasted interest payments occur or if the interest payments are probable not to occur. As of June 30, 2018 and December 31, 2017, the aggregate notional amount of forward-starting interest rate swaps totaled $250.0 million and $600.0 million, respectively. In April 2018, in connection with the maturity of the 7.65% senior notes due April 15, 2018, we terminated forward-starting interest rate swaps with an aggregate notional amount of $350.0 million and received $8.0 million.
Commodity Price Risk
We are exposed to market risks related to the volatility of petroleum product prices. In order to reduce the risk of commodity price fluctuations with respect to our petroleum product inventories and related firm commitments to purchase and/or sell such inventories, we utilize commodity futures and swap contracts, which qualify, and we designate, as fair value hedges. Derivatives that are intended to hedge our commodity price risk but fail to qualify as fair value or cash flow hedges are considered economic hedges, and we record associated gains and losses in net income. Our risk management committee oversees our trading controls and procedures and certain aspects of commodity and trading risk management. Our risk management committee also reviews all new commodity and trading risk management strategies in accordance with our risk management policy, as approved by our board of directors. We ceased marketing crude oil in the second quarter of 2017 and exited our heavy fuels trading operations in the third quarter of 2017, thereby reducing our overall hedging activity.
The volume of commodity contracts is based on open derivative positions and represents the combined volume of our long and short open positions on an absolute basis, which totaled 1.2 million barrels as of June 30, 2018 and December 31, 2017. We had $0.2 million and $0.3 million of margin deposits as of June 30, 2018 and December 31, 2017, respectively.
15
NUSTAR ENERGY L.P. AND SUBSIDIARIES
CONDENSED NOTES TO CONSOLIDATED FINANCIAL STATEMENTS – (Continued)
The fair values of our derivative instruments included in our consolidated balance sheets were as follows:
Asset Derivatives | Liability Derivatives | ||||||||||||||||
Balance Sheet Location | June 30, 2018 | December 31, 2017 | June 30, 2018 | December 31, 2017 | |||||||||||||
(Thousands of Dollars) | |||||||||||||||||
Derivatives Designated as Hedging Instruments: | |||||||||||||||||
Interest rate swaps | Other long-term assets, net | $ | 4,491 | $ | — | $ | — | $ | — | ||||||||
Commodity contracts | Accrued liabilities | — | — | (70 | ) | (112 | ) | ||||||||||
Interest rate swaps | Accrued liabilities | — | — | — | (5,394 | ) | |||||||||||
Interest rate swaps | Other long-term liabilities | — | — | — | (4,594 | ) | |||||||||||
Total | 4,491 | — | (70 | ) | (10,100 | ) | |||||||||||
Derivatives Not Designated as Hedging Instruments: | |||||||||||||||||
Commodity contracts | Accrued liabilities | 1,278 | 742 | (1,455 | ) | (1,508 | ) | ||||||||||
Total Derivatives | $ | 5,769 | $ | 742 | $ | (1,525 | ) | $ | (11,608 | ) | |||||||
Certain of our derivative instruments are eligible for offset in the consolidated balance sheets and subject to master netting arrangements. Under our master netting arrangements, there is a legally enforceable right to offset amounts, and we intend to settle such amounts on a net basis. The following are the net amounts presented on the consolidated balance sheets:
Commodity Contracts | June 30, 2018 | December 31, 2017 | ||||||
(Thousands of Dollars) | ||||||||
Net amounts of assets presented in the consolidated balance sheets | $ | — | $ | — | ||||
Net amounts of liabilities presented in the consolidated balance sheets | $ | (247 | ) | $ | (878 | ) | ||
We recognize the impact of our commodity contracts on earnings in “Cost of product sales” on the condensed consolidated statements of comprehensive income, as follows:
Three Months Ended June 30, | Six Months Ended June 30, | ||||||||||||||
2018 | 2017 | 2018 | 2017 | ||||||||||||
(Thousands of Dollars) | |||||||||||||||
Derivatives Designated as Fair Value Hedging Instruments: | |||||||||||||||
(Loss) gain recognized in income on derivative | $ | (1,007 | ) | $ | 364 | $ | (1,303 | ) | $ | 2,461 | |||||
Gain (loss) recognized in income on hedged item | 981 | (313 | ) | 1,218 | (2,147 | ) | |||||||||
(Loss) gain recognized in income for ineffective portion | $ | (26 | ) | $ | 51 | $ | (85 | ) | $ | 314 | |||||
Derivatives Not Designated as Hedging Instruments: | |||||||||||||||
(Loss) gain recognized in income on derivative | $ | (90 | ) | $ | 52 | $ | (231 | ) | $ | (86 | ) | ||||
16
NUSTAR ENERGY L.P. AND SUBSIDIARIES
CONDENSED NOTES TO CONSOLIDATED FINANCIAL STATEMENTS – (Continued)
Our interest rate swaps had the following impact on earnings:
Three Months Ended June 30, | Six Months Ended June 30, | ||||||||||||||
2018 | 2017 | 2018 | 2017 | ||||||||||||
(Thousands of Dollars) | |||||||||||||||
Derivatives Designated as Cash Flow Hedging Instruments: | |||||||||||||||
Gain (loss) recognized in other comprehensive income on derivative (effective portion) | $ | 5,106 | $ | (7,980 | ) | $ | 22,527 | $ | (7,941 | ) | |||||
Loss reclassified from AOCI into interest expense, net (effective portion) | $ | (1,162 | ) | $ | (1,729 | ) | $ | (2,552 | ) | $ | (3,528 | ) | |||
As of June 30, 2018, we expect to reclassify a loss of $3.7 million to “Interest expense, net” within the next twelve months associated with unwound forward-starting interest rate swaps.
9. RELATED PARTY TRANSACTIONS
Please refer to Note 2 for a discussion of the Merger.
Prior to the Merger, we were a party to the Amended and Restated Services Agreement with NuStar GP, LLC, effective March 1, 2016 (the Amended GP Services Agreement), which provided that we furnish administrative services necessary to conduct the business of NuStar GP Holdings, and NuStar GP Holdings compensated us for these services for an annual fee of $1.0 million, subject to adjustment. We terminated the Amended GP Services Agreement in conjunction with the Merger.
10. EMPLOYEE BENEFIT PLANS
NuStar’s Pension Plan is a qualified non-contributory defined benefit pension plan that provides eligible U.S. employees with retirement income as calculated under a cash balance formula. NuStar’s Excess Pension Plan is a nonqualified deferred compensation plan that provides benefits to a select group of management or other highly compensated employees. The Pension Plan and Excess Pension Plan are collectively referred to as the Pension Plans.
We also sponsor a contributory medical benefits plan for U.S. employees who retired prior to April 1, 2014. For employees who retire on or after April 1, 2014, we provide partial reimbursement for eligible third-party health care premiums.
17
NUSTAR ENERGY L.P. AND SUBSIDIARIES
CONDENSED NOTES TO CONSOLIDATED FINANCIAL STATEMENTS – (Continued)
The components of net periodic benefit cost (income) related to our Pension Plans and other postretirement benefit plans were as follows:
Pension Plans | Other Postretirement Benefit Plans | ||||||||||||||
2018 | 2017 | 2018 | 2017 | ||||||||||||
(Thousands of Dollars) | |||||||||||||||
For the three months ended June 30: | |||||||||||||||
Service cost | $ | 2,405 | $ | 2,239 | $ | 126 | $ | 113 | |||||||
Interest cost | 1,206 | 1,127 | 107 | 108 | |||||||||||
Expected return on assets | (1,854 | ) | (1,602 | ) | — | — | |||||||||
Amortization of prior service credit | (514 | ) | (516 | ) | (286 | ) | (286 | ) | |||||||
Amortization of net loss | 543 | 371 | 53 | 48 | |||||||||||
Net periodic benefit cost (income) | $ | 1,786 | $ | 1,619 | $ | — | $ | (17 | ) | ||||||
For the six months ended June 30: | |||||||||||||||
Service cost | $ | 4,811 | $ | 4,478 | $ | 252 | $ | 226 | |||||||
Interest cost | 2,412 | 2,254 | 215 | 216 | |||||||||||
Expected return on assets | (3,709 | ) | (3,205 | ) | — | — | |||||||||
Amortization of prior service credit | (1,028 | ) | (1,031 | ) | (573 | ) | (572 | ) | |||||||
Amortization of net loss | 1,087 | 742 | 107 | 96 | |||||||||||
Net periodic benefit cost (income) | $ | 3,573 | $ | 3,238 | $ | 1 | $ | (34 | ) | ||||||
11. SERIES D CUMULATIVE CONVERTIBLE PREFERRED UNITS
Purchase Agreement and Issuance of Series D Preferred Units
On June 26, 2018, the Partnership entered into a purchase agreement (the Series D Preferred Unit Purchase Agreement) with investment funds, accounts and entities (collectively, the Purchasers) managed by EIG Management Company, LLC and FS/EIG Advisors, LLC to issue and sell $590.0 million of Series D Preferred Units in a private placement. The Partnership issued a total of 23,246,650 Series D Preferred Units to the Purchasers at a price of $25.38 per Series D Preferred Unit (the Series D Preferred Unit Purchase Price). At the initial closing on June 29, 2018 (the Initial Closing), the Purchasers purchased 15,760,441 Series D Preferred Units for $400.0 million. We used net proceeds of $370.7 million received at the Initial Closing for general partnership purposes, including repayment of outstanding borrowings under our Revolving Credit Agreement. The Purchasers purchased the remaining 7,486,209 Series D Preferred Units for $190.0 million at a second closing on July 13, 2018. The aggregate net proceeds to the Partnership from the sale of the Series D Preferred Units, after deduction of a 3.5% transaction fee of $20.7 million paid to the Purchasers and other issuance costs of $13.4 million, were approximately $555.9 million.
Series D Preferred Units Rights
At the Initial Closing and pursuant to the Series D Preferred Unit Purchase Agreement, the Partnership amended and restated its partnership agreement to authorize and establish the rights, preferences and privileges of the Series D Preferred Units. The Series D Preferred Units rank equal to other classes of preferred units and senior to common units in the Partnership with respect to distribution rights and rights upon liquidation. The Series D Preferred Units generally will vote on an as-converted basis with the common units and will have certain class voting rights with respect to a limited number of matters as set forth in the partnership agreement.
Series D Preferred Units Distributions
Distributions on the Series D Preferred Units accrue and are cumulative from the issuance dates and are payable on the 15th day (or next business day) of each of March, June, September and December, beginning September 17, 2018 to holders of record on the first business day of each payment month. The distribution rate on the Series D Preferred Units is: (i) 9.75% per annum for the first two years; (ii) 10.75% per annum for years three through five; and (iii) the greater of 13.75% per annum or the common unit distribution rate thereafter. While the Series D Preferred Units are outstanding, the Partnership will be prohibited from paying distributions on any junior securities, including the common units, unless full cumulative distributions on the Series D Preferred Units (and any parity securities) have been, or contemporaneously are being, paid or set aside for payment
18
NUSTAR ENERGY L.P. AND SUBSIDIARIES
CONDENSED NOTES TO CONSOLIDATED FINANCIAL STATEMENTS – (Continued)
through the most recent Series D Preferred Unit distribution payment date. For the four distribution periods beginning with the initial Series D Preferred Unit distribution, the Series D Preferred Unit distributions may be paid, in the Partnership’s sole discretion, in (i) cash or (ii) a combination of additional Series D Preferred Units and cash, provided that up to 50% of the distribution amount may be paid in additional Series D Preferred Units. Thereafter, any Series D Preferred Unit distributions in excess of $0.635 may be paid, in the Partnership’s sole discretion, in additional Series D Preferred Units, with the remainder paid in cash.
If we fail to pay in full any Series D Preferred Unit distribution amount, then, until we pay such distributions in full, the applicable distribution rate for each of those distribution periods shall be increased by $0.048 per Series D Preferred Unit. In addition, if we fail to pay in full any Series D Preferred Unit distribution amount for three consecutive distribution periods, then until we pay such distributions in full: (i) each holder of the Series D Preferred Units may elect to convert its Series D Preferred Units into common units on a one-for-one basis, plus any unpaid Series D distributions, (ii) one person selected by the holders holding a majority of the outstanding Series D Preferred Units shall become an additional member of our board of directors and (iii) we will not be permitted to incur any indebtedness (as defined in the Revolving Credit Agreement) or engage in any acquisitions or asset sales in excess of $50.0 million without the consent of the holders holding a majority of the outstanding Series D Preferred Units. In addition, we will permanently lose the ability to pay any part of the distributions on the Series D Preferred Units in the form of additional Series D Preferred Units.
In July 2018, our board of directors declared an initial distribution of $0.525 per Series D Preferred Unit issued on June 29, 2018 and an initial distribution of $0.431 per Series D Preferred Unit issued on July 13, 2018, which will both be paid on September 17, 2018 to holders of record as of September 4, 2018.
Series D Preferred Units Conversion and Redemption Features
At any time on or after June 29, 2020, each holder of Series D Preferred Units may convert all or any portion of its Series D Preferred Units into common units on a one-for-one basis (plus any unpaid Series D distributions), subject to anti-dilution adjustments, at any time, but not more than once per quarter, so long as any conversion is for at least $50.0 million based on the Series D Preferred Unit Purchase Price (or such lesser amount representing all of a holder’s Series D Preferred Units).
The Partnership may redeem all or any portion of the Series D Preferred Units, in an amount not less than $50.0 million for cash at a redemption price equal to, as applicable: (i) $31.73 per Series D Preferred Unit at any time on or after June 29, 2023 but prior to June 29, 2024; (ii) $30.46 per Series D Preferred Unit at any time on or after June 29, 2024 but prior to June 29, 2025; (iii) $29.19 per Series D Preferred Unit at any time on or after June 29, 2025; plus, in each case, the sum of any unpaid distributions on the applicable Series D Preferred Unit plus the distributions prorated for the number of days elapsed (not to exceed 90) in the period of redemption (Series D Partial Period Distributions). The holders have the option to convert the units prior to such redemption as discussed above.
Additionally, at any time on or after June 29, 2028, each holder of Series D Preferred Units will have the right to require the Partnership to redeem all of the Series D Preferred Units held by such holder at a redemption price equal to $29.19 per Series D Preferred Unit plus any unpaid Series D distributions plus the Series D Partial Period Distributions. If a holder of Series D Preferred Units exercises its redemption right, the Partnership may elect to pay up to 50% of such amount in common units (which shall be valued at 93% of a volume-weighted average trading price of the common units); provided, that the common units to be issued do not, in the aggregate, exceed 15% of NuStar Energy’s common equity market capitalization at the time.
Series D Preferred Units Change of Control
Upon certain events involving a change of control, each holder of the Series D Preferred Units may elect to: (i) convert its Series D Preferred Units into common units on a one-for-one basis, plus any unpaid Series D distributions; (ii) require the Partnership to redeem its Series D Preferred Units for an amount equal to the sum of (a) $29.82 per Series D Preferred Unit plus (b) any unpaid Series D distributions plus (c) the applicable distribution amount for the distribution periods ending after the change of control event and prior to (but including) the fourth anniversary of the Initial Closing; (iii) if the Partnership is the surviving entity and its common units continue to be listed, continue to hold its Series D Preferred Units; or (iv) if the Partnership will not be the surviving entity, or it will be the surviving entity but its common units will cease to be listed, require the Partnership to use its commercially reasonable efforts to deliver a security in the surviving entity that has substantially similar terms as the Series D Preferred Units; however, if the Partnership is unable to deliver a mirror security, each holder is still entitled to option (i) or (ii) above.
19
NUSTAR ENERGY L.P. AND SUBSIDIARIES
CONDENSED NOTES TO CONSOLIDATED FINANCIAL STATEMENTS – (Continued)
Registration Rights Agreement
On June 29, 2018, in connection with the Initial Closing and pursuant to the Series D Preferred Unit Purchase Agreement, the Partnership entered into a Registration Rights Agreement (the Registration Rights Agreement) with the Purchasers relating to the registration of the Series D Preferred Units and common units issuable upon conversion of the Series D Preferred Units (the Common Unit Registrable Securities, and, collectively with the Series D Preferred Units, the Registrable Securities). Pursuant to the Registration Rights Agreement, the Partnership is required to use its commercially reasonable efforts to file a registration statement and to cause such registration statement to become effective: (i) with respect to the Common Unit Registrable Securities, no later than one year after the Initial Closing; and (ii) with respect to the Series D Preferred Units, no later than one year after receipt by the Partnership after the second anniversary of the Initial Closing of a written request from holders holding a majority of the Series D Preferred Units to register the Series D Preferred Units. If the Partnership fails to cause such registration statements to become effective by such dates, the Partnership will be required to pay certain amounts to the holders of the Registrable Securities as liquidated damages.
Series D Preferred Units Accounting Treatment
The Series D Preferred Units include redemption provisions at the option of the holders of the Series D Preferred Units and upon a Series D Change of Control (as defined in the partnership agreement), which are outside the Partnership’s control. Therefore, they are presented in the mezzanine section of the consolidated balance sheets. The Series D Preferred Units have been recorded at their issuance date fair value, net of issuance costs. We reassess the presentation of the Series D Preferred Units in our consolidated balance sheets on a quarterly basis.
The Series D Preferred Units are subject to accretion from their carrying value at the issuance date to the redemption value, which is based on the redemption right of the Series D Preferred Unit holders that may be exercised at any time on or after June 29, 2028, using the effective interest method over a period of ten years. The accretion will be treated in the same manner as a distribution and deducted from net income to arrive at net income attributable to common units.
12. PARTNERS' EQUITY
Please refer to Note 2 for a discussion of the Merger.
Issuance of Common Units
On June 29, 2018, we issued 413,736 common units at a price of $24.17 per unit to William E. Greehey, Chairman of the Board of Directors of NuStar GP, LLC. We used the proceeds of approximately $10.0 million from the sale of these units for general partnership purposes.
Partners’ Equity Activity
The following table summarizes changes to our partners’ equity, which excludes the Series D Preferred Units, (in thousands of dollars):
Balance as of January 1, 2018 | $ | 2,480,089 | |
Net income | 155,320 | ||
Unit-based compensation | 3,051 | ||
Other comprehensive income | 18,303 | ||
Distributions to partners | (204,347 | ) | |
Issuance of common units, including contribution from general partner | 10,204 | ||
Other | (6,143 | ) | |
Balance as of June 30, 2018 | $ | 2,456,477 | |
20
NUSTAR ENERGY L.P. AND SUBSIDIARIES
CONDENSED NOTES TO CONSOLIDATED FINANCIAL STATEMENTS – (Continued)
Cash Distributions
General Partner and Common Limited Partners. We make quarterly distributions to common unitholders, and, prior to the Merger, the general partner of 100% of our available cash, generally defined as cash receipts less cash disbursements, including distributions to our preferred units, and cash reserves established by the general partner, in its sole discretion. These quarterly distributions are declared and paid within 45 days subsequent to each quarter-end. The common unitholders receive a distribution each quarter as determined by the board of directors, subject to limitation by the distributions in arrears, if any, on our preferred units. Prior to the Merger, our available cash was distributed based on the percentages shown below:
Percentage of Distribution | ||||
Quarterly Distribution Amount per Common Unit | Common Unitholders | General Partner Including Incentive Distributions | ||
Up to $0.60 | 98% | 2% | ||
Above $0.60 up to $0.66 | 90% | 10% | ||
Above $0.66 | 75% | 25% | ||
The general partner was not allocated distributions for the second quarter of 2018 as a result of the Merger, which was effective prior to the record date for the second quarter distribution. The common limited partners’ distribution for the second quarter of 2018 includes the additional common units issued in exchange for previously outstanding NSH units pursuant to the terms of the Merger Agreement because the Merger closed prior to the common unit distribution record date. The general partner did not receive incentive distributions for the first quarter of 2018 because the distribution declared for the first quarter was $0.60 per common unit. The following table reflects the allocation of total cash distributions to the general partner and common limited partners applicable to the period in which the distributions were earned:
Three Months Ended June 30, | Six Months Ended June 30, | ||||||||||||||
2018 | 2017 | 2018 | 2017 | ||||||||||||
(Thousands of Dollars, Except Per Unit Data) | |||||||||||||||
General partner interest | $ | — | $ | 2,302 | $ | 1,141 | $ | 4,645 | |||||||
General partner incentive distribution | — | 10,912 | — | 23,824 | |||||||||||
Total general partner distribution | — | 13,214 | 1,141 | 28,469 | |||||||||||
Common limited partners’ distribution | 64,205 | 101,869 | 120,121 | 203,782 | |||||||||||
Total cash distributions | $ | 64,205 | $ | 115,083 | $ | 121,262 | $ | 232,251 | |||||||
Cash distributions per unit applicable to common limited partners | $ | 0.60 | $ | 1.095 | $ | 1.200 | $ | 2.190 | |||||||
The following table summarizes information about our quarterly cash distributions to our general partner and common limited partners:
Quarter Ended | Cash Distributions Per Unit | Total Cash Distributions | Record Date | Payment Date | ||||||||
(Thousands of Dollars) | ||||||||||||
June 30, 2018 | $ | 0.600 | $ | 64,205 | August 7, 2018 | August 13, 2018 | ||||||
March 31, 2018 | $ | 0.600 | $ | 57,057 | May 8, 2018 | May 14, 2018 | ||||||
December 31, 2017 | $ | 1.095 | $ | 115,267 | February 8, 2018 | February 13, 2018 | ||||||
21
NUSTAR ENERGY L.P. AND SUBSIDIARIES
CONDENSED NOTES TO CONSOLIDATED FINANCIAL STATEMENTS – (Continued)
Preferred Units. The following table summarizes information about our cash distributions on our 8.50% Series A, 7.625% Series B and 9.00% Series C Fixed-to-Floating Rate Cumulative Redeemable Perpetual Preferred Units:
Period | Cash Distributions Per Unit | Total Cash Distributions | Record Date | Payment Date | ||||||||
(Thousands of Dollars) | ||||||||||||
Series A Preferred Units: | ||||||||||||
June 15, 2018 - September 14, 2018 | $ | 0.53125 | $ | 4,813 | September 4, 2018 | September 17, 2018 | ||||||
March 15, 2018 - June 14, 2018 | $ | 0.53125 | $ | 4,813 | June 1, 2018 | June 15, 2018 | ||||||
December 15, 2017 - March 14, 2018 | $ | 0.53125 | $ | 4,813 | March 1, 2018 | March 15, 2018 | ||||||
Series B Preferred Units: | ||||||||||||
June 15, 2018 to September 14, 2018 | $ | 0.47657 | $ | 7,339 | September 4, 2018 | September 17, 2018 | ||||||
March 15, 2018 to June 14, 2018 | $ | 0.47657 | $ | 7,339 | June 1, 2018 | June 15, 2018 | ||||||
December 15, 2017 to March 14, 2018 | $ | 0.47657 | $ | 7,339 | March 1, 2018 | March 15, 2018 | ||||||
Series C Preferred Units: | ||||||||||||
June 15, 2018 to September 14, 2018 | $ | 0.56250 | $ | 3,881 | September 4, 2018 | September 17, 2018 | ||||||
March 15, 2018 to June 14, 2018 | $ | 0.56250 | $ | 3,881 | June 1, 2018 | June 15, 2018 | ||||||
November 30, 2017 - March 14, 2018 | $ | 0.65625 | $ | 4,528 | March 1, 2018 | March 15, 2018 | ||||||
Allocations of Net Income
Our partnership agreement sets forth the calculation to be used to determine the amount and priority of cash distributions that the unitholders will receive and, prior to the Merger, the general partner received. The partnership agreement also contains provisions for the allocation of net income to the unitholders and, prior to the Merger, to the general partner. Our net income for each quarterly reporting period is first allocated to the preferred limited partner unitholders in an amount equal to the earned distributions for the respective reporting period and, prior to the Merger, then to the general partner in an amount equal to the general partner’s incentive distribution calculated based upon the declared distribution for the respective reporting period. Prior to the Merger, we allocated the remaining net income or loss among the common unitholders (98%) and general partner (2%), as set forth in our partnership agreement.
The following table details the calculation of net income applicable to the general partner:
Three Months Ended June 30, | Six Months Ended June 30, | ||||||||||||||
2018 | 2017 | 2018 | 2017 | ||||||||||||
(Thousands of Dollars, Except Percentage Data) | |||||||||||||||
Net income | $ | 29,399 | $ | 26,250 | $ | 155,532 | $ | 84,190 | |||||||
Less preferred limited partner interest | 16,245 | 9,950 | 32,235 | 14,763 | |||||||||||
Less general partner incentive distribution | — | 10,912 | — | 23,824 | |||||||||||
Net income after preferred limited partner interest and general partner incentive distribution | 13,154 | 5,388 | 123,297 | 45,603 | |||||||||||
General partner interest allocation | 2 | % | 2 | % | 2 | % | 2 | % | |||||||
General partner interest allocation of net income | 263 | 108 | 2,466 | 912 | |||||||||||
General partner incentive distribution | — | 10,912 | — | 23,824 | |||||||||||
Net income applicable to general partner | $ | 263 | $ | 11,020 | $ | 2,466 | $ | 24,736 | |||||||
22
NUSTAR ENERGY L.P. AND SUBSIDIARIES
CONDENSED NOTES TO CONSOLIDATED FINANCIAL STATEMENTS – (Continued)
Accumulated Other Comprehensive Income (Loss)
The balance of and changes in the components included in AOCI were as follows:
Foreign Currency Translation | Cash Flow Hedges | Pension and Other Postretirement Benefits | Total | ||||||||||||
(Thousands of Dollars) | |||||||||||||||
Balance as of January 1, 2018 | $ | (51,603 | ) | $ | (24,304 | ) | $ | (9,020 | ) | $ | (84,927 | ) | |||
Other comprehensive (loss) income: | |||||||||||||||
Other comprehensive (loss) income before reclassification adjustments | (6,379 | ) | 22,527 | — | 16,148 | ||||||||||
Net gain on pension costs reclassified into other income, net | — | — | (407 | ) | (407 | ) | |||||||||
Net loss on cash flow hedges reclassified into interest expense, net | — | 2,552 | — | 2,552 | |||||||||||
Other | 60 | — | (50 | ) | 10 | ||||||||||
Other comprehensive (loss) income | (6,319 | ) | 25,079 | (457 | ) | 18,303 | |||||||||
Balance as of June 30, 2018 | $ | (57,922 | ) | $ | 775 | $ | (9,477 | ) | $ | (66,624 | ) | ||||
13. REVENUE FROM CONTRACTS WITH CUSTOMERS
Transition
On January 1, 2018, we adopted Accounting Standards Codification Topic 606, “Revenue from Contracts with Customers”
(ASC Topic 606) using the modified retrospective method and applying ASC Topic 606 to all revenue contracts with customers. Results for reporting periods beginning after January 1, 2018 are presented under ASC Topic 606. In accordance with the modified retrospective approach, prior period amounts were not adjusted and are reported under ASC Topic 605, “Revenue Recognition.” The adoption of ASC Topic 606 affected our consolidated statements of comprehensive income as follows:
As Reported | Without Adoption of ASC Topic 606 | Effect of Change Higher/(Lower) | |||||||||
(Thousands of Dollars, Except Per Unit Data) | |||||||||||
For the three months ended June 30, 2018: | |||||||||||
Revenues | $ | 486,204 | $ | 484,646 | $ | 1,558 | |||||
Operating income | $ | 79,838 | $ | 78,280 | $ | 1,558 | |||||
Net income | $ | 29,399 | $ | 27,841 | $ | 1,558 | |||||
Basic net income per common unit | $ | 0.15 | $ | 0.13 | $ | 0.02 | |||||
For the six months ended June 30, 2018: | |||||||||||
Revenues | $ | 962,085 | $ | 966,432 | $ | (4,347 | ) | ||||
Operating income | $ | 178,318 | $ | 182,665 | $ | (4,347 | ) | ||||
Net income | $ | 155,532 | $ | 159,879 | $ | (4,347 | ) | ||||
Basic net income per common unit | $ | 1.30 | $ | 1.34 | $ | (0.04 | ) | ||||
Revenue-Generating Activities
Revenues for the pipeline segment are derived from interstate and intrastate pipeline transportation of refined products, crude oil and anhydrous ammonia and the applicable pipeline tariff.
Revenues for the storage segment include fees for tank storage agreements, whereby a customer agrees to pay for a certain amount of storage in a tank over a period of time (storage terminal revenues), and throughput agreements, whereby a customer pays a fee per barrel for volumes moving through our terminals (throughput terminal revenues). Our terminals also provide blending, additive injections, handling and filtering services for which we charge additional fees, and certain of our facilities charge fees to provide marine services such as pilotage, tug assistance, line handling, launch service, emergency response services and other ship services (all of which are considered optional services).
23
NUSTAR ENERGY L.P. AND SUBSIDIARIES
CONDENSED NOTES TO CONSOLIDATED FINANCIAL STATEMENTS – (Continued)
Revenues for the fuels marketing segment are derived from the sale of petroleum products.
Within our pipeline and storage segments, we provide services on an uninterruptible and interruptible basis. Uninterruptible services within our pipeline segment typically result from contracts that contain take-or-pay minimum volume commitments (MVCs) from the customer. Contracts with MVCs obligate the customer to pay for that minimum amount. If a customer fails to meet its MVC for the applicable service period, the customer is obligated to pay a deficiency fee based upon the shortfall between the actual volumes transported or stored and the MVC for that service period (deficiency payments). In exchange, those contracts with MVCs obligate us to stand ready to transport volumes up to the customer’s MVC.
Within our storage segment, uninterruptible services arise from contracts containing a fixed monthly fee for the portion of storage capacity reserved by the customer. These contracts require that the customer pay the fixed monthly fee, regardless of whether or not it uses our storage facility (i.e., take-or-pay obligation), and that we stand ready to store that volume.
Interruptible services within our pipeline and storage segments are generally provided when and to the extent we determine the requested capacity is available. The customer typically pays a per-unit rate for the actual quantities of services it receives.
Revenue Recognition
After identifying a contract with a customer, ASC Topic 606 requires us to (i) identify the performance obligations in the contract; (ii) determine the transaction price; (iii) allocate the transaction price to the performance obligations; and (iv) recognize revenue when or as we satisfy a performance obligation. For the majority of our contracts, we recognize revenue in the amount to which we have a right to invoice. Generally, payment terms do not exceed 30 days.
Performance Obligations. The majority of our contracts contain a single performance obligation. For our pipeline segment, the single performance obligation encompasses multiple activities necessary to deliver our customers’ products to their destinations. Typically, we satisfy this performance obligation over time as the product volume is delivered in or out of the pipelines. Similarly, the performance obligation for our storage segment consists of multiple activities necessary to receive, store and deliver our customers’ products. We typically satisfy this performance obligation over time as the product volume is delivered in or out of the tanks (for throughput terminal revenues) or with the passage of time (for storage terminal revenues).
Certain of our pipeline segment customer contracts include an incentive pricing structure, which provides a discounted rate for the remainder of the contract once the customer exceeds a cumulative volume. The ability to receive discounted future services represents a material right to the customer, which results in a second performance obligation in those contracts.
Product sales contracts associated with our fuels marketing segment generally include a single performance obligation to deliver specified volumes of a commodity, which we satisfy at a point in time, when the product is delivered and the customer obtains control of the commodity.
Optional services do not provide a material right to the customer, and are not considered a separate performance obligation in the contract. If and when a customer elects an optional service, it becomes part of the existing performance obligation.
Transaction Price. For uninterruptible services, we determine the transaction price at contract inception based on the guaranteed minimum amount of revenue over the term of the contract. For interruptible services and optional services, we determine the transaction price based on our right to invoice the customer for the value of services provided to the customer for the applicable period.
In certain instances, our customers reimburse us for capital projects, in arrangements referred to as contributions in aid of construction, or CIAC. Typically, in these instances, we receive upfront payments for future services, which are included in the transaction price of the underlying service contract.
We collect taxes on certain revenue transactions to be remitted to governmental authorities, which may include sales, use, value-added and some excise taxes. These taxes are not included in the transaction price and are, therefore, excluded from revenues.
Allocation of Transaction Price. We allocate the transaction price to the single performance obligation that exists in the vast majority of our contracts with customers. For the few contracts that have a second performance obligation, such as those that
24
NUSTAR ENERGY L.P. AND SUBSIDIARIES
CONDENSED NOTES TO CONSOLIDATED FINANCIAL STATEMENTS – (Continued)
include an incentive pricing structure, we calculate an average rate based on the estimated total volumes to be delivered over the term of the contract and the resulting estimated total revenue to be billed using the applicable rates in the contract. We allocate the transaction price to the two performance obligations by applying the average rate to product volumes as they are delivered to the customer over the term of the contract. Determining the timing and amount of volumes subject to these incentive pricing contracts requires judgment that can impact the amount of revenue allocated to the two separate performance obligations. We base our estimates on our analysis of expected future production information available from our customers or other sources, which we update at least quarterly.
Some of our MVC contracts include provisions that allow the customer to apply deficiency payments to future service periods (the carryforward period). In those instances, we have not satisfied our performance obligation as we still have the obligation to perform those services, subject to contractual and/or capacity constraints, at the customer’s request. At least quarterly, we assess the customer’s ability to utilize any deficiency payments during the carryforward period. If we receive a deficiency payment from a customer that we expect the customer to utilize during the carryforward period, we defer that amount as a contract liability. We will consider the performance obligation satisfied and allocate any deferred deficiency payments to our performance obligation when the customer utilizes the deficiency payment, the carryforward period ends or we determine the customer cannot or will not utilize the deficiency payment (i.e. breakage). If our contract does not allow the customer to apply deficiency payments to future service periods, we allocate the deficiency payment to the already satisfied portion of the performance obligation.
Contract Assets and Liabilities
The following table provides information about contract assets and contract liabilities from contracts with customers:
Contract Assets | Contract Liabilities | ||||||
(Thousands of Dollars) | |||||||
Balance as of January 1, 2018 | $ | 2,127 | $ | (60,464 | ) | ||
Additions | 879 | (20,820 | ) | ||||
Transfer to accounts receivable | (2,397 | ) | — | ||||
Transfer to revenues | — | 28,466 | |||||
Total activity | (1,518 | ) | 7,646 | ||||
Balance as of June 30, 2018 | 609 | (52,818 | ) | ||||
Less current portion | 327 | (18,149 | ) | ||||
Noncurrent portion | $ | 282 | $ | (34,669 | ) | ||
Contract assets relate to performance obligations satisfied in advance of scheduled billings. Current contract assets are included in “Other current assets” and noncurrent contract assets are included in “Other long-term assets, net” on the consolidated balance sheet. Contract liabilities relate to payments received in advance of satisfying performance obligations under a contract, which mainly result from contracts with MVCs, contracts with an incentive pricing structure and CIAC payments. Current contract liabilities are included in “Accrued liabilities” and noncurrent contract liabilities are included in “Other long-term liabilities” on the consolidated balance sheet.
In the second quarter of 2018, our customer, for whom we had recorded a contract liability to perform future services, elected not to extend the term of its terminal storage contract, thus reducing our future performance obligation. As a result, we adjusted the related contract liability and recognized $9.0 million in revenue.
25
NUSTAR ENERGY L.P. AND SUBSIDIARIES
CONDENSED NOTES TO CONSOLIDATED FINANCIAL STATEMENTS – (Continued)
Remaining Performance Obligations
The following table presents our estimated revenue from contracts with customers for remaining performance obligations that has not yet been recognized, representing our contractually committed revenue as of June 30, 2018 (in thousands of dollars):
2018 (remaining) | $ | 260,929 | ||
2019 | 377,617 | |||
2020 | 229,327 | |||
2021 | 168,290 | |||
2022 | 130,220 | |||
Thereafter | 412,921 | |||
Total | $ | 1,579,304 | ||
Our contractually committed revenue, for purposes of the tabular presentation above, is generally limited to service customer contracts that have fixed pricing and fixed volume terms and conditions, generally including contracts with minimum volume commitment payment obligations.
Disaggregation of Revenue
The following table disaggregates our revenues:
Three Months Ended June 30, | Six Months Ended June 30, | ||||||||||||||
2018 | 2017 | 2018 | 2017 | ||||||||||||
(Thousands of Dollars) | |||||||||||||||
Pipeline segment: | |||||||||||||||
Crude oil pipelines (excluding lessor revenues) | $ | 60,507 | $ | 47,039 | $ | 113,944 | $ | 83,786 | |||||||
Refined products and ammonia pipelines | 89,769 | 79,701 | 173,068 | 164,194 | |||||||||||
Total pipeline segment revenues from contracts with customers | 150,276 | 126,740 | 287,012 | 247,980 | |||||||||||
Lessor revenues | — | — | 54 | — | |||||||||||
Total pipeline segment revenues | 150,276 | 126,740 | 287,066 | 247,980 | |||||||||||
Storage segment: | |||||||||||||||
Throughput terminals | 20,141 | 22,122 | 40,157 | 42,812 | |||||||||||
Storage terminals (excluding lessor revenues) | 127,347 | 126,655 | 252,697 | 243,615 | |||||||||||
Total storage segment revenues from contracts with customers | 147,488 | 148,777 | 292,854 | 286,427 | |||||||||||
Lessor revenues | 9,962 | 9,782 | 19,924 | 19,563 | |||||||||||
Total storage segment revenues | 157,450 | 158,559 | 312,778 | 305,990 | |||||||||||
Fuels marketing segment revenues from contracts with customers | 180,483 | 153,918 | 366,321 | 376,620 | |||||||||||
Consolidation and intersegment eliminations | (2,005 | ) | (3,729 | ) | (4,080 | ) | (7,672 | ) | |||||||
Total revenues | $ | 486,204 | $ | 435,488 | $ | 962,085 | $ | 922,918 | |||||||
26
NUSTAR ENERGY L.P. AND SUBSIDIARIES
CONDENSED NOTES TO CONSOLIDATED FINANCIAL STATEMENTS – (Continued)
14. NET INCOME PER COMMON UNIT
Basic net income per common unit is determined pursuant to the two-class method. Under this method, all earnings are allocated to our limited partners and participating securities based on their respective rights to receive distributions earned during the period. Participating securities include restricted units awarded under our long-term incentive plan and, prior to the Merger, included our general partner’s interest. We compute basic net income per common unit by dividing net income attributable to common units by the weighted-average number of common units outstanding during the period.
As discussed in Note 11, the Series D Preferred Units are convertible into common units at the option of the holder at any time on or after June 29, 2028, and, as such, we calculated the dilutive effect of the Series D Preferred Units using the if-converted method. For the three and six months ended June 30, 2018, the effect of the assumed conversion of the 15,760,441 Series D Preferred Units outstanding as of June 30, 2018 was antidilutive and, therefore, we did not include such conversion in the computation of diluted net income per common unit.
The following table details the calculation of net income per common unit:
Three Months Ended June 30, | Six Months Ended June 30, | ||||||||||||||
2018 | 2017 | 2018 | 2017 | ||||||||||||
(Thousands of Dollars, Except Unit and Per Unit Data) | |||||||||||||||
Net income | $ | 29,399 | $ | 26,250 | $ | 155,532 | $ | 84,190 | |||||||
Less: Distributions to preferred limited partners | 16,245 | 9,950 | 32,235 | 14,763 | |||||||||||
Less: Distributions to general partner (including incentive distribution rights) | — | 13,214 | 1,141 | 28,469 | |||||||||||
Less: Distributions to common limited partners | 64,205 | 101,869 | 120,121 | 203,782 | |||||||||||
Less: Distribution equivalent rights to restricted units | 480 | 712 | 925 | 1,427 | |||||||||||
Distributions (in excess of) less than earnings | $ | (51,531 | ) | $ | (99,495 | ) | $ | 1,110 | $ | (164,251 | ) | ||||
Net income attributable to common units: | |||||||||||||||
Distributions to common limited partners | $ | 64,205 | $ | 101,869 | $ | 120,121 | $ | 203,782 | |||||||
Allocation of distributions (in excess of) less than earnings | (50,500 | ) | (97,505 | ) | 1,079 | (160,966 | ) | ||||||||
Total | $ | 13,705 | $ | 4,364 | $ | 121,200 | $ | 42,816 | |||||||
Basic weighted-average common units outstanding | 93,192,238 | 90,345,469 | 93,187,038 | 84,526,506 | |||||||||||
Basic net income per common unit | $ | 0.15 | $ | 0.05 | $ | 1.30 | $ | 0.51 | |||||||
27
NUSTAR ENERGY L.P. AND SUBSIDIARIES
CONDENSED NOTES TO CONSOLIDATED FINANCIAL STATEMENTS – (Continued)
15. STATEMENTS OF CASH FLOWS
Changes in current assets and current liabilities were as follows:
Six Months Ended June 30, | |||||||
2018 | 2017 | ||||||
(Thousands of Dollars) | |||||||
Decrease (increase) in current assets: | |||||||
Accounts receivable | $ | 34,518 | $ | 48,875 | |||
Receivable from related party | 130 | 231 | |||||
Inventories | (1,233 | ) | 13,005 | ||||
Other current assets | (2,494 | ) | (2,388 | ) | |||
Increase (decrease) in current liabilities: | |||||||
Accounts payable | 5,149 | (57,822 | ) | ||||
Accrued interest payable | (4,325 | ) | 6,234 | ||||
Accrued liabilities | 10,476 | (14,703 | ) | ||||
Taxes other than income tax | 1,329 | (3,094 | ) | ||||
Income tax payable | (817 | ) | (5,682 | ) | |||
Changes in current assets and current liabilities | $ | 42,733 | $ | (15,344 | ) | ||
The above changes in current assets and current liabilities differ from changes between amounts reflected in the applicable consolidated balance sheets due to:
• | current assets and current liabilities acquired during the period; |
• | the change in the amount accrued for capital expenditures; |
• | the effect of foreign currency translation; and |
• | changes in the fair values of our interest rate swap agreements. |
Cash flows related to interest and income taxes were as follows:
Six Months Ended June 30, | |||||||
2018 | 2017 | ||||||
(Thousands of Dollars) | |||||||
Cash paid for interest, net of amount capitalized | $ | 96,761 | $ | 70,119 | |||
Cash paid for income taxes, net of tax refunds received | $ | 7,973 | $ | 9,556 | |||
16. SEGMENT INFORMATION
Our reportable business segments consist of the pipeline, storage and fuels marketing segments. Our segments represent strategic business units that offer different services and products. We evaluate the performance of each segment based on its respective operating income, before general and administrative expenses and certain non-segmental depreciation and amortization expense. General and administrative expenses are not allocated to the operating segments since those expenses relate primarily to the overall management at the entity level. Our principal operations include the transportation of petroleum products and anhydrous ammonia, and the terminalling, storage and marketing of petroleum products. Intersegment revenues result from storage agreements with wholly owned subsidiaries of NuStar Energy at rates consistent with the rates charged to third parties for storage.
28
NUSTAR ENERGY L.P. AND SUBSIDIARIES
CONDENSED NOTES TO CONSOLIDATED FINANCIAL STATEMENTS – (Continued)
Results of operations for the reportable segments were as follows:
Three Months Ended June 30, | Six Months Ended June 30, | ||||||||||||||
2018 | 2017 | 2018 | 2017 | ||||||||||||
(Thousands of Dollars) | |||||||||||||||
Revenues: | |||||||||||||||
Pipeline | $ | 150,276 | $ | 126,740 | $ | 287,066 | $ | 247,980 | |||||||
Storage: | |||||||||||||||
Third parties | 155,445 | 154,830 | 308,698 | 298,318 | |||||||||||
Intersegment | 2,005 | 3,729 | 4,080 | 7,672 | |||||||||||
Total storage | 157,450 | 158,559 | 312,778 | 305,990 | |||||||||||
Fuels marketing | 180,483 | 153,918 | 366,321 | 376,620 | |||||||||||
Consolidation and intersegment eliminations | (2,005 | ) | (3,729 | ) | (4,080 | ) | (7,672 | ) | |||||||
Total revenues | $ | 486,204 | $ | 435,488 | $ | 962,085 | $ | 922,918 | |||||||
Operating income: | |||||||||||||||
Pipeline | $ | 62,979 | $ | 52,868 | $ | 120,773 | $ | 117,896 | |||||||
Storage | 44,184 | 56,049 | 100,445 | 109,808 | |||||||||||
Fuels marketing | 2,904 | 289 | 9,224 | 5,429 | |||||||||||
Consolidation and intersegment eliminations | 3 | 1 | — | 1 | |||||||||||
Total segment operating income | 110,070 | 109,207 | 230,442 | 233,134 | |||||||||||
General and administrative expenses | 27,981 | 33,604 | 47,755 | 58,199 | |||||||||||
Other depreciation and amortization expense | 2,251 | 2,199 | 4,369 | 4,392 | |||||||||||
Total operating income | $ | 79,838 | $ | 73,404 | $ | 178,318 | $ | 170,543 | |||||||
Total assets by reportable segment were as follows:
June 30, 2018 | December 31, 2017 | ||||||
(Thousands of Dollars) | |||||||
Pipeline | $ | 3,581,710 | $ | 3,492,417 | |||
Storage | 2,754,290 | 2,735,563 | |||||
Fuels marketing | 118,119 | 118,746 | |||||
Total segment assets | 6,454,119 | 6,346,726 | |||||
Other partnership assets | 192,850 | 188,507 | |||||
Total consolidated assets | $ | 6,646,969 | $ | 6,535,233 | |||
29
NUSTAR ENERGY L.P. AND SUBSIDIARIES
CONDENSED NOTES TO CONSOLIDATED FINANCIAL STATEMENTS – (Continued)
17. CONDENSED CONSOLIDATING FINANCIAL STATEMENTS
NuStar Energy has no operations, and its assets consist mainly of its 100% indirectly owned subsidiaries, NuStar Logistics and NuPOP. The senior and subordinated notes issued by NuStar Logistics are fully and unconditionally guaranteed by NuStar Energy and NuPOP. As a result, the following condensed consolidating financial statements are presented as an alternative to providing separate financial statements for NuStar Logistics and NuPOP.
Condensed Consolidating Balance Sheets
June 30, 2018
(Thousands of Dollars)
NuStar Energy | NuStar Logistics | NuPOP | Non-Guarantor Subsidiaries | Eliminations | Consolidated | ||||||||||||||||||
Assets | |||||||||||||||||||||||
Cash and cash equivalents | $ | 896 | $ | 1,777 | $ | — | $ | 17,671 | $ | — | $ | 20,344 | |||||||||||
Receivables, net | 204 | 61 | — | 141,886 | — | 142,151 | |||||||||||||||||
Inventories | — | 1,913 | 8,408 | 17,750 | — | 28,071 | |||||||||||||||||
Other current assets | 78 | 16,119 | 1,838 | 8,491 | — | 26,526 | |||||||||||||||||
Intercompany receivable | 56,954 | 2,825,858 | — | — | (2,882,812 | ) | — | ||||||||||||||||
Total current assets | 58,132 | 2,845,728 | 10,246 | 185,798 | (2,882,812 | ) | 217,092 | ||||||||||||||||
Property, plant and equipment, net | — | 1,857,862 | 622,399 | 1,979,420 | — | 4,459,681 | |||||||||||||||||
Intangible assets, net | — | 53,819 | — | 704,948 | — | 758,767 | |||||||||||||||||
Goodwill | — | 149,453 | 170,652 | 774,556 | — | 1,094,661 | |||||||||||||||||
Investment in wholly owned subsidiaries | 2,837,072 | 20,557 | 1,436,981 | 861,102 | (5,155,712 | ) | — | ||||||||||||||||
Other long-term assets, net | 3,391 | 73,591 | 26,944 | 12,842 | — | 116,768 | |||||||||||||||||
Total assets | $ | 2,898,595 | $ | 5,001,010 | $ | 2,267,222 | $ | 4,518,666 | $ | (8,038,524 | ) | $ | 6,646,969 | ||||||||||
Liabilities, Mezzanine Equity and Partners’ Equity | |||||||||||||||||||||||
Accounts payable | $ | 4,169 | $ | 25,949 | $ | 6,810 | $ | 90,873 | $ | — | $ | 127,801 | |||||||||||
Short-term debt | — | 63,000 | — | — | — | 63,000 | |||||||||||||||||
Accrued interest payable | — | 36,144 | — | 48 | — | 36,192 | |||||||||||||||||
Accrued liabilities | 608 | 21,666 | 8,016 | 34,429 | — | 64,719 | |||||||||||||||||
Taxes other than income tax | 6 | 5,368 | 4,828 | 6,018 | — | 16,220 | |||||||||||||||||
Income tax payable | — | 231 | — | 3,126 | — | 3,357 | |||||||||||||||||
Intercompany payable | — | — | 1,372,863 | 1,509,949 | (2,882,812 | ) | — | ||||||||||||||||
Total current liabilities | 4,783 | 152,358 | 1,392,517 | 1,644,443 | (2,882,812 | ) | 311,289 | ||||||||||||||||
Long-term debt, less current portion | — | 3,324,389 | — | 55,977 | — | 3,380,366 | |||||||||||||||||
Deferred income tax liability | — | 1,262 | 12 | 21,839 | — | 23,113 | |||||||||||||||||
Other long-term liabilities | — | 44,622 | 13,793 | 46,598 | — | 105,013 | |||||||||||||||||
Series D preferred units | 370,711 | — | — | — | — | 370,711 | |||||||||||||||||
Total partners’ equity | 2,523,101 | 1,478,379 | 860,900 | 2,749,809 | (5,155,712 | ) | 2,456,477 | ||||||||||||||||
Total liabilities, mezzanine equity and partners’ equity | $ | 2,898,595 | $ | 5,001,010 | $ | 2,267,222 | $ | 4,518,666 | $ | (8,038,524 | ) | $ | 6,646,969 | ||||||||||
30
NUSTAR ENERGY L.P. AND SUBSIDIARIES
CONDENSED NOTES TO CONSOLIDATED FINANCIAL STATEMENTS – (Continued)
Condensed Consolidating Balance Sheets
December 31, 2017
(Thousands of Dollars)
NuStar Energy | NuStar Logistics | NuPOP | Non-Guarantor Subsidiaries | Eliminations | Consolidated | ||||||||||||||||||
Assets | |||||||||||||||||||||||
Cash and cash equivalents | $ | 885 | $ | 29 | $ | — | $ | 23,378 | $ | — | $ | 24,292 | |||||||||||
Receivables, net | — | 280 | — | 176,495 | — | 176,775 | |||||||||||||||||
Inventories | — | 1,686 | 8,611 | 16,560 | — | 26,857 | |||||||||||||||||
Other current assets | 61 | 11,412 | 4,191 | 6,844 | — | 22,508 | |||||||||||||||||
Intercompany receivable | — | 3,112,164 | — | — | (3,112,164 | ) | — | ||||||||||||||||
Total current assets | 946 | 3,125,571 | 12,802 | 223,277 | (3,112,164 | ) | 250,432 | ||||||||||||||||
Property, plant and equipment, net | — | 1,893,720 | 591,070 | 1,816,143 | — | 4,300,933 | |||||||||||||||||
Intangible assets, net | — | 58,530 | — | 725,949 | — | 784,479 | |||||||||||||||||
Goodwill | — | 149,453 | 170,652 | 777,370 | — | 1,097,475 | |||||||||||||||||
Investment in wholly owned subsidiaries | 2,891,371 | 24,162 | 1,301,717 | 790,882 | (5,008,132 | ) | — | ||||||||||||||||
Deferred income tax asset | — | — | — | 233 | — | 233 | |||||||||||||||||
Other long-term assets, net | 303 | 65,684 | 27,493 | 8,201 | — | 101,681 | |||||||||||||||||
Total assets | $ | 2,892,620 | $ | 5,317,120 | $ | 2,103,734 | $ | 4,342,055 | $ | (8,120,296 | ) | $ | 6,535,233 | ||||||||||
Liabilities and Partners’ Equity | |||||||||||||||||||||||
Accounts payable | $ | 4,078 | $ | 27,642 | $ | 13,160 | $ | 101,052 | $ | — | $ | 145,932 | |||||||||||
Short-term debt | — | 35,000 | — | — | — | 35,000 | |||||||||||||||||
Current portion of long-term debt | — | 349,990 | — | — | — | 349,990 | |||||||||||||||||
Accrued interest payable | — | 40,402 | — | 47 | — | 40,449 | |||||||||||||||||
Accrued liabilities | 1,105 | 17,628 | 9,450 | 33,395 | — | 61,578 | |||||||||||||||||
Taxes other than income tax | 125 | 7,110 | 3,794 | 3,356 | — | 14,385 | |||||||||||||||||
Income tax payable | — | 732 | 4 | 3,436 | — | 4,172 | |||||||||||||||||
Intercompany payable | 322,296 | — | 1,277,691 | 1,512,177 | (3,112,164 | ) | — | ||||||||||||||||
Total current liabilities | 327,604 | 478,504 | 1,304,099 | 1,653,463 | (3,112,164 | ) | 651,506 | ||||||||||||||||
Long-term debt, less current portion | — | 3,201,220 | — | 61,849 | — | 3,263,069 | |||||||||||||||||
Deferred income tax liability | — | 1,262 | 12 | 20,998 | — | 22,272 | |||||||||||||||||
Other long-term liabilities | — | 58,806 | 8,861 | 50,630 | — | 118,297 | |||||||||||||||||
Total partners’ equity | 2,565,016 | 1,577,328 | 790,762 | 2,555,115 | (5,008,132 | ) | 2,480,089 | ||||||||||||||||
Total liabilities and partners’ equity | $ | 2,892,620 | $ | 5,317,120 | $ | 2,103,734 | $ | 4,342,055 | $ | (8,120,296 | ) | $ | 6,535,233 | ||||||||||
31
NUSTAR ENERGY L.P. AND SUBSIDIARIES
CONDENSED NOTES TO CONSOLIDATED FINANCIAL STATEMENTS – (Continued)
Condensed Consolidating Statements of Comprehensive Income
For the Three Months Ended June 30, 2018
(Thousands of Dollars)
NuStar Energy | NuStar Logistics | NuPOP | Non-Guarantor Subsidiaries | Eliminations | Consolidated | ||||||||||||||||||
Revenues | $ | — | $ | 117,862 | $ | 66,505 | $ | 301,984 | $ | (147 | ) | $ | 486,204 | ||||||||||
Costs and expenses | 538 | 86,588 | 42,324 | 277,063 | (147 | ) | 406,366 | ||||||||||||||||
Operating (loss) income | (538 | ) | 31,274 | 24,181 | 24,921 | — | 79,838 | ||||||||||||||||
Equity in earnings of subsidiaries | 29,900 | 1,692 | 23,145 | 45,673 | (100,410 | ) | — | ||||||||||||||||
Interest income (expense), net | 37 | (50,357 | ) | (1,724 | ) | 3,108 | — | (48,936 | ) | ||||||||||||||
Other income (expense), net | — | 1,848 | 73 | (509 | ) | — | 1,412 | ||||||||||||||||
Income (loss) before income tax expense | 29,399 | (15,543 | ) | 45,675 | 73,193 | (100,410 | ) | 32,314 | |||||||||||||||
Income tax expense | — | 61 | — | 2,854 | — | 2,915 | |||||||||||||||||
Net income (loss) | $ | 29,399 | $ | (15,604 | ) | $ | 45,675 | $ | 70,339 | $ | (100,410 | ) | $ | 29,399 | |||||||||
Comprehensive income (loss) | $ | 29,399 | $ | (9,336 | ) | $ | 45,675 | $ | 61,450 | $ | (100,410 | ) | $ | 26,778 | |||||||||
Condensed Consolidating Statements of Comprehensive Income
For the Three Months Ended June 30, 2017
(Thousands of Dollars)
NuStar Energy | NuStar Logistics | NuPOP | Non-Guarantor Subsidiaries | Eliminations | Consolidated | ||||||||||||||||||
Revenues | $ | — | $ | 128,895 | $ | 50,577 | $ | 256,363 | $ | (347 | ) | $ | 435,488 | ||||||||||
Costs and expenses | 486 | 83,096 | 37,781 | 241,068 | (347 | ) | 362,084 | ||||||||||||||||
Operating (loss) income | (486 | ) | 45,799 | 12,796 | 15,295 | — | 73,404 | ||||||||||||||||
Equity in earnings (loss) of subsidiaries | 26,732 | (7,177 | ) | 22,746 | 34,141 | (76,442 | ) | — | |||||||||||||||
Interest income (expense), net | 4 | (46,390 | ) | (1,401 | ) | 2,175 | — | (45,612 | ) | ||||||||||||||
Other income, net | — | 62 | 3 | 23 | — | 88 | |||||||||||||||||
Income (loss) before income tax (benefit) expense | 26,250 | (7,706 | ) | 34,144 | 51,634 | (76,442 | ) | 27,880 | |||||||||||||||
Income tax (benefit) expense | — | (365 | ) | 1 | 1,994 | — | 1,630 | ||||||||||||||||
Net income (loss) | $ | 26,250 | $ | (7,341 | ) | $ | 34,143 | $ | 49,640 | $ | (76,442 | ) | $ | 26,250 | |||||||||
Comprehensive income (loss) | $ | 26,250 | $ | (13,592 | ) | $ | 34,143 | $ | 57,022 | $ | (76,442 | ) | $ | 27,381 | |||||||||
32
NUSTAR ENERGY L.P. AND SUBSIDIARIES
CONDENSED NOTES TO CONSOLIDATED FINANCIAL STATEMENTS – (Continued)
Condensed Consolidating Statements of Comprehensive Income
For the Six Months Ended June 30, 2018
(Thousands of Dollars)
NuStar Energy | NuStar Logistics | NuPOP | Non-Guarantor Subsidiaries | Eliminations | Consolidated | ||||||||||||||||||
Revenues | $ | — | $ | 237,556 | $ | 122,779 | $ | 602,099 | $ | (349 | ) | $ | 962,085 | ||||||||||
Costs and expenses | 1,150 | 159,004 | 77,505 | 546,457 | (349 | ) | 783,767 | ||||||||||||||||
Operating (loss) income | (1,150 | ) | 78,552 | 45,274 | 55,642 | — | 178,318 | ||||||||||||||||
Equity in earnings (loss) of subsidiaries | 156,613 | (557 | ) | 135,148 | 177,312 | (468,516 | ) | — | |||||||||||||||
Interest income (expense), net | 69 | (100,383 | ) | (3,295 | ) | 6,901 | — | (96,708 | ) | ||||||||||||||
Other income, net | — | 2,324 | 188 | 78,652 | — | 81,164 | |||||||||||||||||
Income (loss) before income tax expense | 155,532 | (20,064 | ) | 177,315 | 318,507 | (468,516 | ) | 162,774 | |||||||||||||||
Income tax expense | — | 231 | 1 | 7,010 | — | 7,242 | |||||||||||||||||
Net income (loss) | $ | 155,532 | $ | (20,295 | ) | $ | 177,314 | $ | 311,497 | $ | (468,516 | ) | $ | 155,532 | |||||||||
Comprehensive income | $ | 155,532 | $ | 4,784 | $ | 177,314 | $ | 304,721 | $ | (468,516 | ) | $ | 173,835 | ||||||||||
Condensed Consolidating Statements of Comprehensive Income
For the Six Months Ended June 30, 2017
(Thousands of Dollars)
NuStar Energy | NuStar Logistics | NuPOP | Non-Guarantor Subsidiaries | Eliminations | Consolidated | ||||||||||||||||||
Revenues | $ | — | $ | 252,524 | $ | 102,818 | $ | 568,210 | $ | (634 | ) | $ | 922,918 | ||||||||||
Costs and expenses | 995 | 159,418 | 67,587 | 525,009 | (634 | ) | 752,375 | ||||||||||||||||
Operating (loss) income | (995 | ) | 93,106 | 35,231 | 43,201 | — | 170,543 | ||||||||||||||||
Equity in earnings (loss) of subsidiaries | 85,177 | (6,067 | ) | 48,961 | 81,494 | (209,565 | ) | — | |||||||||||||||
Interest income (expense), net | 8 | (83,304 | ) | (2,705 | ) | 3,975 | — | (82,026 | ) | ||||||||||||||
Other income, net | — | 83 | 9 | 136 | — | 228 | |||||||||||||||||
Income before income tax (benefit) expense | 84,190 | 3,818 | 81,496 | 128,806 | (209,565 | ) | 88,745 | ||||||||||||||||
Income tax (benefit) expense | — | (34 | ) | 2 | 4,587 | — | 4,555 | ||||||||||||||||
Net income | $ | 84,190 | $ | 3,852 | $ | 81,494 | $ | 124,219 | $ | (209,565 | ) | $ | 84,190 | ||||||||||
Comprehensive income (loss) | $ | 84,190 | $ | (561 | ) | $ | 81,494 | $ | 133,526 | $ | (209,565 | ) | $ | 89,084 | |||||||||
33
NUSTAR ENERGY L.P. AND SUBSIDIARIES
CONDENSED NOTES TO CONSOLIDATED FINANCIAL STATEMENTS – (Continued)
Condensed Consolidating Statements of Cash Flows
For the Six Months Ended June 30, 2018
(Thousands of Dollars)
NuStar Energy | NuStar Logistics | NuPOP | Non-Guarantor Subsidiaries | Eliminations | Consolidated | ||||||||||||||||||
Net cash provided by operating activities | $ | 200,803 | $ | 31,209 | $ | 58,105 | $ | 261,300 | $ | (307,567 | ) | $ | 243,850 | ||||||||||
Cash flows from investing activities: | |||||||||||||||||||||||
Capital expenditures | — | (17,136 | ) | (8,164 | ) | (223,221 | ) | — | (248,521 | ) | |||||||||||||
Change in accounts payable related to capital expenditures | — | 495 | (5,173 | ) | (14,642 | ) | — | (19,320 | ) | ||||||||||||||
Proceeds from sale or disposition of assets | — | 1,385 | 16 | 696 | — | 2,097 | |||||||||||||||||
Proceeds from insurance recoveries | — | — | — | 78,419 | — | 78,419 | |||||||||||||||||
Acquisitions | — | — | (37,502 | ) | — | — | (37,502 | ) | |||||||||||||||
Net cash used in investing activities | — | (15,256 | ) | (50,823 | ) | (158,748 | ) | — | (224,827 | ) | |||||||||||||
Cash flows from financing activities: | |||||||||||||||||||||||
Debt borrowings | — | 1,122,272 | — | 11,000 | — | 1,133,272 | |||||||||||||||||
Debt repayments | — | (1,316,621 | ) | — | (16,900 | ) | — | (1,333,521 | ) | ||||||||||||||
Issuance of Series D preferred units | 400,000 | — | — | — | — | 400,000 | |||||||||||||||||
Payment of issuance costs for Series D preferred units | (29,289 | ) | — | — | — | — | (29,289 | ) | |||||||||||||||
Issuance of common units | 10,000 | — | — | — | — | 10,000 | |||||||||||||||||
Distributions to preferred unitholders | (32,713 | ) | (16,356 | ) | (16,357 | ) | (16,358 | ) | 49,071 | (32,713 | ) | ||||||||||||
Distributions to common unitholders and general partner | (172,324 | ) | (86,162 | ) | (86,162 | ) | (86,172 | ) | 258,496 | (172,324 | ) | ||||||||||||
Proceeds from termination of interest rate swaps | — | 8,048 | — | — | — | 8,048 | |||||||||||||||||
Net intercompany activity | (374,973 | ) | 279,080 | 95,237 | 656 | — | — | ||||||||||||||||
Other, net | (1,493 | ) | (4,466 | ) | — | (64 | ) | — | (6,023 | ) | |||||||||||||
Net cash used in financing activities | (200,792 | ) | (14,205 | ) | (7,282 | ) | (107,838 | ) | 307,567 | (22,550 | ) | ||||||||||||
Effect of foreign exchange rate changes on cash | — | — | — | (421 | ) | — | (421 | ) | |||||||||||||||
Net increase (decrease) in cash and cash equivalents | 11 | 1,748 | — | (5,707 | ) | — | (3,948 | ) | |||||||||||||||
Cash and cash equivalents as of the beginning of the period | 885 | 29 | — | 23,378 | — | 24,292 | |||||||||||||||||
Cash and cash equivalents as of the end of the period | $ | 896 | $ | 1,777 | $ | — | $ | 17,671 | $ | — | $ | 20,344 | |||||||||||
34
NUSTAR ENERGY L.P. AND SUBSIDIARIES
CONDENSED NOTES TO CONSOLIDATED FINANCIAL STATEMENTS – (Continued)
Condensed Consolidating Statements of Cash Flows
For the Six Months Ended June 30, 2017
(Thousands of Dollars)
NuStar Energy | NuStar Logistics | NuPOP | Non-Guarantor Subsidiaries | Eliminations | Consolidated | ||||||||||||||||||
Net cash provided by operating activities | $ | 225,566 | $ | 85,203 | $ | 45,790 | $ | 192,692 | $ | (340,263 | ) | $ | 208,988 | ||||||||||
Cash flows from investing activities: | |||||||||||||||||||||||
Capital expenditures | — | (19,639 | ) | (5,588 | ) | (83,622 | ) | — | (108,849 | ) | |||||||||||||
Change in accounts payable related to capital expenditures | — | (2,823 | ) | (35 | ) | 9,709 | — | 6,851 | |||||||||||||||
Proceeds from sale or disposition of assets | — | 1,898 | 12 | 56 | — | 1,966 | |||||||||||||||||
Investment in subsidiaries | (1,262,000 | ) | — | — | (126 | ) | 1,262,126 | — | |||||||||||||||
Proceeds from Axeon term loan | — | 110,000 | — | — | — | 110,000 | |||||||||||||||||
Acquisitions | — | — | — | (1,476,719 | ) | — | (1,476,719 | ) | |||||||||||||||
Net cash (used in) provided by investing activities | (1,262,000 | ) | 89,436 | (5,611 | ) | (1,550,702 | ) | 1,262,126 | (1,466,751 | ) | |||||||||||||
Cash flows from financing activities: | |||||||||||||||||||||||
Debt borrowings | — | 1,536,761 | — | 65,400 | — | 1,602,161 | |||||||||||||||||
Debt repayments | — | (1,625,739 | ) | — | (70,500 | ) | — | (1,696,239 | ) | ||||||||||||||
Note offering, net of issuance costs | — | 543,313 | — | — | — | 543,313 | |||||||||||||||||
Issuance of other preferred units, net of issuance costs | 371,802 | — | — | — | — | 371,802 | |||||||||||||||||
Issuance of common units, net of issuance costs | 643,858 | — | — | — | — | 643,858 | |||||||||||||||||
General partner contribution | 13,597 | — | — | — | — | 13,597 | |||||||||||||||||
Distributions to preferred unitholders | (10,696 | ) | (5,348 | ) | (5,348 | ) | (5,348 | ) | 16,044 | (10,696 | ) | ||||||||||||
Distributions to common unitholders and general partner | (216,139 | ) | (108,070 | ) | (108,069 | ) | (108,080 | ) | 324,219 | (216,139 | ) | ||||||||||||
Contributions from affiliates | — | 1,262,000 | — | 126 | (1,262,126 | ) | — | ||||||||||||||||
Net intercompany activity | 236,622 | (1,778,816 | ) | 73,237 | 1,468,957 | — | — | ||||||||||||||||
Other, net | (2,613 | ) | 1,319 | 1 | (1 | ) | — | (1,294 | ) | ||||||||||||||
Net cash provided by (used) in financing activities | 1,036,431 | (174,580 | ) | (40,179 | ) | 1,350,554 | (921,863 | ) | 1,250,363 | ||||||||||||||
Effect of foreign exchange rate changes on cash | — | — | — | 649 | — | 649 | |||||||||||||||||
Net (decrease) increase in cash and cash equivalents | (3 | ) | 59 | — | (6,807 | ) | — | (6,751 | ) | ||||||||||||||
Cash and cash equivalents as of the beginning of the period | 870 | 5 | — | 35,067 | — | 35,942 | |||||||||||||||||
Cash and cash equivalents as of the end of the period | $ | 867 | $ | 64 | $ | — | $ | 28,260 | $ | — | $ | 29,191 | |||||||||||
35
Item 2. | Management’s Discussion and Analysis of Financial Condition and Results of Operations |
CAUTIONARY STATEMENT REGARDING FORWARD-LOOKING INFORMATION
In this Form 10-Q, we make certain forward-looking statements, including statements regarding our plans, strategies, objectives, expectations, estimates, predictions, projections, assumptions, intentions and resources. While these forward-looking statements, and any assumptions upon which they are based, are made in good faith and reflect our current judgment regarding the direction of our business, actual results will almost always vary, sometimes materially, from any estimates, predictions, projections, assumptions or other future performance suggested in this report. These forward-looking statements can generally be identified by the words “anticipates,” “believes,” “expects,” “plans,” “intends,” “estimates,” “forecasts,” “budgets,” “projects,” “will,” “could,” “should,” “may” and similar expressions. These statements reflect our current views with regard to future events and are subject to various risks, uncertainties and assumptions that may cause actual results to differ materially, including the possibility that the anticipated benefits from the merger described in Note 2 of the Condensed Notes to Consolidated Financial Statements in Item 1. “Financial Statements” cannot be fully realized, the possibility that costs or difficulties related to integration of the two companies will be greater than expected, the impact of competition and other risk factors. Please read our Annual Report on Form 10-K for the year ended December 31, 2017, Part I, Item 1A “Risk Factors,” as well as our subsequent filings with the Securities and Exchange Commission, for a discussion of certain of those risks, uncertainties and assumptions.
If one or more of these risks or uncertainties materialize, or if the underlying assumptions prove incorrect, our actual results may vary materially from those described in any forward-looking statement. Other unknown or unpredictable factors could also have material adverse effects on our future results. Readers are cautioned not to place undue reliance on this forward-looking information, which is as of the date of this Form 10-Q. We do not intend to update these statements unless we are required by the securities laws to do so, and we undertake no obligation to publicly release the result of any revisions to any such forward-looking statements that may be made to reflect events or circumstances after the date of this report or to reflect the occurrence of unanticipated events.
OVERVIEW
NuStar Energy L.P. (NYSE: NS) is engaged in the transportation of petroleum products and anhydrous ammonia, and the terminalling, storage and marketing of petroleum products. Unless otherwise indicated, the terms “NuStar Energy,” “NS,” “the Partnership,” “we,” “our” and “us” are used in this report to refer to NuStar Energy L.P., to one or more of our consolidated subsidiaries or to all of them taken as a whole. As of June 30, 2018, NuStar GP Holdings, LLC (NuStar GP Holdings or NSH) owned our general partner, Riverwalk Logistics, L.P., and an approximate 11% common limited partner interest in us. As a result of the merger described below, NSH became a wholly owned subsidiary of ours on July 20, 2018.
Our Management’s Discussion and Analysis of Financial Condition and Results of Operations is presented in seven sections:
• | Overview |
• | Results of Operations |
• | Trends and Outlook |
• | Liquidity and Capital Resources |
• | Related Party Transactions |
• | Critical Accounting Policies |
• | New Accounting Pronouncements |
Recent Developments
Merger. On February 7, 2018, NuStar Energy, Riverwalk Logistics, L.P., NuStar GP, LLC, Marshall Merger Sub LLC, a wholly owned subsidiary of NuStar Energy (Merger Sub), Riverwalk Holdings, LLC and NuStar GP Holdings entered into an Agreement and Plan of Merger (the Merger Agreement). Pursuant to the Merger Agreement, Merger Sub merged with and into NuStar GP Holdings, with NuStar GP Holdings being the surviving entity (the Merger), such that NuStar Energy became the sole member of NuStar GP Holdings following the Merger on July 20, 2018. Pursuant to the Merger Agreement and at the effective time of the Merger, our partnership agreement was amended and restated to, among other things, (i) cancel the incentive distribution rights held by our general partner, (ii) convert the 2% general partner interest in NuStar Energy held by our general partner into a non-economic management interest and (iii) provide the holders of our common units with voting rights in the election of the members of the board of directors of NuStar GP, LLC at an annual meeting, beginning in 2019. We issued approximately 13.4 million incremental NuStar Energy common units as a result of the Merger. Please refer to Note 2 of the Condensed Notes to Consolidated Financial Statements in Item 1. “Financial Statements” for further discussion of the Merger.
36
Issuances of units. On June 29, 2018, we issued 15,760,441 Series D Cumulative Convertible Preferred Units (Series D Preferred Units) at a price of $25.38 per unit in a private placement for net proceeds of $370.7 million. On July 13, 2018, we issued an additional 7,486,209 Series D Preferred Units at a price of $25.38 per unit in a private placement for net proceeds of $185.2 million. Please refer to Note 11 of the Condensed Notes to Consolidated Financial Statements in Item 1. “Financial Statements” for further discussion. On June 29, 2018, we issued 413,736 common units at a price of $24.17 per unit to William E. Greehey, Chairman of the Board of Directors of NuStar GP, LLC.
Council Bluffs Acquisition. On April 16, 2018, we acquired CHS Inc.’s Council Bluffs pipeline system, comprised of a 227-mile pipeline and 18 storage tanks, for approximately $37.5 million (the Council Bluffs Acquisition). The assets acquired and the results of operations are included in our pipeline segment, within the East Pipeline, from the date of acquisition. We accounted for this acquisition as an asset purchase.
Hurricane Activity. In the third quarter of 2017, several of our facilities were affected by the hurricanes in the Caribbean and Gulf of Mexico, including our St. Eustatius terminal, which experienced the most damage and was temporarily shut down. The damage caused by the Caribbean hurricane resulted in lower revenues for our bunker fuel operations in our fuels marketing segment and lower throughput and associated handling fees in our storage segment in 2017 and in the first quarter of 2018. In January 2018, we received $87.5 million of insurance proceeds in settlement of our property damage claim for our St. Eustatius terminal, of which $9.1 million related to business interruption ($5.6 million recognized in the storage segment and $3.5 million in the fuels marketing segment). Proceeds from business interruption insurance are included in “Operating expenses” in the consolidated statements of income and in “Cash flows from operating activities” in the consolidated statements of cash flows. We recorded a $78.8 million gain in “Other income, net” in the consolidated statements of income in the first quarter of 2018 for the amount by which the insurance proceeds exceeded our expenses incurred during the period. We expect that the costs to repair the property damage at the terminal will not exceed the amount of insurance proceeds received.
Navigator Acquisition. On May 4, 2017, we completed the acquisition of Navigator Energy Services, LLC for approximately $1.5 billion (the Navigator Acquisition). We collectively refer to the acquired assets as our Permian Crude System. The assets acquired are included in our pipeline segment within the Central West System, commencing on May 4, 2017. Please refer to Note 4 of the Condensed Notes to Consolidated Financial Statements in Item 1. “Financial Statements” for further discussion.
Operations
We conduct our operations through our subsidiaries, primarily NuStar Logistics, L.P. (NuStar Logistics) and NuStar Pipeline Operating Partnership L.P. (NuPOP). Our operations consist of three reportable business segments: pipeline, storage and fuels marketing.
Pipeline. We own 3,130 miles of refined product pipelines and 2,030 miles of crude oil pipelines, as well as approximately 5.0 million barrels of storage capacity, which comprise our Central West System. In addition, we own 2,600 miles of refined product pipelines, consisting of the East and North Pipelines, and a 2,000-mile ammonia pipeline (the Ammonia Pipeline), which together comprise our Central East System. The East and North Pipelines have storage capacity of approximately 7.3 million barrels. We charge tariffs on a per barrel basis for transporting refined products, crude oil and other feedstocks in our refined product and crude oil pipelines and on a per ton basis for transporting anhydrous ammonia in the Ammonia Pipeline.
Storage. We own terminals and storage facilities in the United States, Canada, Mexico, the Netherlands, including St. Eustatius in the Caribbean, and the United Kingdom (UK), with approximately 84.8 million barrels of storage capacity. Revenues for the storage segment include fees for tank storage agreements, whereby a customer agrees to pay for a certain amount of storage in a tank over a period of time (storage terminal revenues), and throughput agreements, whereby a customer pays a fee per barrel for volumes moving through our terminals (throughput terminal revenues).
Fuels Marketing. Within our fuels marketing operations, we purchase petroleum products for resale. The results of operations for the fuels marketing segment depend largely on the margin between our costs and the sales prices of the products we market. Therefore, the results of operations for this segment are more sensitive to changes in commodity prices compared to the operations of the pipeline and storage segments. We enter into derivative contracts to attempt to mitigate the effects of commodity price fluctuations. We ceased marketing crude oil in the second quarter of 2017 and exited our heavy fuels trading operations in the third quarter of 2017. The only operations remaining in our fuels marketing segment are our bunkering operations at our St. Eustatius and Texas City terminals, as well as certain of our blending operations.
37
The following factors affect the results of our operations:
• | company-specific factors, such as facility integrity issues and maintenance requirements that impact the throughput rates of our assets; |
• | seasonal factors that affect the demand for products transported by and/or stored in our assets and the demand for products we sell; |
• | industry factors, such as changes in the prices of petroleum products that affect demand and operations of our competitors; |
• | economic factors, such as commodity price volatility, that impact our fuels marketing segment; and |
• | factors that impact the operations served by our pipeline and storage assets, such as utilization rates and maintenance turnaround schedules of our refining company customers and drilling activity by our crude oil production customers. |
Current Market Conditions
The price of crude oil has recovered somewhat since its sharp initial decline in 2014 and subsequent historic lows during 2015 and 2016. In 2017, global supply and demand moved into balance, which seems to have reduced crude price volatility, but crude prices remain stalled well below 2014 levels. Most energy industry experts now project continued price recovery during 2018, but the duration and degree of price improvements will depend on, among other things, changes in global supply and demand.
Increases or decreases in the price of crude oil affect sectors across the energy industry, including our customers in crude oil production, refining and trading, in different ways at different points in any given price cycle. For example, U.S. crude oil producers reduced their capital spending relatively early in this sustained low price cycle, which reduced drilling activity and lowered production, particularly in shale play regions with higher relative drilling costs. As this cycle has continued, producers focused their trimmed-back spending on the most capital-efficient regions, such as, notably, the Permian Basin. Refiners, on the other hand, have benefitted from lower crude oil prices, to the extent they have been able to take advantage of lower feedstock prices, especially those positioned for healthy regional demand for their refined products; however, as refined product inventories increase, refiners are incentivized to reduce their production levels, which in turn may reduce their ability to benefit from low crude prices. Crude oil traders focus less on the current market commodity price than on whether that price is higher or lower than expected future market prices: if the future price for a product is believed to be higher than the current market price, or a “contango market,” traders are more likely to purchase and store products to sell in the future at the higher price. On the other hand, when the current price of crude oil nears or exceeds the expected future market price, or “backwardation,” as is currently the case, traders are no longer incentivized to purchase and store product for future sale.
38
RESULTS OF OPERATIONS
Three Months Ended June 30, 2018 Compared to Three Months Ended June 30, 2017
Financial Highlights
(Unaudited, Thousands of Dollars, Except Per Unit Data)
Three Months Ended June 30, | Change | ||||||||||
2018 | 2017 | ||||||||||
Statement of Income Data: | |||||||||||
Revenues: | |||||||||||
Service revenues | $ | 302,131 | $ | 283,700 | $ | 18,431 | |||||
Product sales | 184,073 | 151,788 | 32,285 | ||||||||
Total revenues | 486,204 | 435,488 | 50,716 | ||||||||
Costs and expenses: | |||||||||||
Costs associated with service revenues | 205,285 | 181,802 | 23,483 | ||||||||
Cost of product sales | 170,849 | 144,479 | 26,370 | ||||||||
General and administrative expenses | 27,981 | 33,604 | (5,623 | ) | |||||||
Other depreciation and amortization expense | 2,251 | 2,199 | 52 | ||||||||
Total costs and expenses | 406,366 | 362,084 | 44,282 | ||||||||
Operating income | 79,838 | 73,404 | 6,434 | ||||||||
Interest expense, net | (48,936 | ) | (45,612 | ) | (3,324 | ) | |||||
Other income, net | 1,412 | 88 | 1,324 | ||||||||
Income before income tax expense | 32,314 | 27,880 | 4,434 | ||||||||
Income tax expense | 2,915 | 1,630 | 1,285 | ||||||||
Net income | $ | 29,399 | $ | 26,250 | $ | 3,149 | |||||
Basic net income per common unit | $ | 0.15 | $ | 0.05 | $ | 0.10 | |||||
Overview
Net income increased $3.1 million for the three months ended June 30, 2018, compared to the three months ended June 30, 2017, primarily due to decreases in general and administrative expenses that were partially offset by increased interest expense, net. Segment operating income increased slightly as increases in segment operating income from the pipeline and fuels marketing segments were almost completely offset by decreased segment operating income from the storage segment.
39
Segment Operating Highlights
(Thousands of Dollars, Except Barrels/Day Information)
Three Months Ended June 30, | Change | ||||||||||
2018 | 2017 | ||||||||||
Pipeline: | |||||||||||
Refined products and ammonia pipelines throughput (barrels/day) | 565,740 | 531,529 | 34,211 | ||||||||
Crude oil pipelines throughput (barrels/day) | 839,574 | 558,182 | 281,392 | ||||||||
Total throughput (barrels/day) | 1,405,314 | 1,089,711 | 315,603 | ||||||||
Throughput revenues | $ | 150,276 | $ | 126,740 | $ | 23,536 | |||||
Operating expenses | 48,706 | 40,197 | 8,509 | ||||||||
Depreciation and amortization expense | 38,591 | 33,675 | 4,916 | ||||||||
Segment operating income | $ | 62,979 | $ | 52,868 | $ | 10,111 | |||||
Storage: | |||||||||||
Throughput (barrels/day) | 331,917 | 337,518 | (5,601 | ) | |||||||
Throughput terminal revenues | $ | 20,141 | $ | 22,122 | $ | (1,981 | ) | ||||
Storage terminal revenues | 137,309 | 136,437 | 872 | ||||||||
Total revenues | 157,450 | 158,559 | (1,109 | ) | |||||||
Operating expenses | 78,244 | 70,783 | 7,461 | ||||||||
Depreciation and amortization expense | 35,022 | 31,727 | 3,295 | ||||||||
Segment operating income | $ | 44,184 | $ | 56,049 | $ | (11,865 | ) | ||||
Fuels Marketing: | |||||||||||
Product sales and other revenue | $ | 180,483 | $ | 153,918 | $ | 26,565 | |||||
Cost of product sales | 172,724 | 147,013 | 25,711 | ||||||||
Gross margin | 7,759 | 6,905 | 854 | ||||||||
Operating expenses | 4,855 | 6,616 | (1,761 | ) | |||||||
Segment operating income | $ | 2,904 | $ | 289 | $ | 2,615 | |||||
Consolidation and Intersegment Eliminations: | |||||||||||
Revenues | $ | (2,005 | ) | $ | (3,729 | ) | $ | 1,724 | |||
Cost of product sales | (1,875 | ) | (2,534 | ) | 659 | ||||||
Operating expenses | (133 | ) | (1,196 | ) | 1,063 | ||||||
Total | $ | 3 | $ | 1 | $ | 2 | |||||
Consolidated Information: | |||||||||||
Revenues | $ | 486,204 | $ | 435,488 | $ | 50,716 | |||||
Costs associated with service revenues: | |||||||||||
Operating expenses | 131,672 | 116,400 | 15,272 | ||||||||
Depreciation and amortization expense | 73,613 | 65,402 | 8,211 | ||||||||
Total costs associated with service revenues | 205,285 | 181,802 | 23,483 | ||||||||
Cost of product sales | 170,849 | 144,479 | 26,370 | ||||||||
Segment operating income | 110,070 | 109,207 | 863 | ||||||||
General and administrative expenses | 27,981 | 33,604 | (5,623 | ) | |||||||
Other depreciation and amortization expense | 2,251 | 2,199 | 52 | ||||||||
Consolidated operating income | $ | 79,838 | $ | 73,404 | $ | 6,434 | |||||
40
Pipeline
Total revenues increased $23.5 million and throughputs increased 315,603 barrels per day for the three months ended June 30, 2018, compared to the three months ended June 30, 2017, primarily due to:
• | an increase in revenues of $16.4 million and an increase in throughputs of 249,347 barrels per day resulting from our Permian Crude System acquired in May 2017; |
• | an increase in revenues of $7.0 million and an increase in throughputs of 29,330 barrels per day due to a turnaround at the refinery served by our North Pipeline in the comparable period of 2017; and |
• | an increase in revenues of $3.0 million on the East Pipeline, despite throughputs that remained flat, due to the Council Bluffs Acquisition, as well as an increase in long-haul deliveries resulting in higher average tariffs. |
These increases were partially offset by decreased revenues of $2.8 million, despite an increase in throughputs of 33,399 barrels per day, on our Eagle Ford System and Ardmore System mainly due to higher throughputs on short-haul pipeline segments with lower tariff rates.
Operating expenses increased $8.5 million for the three months ended June 30, 2018, compared to the three months ended June 30, 2017, mainly due to increased operating expenses of $5.5 million resulting from our acquisition of the Permian Crude System and the Council Bluffs Acquisition, higher maintenance expenses of $1.6 million and an increase of $1.3 million in salaries and wages.
Depreciation and amortization expense increased $4.9 million for the three months ended June 30, 2018, compared to the three months ended June 30, 2017, mainly due to our acquisition of the Permian Crude System.
Storage
Throughput terminal revenues decreased $2.0 million and throughputs decreased 5,601 barrels per day for the three months ended June 30, 2018, compared to the three months ended June 30, 2017. Throughput terminal revenues decreased $2.5 million and throughputs decreased 12,112 barrels per day, at our Corpus Christi North Beach terminal, due to volumes being shipped from North Beach to our customer’s refineries, thus reducing volumes moved over our docks, and lower storage rates. This decrease was partially offset by an increase in throughput terminal revenues of $0.6 million and an increase in throughputs of 8,485 barrels per day at our Central West Terminals due to increased demand in markets served by those terminals.
Storage terminal revenues increased $0.9 million for the three months ended June 30, 2018, compared to the three months ended June 30, 2017, primarily due to an increase of $2.3 million in domestic revenues, mainly due to a $9.0 million adjustment to revenues resulting from a change in the term of a contract at our Linden terminal. Please refer to Note 13 of the Condensed Notes to Consolidated Financial Statements in Item 1. “Financial Statements” for further discussion. This was partially offset by decreased revenues of $5.7 million at our St. James terminal, mainly resulting from the non-renewal at expiration of a customer contract. The increase in domestic revenues was partially offset by a decrease of $1.7 million in revenues at our St. Eustatius terminal, primarily due to the non-renewal at expiration of certain customer contracts.
Operating expenses increased $7.5 million for the three months ended June 30, 2018, compared to the three months ended June 30, 2017, primarily due to an increase in salaries and wages of $3.4 million, spread across various regions, and an increase of $3.0 million in maintenance and regulatory expenses, mainly for regulatory tank work at our Corpus Christi North Beach terminal.
Depreciation and amortization expense increased $3.3 million for the three months ended June 30, 2018, compared to the three months ended June 30, 2017, mainly as a result of the completion of various storage projects, primarily at our St. Eustatius terminal.
Fuels Marketing
Segment operating income increased $2.6 million for the three months ended June 30, 2018, compared to the three months ended June 30, 2017, mainly due to improved margins from our blending operations.
Consolidation and Intersegment Eliminations
Revenue and operating expense eliminations primarily relate to storage fees charged to the fuels marketing segment by the storage segment. Cost of product sales eliminations represent expenses charged to the fuels marketing segment for costs associated with inventory, which are expensed once the inventory is sold.
41
General
General and administrative expenses decreased $5.6 million for the three months ended June 30, 2018, compared to the three months ended June 30, 2017, mainly resulting from transaction costs related to the Navigator Acquisition in the second quarter of 2017, partially offset by higher compensation costs in the second quarter of 2018.
Interest expense, net increased $3.3 million for the three months ended June 30, 2018, compared to the three months ended June 30, 2017, mainly due to the issuance of $550.0 million of 5.625% senior notes on April 28, 2017, higher borrowings on our revolving credit agreement and higher interest rates on several debt instruments.
Income tax expense increased $1.3 million for the three months ended June 30, 2018, compared to the three months ended June 30, 2017, primarily due to taxes associated with the Permian Crude System and a tax refund that was received in the second quarter of 2017.
Six Months Ended June 30, 2018 Compared to Six Months Ended June 30, 2017
Financial Highlights
(Unaudited, Thousands of Dollars, Except Per Unit Data)
Six Months Ended June 30, | Change | ||||||||||
2018 | 2017 | ||||||||||
Statement of Income Data: | |||||||||||
Revenues: | |||||||||||
Service revenues | $ | 593,544 | $ | 550,162 | $ | 43,382 | |||||
Product sales | 368,541 | 372,756 | (4,215 | ) | |||||||
Total revenues | 962,085 | 922,918 | 39,167 | ||||||||
Costs and expenses: | |||||||||||
Costs associated with service revenues | 384,066 | 337,499 | 46,567 | ||||||||
Cost of product sales | 347,577 | 352,285 | (4,708 | ) | |||||||
General and administrative expenses | 47,755 | 58,199 | (10,444 | ) | |||||||
Other depreciation and amortization expense | 4,369 | 4,392 | (23 | ) | |||||||
Total costs and expenses | 783,767 | 752,375 | 31,392 | ||||||||
Operating income | 178,318 | 170,543 | 7,775 | ||||||||
Interest expense, net | (96,708 | ) | (82,026 | ) | (14,682 | ) | |||||
Other income, net | 81,164 | 228 | 80,936 | ||||||||
Income before income tax expense | 162,774 | 88,745 | 74,029 | ||||||||
Income tax expense | 7,242 | 4,555 | 2,687 | ||||||||
Net income | $ | 155,532 | $ | 84,190 | $ | 71,342 | |||||
Basic net income per common unit | $ | 1.30 | $ | 0.51 | $ | 0.79 | |||||
Overview
Net income increased $71.3 million for the six months ended June 30, 2018, compared to the six months ended June 30, 2017, primarily due to the $78.8 million gain in the first quarter of 2018 resulting from the insurance proceeds received for hurricane damages incurred at our St. Eustatius terminal, which was partially offset by higher interest expense.
42
Segment Operating Highlights
(Thousands of Dollars, Except Barrels/Day Information)
Six Months Ended June 30, | Change | ||||||||||
2018 | 2017 | ||||||||||
Pipeline: | |||||||||||
Refined products pipelines throughput (barrels/day) | 548,910 | 522,820 | 26,090 | ||||||||
Crude oil pipelines throughput (barrels/day) | 815,568 | 483,909 | 331,659 | ||||||||
Total throughput (barrels/day) | 1,364,478 | 1,006,729 | 357,749 | ||||||||
Throughput revenues | $ | 287,066 | $ | 247,980 | $ | 39,086 | |||||
Operating expenses | 91,047 | 73,271 | 17,776 | ||||||||
Depreciation and amortization expense | 75,246 | 56,813 | 18,433 | ||||||||
Segment operating income | $ | 120,773 | $ | 117,896 | $ | 2,877 | |||||
Storage: | |||||||||||
Throughput (barrels/day) | 337,892 | 326,327 | 11,565 | ||||||||
Throughput terminal revenues | $ | 40,157 | $ | 42,812 | $ | (2,655 | ) | ||||
Storage terminal revenues | 272,621 | 263,178 | 9,443 | ||||||||
Total revenues | 312,778 | 305,990 | 6,788 | ||||||||
Operating expenses | 144,069 | 132,922 | 11,147 | ||||||||
Depreciation and amortization expense | 68,264 | 63,260 | 5,004 | ||||||||
Segment operating income | $ | 100,445 | $ | 109,808 | $ | (9,363 | ) | ||||
Fuels Marketing: | |||||||||||
Product sales and other revenue | $ | 366,321 | $ | 376,620 | $ | (10,299 | ) | ||||
Cost of product sales | 351,401 | 357,612 | (6,211 | ) | |||||||
Gross margin | 14,920 | 19,008 | (4,088 | ) | |||||||
Operating expenses | 5,696 | 13,579 | (7,883 | ) | |||||||
Segment operating income | $ | 9,224 | $ | 5,429 | $ | 3,795 | |||||
Consolidation and Intersegment Eliminations: | |||||||||||
Revenues | $ | (4,080 | ) | $ | (7,672 | ) | $ | 3,592 | |||
Cost of product sales | (3,824 | ) | (5,327 | ) | 1,503 | ||||||
Operating expenses | (256 | ) | (2,346 | ) | 2,090 | ||||||
Total | $ | — | $ | 1 | $ | (1 | ) | ||||
Consolidated Information: | |||||||||||
Revenues | $ | 962,085 | $ | 922,918 | $ | 39,167 | |||||
Costs associated with service revenues: | |||||||||||
Operating expenses | 240,556 | 217,426 | 23,130 | ||||||||
Depreciation and amortization expense | 143,510 | 120,073 | 23,437 | ||||||||
Total costs associated with service revenues | 384,066 | 337,499 | 46,567 | ||||||||
Cost of product sales | 347,577 | 352,285 | (4,708 | ) | |||||||
Segment operating income | 230,442 | 233,134 | (2,692 | ) | |||||||
General and administrative expenses | 47,755 | 58,199 | (10,444 | ) | |||||||
Other depreciation and amortization expense | 4,369 | 4,392 | (23 | ) | |||||||
Consolidated operating income | $ | 178,318 | $ | 170,543 | $ | 7,775 | |||||
43
Pipeline
Total revenues increased $39.1 million and total throughputs increased 357,749 barrels per day for the six months ended June 30, 2018, compared to the six months ended June 30, 2017, primarily due to:
• | an increase in revenues of $34.9 million and an increase in throughputs of 308,439 barrels per day resulting from our Permian Crude System acquired in May 2017; |
• | an increase in revenues of $9.6 million and an increase in throughputs of 17,190 barrels per day due to a turnaround at the refinery served by our North Pipeline in the second quarter of 2017; and |
• | an increase in revenues of $2.7 million and an increase in throughputs of 5,801 barrels per day on our East Pipeline as a result of the Council Bluffs Acquisition as well as an increase in long-haul deliveries resulting in higher average tariffs. |
These increases were partially offset by:
• | a decrease in revenues of $2.9 million and a decrease in throughputs of 4,312 barrels per day on the Ammonia pipeline as a result of weather conditions that hindered agricultural application and operational issues at a plant served by the pipeline; and |
• | a decrease in revenues of $4.3 million, despite an increase in throughputs of 19,158 barrels per day, on our Eagle Ford System and Ardmore System, mainly as the result of higher throughputs on short-haul pipeline segments with lower tariff rates. |
Operating expenses increased $17.8 million for the six months ended June 30, 2018, compared to the six months ended June 30, 2017, mainly due to increased operating expenses of $12.3 million resulting from our acquisition of the Permian Crude System and the Council Bluffs Acquisition, an increase of $1.9 million in salaries and wages, an increase of $1.3 million related to accruals for commercial claims and higher maintenance and regulatory expenses of $1.0 million.
Depreciation and amortization expense increased $18.4 million for the six months ended June 30, 2018, compared to the six months ended June 30, 2017, mainly due to our acquisition of the Permian Crude System.
Storage
Throughput terminal revenues decreased $2.7 million, while throughputs increased 11,565 barrels per day for the six months ended June 30, 2018, compared to the six months ended June 30, 2017. Throughput terminal revenues decreased at our Corpus Christi North Beach terminal by $4.6 million, despite throughputs that remained unchanged, mainly due to lower storage rates for certain of our tanks. The higher volumes from our Eagle Ford System did not increase volumes at our North Beach terminal because the volumes continued on the pipeline to our customer’s refineries. Revenues increased $2.3 million and throughputs increased 14,628 barrels per day at our Central West Terminals, due to increased demand in markets served by those terminals.
Storage terminal revenues increased $9.4 million for the six months ended June 30, 2018, compared to the six months ended June 30, 2017, primarily due to:
• | an increase of $10.7 million at our North East terminals mainly due to an adjustment to revenues resulting from a change in the term of a contract at our Linden terminal. Please refer to Note 13 of the Condensed Notes to Consolidated Financial Statements in Item 1. “Financial Statements” for further discussion; |
• | an increase of $5.2 million at our West terminals, mainly due to completed projects and rate escalations, higher throughput and associated handling fees and higher reimbursable revenue; and |
• | an increase of $2.0 million at our international terminals, mainly due to the effect of foreign exchange rates, partially offset by a decrease in storage revenues. |
These increases were partially offset by a decrease of $8.9 million at our Gulf Coast terminals, primarily due to the non-renewal at expiration of a customer contract, lower storage rates and lower throughput and associated handling fees, partially offset by higher reimbursable revenue.
Operating expenses increased $11.1 million for the six months ended June 30, 2018, compared to the six months ended June 30, 2017, primarily due to:
• | an increase in salaries and wages of $5.5 million and an increase of $4.5 million in maintenance and regulatory expenses, both spread across various regions; |
• | an increase of $2.7 million in rent expense, primarily at our St. Eustatius terminal due to additional marine vessel costs; |
• | an increase in reimbursable expenses of $2.1 million at various terminals, primarily due to tank cleaning and consistent with the increase in reimbursable revenues; and |
• | an increase in power costs of $1.0 million, mainly at St. Eustatius. |
44
These increases were partially offset by a decrease in operating expense of $5.8 million, primarily at St. Eustatius, due to the business interruption insurance recovery in the first quarter of 2018 related to the hurricane damage in the third quarter of 2017.
Depreciation and amortization expense increased $5.0 million for the six months ended June 30, 2018, compared to the six months ended June 30, 2017, mainly as the result of the completion of various storage projects, primarily at our St. Eustatius terminal.
Fuels Marketing
Segment operating income increased $3.8 million for the six months ended June 30, 2018, compared to the six months ended June 30, 2017, mainly due to improved margins from our blending operations.
Consolidation and Intersegment Eliminations
Revenue and operating expense eliminations primarily relate to storage fees charged to the fuels marketing segment by the storage segment. Cost of product sales eliminations represent expenses charged to the fuels marketing segment for costs associated with inventory, which are expensed once the inventory is sold.
General
General and administrative expenses decreased $10.4 million for the six months ended June 30, 2018, compared to the six months ended June 30, 2017, primarily due to transaction costs related to the Navigator Acquisition in 2017, partially offset by higher compensation costs.
Interest expense, net increased $14.7 million for the six months ended June 30, 2018, compared to the six months ended June 30, 2017, mainly due to the issuance of $550.0 million of 5.625% senior notes on April 28, 2017, higher borrowings on our revolving credit agreement and higher interest rates on several debt instruments.
For the six months ended June 30, 2018, we recognized other income, net of $81.2 million, mainly due to a gain from insurance proceeds recognized in the first quarter of 2018 relating to hurricane damage at our St. Eustatius terminal in the third quarter of 2017.
Income tax expense increased $2.7 million for the six months ended June 30, 2018, compared to the six months ended June 30, 2017, primarily due to taxes associated with the Permian Crude System and increased taxable income in certain of our taxable entities.
45
TRENDS AND OUTLOOK
Historically, master limited partnerships (MLPs), like NuStar Energy, have funded a large proportion of strategic capital expenditures and acquisitions from external sources, primarily through borrowings under credit facilities and issuances of equity and debt securities. In the past few years, however, the total number of, and aggregate amount raised by, MLP common equity issuances has dropped dramatically, and MLPs with low coverage and high leverage have found it increasingly difficult to issue common equity. In order to best position ourselves to meet market demands, earlier in the year, we launched a comprehensive plan to simplify our structure, restore strong coverage, lower our leverage and minimize our need to access the equity capital markets.
On July 20, 2018, we completed the final step of our plan when we completed the Merger and cancelled the incentive distribution rights (IDRs) previously held by our general partner. We also believe that the Merger, the elimination of the IDRs and the previously announced distribution reset will, in the near-term, establish a more efficient, transparent structure and improve both our distribution coverage and our ability to fund our cash requirements. Furthermore, we expect our reduced distribution combined with the Merger and the issuance of approximately $600 million of preferred and common equity in June and July of 2018, will, together, strengthen our balance sheet in 2018 and in future years. In the longer-term, we expect to be able to fund a larger proportion of our capital projects with the cash generated by our operations, which should, over time, improve our leverage metrics, and reduce our need to access capital markets to finance future growth opportunities.
Overall, we expect higher revenue in our pipeline segment in 2018, compared to 2017. While contracts for about half of our committed volumes on our South Texas Crude System expire in the second half of 2018, we recently entered into contracts to replace a large proportion of those volume commitments at lower rates that reflect the current Eagle Ford market rates. We anticipate that the negative impact of those lower rates should be mitigated by incremental revenue from completion of several other projects, across our assets, starting as soon as late 2018. We have announced several contracts, and we are in negotiations to enter into several other agreements, with minimum volume commitments with strong, creditworthy customers supporting a series of healthy-return projects to drive incremental volumes in our existing assets, including certain of our pipeline systems in South Texas.
We continue to project that our Permian Crude System’s growth will benefit our pipeline segment’s overall results. In recent months, industry experts have expressed concern that the rapid growth of the Permian Basin may result in the basin’s production exceeding its outbound long-haul pipeline capacity in the near future. We are continuing to work on projects to provide flow assurance for our producers and shippers, and we believe that, even if the predicted long-haul pipeline logistical constraints come to pass, the impact will be short-lived, as new pipelines and capacity expansions go into service early in 2019 and in 2020.
We currently expect storage segment revenue in 2018 to be lower than 2017, due to lower rates at certain facilities with contract renewals occurring over the course of this year. We agree with the many energy experts who currently predict that backwardation, which tends to decrease demand for storage capacity in certain regional markets, will continue through 2018, and our forecast continues to reflect lower revenues for affected facilities with contracts expiring during 2018, as compared to 2017. We believe we are insulated to some extent by our long-term contracts at certain of our facilities where backwardation is a driving factor, and due to the fact that we have storage assets in markets in which forward pricing has little impact on rates or renewals. Although we saw an uptick in activity from Petroleos de Venezuela, S.A. (PDVSA) at our St. Eustatius terminal early this year, during the second quarter, ConocoPhillips served our St. Eustatius terminal with an attachment, which requires that we hold oil owned by PDVSA that we store at our terminal. While this attachment, among other efforts by ConocoPhillips to attach PDVSA assets in the Dutch Caribbean, has significantly reduced PDVSA’s activity at the terminal, we continue to provide storage services for the oil. We believe we will continue to successfully enforce our contract rights, including our right to payment for services rendered, but we are also, in parallel, pursuing mitigating measures, including alternative customers.
Our outlook for the partnership, both overall and for any of our segments, may change, as we base our expectations on our continuing evaluation of a number of factors, many of which are outside our control. These factors include, but are not limited to, the state of the economy and the capital markets, changes to our customers’ refinery maintenance schedules and unplanned refinery downtime, crude oil prices, the supply of and demand for crude oil, refined products and anhydrous ammonia, demand for our transportation and storage services and changes in laws or regulations affecting our assets.
46
LIQUIDITY AND CAPITAL RESOURCES
Overview
Our primary cash requirements are for distributions to our partners, debt service, capital expenditures, acquisitions and operating expenses.
Our partnership agreement requires that we distribute all “Available Cash” to our common limited partners and, prior to the Merger, to our general partner each quarter. “Available cash” is defined in the partnership agreement generally as cash on hand at the end of the quarter, plus certain permitted borrowings made subsequent to the end of the quarter, less cash reserves determined by our board of directors. On April 26, 2018, we announced that the board of directors of NuStar GP, LLC reset our quarterly distribution per common unit to $0.60 ($2.40 on an annualized basis), starting with the first-quarter distribution, which was paid on May 14, 2018. As a result of the Merger, our general partner no longer receives incentive distributions or quarterly cash distributions from us, and we issued approximately 13.4 million incremental NuStar Energy common units in exchange for previously outstanding NSH units. Please refer to Note 2 of the Condensed Notes to Consolidated Financial Statements in Item 1. “Financial Statements” for further discussion regarding the Merger.
Each year, our objective is to fund our reliability capital expenditures and distribution requirements with our net cash provided by operating activities during that year. If we do not generate sufficient cash from operations to meet that objective, we utilize cash on hand or other sources of cash flow, which in the past have primarily included borrowings under our revolving credit agreement, sales of non-strategic assets and, to the extent necessary, funds raised through equity or debt offerings. We have typically funded our strategic capital expenditures and acquisitions from external sources, primarily borrowings under our revolving credit agreement or funds raised through equity or debt offerings. However, our ability to raise funds by issuing debt or equity depends on many factors beyond our control. Our risk factors in Item 1A of our Annual Report on Form 10-K for the year ended December 31, 2017 describe the risks inherent to these sources of funding and the availability thereof.
During periods when our cash flow from operations is less than our distribution and reliability capital requirements, we may maintain our distribution level because we can use other sources of Available Cash, as provided in our partnership agreement, including borrowings under our revolving credit agreement and proceeds from the sales of assets. Our risk factors in Item 1A of our Annual Report on Form 10-K for the year ended December 31, 2017 describe the risks inherent in our ability to maintain or grow our distribution.
We received insurance proceeds in settlement of our property damage claim for our St. Eustatius terminal in the first quarter of 2018, which we expect to completely offset the additional reliability capital expenditures expected to repair the terminal in 2018 through 2020. For 2018, we expect to generate sufficient cash from operations to exceed our distribution and reliability capital requirements, considering the insurance proceeds. Although we expect higher interest costs and preferred unit distributions in 2018 due to our issuances of debt and equity securities, we expect a decrease in distributions in 2018 compared to 2017 as a result of the distribution reset and Merger discussed above.
Cash Flows for the Six Months Ended June 30, 2018 and 2017
The following table summarizes our cash flows from operating, investing and financing activities (please refer to our Consolidated Statements of Cash Flows in Item 1. “Financial Statements”):
Six Months Ended June 30, | |||||||
2018 | 2017 | ||||||
(Thousands of Dollars) | |||||||
Net cash provided by (used in): | |||||||
Operating activities | $ | 243,850 | $ | 208,988 | |||
Investing activities | (224,827 | ) | (1,466,751 | ) | |||
Financing activities | (22,550 | ) | 1,250,363 | ||||
Effect of foreign exchange rate changes on cash | (421 | ) | 649 | ||||
Net decrease in cash and cash equivalents | $ | (3,948 | ) | $ | (6,751 | ) | |
Net cash provided by operating activities for the six months ended June 30, 2018 was $243.9 million, compared to $209.0 million for the six months ended June 30, 2017, mainly due to changes in working capital. Please refer to the Working Capital Requirements section below for discussion. For the six months ended June 30, 2018, the net cash provided by operating activities was used to fund our distributions to unitholders and our general partner in the aggregate amount of $205.0 million. Net cash provided by operating activities as well as a portion of the insurance recoveries were used to fund reliability capital expenditures of $41.8 million, and proceeds from debt borrowings were used to fund our strategic capital expenditures of
47
$244.2 million. The proceeds from the issuance of units were used to repay outstanding borrowings under our revolving credit agreement.
For the six months ended June 30, 2017, net cash provided by operating activities and a portion of the proceeds from the termination of the $190.0 million term loan to Axeon Specialty Products, LLC (the Axeon Term Loan) of $110.0 million were used to fund our distributions to unitholders and our general partner in the aggregate amount of $226.8 million and reliability capital expenditures of $15.4 million. The remaining proceeds from the termination of the Axeon Term Loan and the proceeds from debt borrowings, net of repayments, were used to fund our strategic capital expenditures of $93.4 million. Proceeds from our debt and equity issuances of approximately $1.5 billion were used to fund the purchase price of the Navigator Acquisition.
Debt Sources of Liquidity
Revolving Credit Agreement. On June 29, 2018, NuStar Logistics amended its revolving credit agreement (the Revolving Credit Agreement) to exclude the Series D Preferred Units from the definition of “Indebtedness.” Additionally, the amendment reduced the total amount available for borrowing from $1.75 billion to $1.575 billion, effective June 29, 2018, with a further reduction to $1.4 billion, effective December 28, 2018. The Revolving Credit Agreement was also amended to, among other things, add a consolidated interest coverage ratio (as defined in the Revolving Credit Agreement), which must not be less than 1.75-to-1.00 for each rolling period of four quarters, beginning with the rolling period ending June 30, 2018. As of June 30, 2018, our consolidated interest coverage ratio was 2.4x.
On March 28, 2018, NuStar Logistics amended the Revolving Credit Agreement to increase the maximum allowed consolidated debt coverage ratio (as defined in the Revolving Credit Agreement) to 5.25-to-1.00 for the rolling periods ending June 30, 2018 through December 31, 2018. For any rolling periods ending on or after March 31, 2019, the maximum allowed consolidated debt coverage ratio may not exceed 5.00-to-1.00. The Revolving Credit Agreement was also amended to, among other things, provide that the definition of “Change in Control” in the Revolving Credit Agreement excludes the Merger discussed in Note 2.
The maximum consolidated debt coverage ratio and minimum consolidated interest coverage ratio requirements may limit the amount we can borrow under the Revolving Credit Agreement to an amount less than the total amount available for borrowing. As of June 30, 2018, our maximum allowed consolidated debt coverage ratio was 5.25-to-1.00 and our actual consolidated debt coverage ratio was 4.7x. We had $553.7 million available for borrowing and letters of credit issued under the Revolving Credit Agreement totaled $3.7 million as of June 30, 2018.
Receivables Financing Agreement. NuStar Energy and NuStar Finance LLC (NuStar Finance), a special purpose entity and wholly owned subsidiary of NuStar Energy, are parties to a $125.0 million receivables financing agreement with third-party lenders (the Receivables Financing Agreement) and agreements with certain of NuStar Energy’s wholly owned subsidiaries (collectively with the Receivables Financing Agreement, the Securitization Program). The amount available for borrowing under the Receivables Financing Agreement is based on the availability of eligible receivables and other customary factors and conditions. On March 28, 2018, the Receivables Financing Agreement was amended to change the definition of Change in Control in the Receivables Financing Agreement such that the proposed Merger discussed in Note 2 would not be a Change in Control for purposes of the Receivables Financing Agreement. The amount of borrowings under the Receivables Financing Agreement is limited to $125.0 million.
Other Debt Sources of Liquidity. Other sources of liquidity as of June 30, 2018 consist of the following:
• | $365.4 million in revenue bonds pursuant to the Gulf Opportunity Zone Act of 2005 (the GoZone Bonds), with $42.7 million remaining in trust as of June 30, 2018, supported by $370.2 million in letters of credit; and |
• | two short-term line of credit agreements with an aggregate uncommitted borrowing capacity of up to $65.0 million, with $63.0 million of borrowings outstanding as of June 30, 2018. |
We are also a party to a $100.0 million uncommitted letter of credit agreement, which provides for standby letters of credit or guarantees with a term of up to one year (LOC Agreement). As of June 30, 2018, we had no letters of credit issued under the LOC Agreement.
Please refer to Note 5 of the Condensed Notes to Consolidated Financial Statements in Item 1. “Financial Statements” for a discussion of certain of our debt agreements.
48
Issuances of Units
Series D Preferred Units. On June 29, 2018, we issued 15,760,441 Series D Preferred Units at a price of $25.38 per unit in a private placement for net proceeds of $370.7 million. On July 13, 2018, we issued an additional 7,486,209 Series D Preferred Units at a price of $25.38 per unit in a private placement for net proceeds of $185.2 million. The Series D Preferred Units contain various conversion and redemption features. At any time on or after June 29, 2028, each holder of Series D Preferred Units will have the right to require the Partnership to redeem all of the Series D Preferred Units held by such holder at a redemption price equal to $29.19 per unit plus any unpaid distributions to, but not including, the date of redemption. If a holder of Series D Preferred Units exercises its redemption right, the Partnership may elect to pay up to 50% of such amount in common units, if the common units to be issued do not, in the aggregate, exceed 15% of NuStar Energy’s common equity market capitalization at the time. In connection with the issuance, we also entered into a Registration Rights Agreement with the purchasers of the Series D Preferred Units relating to the registration of the Series D Preferred Units and the common units issuable upon conversion of the Series D Preferred Units. Please refer to Note 11 of the Condensed Notes to Consolidated Financial Statements in Item 1. “Financial Statements” for further discussion of the Series D Preferred Units.
Common Units. On June 29, 2018, we also issued 413,736 common units at a price of $24.17 per unit for total proceeds of approximately $10.0 million.
Merger. As a result of the Merger, we issued approximately 13.4 million incremental NuStar Energy common units in exchange for the previously outstanding NSH common units.
Capital Requirements
Our operations require significant investments to maintain, upgrade or enhance the operating capacity of our existing assets. Our capital expenditures consist of:
• | strategic capital expenditures, such as those to expand or upgrade the operating capacity, increase efficiency or increase the earnings potential of existing assets, whether through construction or acquisition, as well as certain capital expenditures related to support functions; and |
• | reliability capital expenditures, such as those required to maintain the existing operating capacity of existing assets or extend their useful lives, as well as those required to maintain equipment reliability and safety. |
The following table summarizes our capital expenditures, and the amount we expect to spend for 2018:
Strategic | |||||||||||||||
Acquisitions and Investments in Other Long-Term Assets | Other Capital Expenditures | Reliability Capital Expenditures | Total | ||||||||||||
(Thousands of Dollars) | |||||||||||||||
For the six months ended June 30: | |||||||||||||||
2018 | $ | 37,502 | $ | 206,726 | $ | 41,795 | $ | 286,023 | |||||||
2017 | $ | 1,476,719 | $ | 93,447 | $ | 15,402 | $ | 1,585,568 | |||||||
Expected for the year ended December 31, 2018 | $ | 37,502 | $ 360,000 - 390,000 | $ 80,000 - 100,000 | |||||||||||
Other strategic capital expenditures for the six months ended June 30, 2018 consist of pipeline expansions on our Permian Crude System and terminal expansions, while other strategic capital expenditures for the six months ended June 30, 2017 mainly consist of terminal expansions. Reliability capital expenditures primarily relate to maintenance upgrade projects at our terminals.
For the year ended December 31, 2018, we expect a significant portion of our strategic capital spending to relate to our Permian Crude System and a significant portion of reliability capital spending to relate to hurricane damage repairs at our St. Eustatius facility. We continue to evaluate our capital budget and make changes as economic conditions warrant, and our actual capital expenditures for 2018 may increase or decrease from the budgeted amounts. We believe cash on hand, combined with the sources of liquidity previously described, will be sufficient to fund our capital expenditures in 2018, and our internal growth projects can be accelerated or scaled back, depending on market conditions or customer demand.
49
Working Capital Requirements
Working capital requirements are mainly affected by our accounts receivable and accounts payable balances, which vary depending on the timing of payments. Changes in our accounts receivable and accounts payable balances were also affected by our exit from our heavy fuels trading and crude oil marketing operations in 2017.
Distributions
General Partner and Common Limited Partners. The general partner was not allocated distributions for the second quarter of 2018 as a result of the Merger, which was effective prior to the record date for the second quarter distribution. The common limited partners’ distribution for the second quarter of 2018 includes the additional common units issued in exchange for previously outstanding NSH units pursuant to the terms of the Merger Agreement because the Merger closed prior to the common unit distribution date. Please refer to Note 2 of the Condensed Notes to Consolidated Financial Statements in Item 1. “Financial Statements” for further discussion of the Merger. The general partner did not receive incentive distributions for the first quarter of 2018 because the distribution declared for the first quarter was $0.60 per common unit, which was below the amount necessary to receive incentive distributions. The following table reflects the allocation of total cash distributions to the general partner and common limited partners applicable to the period in which the distributions were earned:
Three Months Ended June 30, | Six Months Ended June 30, | ||||||||||||||
2018 | 2017 | 2018 | 2017 | ||||||||||||
(Thousands of Dollars, Except Per Unit Data) | |||||||||||||||
General partner interest | $ | — | $ | 2,302 | $ | 1,141 | $ | 4,645 | |||||||
General partner incentive distribution | — | 10,912 | — | 23,824 | |||||||||||
Total general partner distribution | — | 13,214 | 1,141 | 28,469 | |||||||||||
Common limited partners’ distribution | 64,205 | 101,869 | 120,121 | 203,782 | |||||||||||
Total cash distributions | $ | 64,205 | $ | 115,083 | $ | 121,262 | $ | 232,251 | |||||||
Cash distributions per unit applicable to common limited partners | $ | 0.60 | $ | 1.095 | $ | 1.200 | $ | 2.190 | |||||||
Distribution payments to our common limited partners and, prior to the Merger, to our general partner, are made within 45 days after the end of each quarter as of a record date that is set after the end of each quarter. The following table summarizes information about quarterly cash distributions to our common limited partners and, prior to the Merger, our general partner:
Quarter Ended | Cash Distributions Per Unit | Total Cash Distributions | Record Date | Payment Date | ||||||||
(Thousands of Dollars) | ||||||||||||
June 30, 2018 | $ | 0.600 | $ | 64,205 | August 7, 2018 | August 13, 2018 | ||||||
March 31, 2018 | $ | 0.600 | $ | 57,057 | May 8, 2018 | May 14, 2018 | ||||||
December 31, 2017 | $ | 1.095 | $ | 115,267 | February 8, 2018 | February 13, 2018 | ||||||
Preferred Units. Distributions on our preferred units accrue and are cumulative from the issuance dates and are payable on the 15th day (or next business day) of each of March, June, September and December, beginning September 17, 2018 to holders of record on the first business day of each payment month. The distribution rate on the Series D Preferred Units is: (i) 9.75% per annum for the first two years; (ii) 10.75% per annum for years three through five; and (iii) the greater of 13.75% per annum or the common unit distribution rate thereafter. While the Series D Preferred Units are outstanding, the Partnership will be prohibited from paying distributions on any junior securities, including the common units, unless full cumulative distributions on the Series D Preferred Units (and any parity securities) have been, or contemporaneously are being, paid or set aside for payment through the most recent Series D Preferred Unit distribution payment date. For the four distribution periods beginning with the initial Series D Preferred Unit distribution, the Series D Preferred Unit distributions may be paid, in the Partnership’s sole discretion, in (i) cash or (ii) a combination of additional Series D Preferred Units and cash, provided that up to 50% of the distribution amount may be paid in additional Series D Preferred Units. Thereafter, any Series D Preferred Unit distributions in excess of $0.635 may be paid, in the Partnership’s sole discretion, in additional Series D Preferred Units, with the remainder paid in cash. If we fail to pay in full any Series D Preferred Unit distribution amount, then, until we pay such distributions in full, the applicable distribution rate for those distribution periods shall be increased by $0.048 per Series D Preferred Unit. We would also be subject to other requirements, as further discussed in Note 11 of the Condensed Notes to Consolidated Financial Statements in Item 1. “Financial Statements.”
50
In July 2018, our board of directors declared an initial distribution of $0.525 per Series D Preferred Unit issued on June 29, 2018 and an initial distribution of $0.431 per Series D Preferred Unit issued on July 13, 2018, which will both be paid on September 17, 2018 to holders of record as of September 4, 2018.
The following table summarizes information about our cash distributions on our 8.50% Series A, 7.625% Series B and 9.00% Series C Fixed-to-Floating Rate Cumulative Redeemable Perpetual Preferred Units:
Period | Cash Distributions Per Unit | Total Cash Distributions | Record Date | Payment Date | ||||||||
(Thousands of Dollars) | ||||||||||||
Series A Preferred Units: | ||||||||||||
June 15, 2018 - September 14, 2018 | $ | 0.53125 | $ | 4,813 | September 4, 2018 | September 17, 2018 | ||||||
March 15, 2018 - June 14, 2018 | $ | 0.53125 | $ | 4,813 | June 1, 2018 | June 15, 2018 | ||||||
December 15, 2017 - March 14, 2018 | $ | 0.53125 | $ | 4,813 | March 1, 2018 | March 15, 2018 | ||||||
Series B Preferred Units: | ||||||||||||
June 15, 2018 to September 14, 2018 | $ | 0.47657 | $ | 7,339 | September 4, 2018 | September 17, 2018 | ||||||
March 15, 2018 to June 14, 2018 | $ | 0.47657 | $ | 7,339 | June 1, 2018 | June 15, 2018 | ||||||
December 15, 2017 to March 14, 2018 | $ | 0.47657 | $ | 7,339 | March 1, 2018 | March 15, 2018 | ||||||
Series C Preferred Units: | ||||||||||||
June 15, 2018 to September 14, 2018 | $ | 0.56250 | $ | 3,881 | September 4, 2018 | September 17, 2018 | ||||||
March 15, 2018 to June 14, 2018 | $ | 0.56250 | $ | 3,881 | June 1, 2018 | June 15, 2018 | ||||||
November 30, 2017 - March 14, 2018 | $ | 0.65625 | $ | 4,528 | March 1, 2018 | March 15, 2018 | ||||||
Debt Obligations
As of June 30, 2018, we were a party to the following debt agreements:
• | Revolving Credit Agreement due October 29, 2020, with $1.0 billion of borrowings outstanding as of June 30, 2018; |
• | 4.80% senior notes due September 1, 2020 with a face value of $450.0 million; 6.75% senior notes due February 1, 2021 with a face value of $300.0 million; 4.75% senior notes due February 1, 2022 with a face value of $250.0 million; 5.625% senior notes due April 28, 2027 with a face value of $550.0 million; and subordinated notes due January 15, 2043 with a face value of $402.5 million and a floating interest rate; |
• | $365.4 million in GoZone Bonds due from 2038 to 2041; |
• | Line of credit agreements with $63.0 million of borrowings outstanding as of June 30, 2018; and |
• | Receivables Financing Agreement due September 20, 2020, with $56.4 million of borrowings outstanding as of June 30, 2018. |
We repaid our $350.0 million of 7.65% senior notes due April 15, 2018 with borrowings under our Revolving Credit Agreement.
Effective January 15, 2018, the interest rate on NuStar Logistics’ $402.5 million of fixed-to-floating rate subordinated notes due January 15, 2043 switched from a fixed annual rate of 7.625%, payable quarterly in arrears, to an annual rate equal to the sum of the three-month LIBOR for the related quarterly interest period, plus 6.734% payable quarterly, commencing with the interest payment due April 15, 2018. As of June 30, 2018, the interest rate was 9.1%.
Management believes that, as of June 30, 2018, we are in compliance with the ratios and covenants contained in our debt instruments. A default under certain of our debt agreements would be considered an event of default under other of our debt instruments. Please refer to Note 5 of the Condensed Notes to Consolidated Financial Statements in Item 1. “Financial Statements” for a discussion of certain of our debt agreements.
51
Credit Ratings
The following table reflects the current outlook and ratings that have been assigned to our debt:
S&P Global Ratings | Moody’s Investor Service Inc. | Fitch, Inc. | |||
Ratings | BB | Ba2 | BB | ||
Outlook | Negative | Negative | Negative | ||
The interest rate payable on the $350.0 million of 7.65% senior notes due 2018 (the 7.65% Senior Notes) was (prior to its repayment in April 2018), and the interest rate payable on the Revolving Credit Agreement is, subject to adjustment if our credit rating is downgraded (or upgraded) by certain credit rating agencies. In February 2018, Moody’s Investor Service Inc. (Moody’s) lowered our credit rating from Ba1 to Ba2, which caused the interest rate on the 7.65% Senior Notes to increase by 0.25%, resulting in an interest rate of 8.65% applicable to the interest payment due April 15, 2018. This Moody’s downgrade also caused the interest rate on our Revolving Credit Agreement to increase by 0.25%. In March 2018, Fitch, Inc. changed our outlook from stable to negative, which did not impact interest rates on the 7.65% Senior Notes or the Revolving Credit Agreement.
Interest Rate Swaps
As of June 30, 2018 and December 31, 2017, we were a party to forward-starting interest rate swap agreements for the purpose of hedging interest rate risk. As of June 30, 2018 and December 31, 2017, the aggregate notional amount of these forward-starting interest rate swaps was $250.0 million and $600.0 million, respectively. In connection with the April 2018 maturity of the 7.65% Senior Notes, we terminated forward-starting interest rate swap agreements with an aggregate notional amount of $350.0 million and received $8.0 million. Please refer to Note 8 of the Condensed Notes to Consolidated Financial Statements in Item 1. “Financial Statements” for a more detailed discussion of our interest rate swaps.
Environmental, Health and Safety
Our operations are subject to extensive international, federal, state and local environmental laws and regulations, in the U.S. and in the other countries in which we operate, including those relating to the discharge of materials into the environment, waste management, remediation, the characteristics and composition of fuels, climate change and greenhouse gases. Our operations are also subject to extensive health, safety and security laws and regulations, including those relating to worker and pipeline safety, pipeline and storage tank integrity and operations security. Because more stringent environmental and safety laws and regulations are continuously being enacted or proposed, the level of expenditures required for environmental, health and safety matters is expected to increase in the future.
Contingencies
We are subject to certain loss contingencies, and we believe that the resolution of any particular claim or proceeding, or all matters in the aggregate, would not have a material adverse effect on our results of operations, financial position or liquidity, as further disclosed in Note 6 of the Condensed Notes to Consolidated Financial Statements in Item 1. “Financial Statements.”
RELATED PARTY TRANSACTIONS
In conjunction with the Merger, which closed on July 20, 2018, we terminated the Amended and Restated Services Agreement with NuStar GP, LLC. Please refer to Note 9 of the Condensed Notes to Consolidated Financial Statements in Item 1. “Financial Statements” for a discussion of our related party transactions.
CRITICAL ACCOUNTING POLICIES
The preparation of financial statements in accordance with U.S. generally accepted accounting principles requires management to make estimates and assumptions that affect the amounts reported in the consolidated financial statements and accompanying notes. Actual results could differ from those estimates. Our critical accounting policies are disclosed in our Annual Report on Form 10-K for the year ended December 31, 2017.
NEW ACCOUNTING PRONOUNCEMENTS
Please refer to Note 3 of the Condensed Notes to Consolidated Financial Statements in Item 1. “Financial Statements” for a discussion of new accounting pronouncements.
52
Item 3. | Quantitative and Qualitative Disclosures About Market Risk |
Interest Rate Risk
We manage our exposure to changing interest rates principally through the use of a combination of fixed-rate debt and variable-rate debt. In addition, we utilize forward-starting interest rate swap agreements to lock in the rate on the interest payments related to forecasted debt issuances. Borrowings under our variable-rate debt expose us to increases in interest rates.
In connection with the April 2018 maturity of the 7.65% Senior Notes, we terminated forward-starting interest rate swap agreements with an aggregate notional amount of $350.0 million and received $8.0 million.
Please refer to Note 8 of the Condensed Notes to Consolidated Financial Statements in Item 1. “Financial Statements” for a more detailed discussion of our interest rate swaps. The following tables present principal cash flows and related weighted-average interest rates by expected maturity dates for our long-term debt:
June 30, 2018 | |||||||||||||||||||||||||||||||
Expected Maturity Dates | |||||||||||||||||||||||||||||||
2018 | 2019 | 2020 | 2021 | 2022 | There- after | Total | Fair Value | ||||||||||||||||||||||||
(Thousands of Dollars, Except Interest Rates) | |||||||||||||||||||||||||||||||
Long-term Debt: | |||||||||||||||||||||||||||||||
Fixed-rate | $ | — | $ | — | $ | 450,000 | $ | 300,000 | $ | 250,000 | $ | 550,000 | $ | 1,550,000 | $ | 1,545,807 | |||||||||||||||
Weighted-average interest rate | — | — | 4.8 | % | 6.8 | % | 4.8 | % | 5.6 | % | 5.5 | % | |||||||||||||||||||
Variable-rate | $ | — | $ | — | $ | 1,074,058 | $ | — | $ | — | $ | 767,940 | $ | 1,841,998 | $ | 1,849,149 | |||||||||||||||
Weighted-average interest rate | — | — | 3.9 | % | — | — | 5.5 | % | 4.5 | % | |||||||||||||||||||||
December 31, 2017 | |||||||||||||||||||||||||||||||
Expected Maturity Dates | |||||||||||||||||||||||||||||||
2018 | 2019 | 2020 | 2021 | 2022 | There- after | Total | Fair Value | ||||||||||||||||||||||||
(Thousands of Dollars, Except Interest Rates) | |||||||||||||||||||||||||||||||
Long-term Debt: | |||||||||||||||||||||||||||||||
Fixed-rate | $ | 350,000 | $ | — | $ | 450,000 | $ | 300,000 | $ | 250,000 | $ | 952,500 | $ | 2,302,500 | $ | 2,355,535 | |||||||||||||||
Weighted-average interest rate | 8.4 | % | — | 4.8 | % | 6.8 | % | 4.8 | % | 6.5 | % | 6.3 | % | ||||||||||||||||||
Variable-rate | $ | — | $ | — | $ | 955,611 | $ | — | $ | — | $ | 365,440 | $ | 1,321,051 | $ | 1,322,087 | |||||||||||||||
Weighted-average interest rate | — | — | 3.1 | % | — | — | 1.7 | % | 2.7 | % | |||||||||||||||||||||
The following table presents information regarding our forward-starting interest rate swap agreements:
Notional Amount | Weighted-Average Fixed Rate | Fair Value | |||||||||||||||||
June 30, 2018 | December 31, 2017 | Period of Hedge | June 30, 2018 | December 31, 2017 | |||||||||||||||
(Thousands of Dollars) | (Thousands of Dollars) | ||||||||||||||||||
$ | — | $ | 350,000 | 04/2018 - 04/2028 | 2.6 | % | $ | — | $ | (5,394 | ) | ||||||||
250,000 | 250,000 | 09/2020 - 09/2030 | 2.8 | % | 4,491 | (4,594 | ) | ||||||||||||
$ | 250,000 | $ | 600,000 | $ | 4,491 | $ | (9,988 | ) | |||||||||||
53
Commodity Price Risk
Since the operations of our fuels marketing segment expose us to commodity price risk, we use derivative instruments to attempt to mitigate the effects of commodity price fluctuations. The derivative instruments we use consist primarily of commodity futures and swap contracts. We have a risk management committee that oversees our trading policies and procedures and certain aspects of risk management. Our risk management committee also reviews all new risk management strategies in accordance with our risk management policy, as approved by our board of directors.
We record commodity derivative instruments in the consolidated balance sheets at fair value. We recognize mark-to-market adjustments for derivative instruments designated and qualifying as fair value hedges (Fair Value Hedges) and the related change in the fair value of the associated hedged physical inventory or firm commitment within “Cost of product sales.” For derivative instruments that have associated underlying physical inventory but do not qualify for hedge accounting (Economic Hedges and Other Derivatives), we record the mark-to-market adjustments in “Cost of product sales.”
The commodity contracts disclosed below represent only those contracts exposed to commodity price risk at the end of the period. Please refer to Note 8 of Condensed Notes to Consolidated Financial Statements in Item 1. “Financial Statements” for the volume and related fair value of all commodity contracts.
June 30, 2018 | ||||||||||||||
Contract Volumes | Weighted Average | Fair Value of Current Asset (Liability) | ||||||||||||
Pay Price | Receive Price | |||||||||||||
(Thousands of Barrels) | (Thousands of Dollars) | |||||||||||||
Fair Value Hedges: | ||||||||||||||
Futures – long: | ||||||||||||||
(refined products) | 2 | $ | 92.81 | N/A | $ | — | ||||||||
Futures – short: | ||||||||||||||
(refined products) | 12 | N/A | $ | 91.46 | $ | (16 | ) | |||||||
Swaps – short: | ||||||||||||||
(refined products) | 64 | N/A | $ | 67.59 | $ | (54 | ) | |||||||
Economic Hedges and Other Derivatives: | ||||||||||||||
Futures – long: | ||||||||||||||
(refined products) | 2 | $ | 91.48 | N/A | $ | 3 | ||||||||
Futures – short: | ||||||||||||||
(refined products) | 5 | N/A | $ | 92.81 | $ | — | ||||||||
Swaps – long: | ||||||||||||||
(refined products) | 236 | $ | 65.57 | N/A | $ | 1,010 | ||||||||
Swaps – short: | ||||||||||||||
(refined products) | 249 | N/A | $ | 65.01 | $ | (1,187 | ) | |||||||
Total fair value of open positions exposed to commodity price risk | $ | (244 | ) | |||||||||||
54
December 31, 2017 | ||||||||||||||
Contract Volumes | Weighted Average | Fair Value of Current Asset (Liability) | ||||||||||||
Pay Price | Receive Price | |||||||||||||
(Thousands of Barrels) | (Thousands of Dollars) | |||||||||||||
Fair Value Hedges: | ||||||||||||||
Futures – long: | ||||||||||||||
(refined products) | 2 | $ | 86.88 | N/A | $ | — | ||||||||
Futures – short: | ||||||||||||||
(refined products) | 5 | N/A | $ | 85.59 | $ | (6 | ) | |||||||
Swaps – short: | ||||||||||||||
(refined products) | 149 | N/A | $ | 55.79 | $ | (106 | ) | |||||||
Economic Hedges and Other Derivatives: | ||||||||||||||
Futures – long: | ||||||||||||||
(refined products) | 10 | $ | 86.13 | N/A | $ | 7 | ||||||||
Futures – short: | ||||||||||||||
(refined products) | 14 | N/A | $ | 85.76 | $ | (16 | ) | |||||||
Swaps – long: | ||||||||||||||
(refined products) | 196 | $ | 55.05 | N/A | $ | 264 | ||||||||
Swaps – short: | ||||||||||||||
(refined products) | 199 | N/A | $ | 53.76 | $ | (525 | ) | |||||||
Total fair value of open positions exposed to commodity price risk | $ | (382 | ) | |||||||||||
55
Item 4. | Controls and Procedures |
(a) | Evaluation of disclosure controls and procedures. |
Our management has evaluated, with the participation of the principal executive officer and principal financial officer of NuStar GP, LLC, the effectiveness of our disclosure controls and procedures (as defined in Rule 13a-15(e) under the Securities Exchange Act of 1934) as of the end of the period covered by this report, and has concluded that our disclosure controls and procedures were effective as of June 30, 2018.
(b) | Changes in internal control over financial reporting. |
There has been no change in our internal control over financial reporting that occurred during our last fiscal quarter that has materially affected, or is reasonably likely to materially affect, our internal control over financial reporting.
56
PART II - OTHER INFORMATION
Item 6. | Exhibits |
Exhibit Number | Description | ||
3.01 | |||
3.02 | |||
4.01 | |||
10.01 | |||
10.02 | |||
10.03 | |||
10.04 | |||
*10.05 | |||
10.06 | |||
10.07 | |||
10.08 | |||
10.09 | |||
10.10 | |||
10.11 | |||
57
Exhibit Number | Description | ||
10.12 | |||
*12.01 | |||
*31.01 | |||
*31.02 | |||
**32.01 | |||
**32.02 | |||
*101.INS | XBRL Instance Document | ||
*101.SCH | XBRL Taxonomy Extension Schema Document | ||
*101.CAL | XBRL Taxonomy Extension Calculation Linkbase Document | ||
*101.DEF | XBRL Taxonomy Extension Definition Linkbase Document | ||
*101.LAB | XBRL Taxonomy Extension Label Linkbase Document | ||
*101.PRE | XBRL Taxonomy Extension Presentation Linkbase Document | ||
* | Filed herewith. | ||
** | Furnished herewith. | ||
58
SIGNATURES
Pursuant to the requirements of the Securities Exchange Act of 1934, the registrant has duly caused this report to be signed on its behalf by the undersigned, thereunto duly authorized.
NUSTAR ENERGY L.P.
(Registrant)
By: Riverwalk Logistics, L.P., its general partner
By: NuStar GP, LLC, its general partner
By: | /s/ Bradley C. Barron | |
Bradley C. Barron | ||
President and Chief Executive Officer | ||
August 7, 2018 | ||
By: | /s/ Thomas R. Shoaf | |
Thomas R. Shoaf | ||
Executive Vice President and Chief Financial Officer | ||
August 7, 2018 | ||
By: | /s/ Jorge A. del Alamo | |
Jorge A. del Alamo | ||
Senior Vice President and Controller | ||
August 7, 2018 | ||
59