Attached files
| file | filename |
|---|---|
| 8-K - 8-K - BEACON ROOFING SUPPLY INC | becn-8k_20180807.htm |
| EX-99.1 - EX-99.1 - BEACON ROOFING SUPPLY INC | becn-ex991_7.htm |

NORTH AMERICA’S LEADING BUILDING MATERIALS DISTRIBUTOR RESIDENTIAL COMMERCIAL INTERIOR SOLAR 2018 THIRD QUARTER EARNINGS CALL Exhibit 99.2
Forward Looking Statements / Non-GAAP Measures This presentation contains information about management's view of the Company's future expectations, plans and prospects that constitute forward-looking statements for purposes of the safe harbor provisions under the Private Securities Litigation Reform Act of 1995. Actual results may differ materially from those indicated by such forward-looking statements as a result of various important factors, including, but not limited to, those set forth in the "Risk Factors" section of the Company's latest Form 10-K. In addition, the forward-looking statements included in this presentation represent the Company's views as of the date of this presentation and these views could change. However, while the Company may elect to update these forward-looking statements at some point, the Company specifically disclaims any obligation to do so, other than as required by federal securities laws. These forward-looking statements should not be relied upon as representing the Company's views as of any date subsequent to the date of this presentation. This presentation contains references to certain financial measures that are not presented in accordance with Generally Accepted Accounting Principles (“GAAP"). The Company utilizes non-GAAP financial measures to analyze and report operating results that are unaffected by differences in capital structures, capital investment cycles, and varying ages of related assets. Although the Company believes these measures provide a useful representation of performance, non-GAAP financial measures should not be considered in isolation or as a substitute for any items calculated in accordance with GAAP. A reconciliation of these non-GAAP financial measures to their most directly comparable GAAP financial measure can be found in the Appendix to this presentation as well as Company’s latest Form 8-K, filed with the SEC on August 7, 2018. www.becn.com
Conference Call Agenda www.becn.com Strategy UpdatePaul Isabella, President & CEO Q3 Results and OutlookJoseph Nowicki, CFO Q&A Closing remarks Paul Isabella, President & CEO
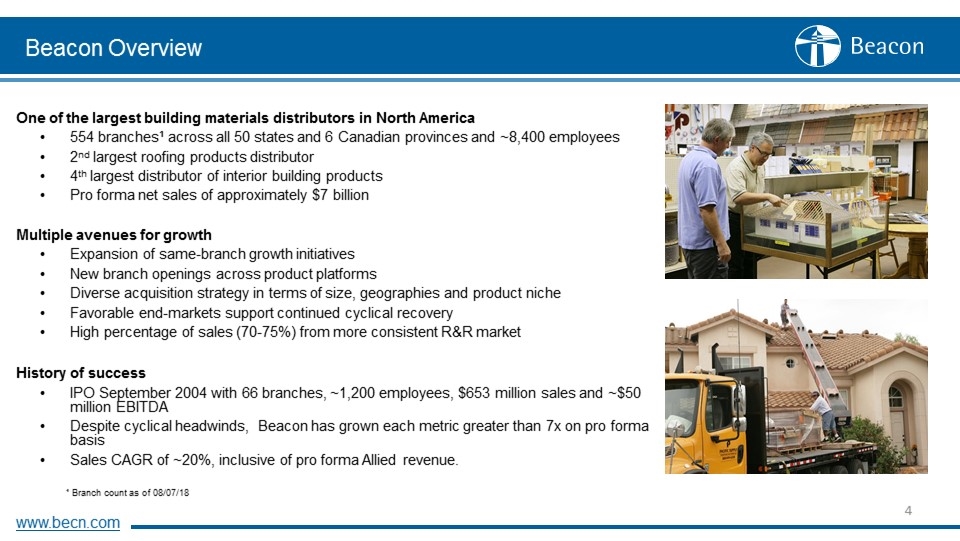
Beacon Overview www.becn.com One of the largest building materials distributors in North America 554 branches¹ across all 50 states and 6 Canadian provinces and ~8,400 employees 2nd largest roofing products distributor 4th largest distributor of interior building products Pro forma net sales of approximately $7 billion Multiple avenues for growth Expansion of same-branch growth initiatives New branch openings across product platforms Diverse acquisition strategy in terms of size, geographies and product niche Favorable end-markets support continued cyclical recovery High percentage of sales (70-75%) from more consistent R&R market History of success IPO September 2004 with 66 branches, ~1,200 employees, $653 million sales and ~$50 million EBITDA Despite cyclical headwinds, Beacon has grown each metric greater than 7x on pro forma basis Sales CAGR of ~20%, inclusive of pro forma Allied revenue. ¹ Branch count as of 08/07/18
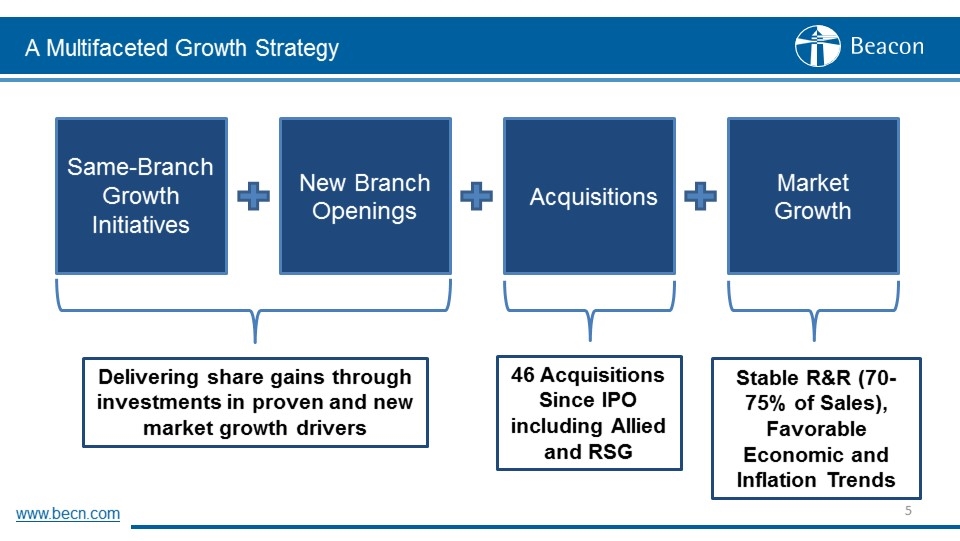
A Multifaceted Growth Strategy www.becn.com Same-Branch Growth Initiatives New Branch Openings Acquisitions Market Growth Delivering share gains through investments in proven and new market growth drivers 46 Acquisitions Since IPO including Allied and RSG Stable R&R (70-75% of Sales), Favorable Economic and Inflation Trends
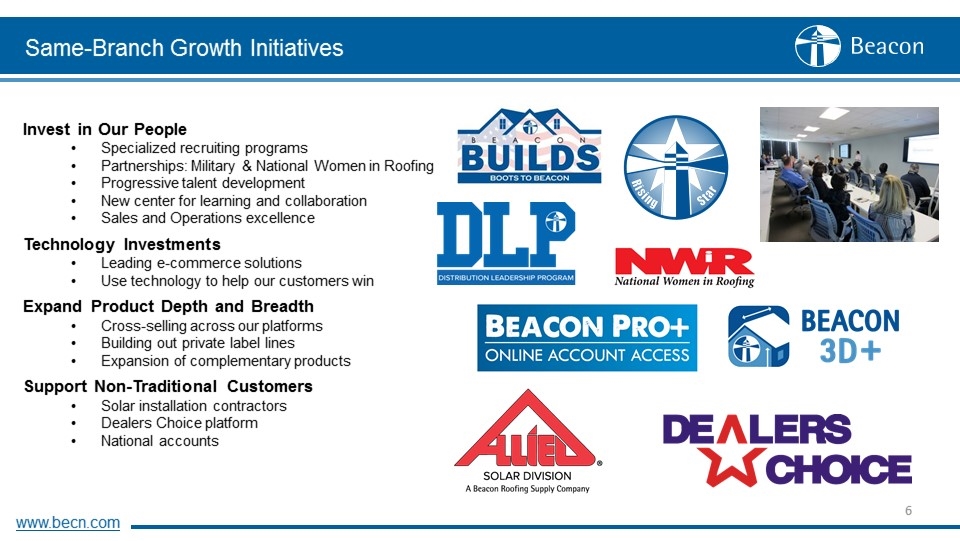
Same-Branch Growth Initiatives www.becn.com Invest in Our People Specialized recruiting programs Partnerships: Military & National Women in Roofing Progressive talent development New center for learning and collaboration Sales and Operations excellence Technology Investments Leading e-commerce solutions Use technology to help our customers win Expand Product Depth and Breadth Cross-selling across our platforms Building out private label lines Expansion of complementary products Support Non-Traditional Customers Solar installation contractors Dealers Choice platform National accounts
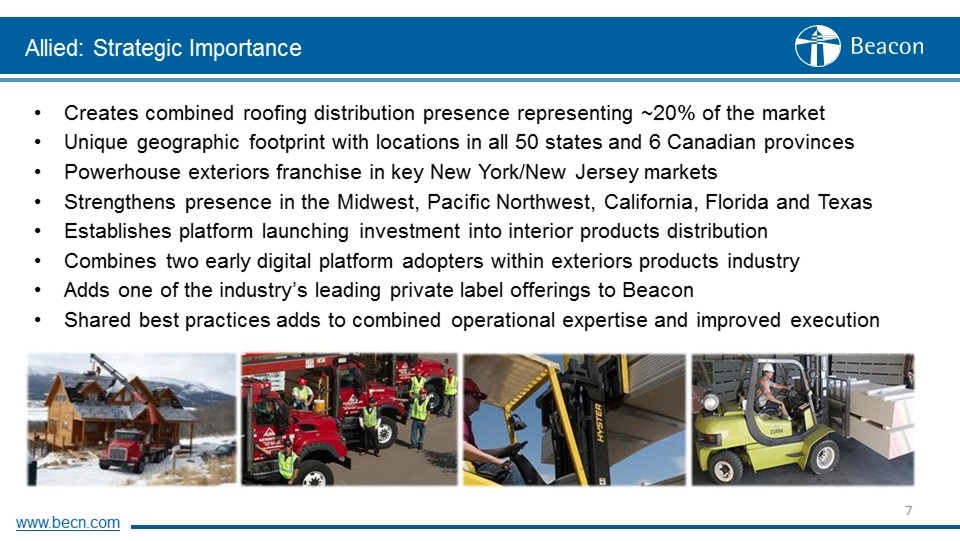
Allied: Strategic Importance www.becn.com Creates combined roofing distribution presence representing ~20% of the market Unique geographic footprint with locations in all 50 states and 6 Canadian provinces Powerhouse exteriors franchise in key New York/New Jersey markets Strengthens presence in the Midwest, Pacific Northwest, California, Florida and Texas Establishes platform launching investment into interior products distribution Combines two early digital platform adopters within exteriors products industry Adds one of the industry’s leading private label offerings to Beacon Shared best practices adds to combined operational expertise and improved execution
Third Quarter 2018 Highlights and Outlook www.becn.com Record Q3 net sales of $1.9 billion; over 59% growth year-over-year Gross margins up 180 bps sequentially and 100 bps vs. prior year Positive price-cost realization across all product categories Record Q3 Adjusted EBITDA1 of $187.7 million vs. $120.0 million in the prior year Integration of Allied progressing ahead of schedule; $25 million in realized synergies YTD Acquired Atlas Supply, Inc. on July 16 – strengthens Waterproofing platform 1 See Appendix for reconciliation
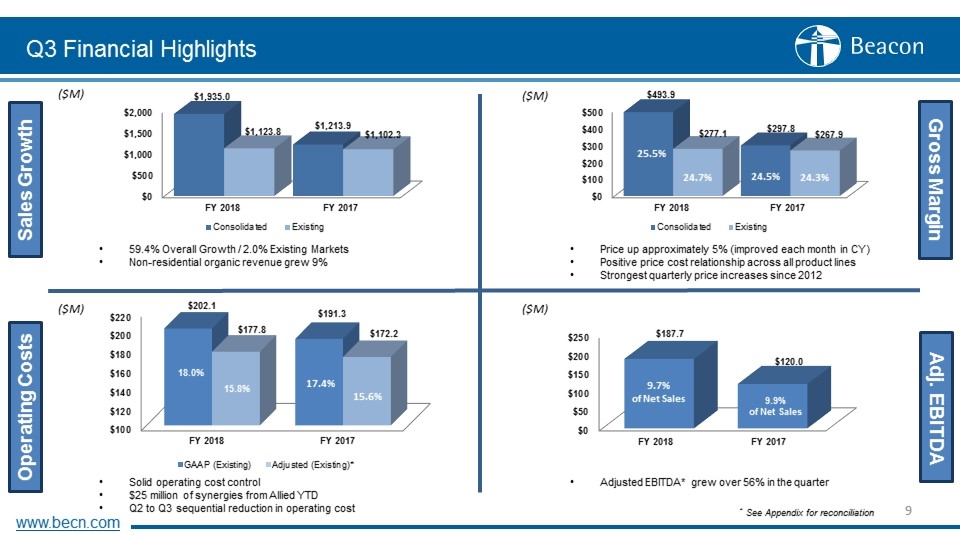
Q3 Financial Highlights Sales Growth Operating Costs Gross Margin Adj. EBITDA 59.4% Overall Growth / 2.0% Existing Markets Non-residential organic revenue grew 9% 24.7% 24.3% 25.5% 24.5% Price up approximately 5% (improved each month in CY) Positive price cost relationship across all product lines Strongest quarterly price increases since 2012 Solid operating cost control $25 million of synergies from Allied YTD Q2 to Q3 sequential reduction in operating cost ($M) Adjusted EBITDA* grew over 56% in the quarter 9.7% of Net Sales 9.9% of Net Sales * See Appendix for reconciliation www.becn.com ($M) ($M) ($M)
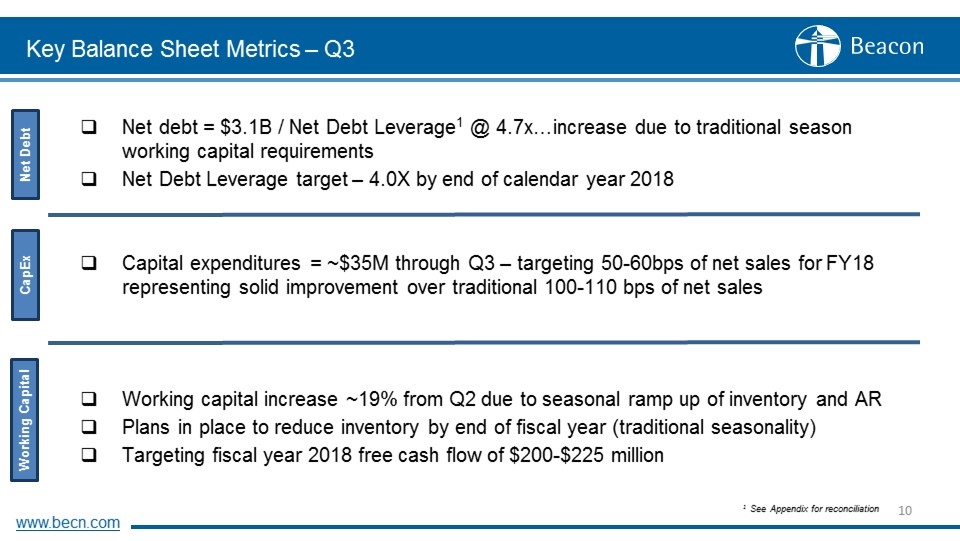
Net debt = $3.1B / Net Debt Leverage1 @ 4.7x…increase due to traditional season working capital requirements Net Debt Leverage target – 4.0X by end of calendar year 2018 Capital expenditures = ~$35M through Q3 – targeting 50-60bps of net sales for FY18 representing solid improvement over traditional 100-110 bps of net sales Working capital increase ~19% from Q2 due to seasonal ramp up of inventory and AR Plans in place to reduce inventory by end of fiscal year (traditional seasonality) Targeting fiscal year 2018 free cash flow of $200-$225 million Key Balance Sheet Metrics – Q3 23.2% 1 See Appendix for reconciliation Net Debt CapEx Working Capital www.becn.com
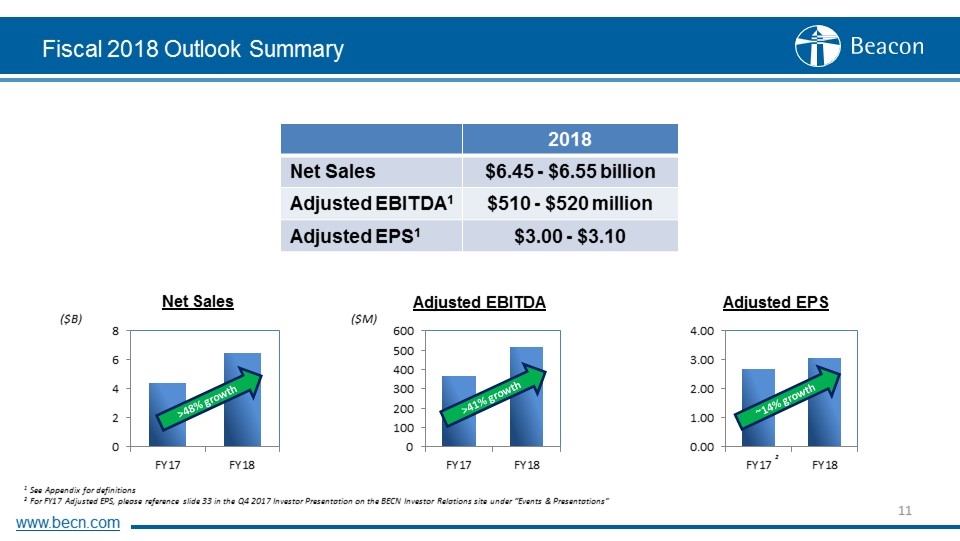
Fiscal 2018 Outlook Summary 1 See Appendix for definitions 2 For FY17 Adjusted EPS, please reference slide 33 in the Q4 2017 Investor Presentation on the BECN Investor Relations site under “Events & Presentations” 2018 Net Sales $6.45 - $6.55 billion Adjusted EBITDA1 $510 - $520 million Adjusted EPS1 $3.00 - $3.10 www.becn.com Net Sales ($B) Adjusted EBITDA Adjusted EPS ($M) >48% growth >41% growth ~14% growth 2
Summary Solid long-term outlook in highly attractive market with steady Repair & Remodel Positive price-cost realization within all product categories Ahead of second quarter 2018 guidance Pricing disciplined in the industry despite softer near-term demand environment Remain focused on growth with several growth initiatives Personnel Investments Technology Investments Expanded Product Breadth and Depth New Customers and Markets Continuation of successful Allied integration and the two additional acquisitions this year www.becn.com
Appendix www.becn.com
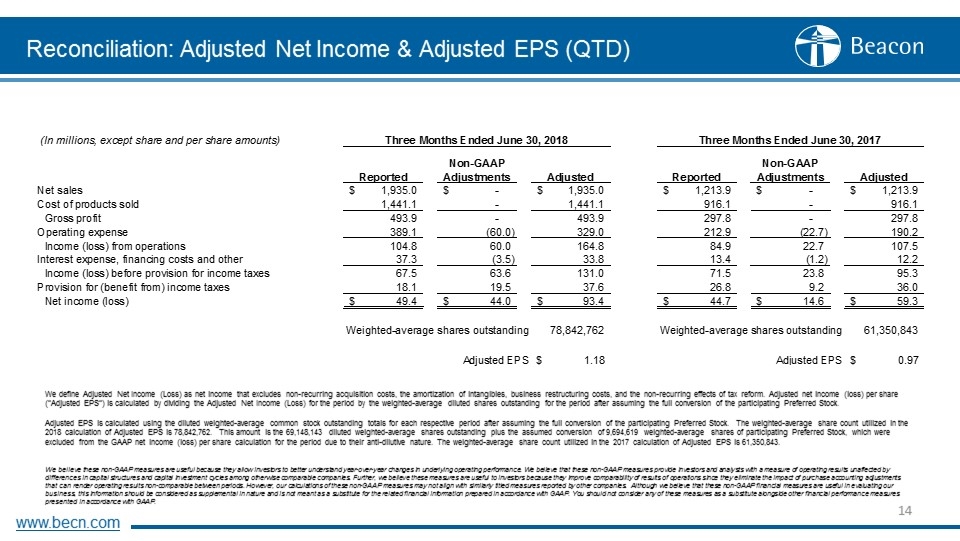
Reconciliation: Adjusted Net Income & Adjusted EPS (QTD) We define Adjusted Net Income (Loss) as net income that excludes non-recurring acquisition costs, the amortization of intangibles, business restructuring costs, and the non-recurring effects of tax reform. Adjusted net income (loss) per share (“Adjusted EPS”) is calculated by dividing the Adjusted Net Income (Loss) for the period by the weighted-average diluted shares outstanding for the period after assuming the full conversion of the participating Preferred Stock. Adjusted EPS is calculated using the diluted weighted-average common stock outstanding totals for each respective period after assuming the full conversion of the participating Preferred Stock. The weighted-average share count utilized in the 2018 calculation of Adjusted EPS is 78,842,762. This amount is the 69,148,143 diluted weighted-average shares outstanding plus the assumed conversion of 9,694,619 weighted-average shares of participating Preferred Stock, which were excluded from the GAAP net income (loss) per share calculation for the period due to their anti-dilutive nature. The weighted-average share count utilized in the 2017 calculation of Adjusted EPS is 61,350,843. We believe these non-GAAP measures are useful because they allow investors to better understand year-over-year changes in underlying operating performance. We believe that these non-GAAP measures provide investors and analysts with a measure of operating results unaffected by differences in capital structures and capital investment cycles among otherwise comparable companies. Further, we believe these measures are useful to investors because they improve comparability of results of operations since they eliminate the impact of purchase accounting adjustments that can render operating results non-comparable between periods. However, our calculations of these non-GAAP measures may not align with similarly titled measures reported by other companies. Although we believe that these non-GAAP financial measures are useful in evaluating our business, this information should be considered as supplemental in nature and is not meant as a substitute for the related financial information prepared in accordance with GAAP. You should not consider any of these measures as a substitute alongside other financial performance measures presented in accordance with GAAP. www.becn.com
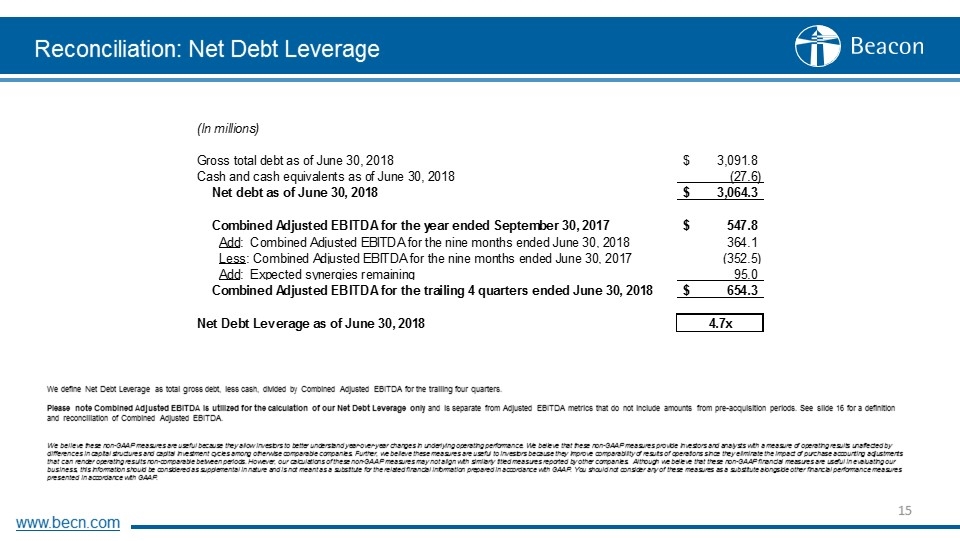
Reconciliation: Net Debt Leverage www.becn.com We define Net Debt Leverage as total gross debt, less cash, divided by Combined Adjusted EBITDA for the trailing four quarters. Please note Combined Adjusted EBITDA is utilized for the calculation of our Net Debt Leverage only and is separate from Adjusted EBITDA metrics that do not include amounts from pre-acquisition periods. See slide 16 for a definition and reconciliation of Combined Adjusted EBITDA. We believe these non-GAAP measures are useful because they allow investors to better understand year-over-year changes in underlying operating performance. We believe that these non-GAAP measures provide investors and analysts with a measure of operating results unaffected by differences in capital structures and capital investment cycles among otherwise comparable companies. Further, we believe these measures are useful to investors because they improve comparability of results of operations since they eliminate the impact of purchase accounting adjustments that can render operating results non-comparable between periods. However, our calculations of these non-GAAP measures may not align with similarly titled measures reported by other companies. Although we believe that these non-GAAP financial measures are useful in evaluating our business, this information should be considered as supplemental in nature and is not meant as a substitute for the related financial information prepared in accordance with GAAP. You should not consider any of these measures as a substitute alongside other financial performance measures presented in accordance with GAAP.
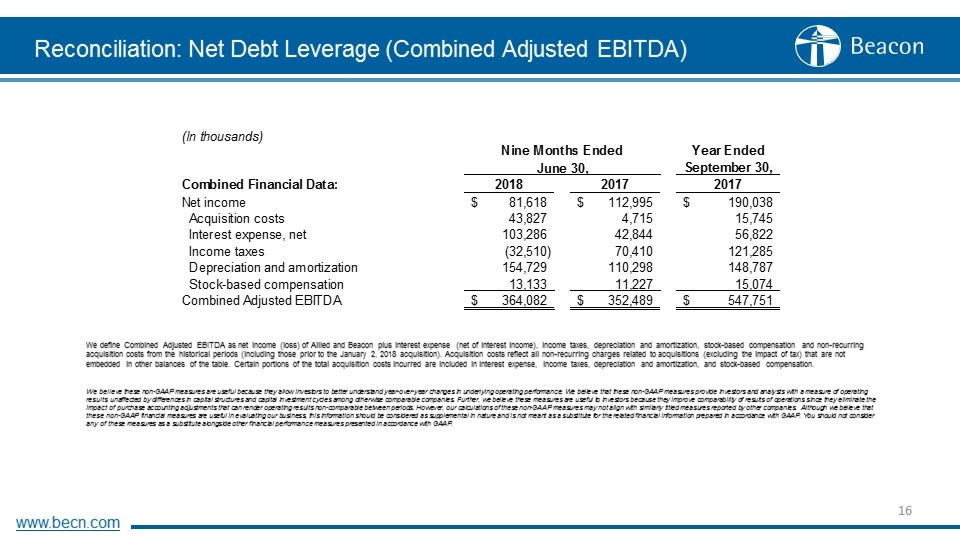
Reconciliation: Net Debt Leverage (Combined Adjusted EBITDA) We define Combined Adjusted EBITDA as net income (loss) of Allied and Beacon plus interest expense (net of interest income), income taxes, depreciation and amortization, stock-based compensation and non-recurring acquisition costs from the historical periods (including those prior to the January 2, 2018 acquisition). Acquisition costs reflect all non-recurring charges related to acquisitions (excluding the impact of tax) that are not embedded in other balances of the table. Certain portions of the total acquisition costs incurred are included in interest expense, income taxes, depreciation and amortization, and stock-based compensation. We believe these non-GAAP measures are useful because they allow investors to better understand year-over-year changes in underlying operating performance. We believe that these non-GAAP measures provide investors and analysts with a measure of operating results unaffected by differences in capital structures and capital investment cycles among otherwise comparable companies. Further, we believe these measures are useful to investors because they improve comparability of results of operations since they eliminate the impact of purchase accounting adjustments that can render operating results non-comparable between periods. However, our calculations of these non-GAAP measures may not align with similarly titled measures reported by other companies. Although we believe that these non-GAAP financial measures are useful in evaluating our business, this information should be considered as supplemental in nature and is not meant as a substitute for the related financial information prepared in accordance with GAAP. You should not consider any of these measures as a substitute alongside other financial performance measures presented in accordance with GAAP. www.becn.com
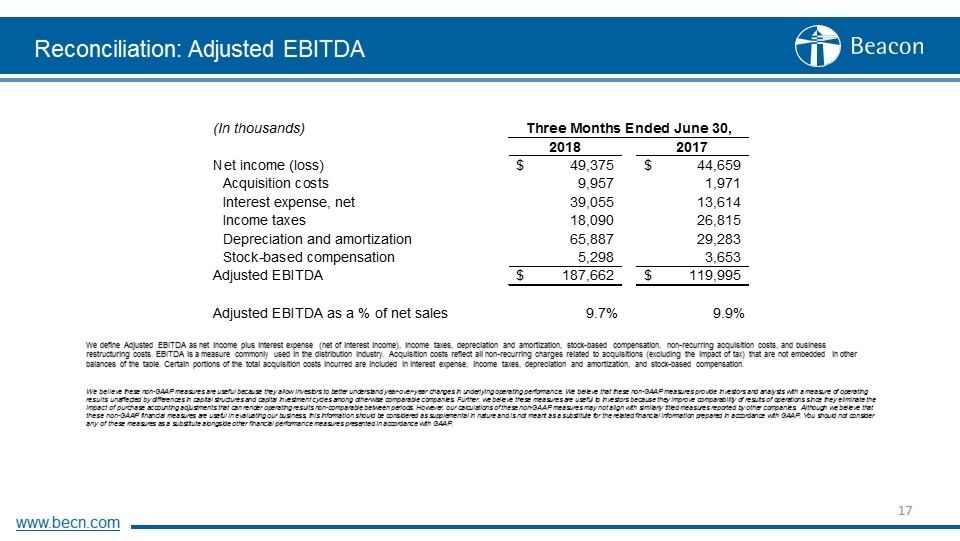
Reconciliation: Adjusted EBITDA We define Adjusted EBITDA as net income plus interest expense (net of interest income), income taxes, depreciation and amortization, stock-based compensation, non-recurring acquisition costs, and business restructuring costs. EBITDA is a measure commonly used in the distribution industry. Acquisition costs reflect all non-recurring charges related to acquisitions (excluding the impact of tax) that are not embedded in other balances of the table. Certain portions of the total acquisition costs incurred are included in interest expense, income taxes, depreciation and amortization, and stock-based compensation. We believe these non-GAAP measures are useful because they allow investors to better understand year-over-year changes in underlying operating performance. We believe that these non-GAAP measures provide investors and analysts with a measure of operating results unaffected by differences in capital structures and capital investment cycles among otherwise comparable companies. Further, we believe these measures are useful to investors because they improve comparability of results of operations since they eliminate the impact of purchase accounting adjustments that can render operating results non-comparable between periods. However, our calculations of these non-GAAP measures may not align with similarly titled measures reported by other companies. Although we believe that these non-GAAP financial measures are useful in evaluating our business, this information should be considered as supplemental in nature and is not meant as a substitute for the related financial information prepared in accordance with GAAP. You should not consider any of these measures as a substitute alongside other financial performance measures presented in accordance with GAAP. www.becn.com
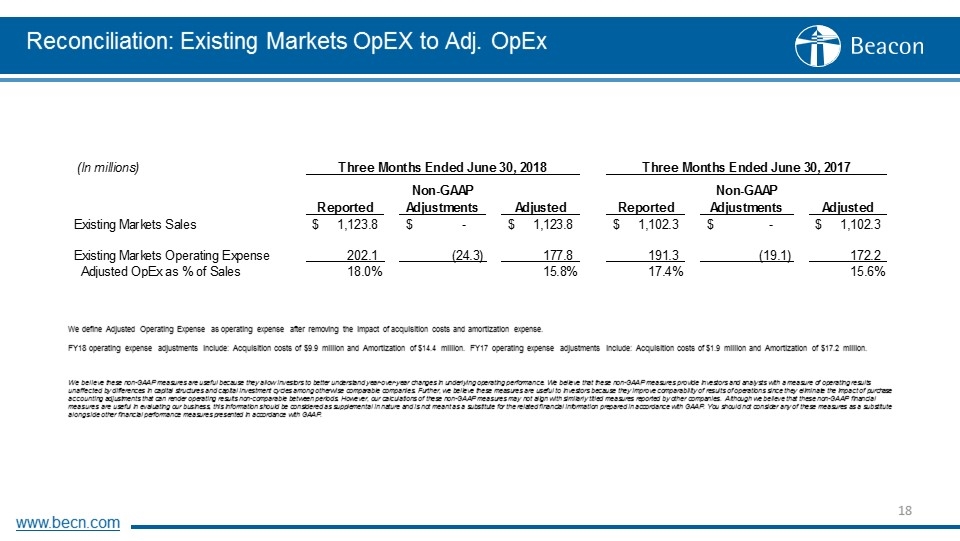
Reconciliation: Existing Markets OpEX to Adj. OpEx We define Adjusted Operating Expense as operating expense after removing the impact of acquisition costs and amortization expense. FY18 operating expense adjustments include: Acquisition costs of $9.9 million and Amortization of $14.4 million. FY17 operating expense adjustments include: Acquisition costs of $1.9 million and Amortization of $17.2 million. We believe these non-GAAP measures are useful because they allow investors to better understand year-over-year changes in underlying operating performance. We believe that these non-GAAP measures provide investors and analysts with a measure of operating results unaffected by differences in capital structures and capital investment cycles among otherwise comparable companies. Further, we believe these measures are useful to investors because they improve comparability of results of operations since they eliminate the impact of purchase accounting adjustments that can render operating results non-comparable between periods. However, our calculations of these non-GAAP measures may not align with similarly titled measures reported by other companies. Although we believe that these non-GAAP financial measures are useful in evaluating our business, this information should be considered as supplemental in nature and is not meant as a substitute for the related financial information prepared in accordance with GAAP. You should not consider any of these measures as a substitute alongside other financial performance measures presented in accordance with GAAP. www.becn.com
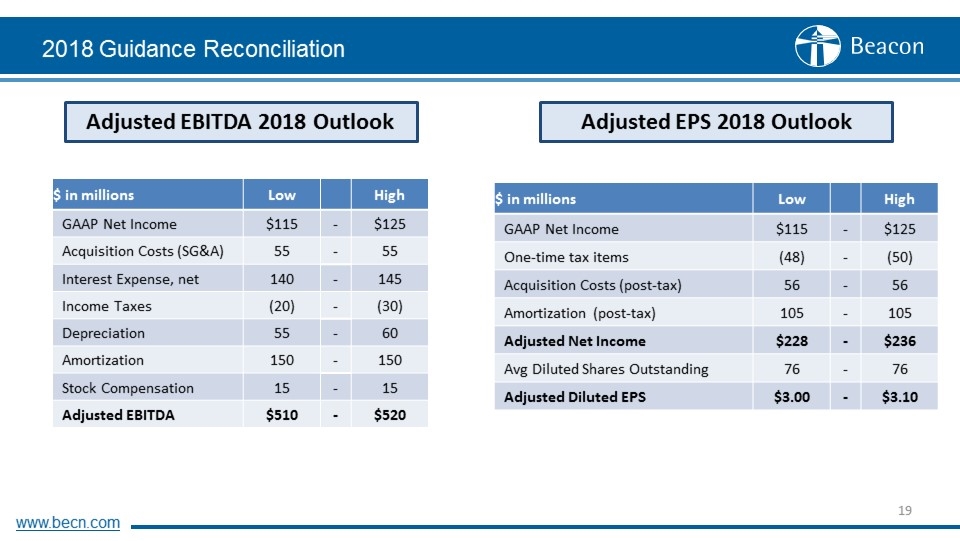
2018 Guidance Reconciliation www.becn.com Adjusted EBITDA 2018 Outlook Adjusted EPS 2018 Outlook $ in millions Low High GAAP Net Income $115 - $125 Acquisition Costs (SG&A) 55 - 55 Interest Expense, net 140 - 145 Income Taxes (20) - (30) Depreciation 55 - 60 Amortization 150 - 150 Stock Compensation 15 - 15 Adjusted EBITDA $510 - $520 $ in millions Low High GAAP Net Income $115 - $125 One-time tax items (48) - (50) Acquisition Costs (post-tax) 56 - 56 Amortization (post-tax) 105 - 105 Adjusted Net Income $228 - $236 Avg Diluted Shares Outstanding 76 - 76 Adjusted Diluted EPS $3.00 - $3.10
