Attached files
| file | filename |
|---|---|
| 8-K - 8-K 3RD QUARTER FISCAL 2018 INVESTOR PRESENTATION - MATTHEWS INTERNATIONAL CORP | form8-k_3q2018xinvestorxpr.htm |
INVESTOR PRESENTATION 3rd QUARTER FISCAL 2018 ©2016 Matthews International Corporation. All Rights Reserved.
Business Overview ©2016 Matthews International Corporation. All Rights Reserved. 2
Disclaimer Any forward-looking statements with respect to Matthews International Corporation (the “Company”) in connection with this presentation are being made pursuant to the safe harbor provisions of the Private Securities Litigation Reform Act of 1995. Such forward-looking statements involve known and unknown risks and uncertainties that may cause the Company’s actual results in future periods to be materially different from management’s expectations. Although the Company believes that the expectations reflected in such forward-looking statements are reasonable, no assurance can be given that such expectations will prove correct. Factors that could cause the Company’s results to differ from those presented herein are set forth in the Company’s Annual Report on Form 10-K and other periodic filings with the Securities and Exchange Commission (“SEC”). The Company periodically provides information derived from financial data which is not presented in the consolidated financial statements prepared in accordance with U.S. generally accepted accounting principles (“GAAP”). Certain of this information are considered “non-GAAP financial measures” under the SEC rules. The Company believes that this information provides management and investors with a useful measure of the Company’s financial performance on a comparable basis. These non-GAAP financial measures are supplemental to the Company’s GAAP disclosures and should not be considered an alternative to the GAAP financial information. The Company uses non-GAAP financial measures to assist in comparing its performance on a consistent basis for purposes of business decision making by removing the impact of certain items that management believes do not directly reflect the Company’s core operations including acquisition-related items, system-integration costs, adjustments related to intangible assets, litigation items, and strategic initiative and other charges, which includes non-recurring charges related to operational initiatives and exit activities. Management believes that presenting non-GAAP financial measures is useful to investors because it (i) provides investors with meaningful supplemental information regarding financial performance by excluding certain items, (ii) permits investors to view performance using the same tools that management uses to budget, forecast, make operating and strategic decisions, and evaluate historical performance, and (iii) otherwise provides supplemental information that may be useful to investors in evaluating the Company’s results. The Company believes that the presentation of these non-GAAP financial measures, when considered together with the corresponding GAAP financial measures and the reconciliations to those measures, provided herein, provides investors with an additional understanding of the factors and trends affecting the Company’s business that could not be obtained absent these disclosures. The Company has presented free cash flow and free cash flow yield as supplemental measures of cash flow that are not required by, or presented in accordance with, GAAP. Management believes that these measures provide relevant and useful information, which is widely used by analysts and investors as well as by our management. These measures provide management with insight on the cash generated by operations, excluding certain expenses, above and beyond the annual capital expenditures. These measures allows management, as well as analysts and investors, to assess the Company’s ability to pursue growth and investment opportunities designed to increase Shareholder value. The Company also has presented adjusted operating profit and believes that it provides relevant and useful information, which is widely used by analysts and investors, as well as by the Company’s management in assessing both consolidated and segment performance. Adjusted operating profit provides the Company with an understanding of the results from the primary operations of its business by excluding the effects of certain acquisition and system-integration costs, and items that do not reflect the ordinary earnings of the Company’s operations. This measure may be useful to an investor in evaluating the underlying primary operating performance of the Company’s segments and business overall on a consistent basis. Similarly, the Company believes that EBITDA and adjusted EBITDA provide relevant and useful information, which is widely used by analysts and investors, as well as by the Company’s management in assessing the performance of its business. Adjusted EBITDA provides the Company with an understanding of earnings before the impact of investing and financing charges and income taxes, and the effects of certain acquisition and system-integration costs, and items that do not reflect the ordinary earnings of the Company’s operations. This measure may be useful to an investor in evaluating operating performance. It is also useful as a financial measure for lenders and is used by the Company’s management to measure performance as well as strategic planning and forecasting. The Company has also presented adjusted earnings per share and believes it provides relevant and useful information, which is widely used by analysts and investors, as well as by the Company’s management in assessing the performance of its business. Adjusted earnings per share provides the Company with an understanding of the results from the primary operations of our business by excluding the per share effects of certain acquisition and system-integration costs, and items that do not reflect the ordinary earnings of our operations. This measure provides management with insight into the earning value for shareholders excluding certain costs, not related to the Company’s primary operations. Likewise, this measure may be useful to an investor in evaluating the underlying operating performance of the Company’s business overall, as well as performance trends, on a consistent basis. The Company has also presented adjusted net income and believes it provides relevant and useful information, which is widely used by analysts and investors, as well as by the Company’s management in assessing financial performance. Adjusted net income provides the Company with an understanding of the results from the primary operations of its business by excluding the effects of certain acquisition and system-integration costs, and items that do not reflect the ordinary earnings of the Company’s operations. This measure may be useful to an investor in evaluating the underlying performance of the business. Lastly, the Company has presented net debt and the ratio of net debt to adjusted EBITDA and believes it provides relevant and useful information, which is widely used by analysts and investors, as well as by the Company’s management in assessing the overall indebtedness and leverage. These measures provide the Company with an understanding of its leverage before the impact of investing and financing charges and other charges that do not reflect the ordinary earnings of the Company’s operations. These measures may be useful to an investor in evaluating indebtedness and leverage of the business. ©2016 Matthews International Corporation. All Rights Reserved. 3
Matthews ➢ Founded in 1850 – headquartered in Pittsburgh, PA ➢ Three business segments: ▪ SGK Brand Solutions ▪ Memorialization ▪ Industrial Technologies ➢ Approximately 11,000 employees ➢ Over 25 countries ➢ NASDAQ – 32.1 million shares outstanding, as of June 30, 2018 ©2016 Matthews International Corporation. All Rights Reserved. 4
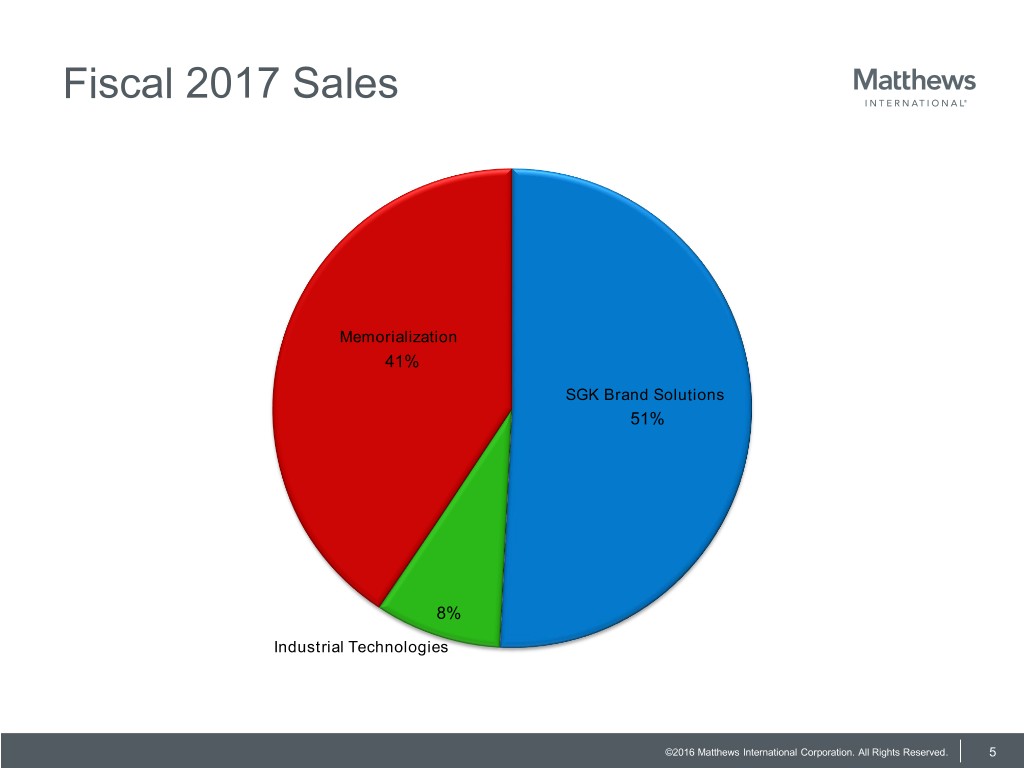
Fiscal 2017 Sales Memorialization 41% SGK Brand Solutions 51% 8% Industrial Technologies ©2016 Matthews International Corporation. All Rights Reserved. 5
SGK BRAND SOLUTIONS ©2016 Matthews International Corporation. All Rights Reserved. 6
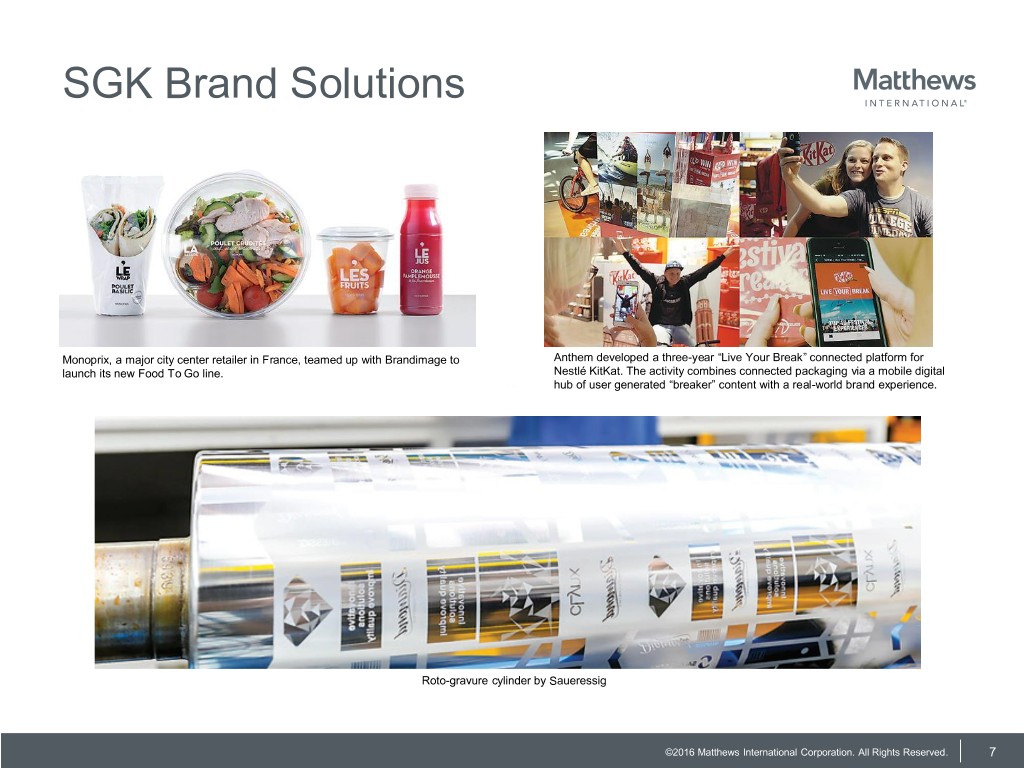
SGK Brand Solutions Monoprix, a major city center retailer in France, teamed up with Brandimage to Anthem developed a three-year “Live Your Break” connected platform for launch its new Food To Go line. Nestlé KitKat. The activity combines connected packaging via a mobile digital hub of user generated “breaker” content with a real-world brand experience. Roto-gravure cylinder by Saueressig ©2016 Matthews International Corporation. All Rights Reserved. 7
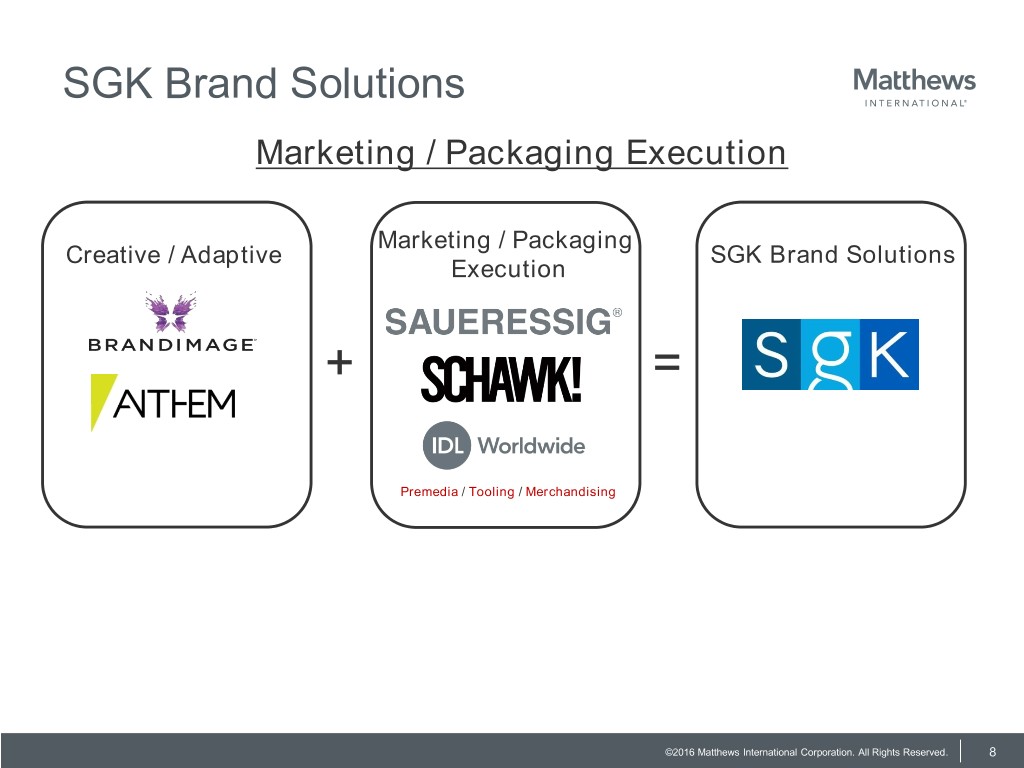
SGK Brand Solutions Marketing / Packaging Execution Marketing / Packaging Creative / Adaptive SGK Brand Solutions Execution + = Premedia / Tooling / Merchandising ©2016 Matthews International Corporation. All Rights Reserved. 8
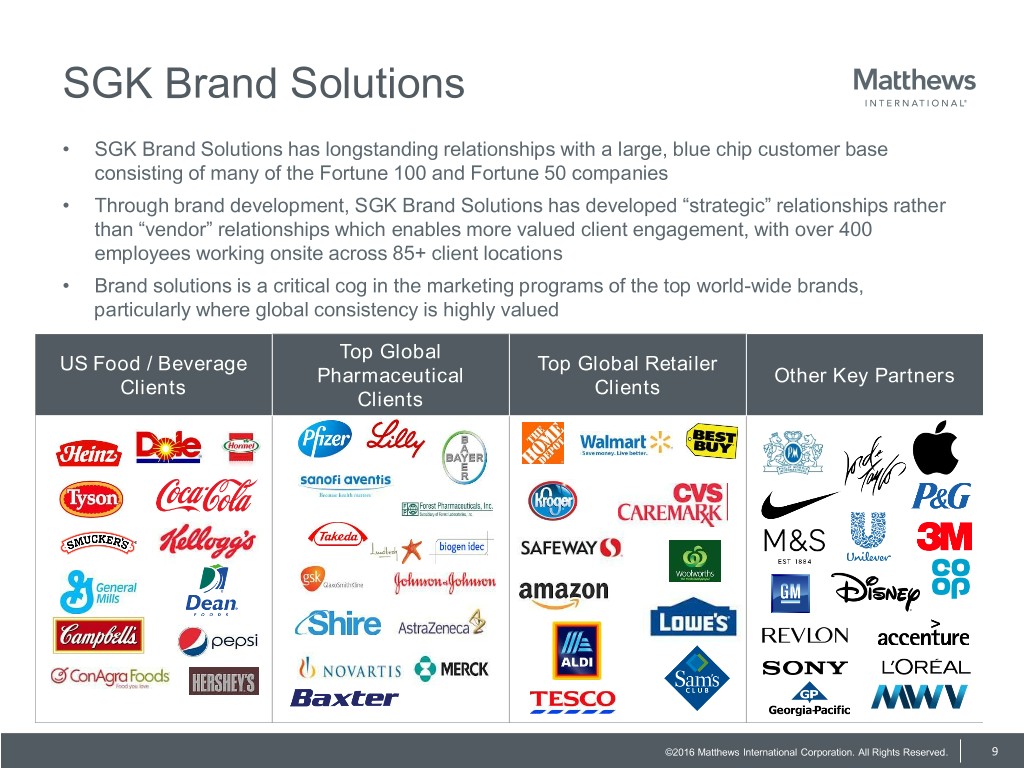
SGK Brand Solutions • SGK Brand Solutions has longstanding relationships with a large, blue chip customer base consisting of many of the Fortune 100 and Fortune 50 companies • Through brand development, SGK Brand Solutions has developed “strategic” relationships rather than “vendor” relationships which enables more valued client engagement, with over 400 employees working onsite across 85+ client locations • Brand solutions is a critical cog in the marketing programs of the top world-wide brands, particularly where global consistency is highly valued Top Global US Food / Beverage Top Global Retailer Pharmaceutical Other Key Partners Clients Clients Clients ©2016 Matthews International Corporation. All Rights Reserved. 9
MEMORIALIZATION ©2016 Matthews International Corporation. All Rights Reserved. 10
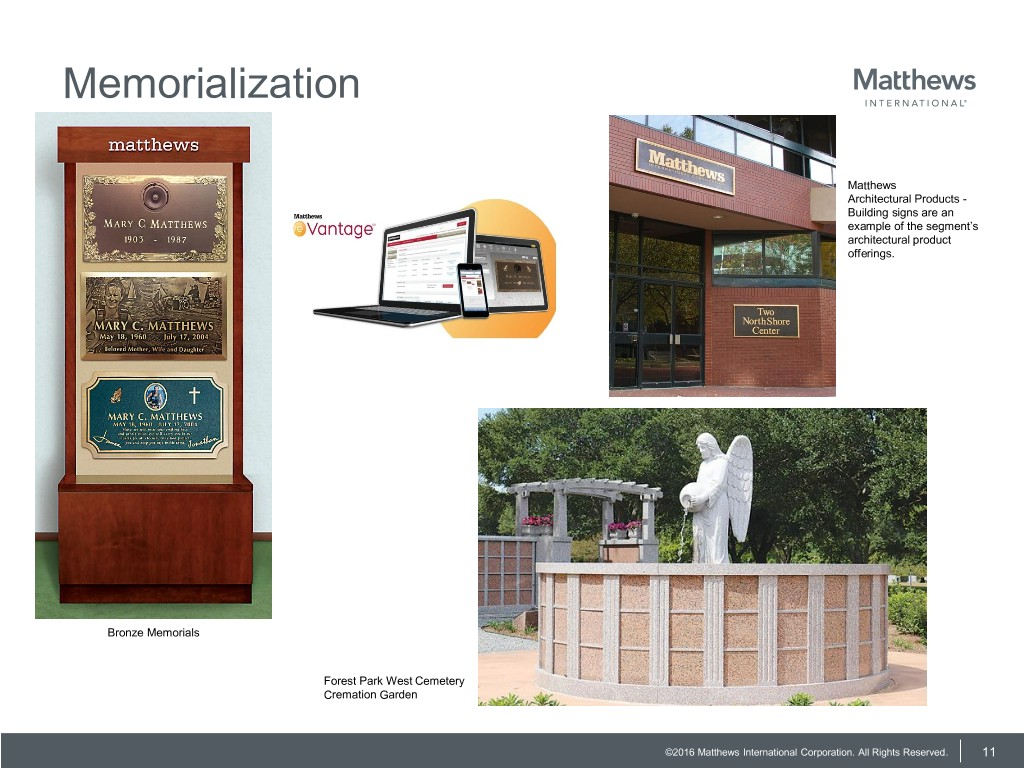
Memorialization Matthews Architectural Products - Building signs are an example of the segment’s architectural product offerings. Bronze Memorials Forest Park West Cemetery Cremation Garden ©2016 Matthews International Corporation. All Rights Reserved. 11
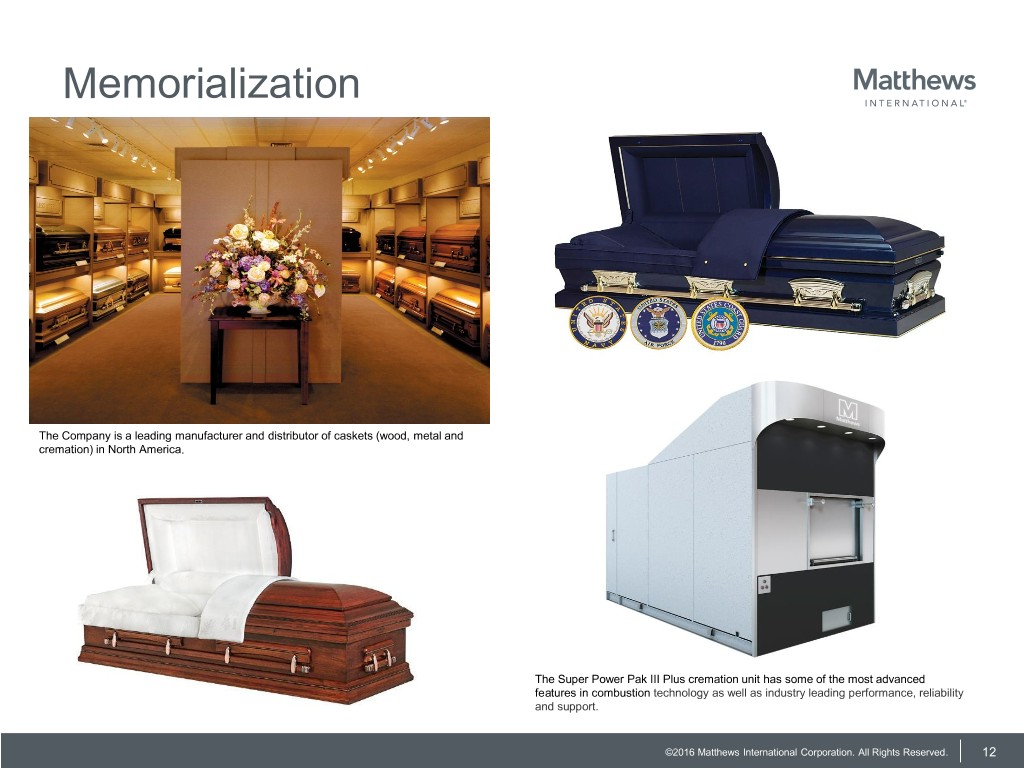
Memorialization The Company is a leading manufacturer and distributor of caskets (wood, metal and cremation) in North America. The Super Power Pak III Plus cremation unit has some of the most advanced features in combustion technology as well as industry leading performance, reliability and support. ©2016 Matthews International Corporation. All Rights Reserved. 12
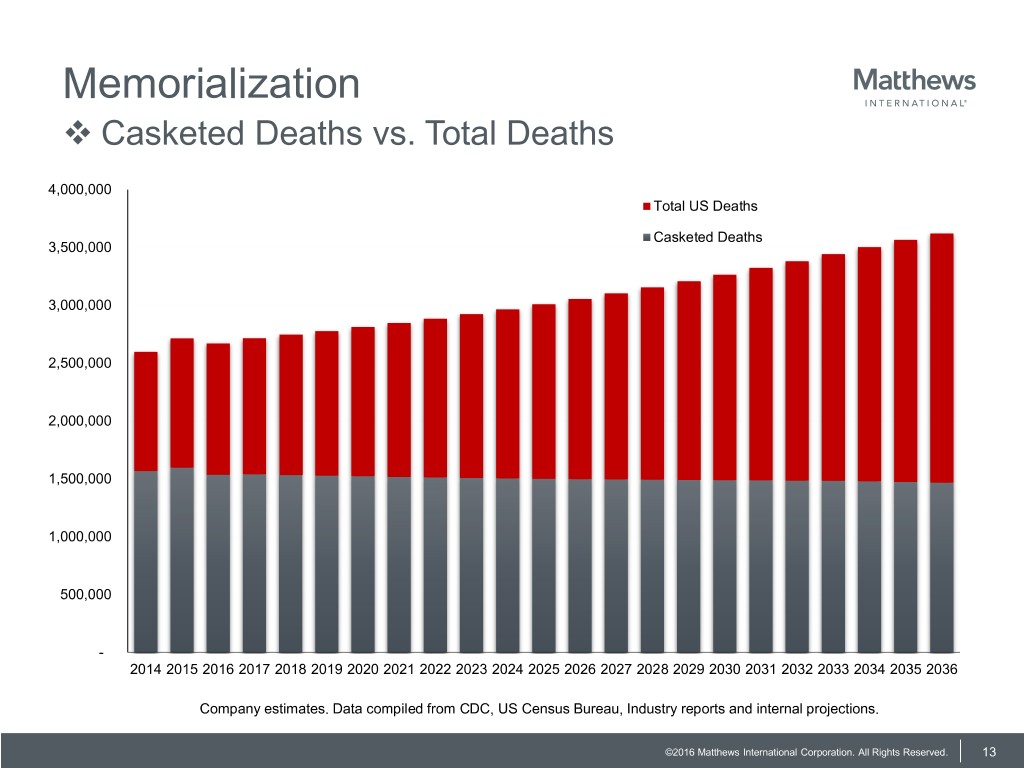
Memorialization ❖ Casketed Deaths vs. Total Deaths 4,000,000 Total US Deaths Casketed Deaths 3,500,000 3,000,000 2,500,000 2,000,000 1,500,000 1,000,000 500,000 - 2014 2015 2016 2017 2018 2019 2020 2021 2022 2023 2024 2025 2026 2027 2028 2029 2030 2031 2032 2033 2034 2035 2036 Company estimates. Data compiled from CDC, US Census Bureau, Industry reports and internal projections. ©2016 Matthews International Corporation. All Rights Reserved. 13
INDUSTRIAL TECHNOLOGIES ©2016 Matthews International Corporation. All Rights Reserved. 14
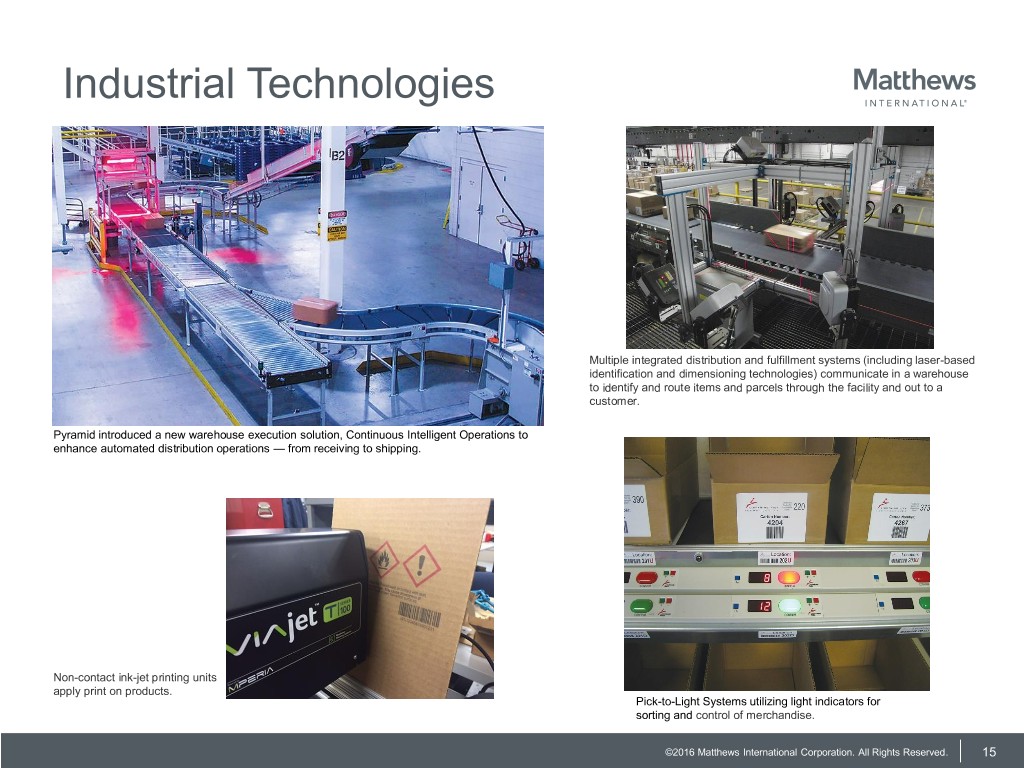
Industrial Technologies Multiple integrated distribution and fulfillment systems (including laser-based identification and dimensioning technologies) communicate in a warehouse to identify and route items and parcels through the facility and out to a customer. Pyramid introduced a new warehouse execution solution, Continuous Intelligent Operations to enhance automated distribution operations — from receiving to shipping. Non-contact ink-jet printing units apply print on products. Pick-to-Light Systems utilizing light indicators for sorting and control of merchandise. ©2016 Matthews International Corporation. All Rights Reserved. 15
Financial Overview ©2016 Matthews International Corporation. All Rights Reserved. 16
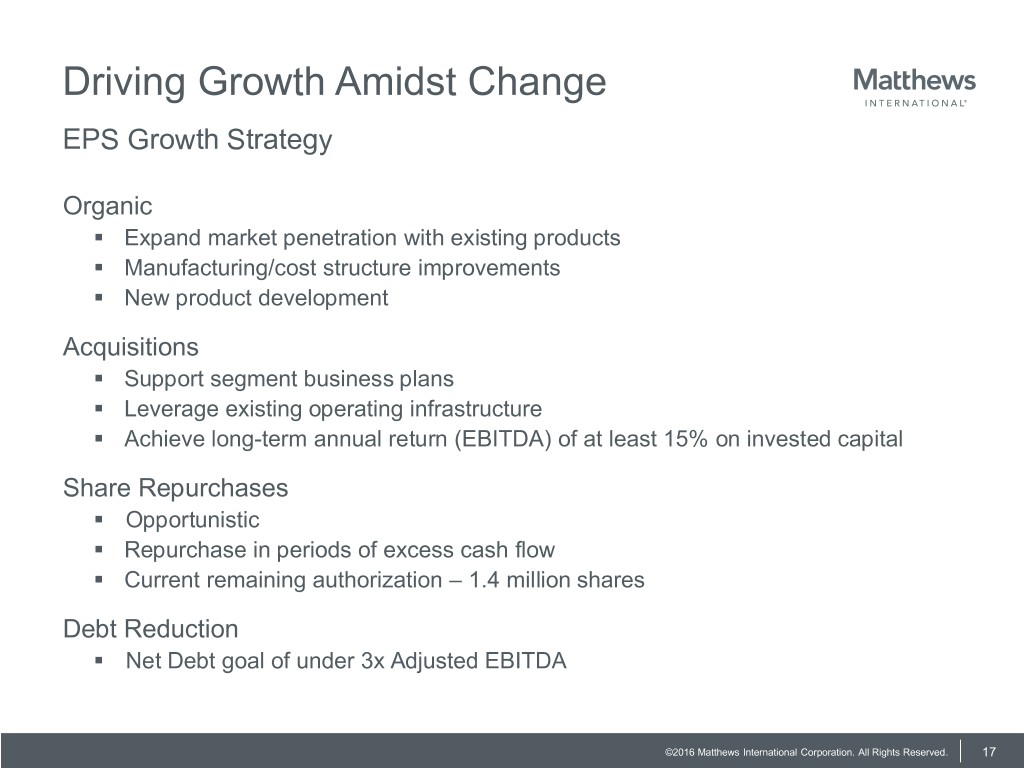
Driving Growth Amidst Change EPS Growth Strategy Organic ▪ Expand market penetration with existing products ▪ Manufacturing/cost structure improvements ▪ New product development Acquisitions ▪ Support segment business plans ▪ Leverage existing operating infrastructure ▪ Achieve long-term annual return (EBITDA) of at least 15% on invested capital Share Repurchases ▪ Opportunistic ▪ Repurchase in periods of excess cash flow ▪ Current remaining authorization – 1.4 million shares Debt Reduction ▪ Net Debt goal of under 3x Adjusted EBITDA ©2016 Matthews International Corporation. All Rights Reserved. 17
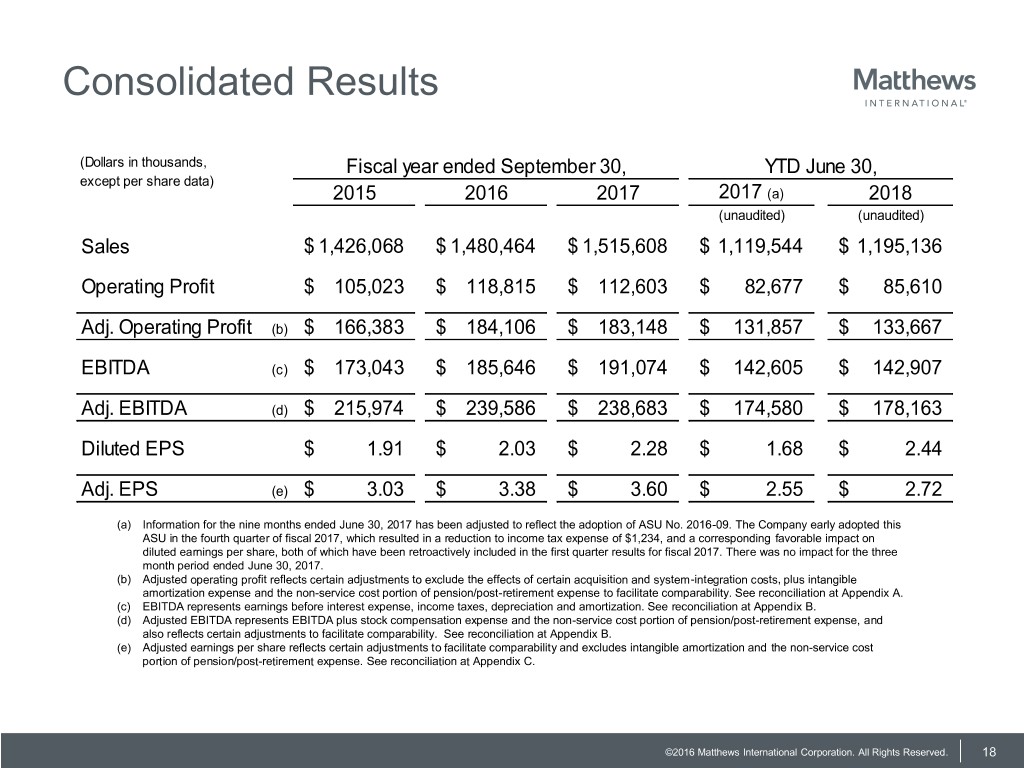
Consolidated Results (Dollars in thousands, Fiscal year ended September 30, YTD June 30, except per share data) 2015 2016 2017 2017 (a) 2018 (unaudited) (unaudited) Sales $ 1,426,068 $ 1,480,464 $ 1,515,608 $ 1,119,544 $ 1,195,136 Operating Profit $ 105,023 $ 118,815 $ 112,603 $ 82,677 $ 85,610 Adj. Operating Profit (b) $ 166,383 $ 184,106 $ 183,148 $ 131,857 $ 133,667 EBITDA (c) $ 173,043 $ 185,646 $ 191,074 $ 142,605 $ 142,907 Adj. EBITDA (d) $ 215,974 $ 239,586 $ 238,683 $ 174,580 $ 178,163 Diluted EPS $ 1.91 $ 2.03 $ 2.28 $ 1.68 $ 2.44 Adj. EPS (e) $ 3.03 $ 3.38 $ 3.60 $ 2.55 $ 2.72 (a) Information for the nine months ended June 30, 2017 has been adjusted to reflect the adoption of ASU No. 2016-09. The Company early adopted this ASU in the fourth quarter of fiscal 2017, which resulted in a reduction to income tax expense of $1,234, and a corresponding favorable impact on diluted earnings per share, both of which have been retroactively included in the first quarter results for fiscal 2017. There was no impact for the three month period ended June 30, 2017. (b) Adjusted operating profit reflects certain adjustments to exclude the effects of certain acquisition and system-integration costs, plus intangible amortization expense and the non-service cost portion of pension/post-retirement expense to facilitate comparability. See reconciliation at Appendix A. (c) EBITDA represents earnings before interest expense, income taxes, depreciation and amortization. See reconciliation at Appendix B. (d) Adjusted EBITDA represents EBITDA plus stock compensation expense and the non-service cost portion of pension/post-retirement expense, and also reflects certain adjustments to facilitate comparability. See reconciliation at Appendix B. (e) Adjusted earnings per share reflects certain adjustments to facilitate comparability and excludes intangible amortization and the non-service cost portion of pension/post-retirement expense. See reconciliation at Appendix C. ©2016 Matthews International Corporation. All Rights Reserved. 18
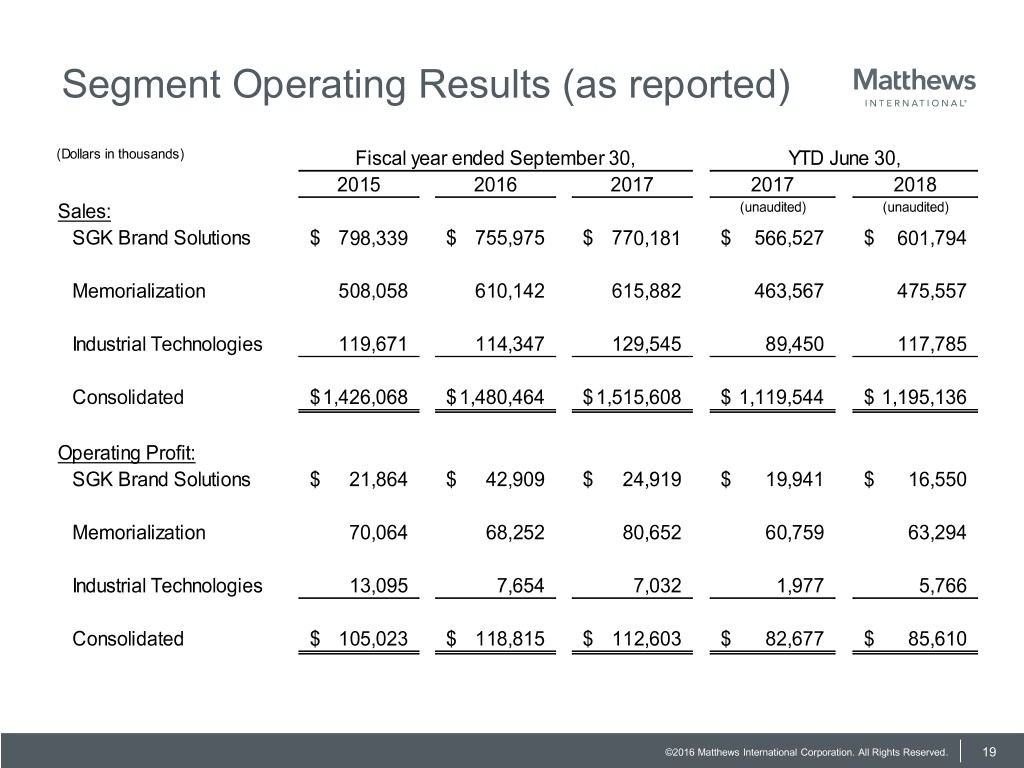
Segment Operating Results (as reported) (Dollars in thousands) Fiscal year ended September 30, YTD June 30, 2015 2016 2017 2017 2018 Sales: (unaudited) (unaudited) SGK Brand Solutions $ 798,339 $ 755,975 $ 770,181 $ 566,527 $ 601,794 Memorialization 508,058 610,142 615,882 463,567 475,557 Industrial Technologies 119,671 114,347 129,545 89,450 117,785 Consolidated $ 1,426,068 $ 1,480,464 $ 1,515,608 $ 1,119,544 $ 1,195,136 Operating Profit: SGK Brand Solutions $ 21,864 $ 42,909 $ 24,919 $ 19,941 $ 16,550 Memorialization 70,064 68,252 80,652 60,759 63,294 Industrial Technologies 13,095 7,654 7,032 1,977 5,766 Consolidated $ 105,023 $ 118,815 $ 112,603 $ 82,677 $ 85,610 ©2016 Matthews International Corporation. All Rights Reserved. 19
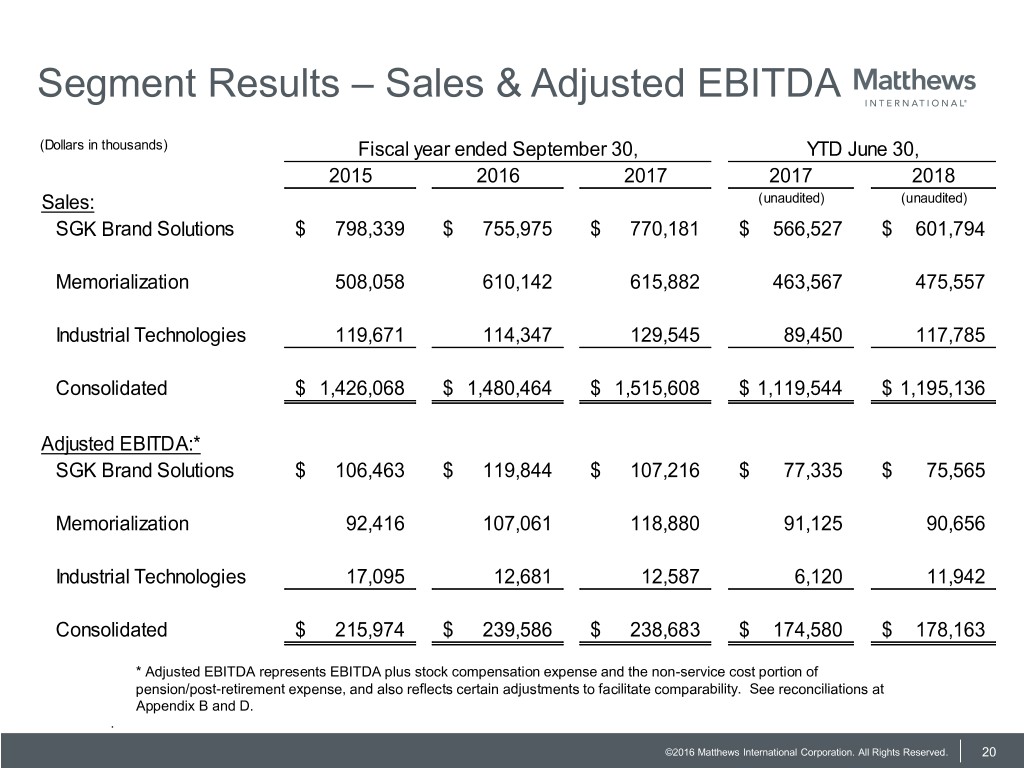
Segment Results – Sales & Adjusted EBITDA (Dollars in thousands) Fiscal year ended September 30, YTD June 30, 2015 2016 2017 2017 2018 Sales: (unaudited) (unaudited) SGK Brand Solutions $ 798,339 $ 755,975 $ 770,181 $ 566,527 $ 601,794 Memorialization 508,058 610,142 615,882 463,567 475,557 Industrial Technologies 119,671 114,347 129,545 89,450 117,785 Consolidated $ 1,426,068 $ 1,480,464 $ 1,515,608 $ 1,119,544 $ 1,195,136 Adjusted EBITDA:* SGK Brand Solutions $ 106,463 $ 119,844 $ 107,216 $ 77,335 $ 75,565 Memorialization 92,416 107,061 118,880 91,125 90,656 Industrial Technologies 17,095 12,681 12,587 6,120 11,942 Consolidated $ 215,974 $ 239,586 $ 238,683 $ 174,580 $ 178,163 * Adjusted EBITDA represents EBITDA plus stock compensation expense and the non-service cost portion of pension/post-retirement expense, and also reflects certain adjustments to facilitate comparability. See reconciliations at Appendix B and D. . ©2016 Matthews International Corporation. All Rights Reserved. 20
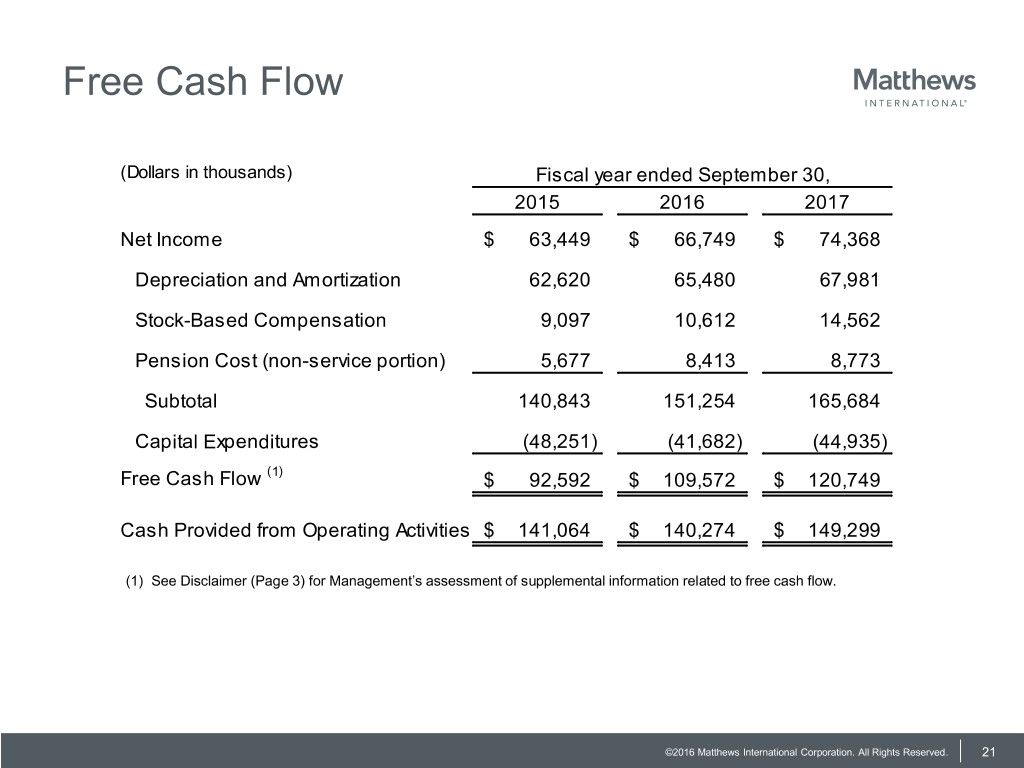
Free Cash Flow (Dollars in thousands) Fiscal year ended September 30, 2015 2016 2017 Net Income $ 63,449 $ 66,749 $ 74,368 Depreciation and Amortization 62,620 65,480 67,981 Stock-Based Compensation 9,097 10,612 14,562 Pension Cost (non-service portion) 5,677 8,413 8,773 Subtotal 140,843 151,254 165,684 Capital Expenditures (48,251) (41,682) (44,935) Free Cash Flow (1) $ 92,592 $ 109,572 $ 120,749 Cash Provided from Operating Activities $ 141,064 $ 140,274 $ 149,299 (1) See Disclaimer (Page 3) for Management’s assessment of supplemental information related to free cash flow. ©2016 Matthews International Corporation. All Rights Reserved. 21
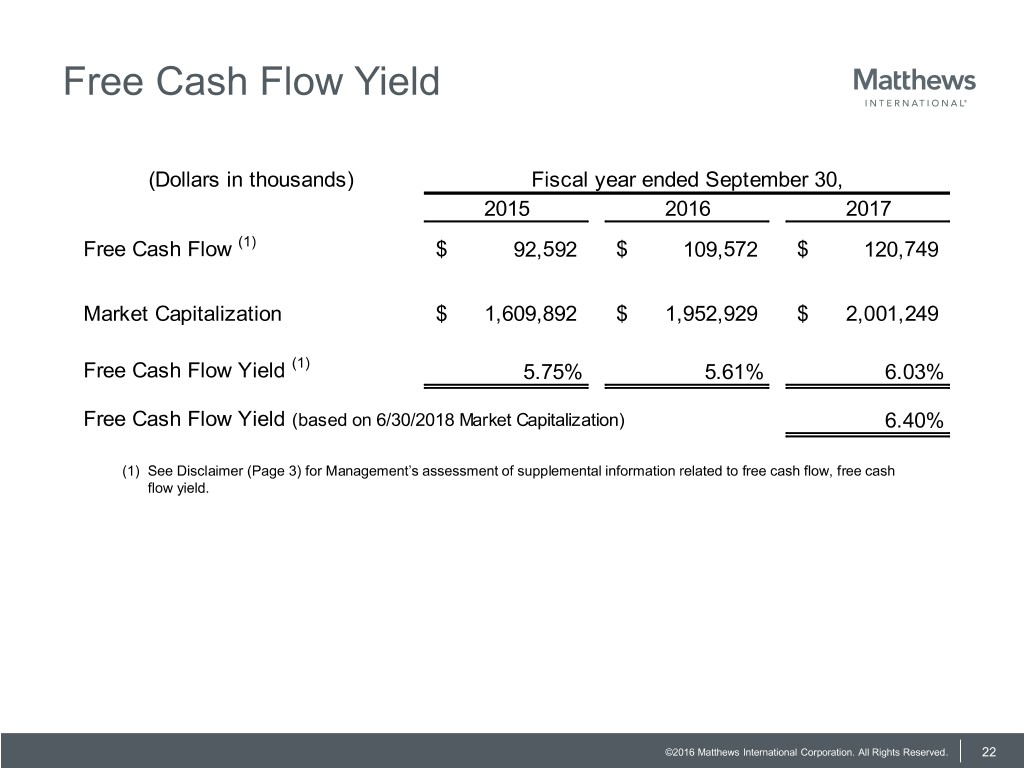
Free Cash Flow Yield (Dollars in thousands) Fiscal year ended September 30, 2015 2016 2017 Free Cash Flow (1) $ 92,592 $ 109,572 $ 120,749 Market Capitalization $ 1,609,892 $ 1,952,929 $ 2,001,249 Free Cash Flow Yield (1) 5.75% 5.61% 6.03% Free Cash Flow Yield (based on 6/30/2018 Market Capitalization) 6.40% (1) See Disclaimer (Page 3) for Management’s assessment of supplemental information related to free cash flow, free cash flow yield. ©2016 Matthews International Corporation. All Rights Reserved. 22
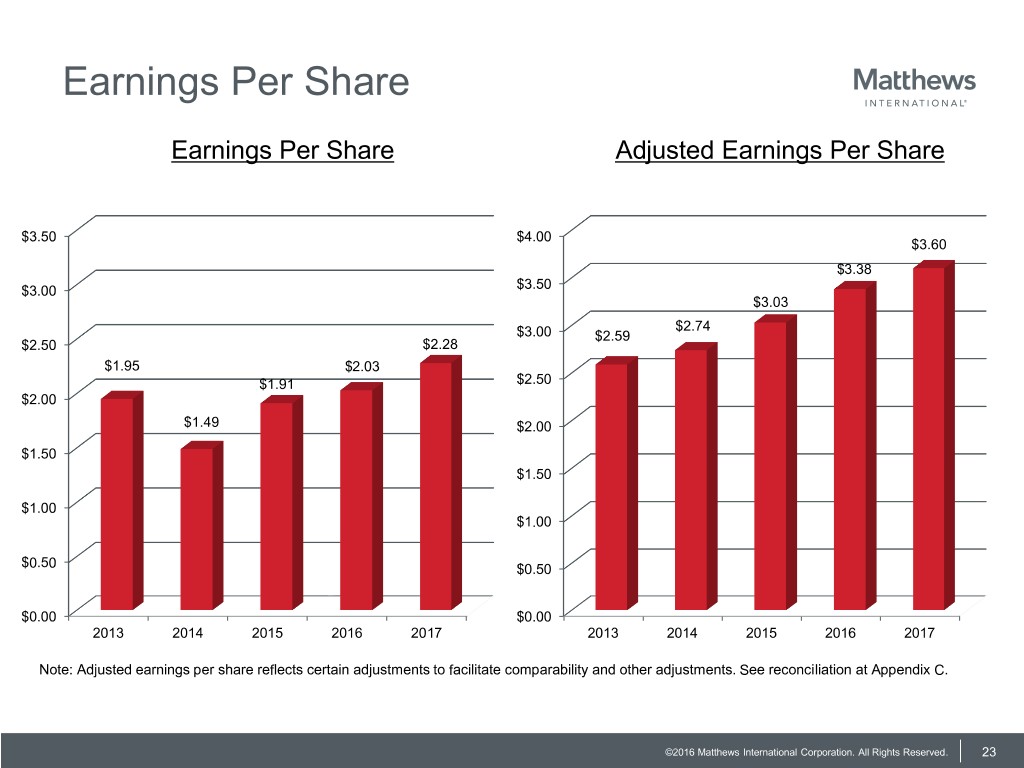
Earnings Per Share Earnings Per Share Adjusted Earnings Per Share $3.50 $4.00 $3.60 $3.38 $3.00 $3.50 $3.03 $2.74 $3.00 $2.59 $2.50 $2.28 $1.95 $2.03 $1.91 $2.50 $2.00 $1.49 $2.00 $1.50 $1.50 $1.00 $1.00 $0.50 $0.50 $0.00 $0.00 2013 2014 2015 2016 2017 2013 2014 2015 2016 2017 Note: Adjusted earnings per share reflects certain adjustments to facilitate comparability and other adjustments. See reconciliation at Appendix C. ©2016 Matthews International Corporation. All Rights Reserved. 23
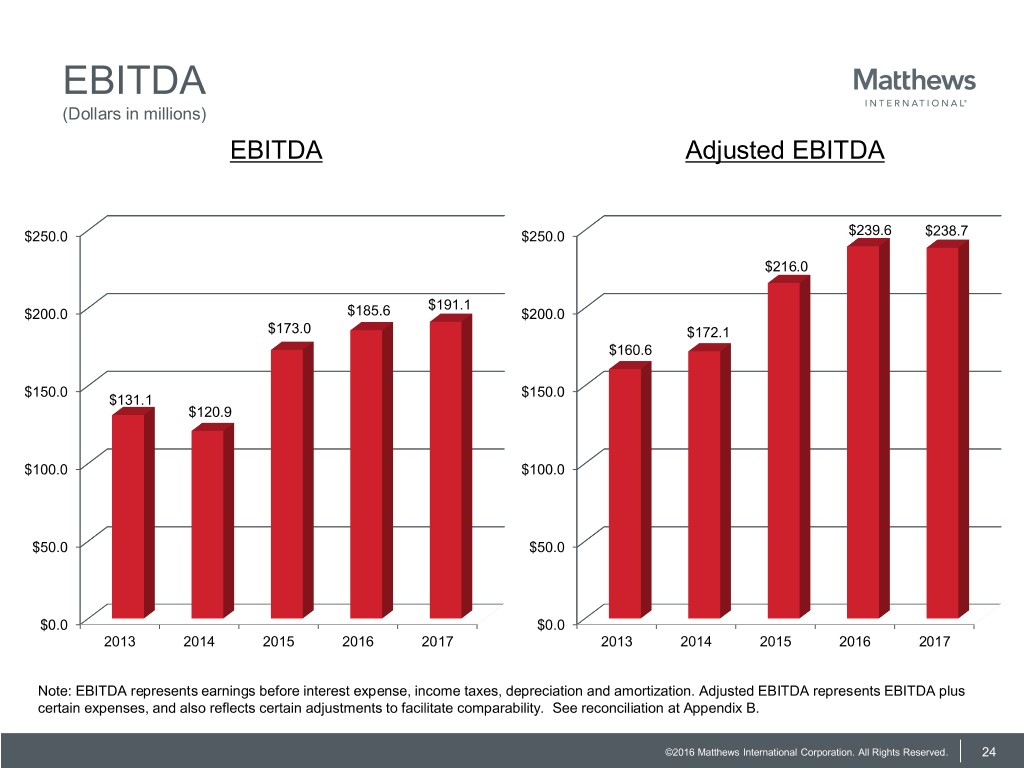
EBITDA (Dollars in millions) EBITDA Adjusted EBITDA $250.0 $250.0 $239.6 $238.7 $216.0 $191.1 $200.0 $185.6 $200.0 $173.0 $172.1 $160.6 $150.0 $150.0 $131.1 $120.9 $100.0 $100.0 $50.0 $50.0 $0.0 $0.0 2013 2014 2015 2016 2017 2013 2014 2015 2016 2017 Note: EBITDA represents earnings before interest expense, income taxes, depreciation and amortization. Adjusted EBITDA represents EBITDA plus certain expenses, and also reflects certain adjustments to facilitate comparability. See reconciliation at Appendix B. ©2016 Matthews International Corporation. All Rights Reserved. 24
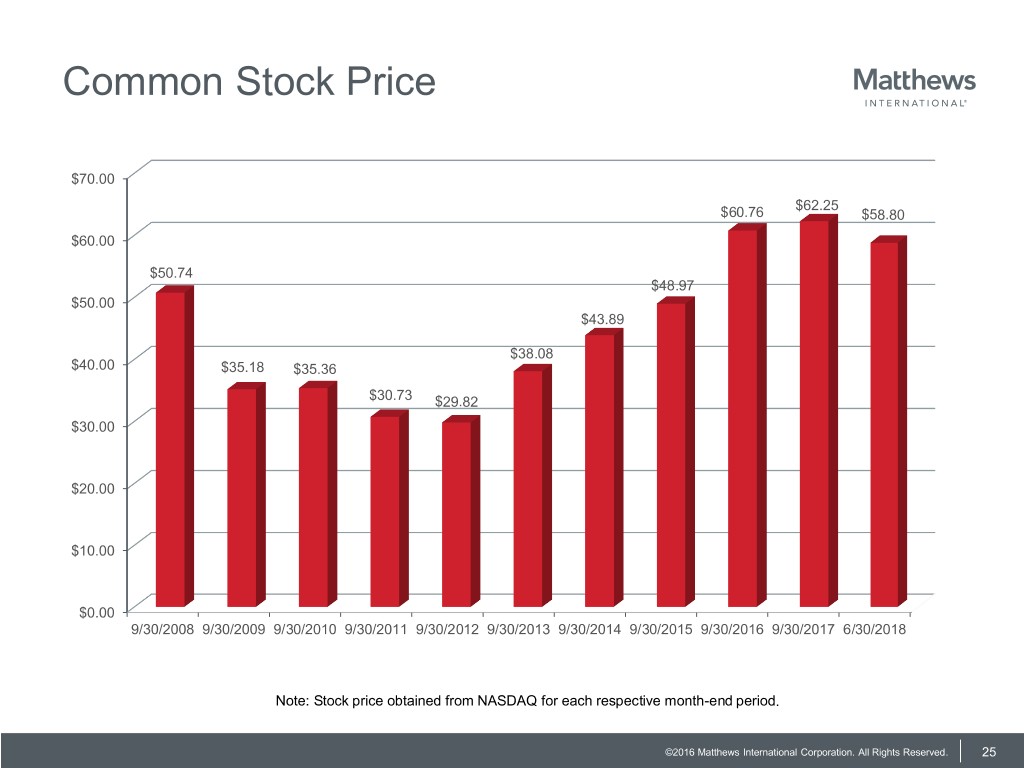
Common Stock Price $70.00 $62.25 $60.76 $58.80 $60.00 $50.74 $48.97 $50.00 $43.89 $38.08 $40.00 $35.18 $35.36 $30.73 $29.82 $30.00 $20.00 $10.00 $0.00 9/30/2008 9/30/2009 9/30/2010 9/30/2011 9/30/2012 9/30/2013 9/30/2014 9/30/2015 9/30/2016 9/30/2017 6/30/2018 Note: Stock price obtained from NASDAQ for each respective month-end period. ©2016 Matthews International Corporation. All Rights Reserved. 25
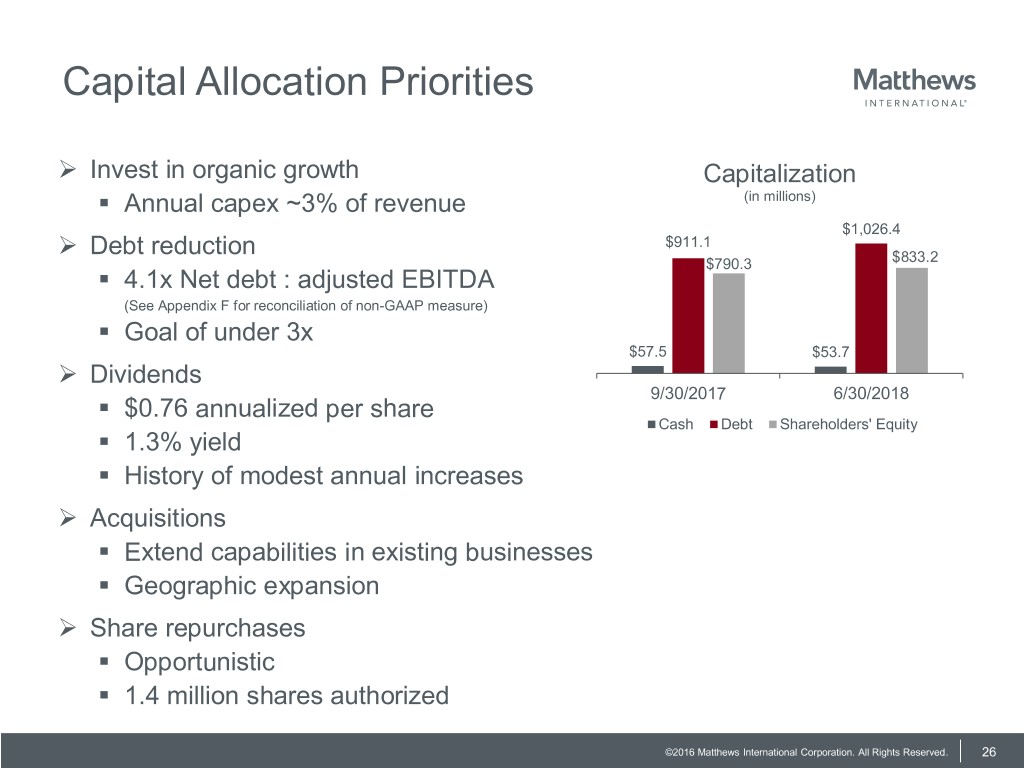
Capital Allocation Priorities ➢ Invest in organic growth Capitalization ▪ Annual capex ~3% of revenue (in millions) $1,026.4 ➢ Debt reduction $911.1 $790.3 $833.2 ▪ 4.1x Net debt : adjusted EBITDA (See Appendix F for reconciliation of non-GAAP measure) ▪ Goal of under 3x $57.5 $53.7 ➢ Dividends 9/30/2017 6/30/2018 ▪ $0.76 annualized per share Cash Debt Shareholders' Equity ▪ 1.3% yield ▪ History of modest annual increases ➢ Acquisitions ▪ Extend capabilities in existing businesses ▪ Geographic expansion ➢ Share repurchases ▪ Opportunistic ▪ 1.4 million shares authorized ©2016 Matthews International Corporation. All Rights Reserved. 26
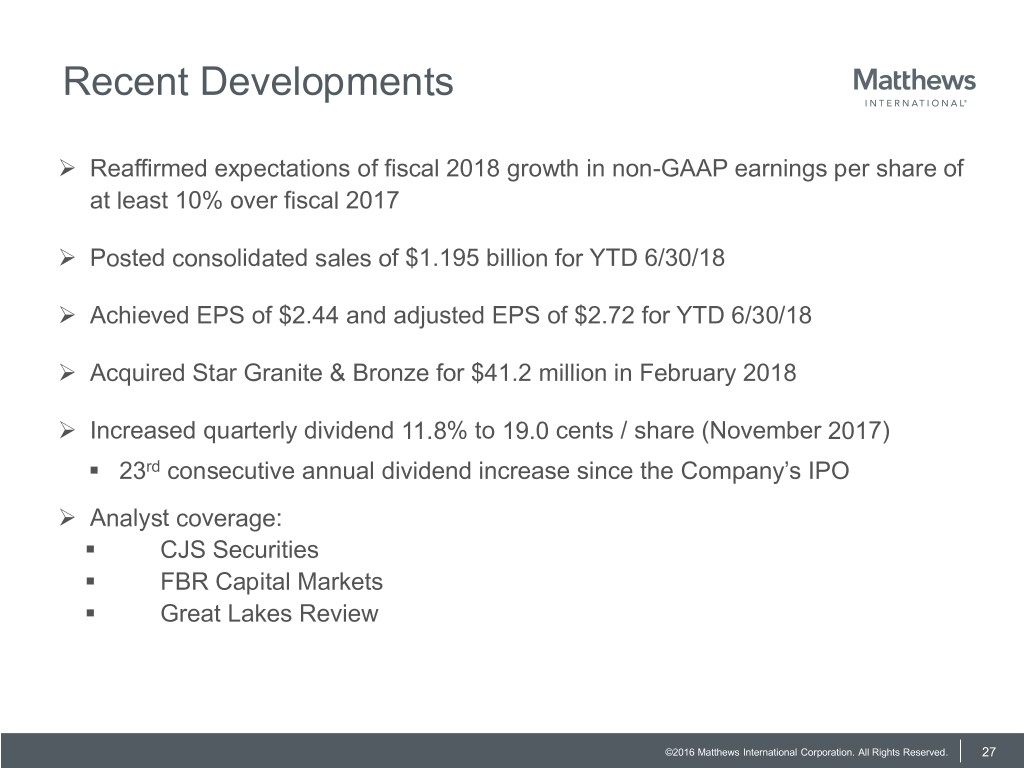
Recent Developments ➢ Reaffirmed expectations of fiscal 2018 growth in non-GAAP earnings per share of at least 10% over fiscal 2017 ➢ Posted consolidated sales of $1.195 billion for YTD 6/30/18 ➢ Achieved EPS of $2.44 and adjusted EPS of $2.72 for YTD 6/30/18 ➢ Acquired Star Granite & Bronze for $41.2 million in February 2018 ➢ Increased quarterly dividend 11.8% to 19.0 cents / share (November 2017) ▪ 23rd consecutive annual dividend increase since the Company’s IPO ➢ Analyst coverage: ▪ CJS Securities ▪ FBR Capital Markets ▪ Great Lakes Review ©2016 Matthews International Corporation. All Rights Reserved. 27
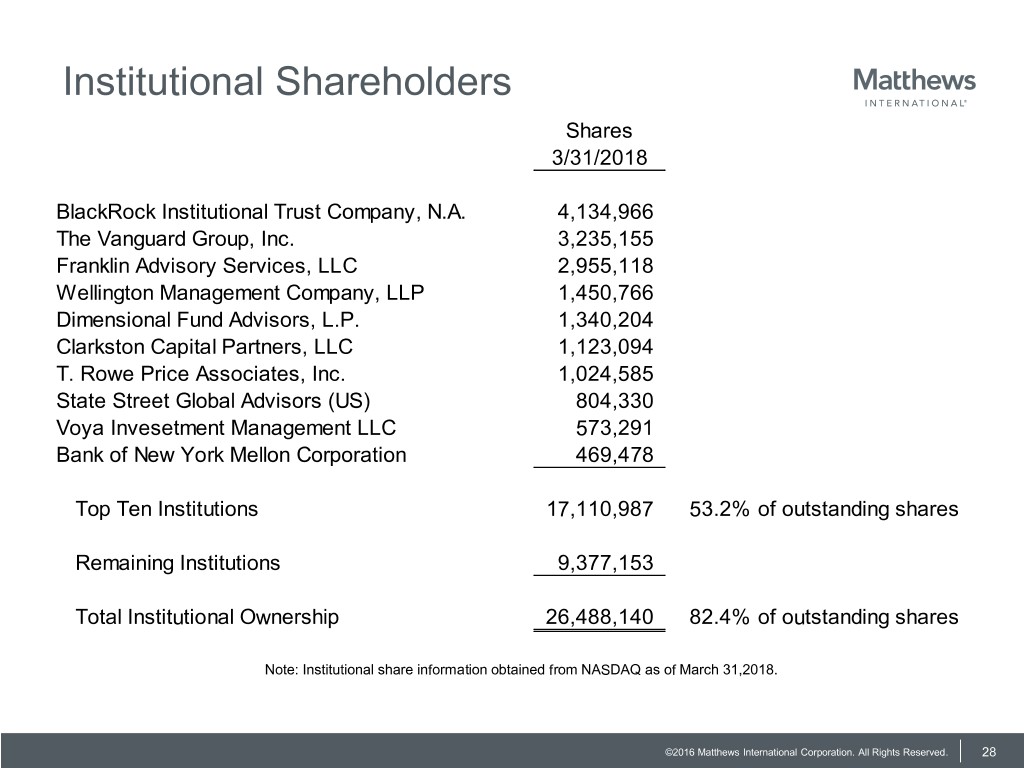
Institutional Shareholders Shares 3/31/2018 BlackRock Institutional Trust Company, N.A. 4,134,966 The Vanguard Group, Inc. 3,235,155 Franklin Advisory Services, LLC 2,955,118 Wellington Management Company, LLP 1,450,766 Dimensional Fund Advisors, L.P. 1,340,204 Clarkston Capital Partners, LLC 1,123,094 T. Rowe Price Associates, Inc. 1,024,585 State Street Global Advisors (US) 804,330 Voya Invesetment Management LLC 573,291 Bank of New York Mellon Corporation 469,478 Top Ten Institutions 17,110,987 53.2% of outstanding shares Remaining Institutions 9,377,153 Total Institutional Ownership 26,488,140 82.4% of outstanding shares Note: Institutional share information obtained from NASDAQ as of March 31,2018. ©2016 Matthews International Corporation. All Rights Reserved. 28
Appendices ©2016 Matthews International Corporation. All Rights Reserved. 29
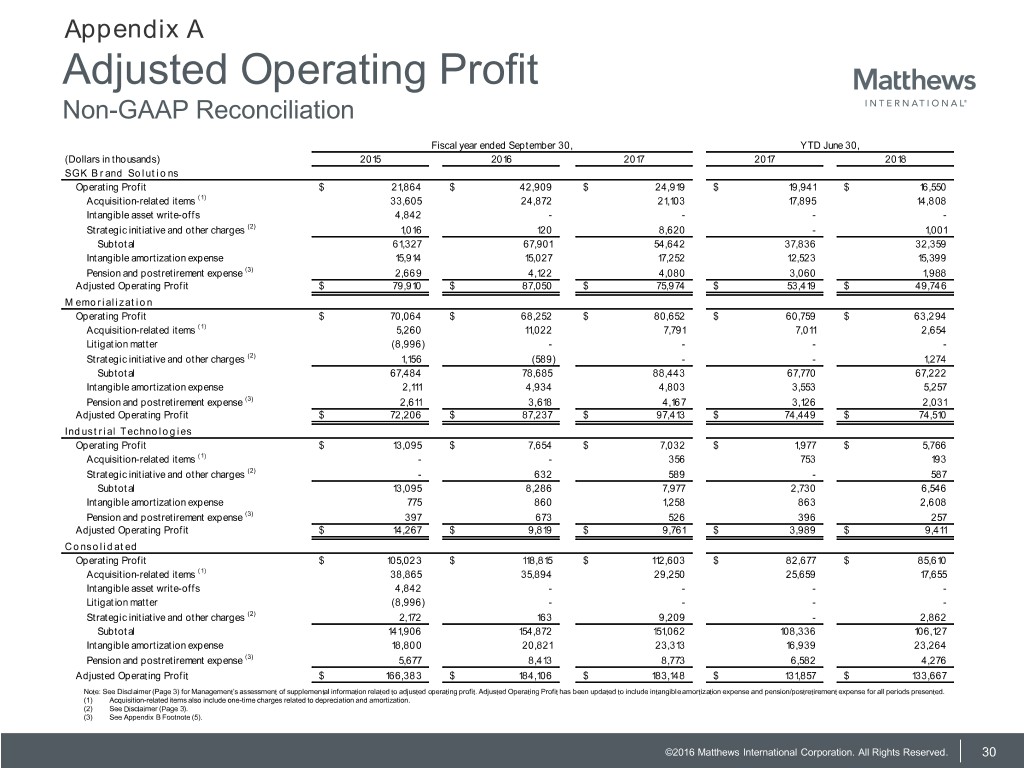
Appendix A Adjusted Operating Profit Non-GAAP Reconciliation Fiscal year ended September 30, YTD June 30, (Dollars in thousands) 2015 2016 2017 2017 2018 SGK B rand So lut io ns Operating Profit $ 21,864 $ 42,909 $ 24,919 $ 19,941 $ 16,550 Acquisition-related items (1) 33,605 24,872 21,103 17,895 14,808 Intangible asset write-offs 4,842 - - - - Strategic initiative and other charges (2) 1,016 120 8,620 - 1,001 Subtotal 61,327 67,901 54,642 37,836 32,359 Intangible amortization expense 15,914 15,027 17,252 12,523 15,399 Pension and postretirement expense (3) 2,669 4,122 4,080 3,060 1,988 Adjusted Operating Profit $ 79,910 $ 87,050 $ 75,974 $ 53,419 $ 49,746 M emo rializat io n Operating Profit $ 70,064 $ 68,252 $ 80,652 $ 60,759 $ 63,294 Acquisition-related items (1) 5,260 11,022 7,791 7,011 2,654 Litigation matter (8,996) - - - - Strategic initiative and other charges (2) 1,156 (589) - - 1,274 Subtotal 67,484 78,685 88,443 67,770 67,222 Intangible amortization expense 2,111 4,934 4,803 3,553 5,257 Pension and postretirement expense (3) 2,611 3,618 4,167 3,126 2,031 Adjusted Operating Profit $ 72,206 $ 87,237 $ 97,413 $ 74,449 $ 74,510 Ind ust rial T echno lo g ies Operating Profit $ 13,095 $ 7,654 $ 7,032 $ 1,977 $ 5,766 Acquisition-related items (1) - - 356 753 193 Strategic initiative and other charges (2) - 632 589 - 587 Subtotal 13,095 8,286 7,977 2,730 6,546 Intangible amortization expense 775 860 1,258 863 2,608 Pension and postretirement expense (3) 397 673 526 396 257 Adjusted Operating Profit $ 14,267 $ 9,819 $ 9,761 $ 3,989 $ 9,411 C o nso lid at ed Operating Profit $ 105,023 $ 118,815 $ 112,603 $ 82,677 $ 85,610 Acquisition-related items (1) 38,865 35,894 29,250 25,659 17,655 Intangible asset write-offs 4,842 - - - - Litigation matter (8,996) - - - - Strategic initiative and other charges (2) 2,172 163 9,209 - 2,862 Subtotal 141,906 154,872 151,062 108,336 106,127 Intangible amortization expense 18,800 20,821 23,313 16,939 23,264 Pension and postretirement expense (3) 5,677 8,413 8,773 6,582 4,276 Adjusted Operating Profit $ 166,383 $ 184,106 $ 183,148 $ 131,857 $ 133,667 Note: See Disclaimer (Page 3) for Management’s assessment of supplemental information related to adjusted operating profit. Adjusted Operating Profit has been updated to include intangible amortization expense and pension/postretirement expense for all periods presented. (1) Acquisition-related items also include one-time charges related to depreciation and amortization. (2) See Disclaimer (Page 3). (3) See Appendix B Footnote (5). ©2016 Matthews International Corporation. All Rights Reserved. 30
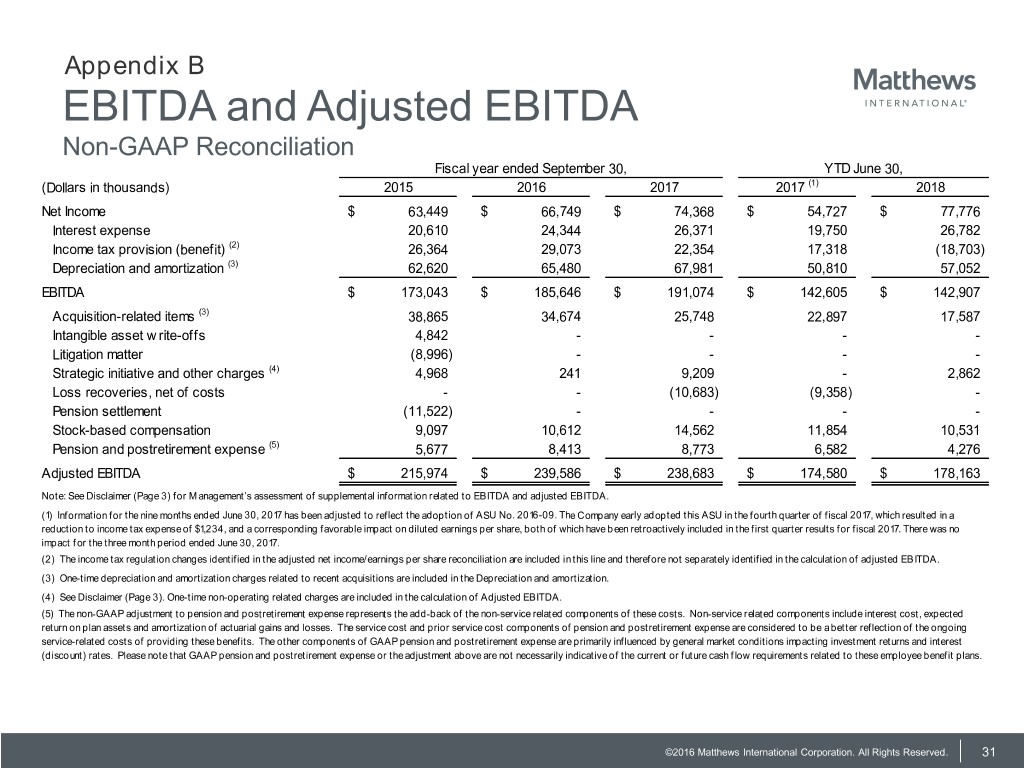
Appendix B EBITDA and Adjusted EBITDA Non-GAAP Reconciliation Fiscal year ended September 30, YTD June 30, (Dollars in thousands) 2015 2016 2017 2017 (1) 2018 Net Income $ 63,449 $ 66,749 $ 74,368 $ 54,727 $ 77,776 Interest expense 20,610 24,344 26,371 19,750 26,782 Income tax provision (benefit) (2) 26,364 29,073 22,354 17,318 (18,703) Depreciation and amortization (3) 62,620 65,480 67,981 50,810 57,052 EBITDA $ 173,043 $ 185,646 $ 191,074 $ 142,605 $ 142,907 Acquisition-related items (3) 38,865 34,674 25,748 22,897 17,587 Intangible asset w rite-offs 4,842 - - - - Litigation matter (8,996) - - - - Strategic initiative and other charges (4) 4,968 241 9,209 - 2,862 Loss recoveries, net of costs - - (10,683) (9,358) - Pension settlement (11,522) - - - - Stock-based compensation 9,097 10,612 14,562 11,854 10,531 Pension and postretirement expense (5) 5,677 8,413 8,773 6,582 4,276 Adjusted EBITDA $ 215,974 $ 239,586 $ 238,683 $ 174,580 $ 178,163 Note: See Disclaimer (Page 3) for M anagement’s assessment of supplemental information related to EBITDA and adjusted EBITDA. (1) Information for the nine months ended June 30, 2017 has been adjusted to reflect the adoption of ASU No. 2016-09. The Company early adopted this ASU in the fourth quarter of fiscal 2017, which resulted in a reduction to income tax expense of $1,234, and a corresponding favorable impact on diluted earnings per share, both of which have been retroactively included in the first quarter results for fiscal 2017. There was no impact for the three month period ended June 30, 2017. (2) The income tax regulation changes identified in the adjusted net income/earnings per share reconciliation are included in this line and therefore not separately identified in the calculation of adjusted EBITDA. (3) One-time depreciation and amortization charges related to recent acquisitions are included in the Depreciation and amortization. (4) See Disclaimer (Page 3). One-time non-operating related charges are included in the calculation of Adjusted EBITDA. (5) The non-GAAP adjustment to pension and postretirement expense represents the add-back of the non-service related components of these costs. Non-service related components include interest cost, expected return on plan assets and amortization of actuarial gains and losses. The service cost and prior service cost components of pension and postretirement expense are considered to be a better reflection of the ongoing service-related costs of providing these benefits. The other components of GAAP pension and postretirement expense are primarily influenced by general market conditions impacting investment returns and interest (discount) rates. Please note that GAAP pension and postretirement expense or the adjustment above are not necessarily indicative of the current or future cash flow requirements related to these employee benefit plans. ©2016 Matthews International Corporation. All Rights Reserved. 31
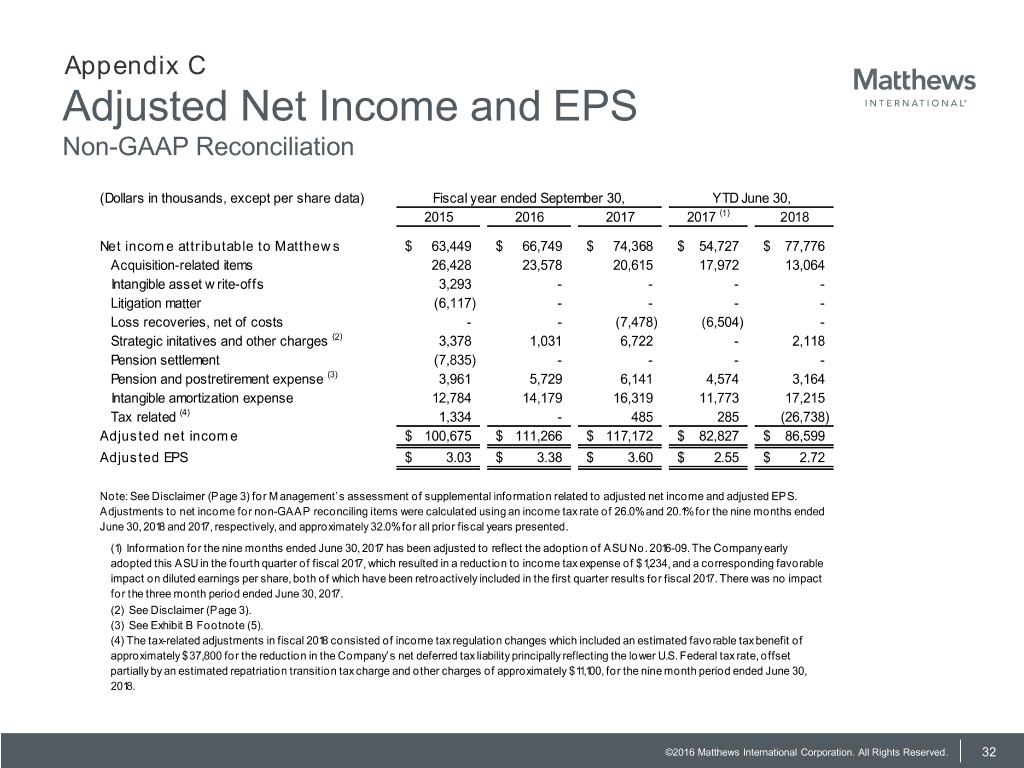
Appendix C Adjusted Net Income and EPS Non-GAAP Reconciliation (Dollars in thousands, except per share data) Fiscal year ended September 30, YTD June 30, 2015 2016 2017 2017 (1) 2018 Net income attributable to Matthews $ 63,449 $ 66,749 $ 74,368 $ 54,727 $ 77,776 Acquisition-related items 26,428 23,578 20,615 17,972 13,064 Intangible asset w rite-offs 3,293 - - - - Litigation matter (6,117) - - - - Loss recoveries, net of costs - - (7,478) (6,504) - Strategic initatives and other charges (2) 3,378 1,031 6,722 - 2,118 Pension settlement (7,835) - - - - Pension and postretirement expense (3) 3,961 5,729 6,141 4,574 3,164 Intangible amortization expense 12,784 14,179 16,319 11,773 17,215 Tax related (4) 1,334 - 485 285 (26,738) Adjusted net income $ 100,675 $ 111,266 $ 117,172 $ 82,827 $ 86,599 Adjusted EPS $ 3.03 $ 3.38 $ 3.60 $ 2.55 $ 2.72 Note: See Disclaimer (Page 3) for M anagement’s assessment of supplemental information related to adjusted net income and adjusted EPS. Adjustments to net income for non-GAAP reconciling items were calculated using an income tax rate of 26.0% and 20.1% for the nine months ended June 30, 2018 and 2017, respectively, and approximately 32.0% for all prior fiscal years presented. (1) Information for the nine months ended June 30, 2017 has been adjusted to reflect the adoption of ASU No. 2016-09. The Company early adopted this ASU in the fourth quarter of fiscal 2017, which resulted in a reduction to income tax expense of $1,234, and a corresponding favorable impact on diluted earnings per share, both of which have been retroactively included in the first quarter results for fiscal 2017. There was no impact for the three month period ended June 30, 2017. (2) See Disclaimer (Page 3). (3) See Exhibit B Footnote (5). (4) The tax-related adjustments in fiscal 2018 consisted of income tax regulation changes which included an estimated favorable tax benefit of approximately $37,800 for the reduction in the Company’s net deferred tax liability principally reflecting the lower U.S. Federal tax rate, offset partially by an estimated repatriation transition tax charge and other charges of approximately $11,100, for the nine month period ended June 30, 2018. ©2016 Matthews International Corporation. All Rights Reserved. 32
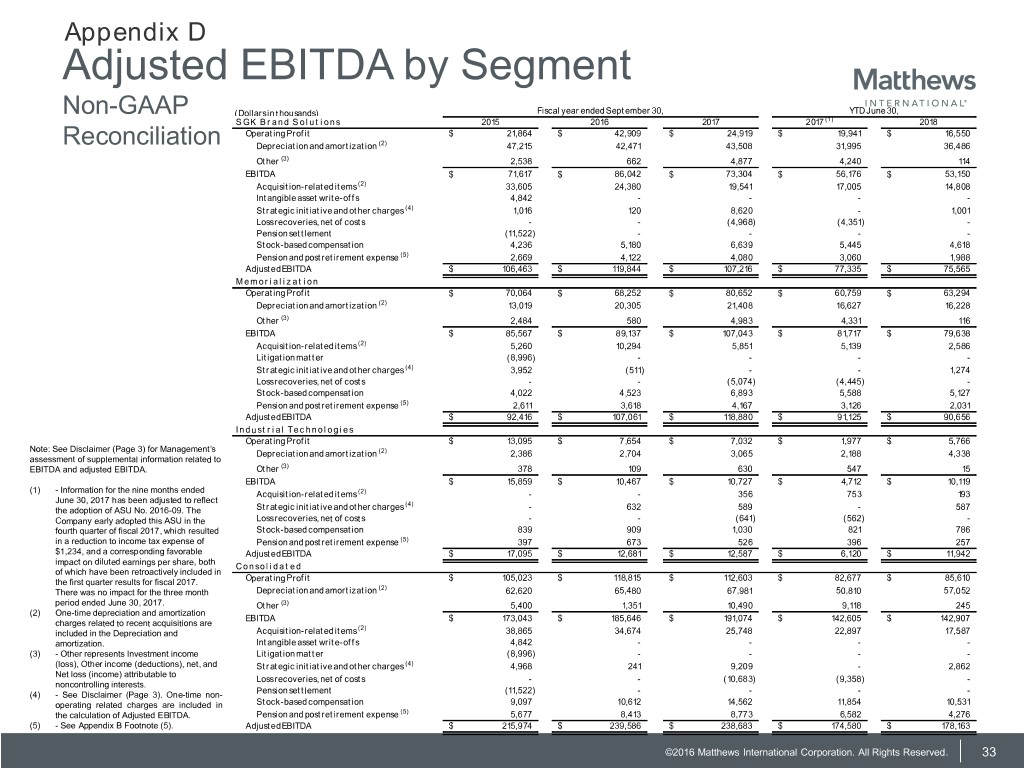
Appendix D Adjusted EBITDA by Segment Non-GAAP (Dollars in thousands) Fiscal year ended Sept ember 30, YTD June 30, S GK B r a nd S ol ut i ons 2015 2016 2017 2017 (1) 2018 Operat ing Prof it $ 21,864 $ 42,909 $ 24,919 $ 19,941 $ 16,550 Reconciliation Depreciat ion and amort izat ion (2) 47,215 42,471 43,508 31,995 36,486 Ot her (3) 2,538 662 4,877 4,240 114 EBITDA $ 71,617 $ 86,042 $ 73,304 $ 56,176 $ 53,150 Acquisit ion-relat ed it ems (2) 33,605 24,380 19,541 17,005 14,808 Int angible asset writ e-of f s 4,842 - - - - St rat egic init iat ive and ot her charges (4) 1,016 120 8,620 - 1,001 Loss recoveries, net of cost s - - (4,968) (4,351) - Pension set t lement (11,522) - - - - St ock-based compensat ion 4,236 5,180 6,639 5,445 4,618 Pension and post ret irement expense (5) 2,669 4,122 4,080 3,060 1,988 Adjust ed EBITDA $ 106,463 $ 119,844 $ 107,216 $ 77,335 $ 75,565 M e mor i a l i z a t i on Operat ing Prof it $ 70,064 $ 68,252 $ 80,652 $ 60,759 $ 63,294 Depreciat ion and amort izat ion (2) 13,019 20,305 21,408 16,627 16,228 Ot her (3) 2,484 580 4,983 4,331 116 EBITDA $ 85,567 $ 89,137 $ 107,043 $ 81,717 $ 79,638 Acquisit ion-relat ed it ems (2) 5,260 10,294 5,851 5,139 2,586 Lit igat ion mat t er (8,996) - - - - St rat egic init iat ive and ot her charges (4) 3,952 (511) - - 1,274 Loss recoveries, net of cost s - - (5,074) (4,445) - St ock-based compensat ion 4,022 4,523 6,893 5,588 5,127 Pension and post ret irement expense (5) 2,611 3,618 4,167 3,126 2,031 Adjust ed EBITDA $ 92,416 $ 107,061 $ 118,880 $ 91,125 $ 90,656 I ndust r i a l Te c hnol ogi e s Operat ing Prof it $ 13,095 $ 7,654 $ 7,032 $ 1,977 $ 5,766 Note: See Disclaimer (Page 3) for Management’s Depreciat ion and amort izat ion (2) 2,386 2,704 3,065 2,188 4,338 assessment of supplemental information related to EBITDA and adjusted EBITDA. Ot her (3) 378 109 630 547 15 EBITDA $ 15,859 $ 10,467 $ 10,727 $ 4,712 $ 10,119 (1) - Information for the nine months ended Acquisit ion-relat ed it ems (2) - - 356 753 193 June 30, 2017 has been adjusted to reflect (4) the adoption of ASU No. 2016-09. The St rat egic init iat ive and ot her charges - 632 589 - 587 Company early adopted this ASU in the Loss recoveries, net of cost s - - (641) (562) - fourth quarter of fiscal 2017, which resulted St ock-based compensat ion 839 909 1,030 821 786 in a reduction to income tax expense of Pension and post ret irement expense (5) 397 673 526 396 257 $1,234, and a corresponding favorable Adjust ed EBITDA $ 17,095 $ 12,681 $ 12,587 $ 6,120 $ 11,942 impact on diluted earnings per share, both C onsol i da t e d of which have been retroactively included in the first quarter results for fiscal 2017. Operat ing Prof it $ 105,023 $ 118,815 $ 112,603 $ 82,677 $ 85,610 (2) There was no impact for the three month Depreciat ion and amort izat ion 62,620 65,480 67,981 50,810 57,052 period ended June 30, 2017. Ot her (3) 5,400 1,351 10,490 9,118 245 (2) One-time depreciation and amortization EBITDA $ 173,043 $ 185,646 $ 191,074 $ 142,605 $ 142,907 charges related to recent acquisitions are (2) included in the Depreciation and Acquisit ion-relat ed it ems 38,865 34,674 25,748 22,897 17,587 amortization. Int angible asset writ e-of f s 4,842 - - - - (3) - Other represents Investment income Lit igat ion mat t er (8,996) - - - - (loss), Other income (deductions), net, and St rat egic init iat ive and ot her charges (4) 4,968 241 9,209 - 2,862 Net loss (income) attributable to Loss recoveries, net of cost s - - (10,683) (9,358) - noncontrolling interests. Pension set t lement (11,522) - - - - (4) - See Disclaimer (Page 3). One-time non- operating related charges are included in St ock-based compensat ion 9,097 10,612 14,562 11,854 10,531 the calculation of Adjusted EBITDA. Pension and post ret irement expense (5) 5,677 8,413 8,773 6,582 4,276 (5) - See Appendix B Footnote (5). Adjust ed EBITDA $ 215,974 $ 239,586 $ 238,683 $ 174,580 $ 178,163 ©2016 Matthews International Corporation. All Rights Reserved. 33
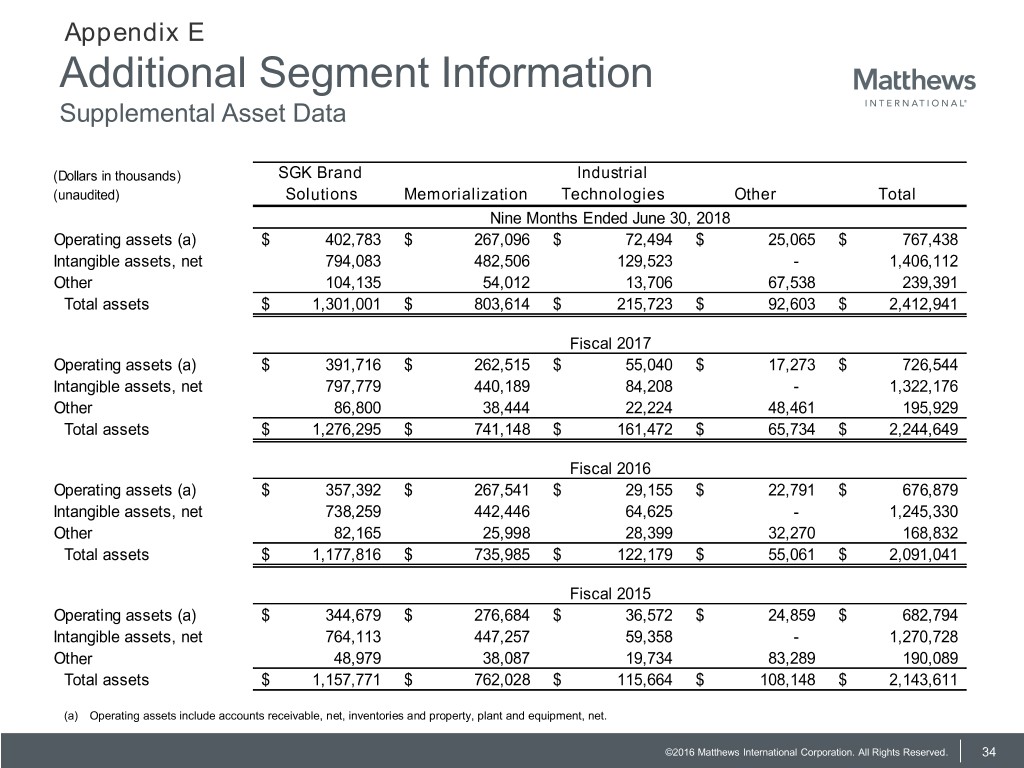
Appendix E Additional Segment Information Supplemental Asset Data (Dollars in thousands) SGK Brand Industrial (unaudited) Solutions Memorialization Technologies Other Total Nine Months Ended June 30, 2018 Operating assets (a) $ 402,783 $ 267,096 $ 72,494 $ 25,065 $ 767,438 Intangible assets, net 794,083 482,506 129,523 - 1,406,112 Other 104,135 54,012 13,706 67,538 239,391 Total assets $ 1,301,001 $ 803,614 $ 215,723 $ 92,603 $ 2,412,941 Fiscal 2017 Operating assets (a) $ 391,716 $ 262,515 $ 55,040 $ 17,273 $ 726,544 Intangible assets, net 797,779 440,189 84,208 - 1,322,176 Other 86,800 38,444 22,224 48,461 195,929 Total assets $ 1,276,295 $ 741,148 $ 161,472 $ 65,734 $ 2,244,649 Fiscal 2016 Operating assets (a) $ 357,392 $ 267,541 $ 29,155 $ 22,791 $ 676,879 Intangible assets, net 738,259 442,446 64,625 - 1,245,330 Other 82,165 25,998 28,399 32,270 168,832 Total assets $ 1,177,816 $ 735,985 $ 122,179 $ 55,061 $ 2,091,041 Fiscal 2015 Operating assets (a) $ 344,679 $ 276,684 $ 36,572 $ 24,859 $ 682,794 Intangible assets, net 764,113 447,257 59,358 - 1,270,728 Other 48,979 38,087 19,734 83,289 190,089 Total assets $ 1,157,771 $ 762,028 $ 115,664 $ 108,148 $ 2,143,611 (a) Operating assets include accounts receivable, net, inventories and property, plant and equipment, net. ©2016 Matthews International Corporation. All Rights Reserved. 34
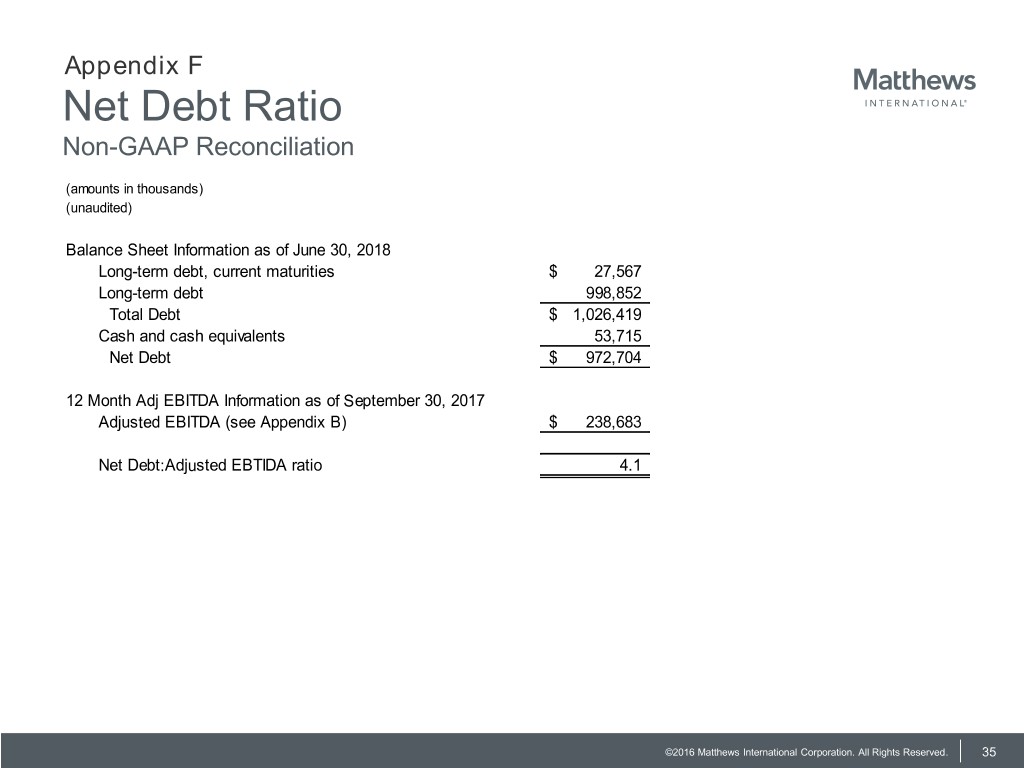
Appendix F Net Debt Ratio Non-GAAP Reconciliation (amounts in thousands) (unaudited) Balance Sheet Information as of June 30, 2018 Long-term debt, current maturities $ 27,567 Long-term debt 998,852 Total Debt $ 1,026,419 Cash and cash equivalents 53,715 Net Debt $ 972,704 12 Month Adj EBITDA Information as of September 30, 2017 Adjusted EBITDA (see Appendix B) $ 238,683 Net Debt:Adjusted EBTIDA ratio 4.1 ©2016 Matthews International Corporation. All Rights Reserved. 35
