Attached files
| file | filename |
|---|---|
| 8-K - FORM 8-K - DermTech, Inc. | tv499994_8k.htm |
| EX-99.1 - EXHIBIT 99.1 - DermTech, Inc. | tv499994_ex99-1.htm |
| EX-2.1 - EXHIBIT 2.1 - DermTech, Inc. | tv499994_ex2-1.htm |
Exhibit 99.2

CONSTELLATION ALPHA CAPITAL CORP. Investor Presentation August 2018
This presentation (the “Presentation”) is provided for informational purposes only and has been prepared to assist interested parties in making their own evaluation with respect to a potential business combination between Medall Healthcare Pvt . Ltd (“Target”) and Constellation Alpha Capital Corp . (“CNAC”) and related transactions (the “Potential Business Combination”) and for no other purpose . By reviewing or reading this Presentation, you will be deemed to have agreed to the obligations and restrictions set out below . Without the express prior written consent of CNAC, the Presentation and any information contained within it may not be (i) reproduced (in whole or in part), (ii) copied at any time, (iii) used for any purpose other than your evaluation of Target or (iv) provided to any other person, except your employees and advisors with a need to know who are advised of the confidentiality of the information . This Presentation and any oral statements made in connection with this Presentation do not constitute an offer to sell, or a solicitation of an offer to buy, or a recommendation to purchase, any securities in any jurisdiction, or the solicitation of any proxy, vote, consent or approval in any jurisdiction in connection with the Potential Business Combination or any related transactions, nor shall there be any sale, issuance or transfer of any securities in any jurisdiction where, or to any person to whom, such offer, solicitation or sale may be unlawful under the laws of such jurisdiction . No offer of securities shall be made except by means of a prospectus meeting the requirements of Section 10 of the Securities Act of 1933 , as amended . This Presentation does not constitute either advice or a recommendation regarding any securities . The communication of this Presentation is restricted by law ; it is not intended for distribution to, or use by any person in, any jurisdiction where such distribution or use would be contrary to local law or regulation . This Presentation supersedes and replaces all previous oral or written communications between the parties hereto relating to the subject matter hereof . No representations or warranties, express or implied are given in, or in respect of, this Presentation . To the fullest extent permitted by law in no circumstances will CNAC, or any of its respective subsidiaries, shareholders, affiliates, representatives, partners, directors, officers, employees, advisers or agents be responsible or liable for any direct, indirect or consequential loss or loss of profit arising from the use of this Presentation, its contents (including the internal economic models), its omissions, reliance on the information contained within it, or on opinions communicated in relation thereto or otherwise arising in connection therewith . Industry and market data used in this Presentation have been obtained from third - party industry publications and sources as well as from research reports prepared for other purposes . Neither CNAC nor Target has independently verified the data obtained from these sources and cannot assure you of the data’s accuracy or completeness . This data is subject to change . Recipients of this Presentation are not to construe its contents, or any prior or subsequent communications from or with CNAC or its representatives as investment, legal or tax advice . In addition, this Presentation does not purport to be all - inclusive or to contain all of the information that may be required to make a full analysis of Target . Recipients of this Presentation should each make their own evaluation of Target and of the relevance and adequacy of the information and should make such other investigations as they deem necessary . Forward Looking Statements Certain statements included in this Presentation are not historical facts but are forward - looking statements for purposes of the safe harbor provisions under the United States Private Securities Litigation Reform Act of 1995 . Forward - looking statements generally are accompanied by words such as “believe,” “may,” “will,” “estimate,” “continue,” “anticipate,” “intend,” “expect,” “should,” “would,” “plan,” “predict,” “potential,” “seem,” “seek,” “future,” “outlook,” and similar expressions that predict or indicate future events or trends or that are not statements of historical matters . These forward - looking statements include, but are not limited to, statements regarding estimates and forecasts of other financial and performance metrics and projections of market opportunity . These statements are based on various assumptions, whether or not identified in the Presentation, and on the current expectations of Target’s management and are not predictions of actual performance . These forward - looking statements are provided for illustrative purposes only and are not intended to serve as, and must not be relied on by any investor as, a guarantee, an assurance, a prediction or a definitive statement of fact or probability . Nothing in this Presentation should be construed as a profit forecast . Actual events and circumstances are difficult or impossible to predict and will differ from assumptions . Many actual events and circumstances are beyond the control of Target . Some important factors that could cause actual results to differ materially from those in any forward - looking statements could include changes in domestic and foreign business, market, financial, political and legal conditions . These forward - looking statements are subject to a number of risks and uncertainties ; the inability of the parties to successfully or timely consummate the Potential Business Combination, including the risk that any required regulatory approvals are not obtained, are delayed or are subject to unanticipated conditions that could adversely affect the combined company or the expected benefits of the Potential Business Combination or that the approval of the shareholders of CNAC and/or the shareholders of Target for the Potential Business Combination is not obtained ; failure to realize the anticipated benefits of the Potential Business Combination, including as a result of a delay or difficulty in integrating the businesses of CNAC and Target ; the amount of redemption requests made by CNAC’s shareholders ; the ability of CNAC or the combined company to obtain debt financing in connection with the Potential Business Combination, including, those factors discussed in CNAC’s final prospectus dated June 19 , 2017 and Annual Report on Form 10 - K for the fiscal year ended March 31 , 2018 , in each case, under the heading “Risk Factors,” and other documents of CNAC filed, or to be filed, with the Securities and Exchange Commission (“SEC”) . If the risks materialize or our assumptions prove incorrect, actual results could differ materially from the results implied by these forward - looking statements . There may be additional risks that neither CNAC nor Target presently know or that CNAC and Target currently believe are immaterial that could also cause actual results to differ from those contained in the forward - looking statements . In addition, forward - looking statements reflect CNAC’s and Target’s expectations, plans or forecasts of future events and views as of the date of this Presentation . CNAC and Target anticipate that subsequent events and developments will cause CNAC’s and Target’s assessments to change . However, while CNAC and Target may elect to update these forward - looking statements at some point in the future, CNAC and Target specifically disclaim any obligation to do so . These forward - looking statements should not be relied upon as representing CNAC’s and Target’s assessments as of any date subsequent to the date of this Presentation . Accordingly, undue reliance should not be placed upon the forward - looking statements . Important Information for Investors and Shareholders In connection with the Potential Business Combination, CNAC and Target expect that a preliminary proxy statement of CNAC, which may include a registration statement, will be filed with the SEC . CNAC will mail a definitive proxy statement to shareholders of CNAC . This Presentation is not a substitute for the proxy statement or registration statement or for any other document that CNAC may file with the SEC and send to CNAC’s shareholders in connection with the Potential Business Combination . INVESTORS AND SECURITY HOLDERS ARE URGED TO READ THE PROXY STATEMENT AND OTHER DOCUMENTS FILED WITH THE SEC CAREFULLY AND IN THEIR ENTIRETY WHEN THEY BECOME AVAILABLE BECAUSE THEY WILL CONTAIN IMPORTANT INFORMATION . Investors and security holders may obtain free copies of the proxy statement (when available) and other documents filed with the SEC by CNAC through the website maintained by the SEC at http : //www . sec . gov . Copies of the documents filed with the SEC by CNAC are available free of charge and archived on www . constellationalpha . com . Non - GAAP Financial Measures Some of the financial information and data contained in this Presentation is unaudited and does not conform to the SEC’s Regulation S - X . Accordingly, such information and data may not be included in, may be adjusted in or may be presented differently in, the proxy statement to be filed with the SEC . This Presentation includes non - GAAP financial measures, including adjusted EBITDA, which are supplemental measures of performance that are neither required by, nor presented in accordance with, international financial reporting standards (“IFRS”) . For the purpose of this presentation, EBITDA refers to Adjusted EBITDA as shown on page 40 hereof, "EBITDA Reconciliation" . Target and CNAC believe that such non - GAAP financial measures provide useful supplemental information to their respective boards of directors, management teams and investors regarding certain financial and business trends relating to Target’s financial condition and results of operation . Target and CNAC believe such measures, when viewed in conjunction with Target’s consolidated financial statements, facilitate period - to - period comparisons of operating performance and may facilitate comparisons with other companies . Undue reliance should not be placed on these measures as Target’s only measures of operating performance, nor should such measures be considered in isolation from, or as a substitute for, financial information presented in compliance with IFRS . Non - GAAP financial measures as used in respect of Target may not be comparable to similarly titled amounts used by other companies . Participants in the Solicitation CNAC and Target and their respective directors and certain of their respective executive officers may be considered participants in the solicitation of proxies with respect to the Potential Business Combination under the rules of the SEC . Information about the directors and executive officers of CNAC is set forth in its Annual Report on Form 10 - K for the fiscal year ended March 31 , 2018 . Additional information regarding the participants in the proxy solicitations and a description of their direct and indirect interests, by security holdings or otherwise, will be included in the proxy statement and other relevant materials to be filed with the SEC when they become available . These documents can be obtained free of charge from the sources indicated above . DISCLAIMER 2

Rajiv Sarman Shukla, CEO • Conceived of Constellation Alpha Capital as India - focused healthcare roll - up platform • Former CEO of Pipavav Defence, publicly listed Indian company with ~4000 full - time and contract employees. Re - organized operatio ns to focus on services revenue in addition to core manufacturing. Inducted fresh talent into Executive Team. Led several international collaboration s w ith Global leaders. Successful debt restructuring involving ~25 banks. Competitive change of control process that led to shareholder value maximization • Former Control Board Member of roll - up involving 4 Indian healthcare service chains (Sahyadri, Vikram, Medica Synergie, RG Stone ) • Former Control Board Member of roll - up of Indian laboratory chemicals and animal health companies • Former Board Member of 7 Indian healthcare companies (I - ven Medicare, RFCL, Swiss Bio, Bharat Biotech, Arch Pharma, Unimark, Mal ladi) • Invested in ~40 EM healthcare companies as PM/MD of Morgan Stanley hedge fund Private Equity investor at CVCI & ICICI Venture • Former Senior Director at Pfizer, Inc Leadership role in 5 acquisitions totaling over $63 billion (Meridica, Pharmacia, Vicur on, Idun and Rinat) • Masters in Healthcare Management, Harvard University Bachelors in Pharmaceutics, Indian Institute of Technology Raju Venkataraman, COO • Led the creation of Medall from Day One with private equity support from Peepul Capital • In 1991, created Vetri Systems, a business process outsourcing company. Sold to Lason in 1999. Continued with merged entity f or 3 years. • In 2002, created RevIT, a business process outsourcing company. Merged with ICICI FirstSource in 2005. Served as COO for 4 ye ars . • Earlier stints at EDS as a systems engineer and Cadbury - Schweppes. • Executive MBA from IIM, Ahmedabad. Bachelors in Chemical Engineering from IIT, Madras MANAGEMENT BIOGRAPHIES 3 Ravishankar KR, CFO • 30 years of experience in finance at: • Former CFO at Hinduja Group • Suzlon Energy • Chartered Accountant. Bachelors in Commerce from St. Xaviers. Capt Raghavan, Divisional President • 30 years of experience at: • Medall • Indian Navy • Masters in Electronics Engineering from IIT Kharagpur. MBA from Symbiosis. Mriganka Gupta, Divisional President • 30 years of experience at: • Medall • Oracle • Vetri • Cadbury - Schweppes Dr Ramesh Iravatham, Chief Pathologist • Divisional leader for Pathology • Iravatham Labs • PhD from Canterbury Univ, Ireland Dr Satish MG, Chief Pathologist • Divisional leader for Pathology • Santosh Diagnostics • Extensive teaching experience • MD in Pathology from RGUHS, MBBS from Bangalore University Dr Anand HK, Chief Radiologist • Clinical leader for radiology at Medall • Consulting radiologist at renowned institutions • Assistant Professor, KMC • MD in Radiology, MBBS from KMC College
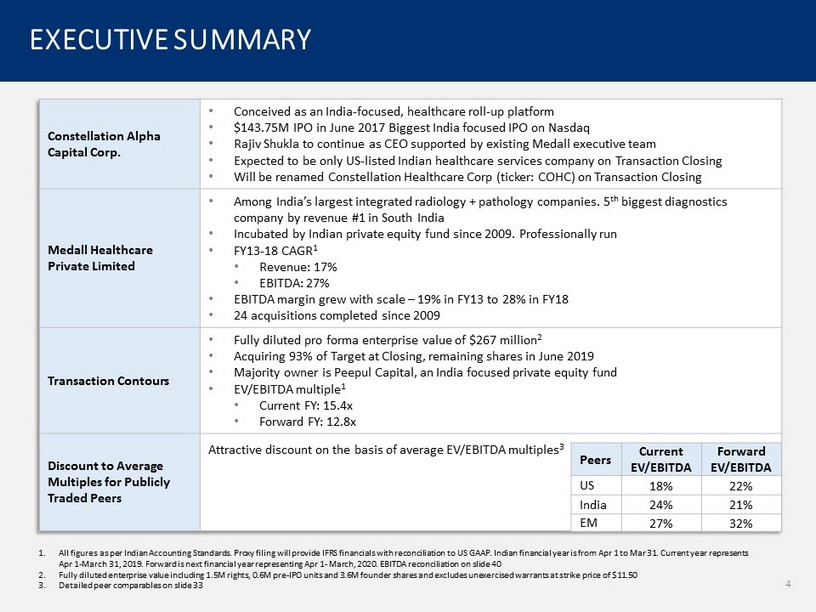
EXECUTIVE SUMMARY Constellation Alpha Capital Corp. • Conceived as an India - focused, healthcare roll - up platform • $143.75M IPO in June 2017 Biggest India focused IPO on Nasdaq • Rajiv Shukla to continue as CEO supported by existing Medall executive team • Expected to be only US - listed Indian healthcare services company on Transaction Closing • Will be renamed Constellation Healthcare Corp (ticker: COHC) on Transaction Closing Medall Healthcare Private Limited • Among India’s largest integrated radiology + pathology companies. 5 th biggest diagnostics company by revenue #1 in South India • Incubated by Indian private equity fund since 2009. Professionally run • FY13 - 18 CAGR 1 • Revenue: 17% • EBITDA: 27% • EBITDA margin grew with scale – 19% in FY13 to 28% in FY18 • 24 acquisitions completed since 2009 Transaction Contours • Fully diluted pro forma enterprise value of $267 million 2 • Acquiring 93% of Target at Closing, remaining shares in June 2019 • Majority owner is Peepul Capital, an India focused private equity fund • EV/EBITDA multiple 1 • Current FY: 15.4x • Forward FY: 12.8x Discount to Average Multiples for Publicly Traded Peers Attractive discount on the basis of average EV/EBITDA multiples 3 Peers Current EV/EBITDA Forward EV/EBITDA US 18% 22% India 24% 21% EM 27% 32% 1. All figures as per Indian Accounting Standards. Proxy filing will provide IFRS financials with reconciliation to US GAAP. Ind ian financial year is from Apr 1 to Mar 31. Current year represents Apr 1 - March 31, 2019. Forward is next financial year representing Apr 1 - March, 2020. EBITDA reconciliation on slide 40 2. Fully diluted enterprise value including 1.5M rights, 0.6M pre - IPO units and 3.6M founder shares and excludes unexercised warran ts at strike price of $11.50 3. Detailed peer comparables on slide 33 4

Pro Forma Capitalization (all figures in $M except number of shares & per share price) Transaction Terms Ownership Summary TRANSACTION TERMS 5 Illustrative share price $10.20 Number of shares outstanding (M) 20.03 Equity value $204.3 Existing Medall Net Debt 19.4 New Debt 30.0 Second Tranche Purchase 13.4 Enterprise Value $267.1 1. Fully diluted enterprise value including 1.5M rights, 0.6M pre - IPO units and 3.6M founder shares and excludes unexercised warran ts at strike price of $11.50 2. Assumes current year EBITDA of $17.4M. See definition of EBITDA on slide 40 3. Assumes forward year EBITDA of $20.9M. See definition of EBITDA on slide 40 4. Assumed exchange rate of $1 to INR 68.4 5. Assuming no net redemptions from Trust account • Pro forma enterprise value of $267 million 1, 4 • Current year EV/EBITDA: 15.4x 2 • Forward EV/EBITDA: 12.8x 3 • Sellers receive cash consideration of: • $166 million 4 at Closing • INR 0.9 billion ($13.4 million 4 ) in June 2019 Shares, M % Ownership Public Shareholders 17.0 85% CNAC D&O 3.0 15% Total 20.0 100% Sources & Uses, $M Sources: Cash in Trust 5 $146.0 New Debt $30.0 Total Sources $176.0 Uses: Share Purchase $166.0 Estimated Transaction Expenses $10.0 Total Uses $176.0

INVESTMENT RATIONALE Why India? Why Healthcare? Why Diagnostics? Why Medall? India is the fastest growing major economy GDP Growth 2017 GDP, $Trillion 2015 2016 2017 2018E China 12.0 6.9% 6.7% 6.9% 6.5% India 2.6 8.2% 7.1% 6.6% 7.3% Brazil 2.1 (3.6%) (3.5%) 1.0% 2.4% Russia 1.5 (2.8%) (0.2%) 1.5% 1.5% 45 397 2008 2025E 14% CAGR • Indian Healthcare sector growing 2x faster than overall economy • Less volatile growth • Indian Diagnostics sector growing faster than overall healthcare market 5 32 2008 2025E 20% CAGR • Top 5 Indian diagnostics companies by revenue • Among the largest integrated companies offering radiology and pathology • 27% EBITDA CAGR over the last 5 years 1 • Proven track record as a consolidator – 24 acquisitions completed since 2009 • Attractive valuation relative to Indian/EM/US peers 1 2 3 4 Source: World Bank, IBEF Healthcare Report 1. Indian financial year is Apr 1 - Mar 31. All financials as per Indian GAAP. EBITDA reconciliation on slide 40 6 ($B) ($B)

ATTRACTIVE GROWTH & VALUATION PROFILE Source: Bloomberg, July 31, 2018 Note: Detailed valuation table provided on slide 33 1. Median figures. Current year for Indian companies is from April 1 - March 31, 2019. Current year for US and EM peers is from Jan 1 - December 31, 2018. EBITDA reconciliation on slide 40 2. Average figures. All valuation multiples calendarized to April 1 - March 31 financial year. Indian and EM peers include hospitals and diagnostics companies while US peers are pure - play diagnostics Peers Current Year Revenue Growth Estimate 1 Current Year EBITDA Growth Estimate 1 Last Year EBITDA margin 1 Current EV/EBITDA 2 Forward EV/EBITDA 2 Medall Discount to Peer Average Current EV/EBITDA Forward EV/EBITDA Medall 20% 20% 28% 15.4x 12.8x USA 8% 11% 15% 18.7x 16.3x 18% 22% India 19% 24% 12% 20.3x 16.2x 24% 21% EM 10% 4% 26% 21.1x 18.8x 27% 32% 7

POTENTIAL VALUE CREATION 8 Illustrative Analysis: Potential Value Creation Normalized to $10 Share Price 1 Medium - term Longer - term $10 Potential Upside From Valuation Multiple Re - rating • 32% if current EV/EBITDA multiple is in line with average Indian Healthcare Services comps • 29% if current EV/EBITDA multiple is in line with Thyrocare 2 • 61% if current EV/EBITDA multiple is in line with Dr Lal PathLabs 2 $3 - 6 EBITDA Growth: • Targeting 20% revenue & EBITDA CAGR for next 3 years • EBITDA projections include potential bolt - on acquisitions • EBITDA projection does not include potential margin expansion due to scale benefits or efficiency improvements $7 $23 - 26 $3 Public Private Partnerships (PPP): • Medall FY18 revenue from PPP contracts is 37% 3 • Targeting 2 more State - level PPP contracts 1. Excludes any potential dilution from unexercised warrants at strike price of $11.50 2. Detailed peer comparables on slide 33 3. Revenue composition provided on slide 10 Note: Please see EBITDA reconciliation on slide 40

MEDALL OVERVIEW

MEDALL OVERVIEW Source: Medall data 1. Indian financial year is Apr 1 - Mar 31. All financials as per Indian GAAP. EBITDA reconciliation on slide 40 2. Other includes State of Maharashtra and Kerala 17% Revenue FY13 - 18 CAGR 1 ~25 million tests conducted p.a. 7,850+ Touch points ~570 Corporate Tie - ups ~9 million customers p.a. #5 Pathology Company in India #1 Apex Lab Network in India 27% EBITDA FY13 - 18 CAGR 1 48,000+ Network of doctors Among the Biggest Integrated Indian Radiology & Pathology Companies #1 in South India 10 900+ Pathology Tests Offered 750+ Radiology 62% 38% Radiology Pathology 37% 63% Government Contracts Private Payors 41% 24% 21% 8% 6% Tamil Nadu Andhra Pradesh Karnataka Jharkhand Other 2 FY18 Revenue Mix by State FY18 Revenue Mix by Payor FY18 Revenue Mix by Service
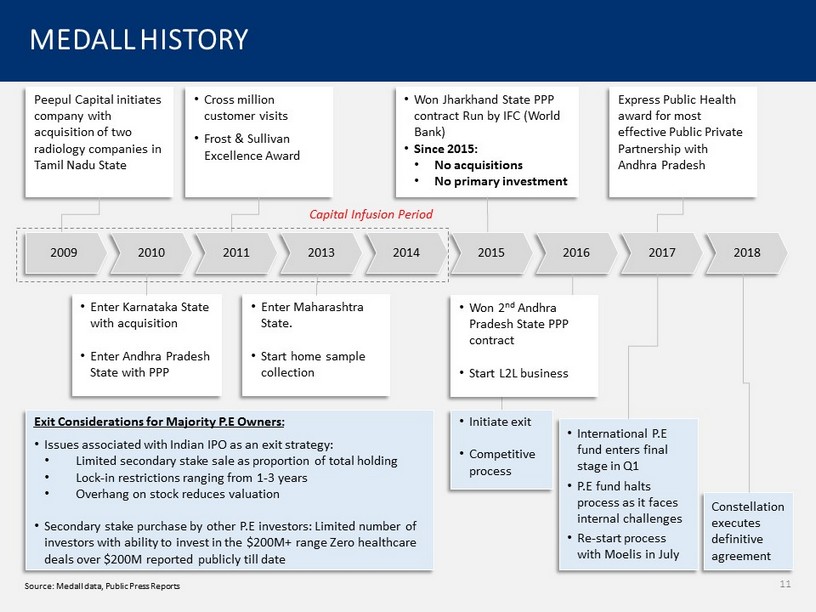
MEDALL HISTORY Source: Medall data, Public Press Reports 11 2009 2010 2011 2013 2015 2016 2017 Peepul Capital initiates company with acquisition of two radiology companies in Tamil Nadu State • Enter Karnataka State with acquisition • Enter Andhra Pradesh State with PPP • Cross million customer visits • Frost & Sullivan Excellence Award • Enter Maharashtra State. • Start home sample collection • Won Jharkhand State PPP contract Run by IFC (World Bank) • Since 2015: • No acquisitions • No primary investment 2018 Express Public Health award for most effective Public Private Partnership with Andhra Pradesh • Initiate exit • Competitive process • International P.E fund enters final stage in Q1 • P.E fund halts process as it faces internal challenges • Re - start process with Moelis in July Constellation executes definitive agreement 2014 Capital Infusion Period Exit Considerations for Majority P.E Owners: • Issues associated with Indian IPO as an exit strategy: • Limited secondary stake sale as proportion of total holding • Lock - in restrictions ranging from 1 - 3 years • Overhang on stock reduces valuation • Secondary stake purchase by other P.E investors: Limited number of investors with ability to invest in the $200M+ range Zero healthcare deals over $200M reported publicly till date • Won 2 nd Andhra Pradesh State PPP contract • Start L2L business

MARKET LEADER IN PATHOLOGY & RADIOLOGY Status Listed Unlisted IPO planned Listed Unlisted Inception 1949 1996 1981 1996 2009 Ownership Family (58%) Public (42%) Subsidiary of Fortis hospital Family (63%) Carlyle (37%) Family (64%) Public (36%) Private Equity owned for 9 years Private Equity Investment 3 T.A Associates, Westbridge, Sequoia IFC (World Bank), Jacob Ballas, Avigo, Sabre Carlyle, KKR, Warburg Pincus, ICICI Venture Norwest Venture, Samara Capital, CX Partners Peepul Capital Number of Labs 3 189 368 150 7 186 Enterprise Value, $M 4 1,113 n.a. n.a. 474 267 10,569 8,540 6,900 3,563 3,544 Dr Lal SRL Metropolis Thyrocare Medall Source: Company filings, Bloomberg, Medall data. 1. FY18 is Apr 1 2017 - Mar 31, 2018. As per Indian GAAP 2. Metropolis is an unlisted company and does not disclose financials publicly Last known revenue figure cited in the press 3. Press releases, public domain data 4. Enterprise Value for Dr Lal and Thyrocare as of July 31, 2018 12 FY18 1 Revenues (INR M) 2

HUB & SPOKE BUSINESS MODEL 13 Sample Analysis Franchise PPP Contracts Lab - to - Lab Sample Collection & Imaging Medall Spokes Company Owned 241 Franchise 258 Govt Contracts 1,423 Lab - to - Lab 5,928 Total Centers 7,850 186 Labs Hubs Spokes Doctors Walk - ins Hospitals Corporate Customers Online Registration Company Owned Reports Source: Medall data Doctors Patients 26 Apex Labs
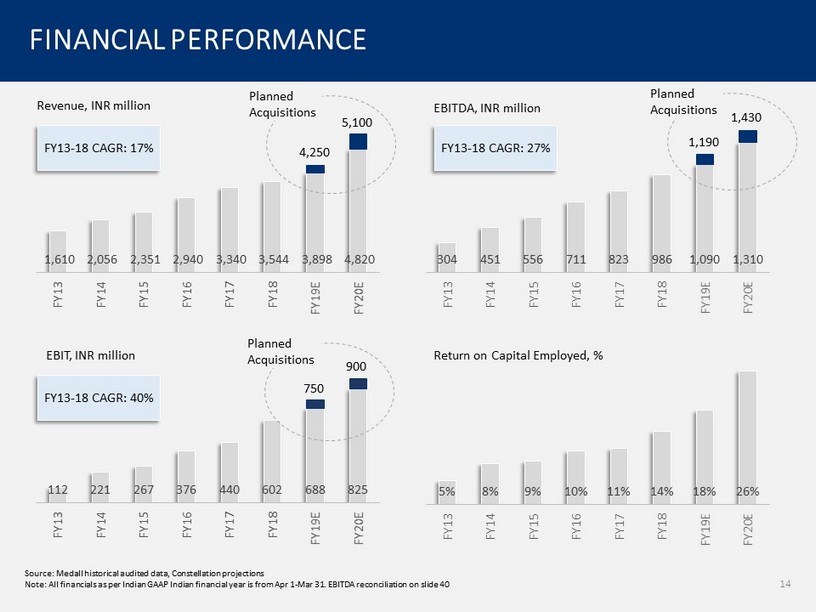
5% 8% 9% 10% 11% 14% 18% 26% FY13 FY14 FY15 FY16 FY17 FY18 FY19E FY20E FINANCIAL PERFORMANCE 1,610 2,056 2,351 2,940 3,340 3,544 3,898 4,820 FY13 FY14 FY15 FY16 FY17 FY18 FY19E FY20E Revenue, INR million EBITDA, INR million 304 451 556 711 823 986 1,090 1,310 FY13 FY14 FY15 FY16 FY17 FY18 FY19E FY20E 112 221 267 376 440 602 688 825 FY13 FY14 FY15 FY16 FY17 FY18 FY19E FY20E EBIT, INR million Return on Capital Employed, % Source: Medall historical audited data, Constellation projections Note: All financials as per Indian GAAP Indian financial year is from Apr 1 - Mar 31. EBITDA reconciliation on slide 40 FY13 - 18 CAGR: 17% FY13 - 18 CAGR: 27% 14 FY13 - 18 CAGR: 40% 4,250 5,100 1,190 1,430 Planned Acquisitions Planned Acquisitions Planned Acquisitions 750 900
INVESTMENT MERITS

16 Large, high growth market in the fastest growing major economy Differentiated business model positioned to extend market leadership India’s leading Apex lab network provides strong foundation for geographic expansion Acquisition strategy to consolidate fragmented industry Attractive entry valuation with significant upside potential INVESTMENT MERITS Margin expansion driven by growing scale Strong Macro Tailwinds Competitive Differentiation Organic Growth Industry Consolidation Attractive Valuation Scale Effect Investment Merits 1 2 3 4 5 6
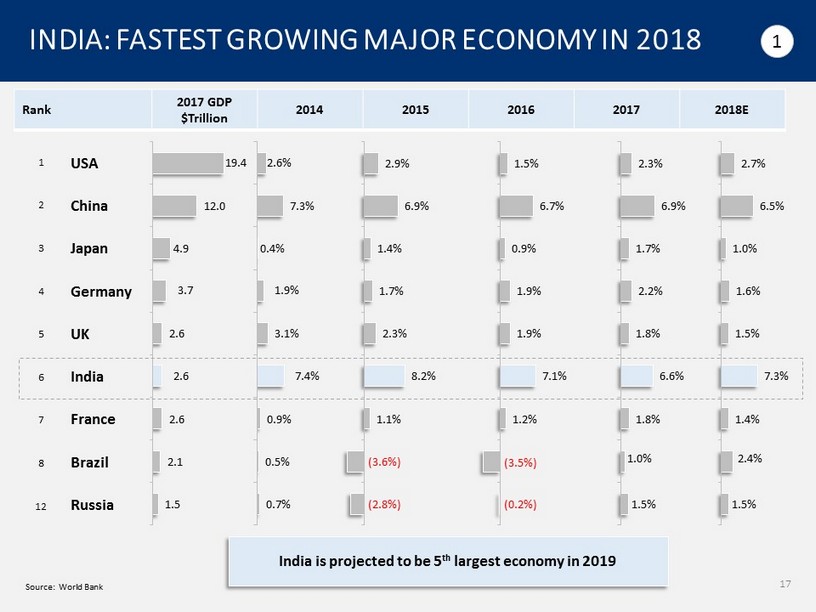
INDIA: FASTEST GROWING MAJOR ECONOMY IN 2018 17 Source: World Bank 1.5 2.1 2.6 2.6 2.6 3.7 4.9 12.0 19.4 0.7% 0.5% 0.9% 7.4% 3.1% 1.9% 0.4% 7.3% 2.6% (2.8%) (3.6%) 1.1% 8.2% 2.3% 1.7% 1.4% 6.9% 2.9% Rank 2017 GDP $Trillion 2014 2015 2016 2017 2018E India is projected to be 5 th largest economy in 2019 1 (0.2%) (3.5%) 1.2% 7.1% 1.9% 1.9% 0.9% 6.7% 1.5% 1.5% 1.0% 1.8% 6.6% 1.8% 2.2% 1.7% 6.9% 2.3% 1.5% 2.4% 1.4% 7.3% 1.5% 1.6% 1.0% 6.5% 2.7% 1 2 3 4 5 6 7 8 12 USA Russia China Japan Germany UK India France Brazil

GDP GROWTH DRIVING EQUITY PERFORMANCE 18 Market Price Performance 1 2014 2015 2016 2017 2018 USA S&P500 11.4% (0.7%) 9.5% 19.4% 5.3% Japan Nikkei 7.1% 9.1% 0.4% 19.1% (0.9%) UK FTSE (2.7%) (4.9%) 14.4% 7.6% 0.8% HK Hang Seng 1.3% (7.2%) 0.4% 36.0% (4.5%) India Nifty 31.4% (4.1%) 2.8% 28.6% 8.8% Source: Bloomberg as on July 31, 2018 1. 2018 performance over Jan 1 to Jul 31 while remaining years are Jan 1 – Dec 31. As reported in local currency 1

GDP GROWTH FUELING PERSONAL CONSUMPTION Source: Trading Economics, India Healthcare Roadmap 2025, Bain Consulting , “Indian Hospitals, Ready to Consolidate”, Spark Capital Note: High income – Annual income greater than INR 2M; Middle income – Annual income in range of INR 0.15 – 2 M; Low income – An nual income lesser than INR 0.15 M Economic Growth Expected to Usher in 250 Million New Middle Class Consumers Domestic Consumption Growing Rapidly Urbanization Driving Incidence of Chronic Diseases Leading to Rapid Growth in Chronic Disease Spending 1 55.0% 34.0% 44.0% 62.0% 0.6% 4.4% 2010 2020 Low Income Middle Income High Income Market 2018 Market Size, $Billion 2008 - 18 CAGR Cardiac 15.3 18% Oncology 7.8 16% Endocrine 2.4 19% 1,219 M 1,399 M 54 62 72 2013 2015 2017 Domestic Consumption, INR trillion 7.5% CAGR Disease Incidence (2025) Rural Urban Obesity (in men) 55% 70% Hypertension 10% 25% Ischemic heart disease 3% 6% 19
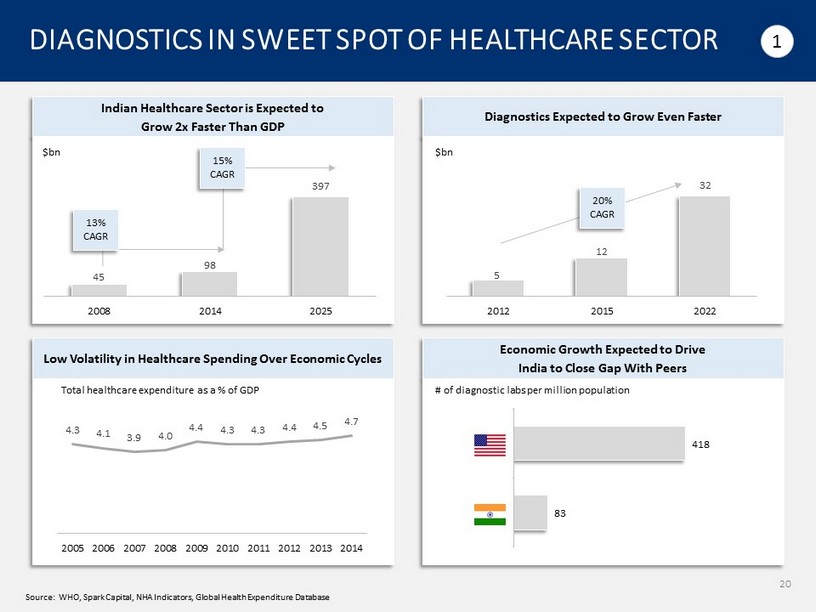
Economic Growth Expected to Drive India to Close Gap With Peers DIAGNOSTICS IN SWEET SPOT OF HEALTHCARE SECTOR 20 Source: WHO, Spark Capital, NHA Indicators, Global Health Expenditure Database 1 Indian Healthcare Sector is Expected to Grow 2x Faster Than GDP 45 98 397 2008 2014 2025 $bn Diagnostics Expected to Grow Even Faster 5 12 32 2012 2015 2022 $bn Low Volatility in Healthcare Spending Over Economic Cycles Total healthcare expenditure as a % of GDP 20% CAGR 15% CAGR 13% CAGR 4.3 4.1 3.9 4.0 4.4 4.3 4.3 4.4 4.5 4.7 2005 2006 2007 2008 2009 2010 2011 2012 2013 2014 83 418 Russia Brazil # of diagnostic labs per million population

DIFFERENTIATED BUSINESS MODEL 21 2 • One - stop shop for patients • Integrated Radiology and Pathology business model better positions us to partner with hospitals • Higher barrier to entry than standalone pathology businesses • Significant market leadership position in South India • Strong brand name enables acquisition strategy • 8 - year track record of PPP contracts • Significant opportunity to accelerate growth versus relying on acquiring retail customers Integrated Service Offering Regional Leader Strong Brand. PPP Experience & Credentials
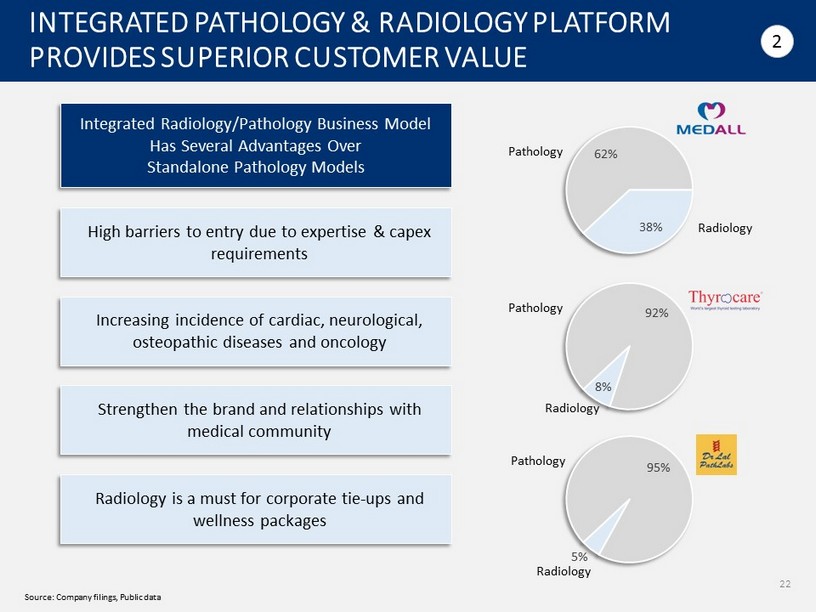
INTEGRATED PATHOLOGY & RADIOLOGY PLATFORM PROVIDES SUPERIOR CUSTOMER VALUE 22 2 High barriers to entry due to expertise & capex requirements Radiology is a must for corporate tie - ups and wellness packages Increasing incidence of cardiac, neurological, osteopathic diseases and oncology Strengthen the brand and relationships with medical community Integrated Radiology/Pathology Business Model Has Several Advantages Over Standalone Pathology Models 62% 38% Radiology Pathology 92% 8% Radiology Pathology 95% 5% Radiology Pathology Source: Company filings, Public data

REGIONAL LEADER WITH STRONG BRAND RECALL Source: Company filings, Medall estimates 1 Indian financial year is Apr 1 - Mar 31. All financials as per Indian GAAP 23 Medall Player 2 Player 3 Player 4 Player 5 FY17 1 Revenue Customer Touch Points Maharashtra Company Managed 5 Franchisee Managed 0 Lab - to - Lab 282 Total 287 Customer Touch Points Bangalore Rest of Karnataka Company Managed 39 15 Franchisee Managed 13 9 Lab - to - Lab 478 545 Total 530 568.4 Customer Touch Points Kerala Company Managed 31 Franchisee Managed 3 Lab - to - Lab 663 Total 68.47 Customer Touch Points Jharkhand Company Managed 6 Company Managed (Government) 93 Franchisee Managed 39 Lab - to - Lab 345 Total 483 Customer Touch Points Andhra Pradesh & Telangana Company Managed 26 Franchisee Managed 145 Franchisee Managed (Government) 1,330 Lab - to - Lab 1,625 Total 3,126 Customer Touch Points Chennai Rest of State Company Managed 57 62 Franchisee Managed 31 18 Lab - to - Lab 574 1.416 Total 662 1,496 2 #1 in South India Very high penetration High penetration Underpenetrated

DEEP EXPERIENCE IN PPPs OPENS GROWTH AVENUES • 8 - year track record in PPPs. • PPP contracts in 3 States: Andhra Pradesh, Karnataka, Jharkhand Source: World Bank, Medall data Medall Has Deepest Experience with PPPs in Indian Healthcare 24 2 17.9% 4.7% 8.0% 1.3% USA India Total HC Spending Govt Spending Indian Government Has Relied on Public Private Partnerships to Supplement Public Spending % of GDP, 2016 India Has Successful Track Record of Utilizing PPPs for Infrastructure Buildout Company PPP Projects by State SRL Diagnostics Himachal Pradesh, Jharkhand, Uttar Pradesh Krsnaa Diagnostics Uttar Pradesh Narayana Hrudayalaya Karnataka Apollo Hospitals Karnataka

MARGIN EXPANSION WITH INCREASING SCALE Source: Medall data 1 Indian financial year is Apr 1 - Mar 31. All financials as per Indian GAAP. EBITDA reconciliation on slide 40 Revenue & EBITDA Margins Since Inception FY10 FY11 FY12 FY13 FY14 FY15 FY16 FY17 FY18 11x 2x 2x EBITDA 4% 8% 9% 19% 22% 24% 24% 25% 28% margin Revenues 1 INR, million 25 • Revenue grew 11x • EBITDA margins grew from 4% to 9% • Revenue grew 2x • EBITDA margins grew from 9% to ~24% • Revenue grew 2x • EBITDA margins grew to 28% Power of scale: • Smaller companies operating at single - digit margins • Cannot compete with bigger companies on price • Brand (market leader) facilitates acquisition strategy 3

Total Labs Apex Labs INDUSTRY - LEADING APEX LAB NETWORK PROVIDES PLATFORM FOR GROWTH IN COLLECTION CENTERS Source: Medall data, Public data 1 1 4 26 7 189 368 186 26 4 • Hub capacity is principal bottleneck for sample processing • Industry leading hub capacity provides growth springboard Scalability • Large network of Apex labs reduces the need to transport samples to central lab • Industry - leading Turn - Around - Time Response Time
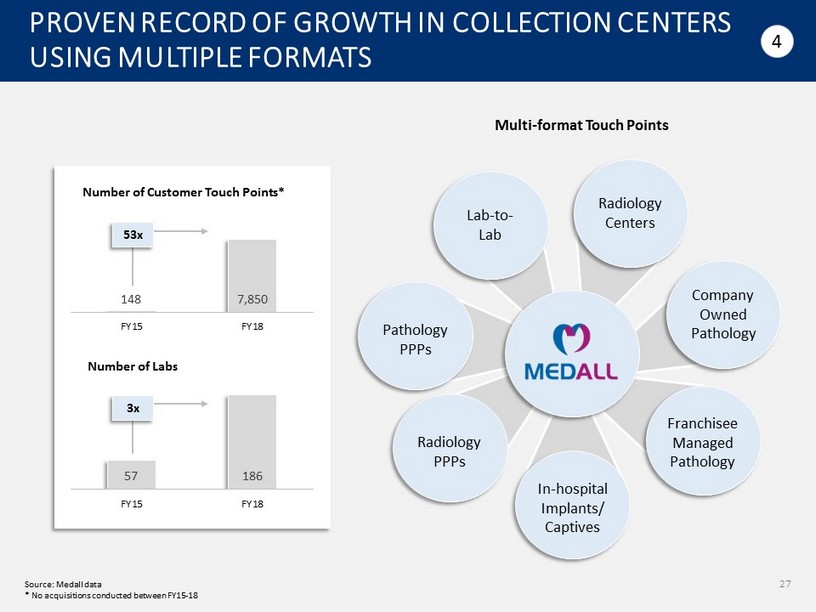
57 186 FY15 FY18 148 7,850 FY15 FY18 PROVEN RECORD OF GROWTH IN COLLECTION CENTERS USING MULTIPLE FORMATS 27 53x 3x Number of Customer Touch Points* Number of Labs Source: Medall data * No acquisitions conducted between FY15 - 18 4 Company Owned Pathology Radiology Centers Lab - to - Lab Franchisee Managed Pathology In - hospital Implants/ Captives Radiology PPPs Pathology PPPs Multi - format Touch Points

• Penetrate regions with limited coverage by other National Diagnostics Chains • Acquire Regional Leaders • Public - Private Partnerships at the State level Enter New Markets 3x Deeper Coverage Of Existing Markets in 5 Years GEOGRAPHIC EXPANSION: WIDER & DEEPER FOOTPRINT Source: Medall data 28 4 FY17 FY20 FY22

INDIAN DIAGNOSTICS INDUSTRY RIPE FOR CONSOLIDATION 29 Source: Goldman Sachs Indian Healthcare report 5 44% 56% Indian Diagnostics Sector is Highly Fragmented 6% 94% Quest & LabCorp Top 2 USA India Top 5 Small chains Singleton labs 2015 2020E Source: Medall data Market Leaders Expected To Drive Consolidation Independent Labs (ex - hospital) Market Share Independent Labs (ex - hospital) Market Share 17% 9%

2008 2009 2010 2011 2012 2013 2014 2015 2016 2017 Pathway Diagnostics • OralDNA Labs • Vasogen • Caritas Medical Labs Genomic Vision Societe Anonyme • Athena Diagnostics ($740M) • Celera ($657M) • AHS S.E.D Medical Labs ($51M) • OralDNA Labs • UMass Memorial Medical Center 1 • Dignity Health 2 • Concentra 3 • Enterix • Converge Diagnostic Services • Solstas Lab Partners ($572M) • Summit Health ($139M) • Steward Health Care System ($34M) MemorialCare Health System, ($35M) • Clinical Laboratory Partners ($135M) • Focus Diagnostics ($300M) • PeaceHealth Labs 4 • ClearPoint Diagnostic Labs • Med Fusion • Cape Cod Healthcare 5 • Sheil Medical Lab • William W.Backus Hospital 6 • Cleveland HeartLab ($94 M) • California Lab Associates PathNet Esoteric Laboratory Institute Monogram Biosciences ($149M) • LabWest ($58M) • DCL Medical Labs • Esoterix Genetic Labs ($925M) • Orchid Cellmark ($84M) • Clearstone Central Labs • MDdatacor MEDTOX Scientific ($248M) • Bendinger & Schlesinger • Muir Labs • Laboratory Partners, Talon Division ($12M) • LipoScience ($101M) • Bode Cellmark Forensics • Covance ($6.5 B) • Physicians Reference Lab • Safe Foods • Pathology • Sequenom ($426M) • ClearPath Diagnostics • Mount Sinai Health System, Clinical Outreach Labs • Pathology Associates Medical Labs CONSOLIDATION LOGIC WELL TESTED IN DIAGNOSTICS, EVEN IN MATURE MARKETS 30 5 Source: CapitalIQ, Public Sources. Information may not be complete or may be estimates based on public data Note: Year of acquisition refers to year in which acquisition was closed; Number in bracket indicates deal size Quest Diagnostics: 1 Anatomic pathology outreach, laboratory business and clinical outreach laboratory 2 Lab related clinical ou treach business 3 Advanced toxicology network laboratory business4 Outreach laboratory service operations 5 Laboratory services business 6 Services business LabCorp: 1 Talon division 2 Clinical outreach laboratory

MEDALL ACQUISITION HISTORY/CAPABILITIES Proven Track Record of Acquisitions • 24 acquisitions closed since 2009 • Consummated at lower acquisition multiples than listed Industry peers • Sophisticated integration capabilities Post - Merger Value Creation Source: Medall data 1 Indian financial year is Apr 1 - Mar 31. All financials as per Indian GAAP Revenue at Acquisition FY17 1 Revenue Revenue CAGR since acquisition 180 803 24% 30 608 54% 26 109 22% 66 83 5% 36 59 10% 31 5

MEDALL: POTENTIAL ACQUISITION TARGETS Target Code Revenue 2 INR Million EBITDA 2 INR Million D1KER11 480 120 D2TEL7 300 75 D1CHN11 300 75 D1ROTN4 300 75 D1ROTN5 300 75 D2TEL8 200 50 D1ROTN6 200 50 D2NAS7 700 35 D2NAS8 120 30 D1CHN17 60 27 Total 2,960 612 Tracking 118 potential acquisition targets 1 Top 10 targets alone can potentially grow EBITDA by 50+% Anticipated acquisition multiples significantly lower than listed peers Source: Medall data 1. Any acquisitions will depend on, among other things, due diligence results CNAC may not close any acquisitions in its pipelin e 2. Based on latest twelve month financials provided by potential target companies 32 5

SELECT PUBLICLY TRADED COMPARABLES FINANCIAL YEAR CALENDARIZED TO APRIL 1 - MARCH 31 Source: Bloomberg as July 31, 2018. Note: n.m. - Not Meaningful. 1. Revenue growth is for FY19 (financial year from April 1 - March 31, 2019) for Indian companies and for FY18 for US and EM companie s (financial year from Jan 1 - December 31, 2018) 2. EBITDA margin and Debt/EBITDA is for FY18 (financial year from April 1 - March 31, 2018) for Indian companies and for FY17 for US and EM companies (financial year from Jan 1 - December 31, 2017) 3. Current relates to April 1 - March 31, 2019 4. Forward relates to April 1 - March 31, 2020 # Name Market Cap Growth 1 EBITDA Margin 2 Debt/ EBITDA 2 EV/ Revenue EV/ EBITDA ($M) Revenue EBITDA Current 3 Forward 4 Current 3 Forward 4 US Companies 1 Quest Diagnostics 14,722 (0%) 10% 19% 2.6x 2.4x 2.3x 11.5x 10.9x 2 Laboratory Corp of America 17,867 9% 12% 18% 3.6x 2.1x 2.1x 11.3x 10.7x 3 NeoGenomics Laboratories 1,129 3% 60% 10% 4.2x 4.6x 4.1x 29.6x 24.2x 4 Bio - Rad Laboratories 9,146 7% 44% 12% 1.6x 3.8x 3.6x 22.3x 19.3x 5 Natera, Inc. 1,349 24% (28)% n.m. n.m. 4.9x 3.9x n.m. n.m. 6 Invitae Corp. 594 95% (4)% n.m. n.m. 4.0x 2.6x n.m. n.m. US Average 23% 16% 15% 3.0x 3.6x 3.1x 18.7x 16.3x US Median 8% 11% 15% 3.1x 3.9x 3.1x 16.9x 15.4x Indian Companies 1 Dr. Lal Pathlabs 1,143 17% 17% 25% 0.0x 6.2x 5.3x 24.7x 20.8x 2 Thyrocare Technologies 489 23% (2)% 47% 0.1x 7.4x 6.2x 19.8x 16.4x 3 Apollo Hospitals 1,932 14% 25% 10% 4.2x 1.7x 1.5x 16.3x 13.6x 4 Fortis Healthcare 1,057 8% 67% 6% 5.1x 1.9x 1.7x 20.5x 14.7x 5 Narayana Hrudayalaya 775 24% 37% 9% 3.5x 2.1x 1.9x 20.7x 15.8x 6 HealthCare Global Enterprises 358 20% 22% 14% 3.1x 2.9x 2.4x 19.8x 15.6x India Average 18% 28% 19% 2.7x 3.7x 3.2x 20.3x 16.2x India Median 18% 24% 12% 3.3x 2.5x 2.2x 20.2x 15.7x Emerging Market Companies 1 IHH Healthcare Bhd 11,986 12% (4%) 26% 2.4x 4.1x 3.7x 18.8x 16.2x 2 Bangkok Dusit Medical Services 12,428 6% (5%) 26% 2.1x 5.7x 5.2x 24.9x 22.3x 3 Bumrungrad Hospital 3,983 5% 6% 33% 0.6x 6.5x 6.0x 19.3x 17.8x 4 Mitra Keluarga Karyasehat 2,019 13% 6% 35% 0.0x 9.4x 8.3x 28.8x 25.4x 5 Raffles Medical Group 1,478 7% 2% 20% 0.8x 3.7x 3.1x 20.7x 20.4x 6 Dian Diagnostics Group 1,556 30% 49% 13% 5.1x 2.0x 1.6x 14.2x 10.9x Emerging Market Average 12% 9% 25% 1.9x 5.3x 4.6x 21.1x 18.8x Emerging Market Median 10% 4% 26% 1.5x 4.9x 4.4x 20.0x 19.1x 33 6

Select US Peers With High Anticipated EBITDA Growth ATTRACTIVE VALUATION: RELATIVE TO US PEERS 34 6 20% 3% 7% Target Neo Biorad Revenue Growth (FY18 - 19) Source: Bloomberg as July 31, 2018. Note: Revenue and EBITDA growth for US companies represent financial year Jan1 - Dec 31, 2018 and Indian companies represent finan cial year April 1 - March 31,2019; Current represents financial year from April 1, 2018 to March 31, 2019; Forward represents financial year from April 1, 2019 to March 31 , 2020. Please see EBITDA reconciliation on slide 40 EBITDA Growth (FY18 - 19) Lower Valuation Relative to U.S. Peers 4.3x 4.6x 3.8x Target neo biorad 3.6x 4.1x 3.6x Target Dr Lal Thyrocare 12.8x 24.2x 19.3x Target Neo BioRad 20% 60% 44% Target Neo Biorad Current EV/Revenue Current EV/EBITDA Forward EV/Revenue 15.4x 29.6x 22.3x Target Neo BioRad Forward EV/EBITDA
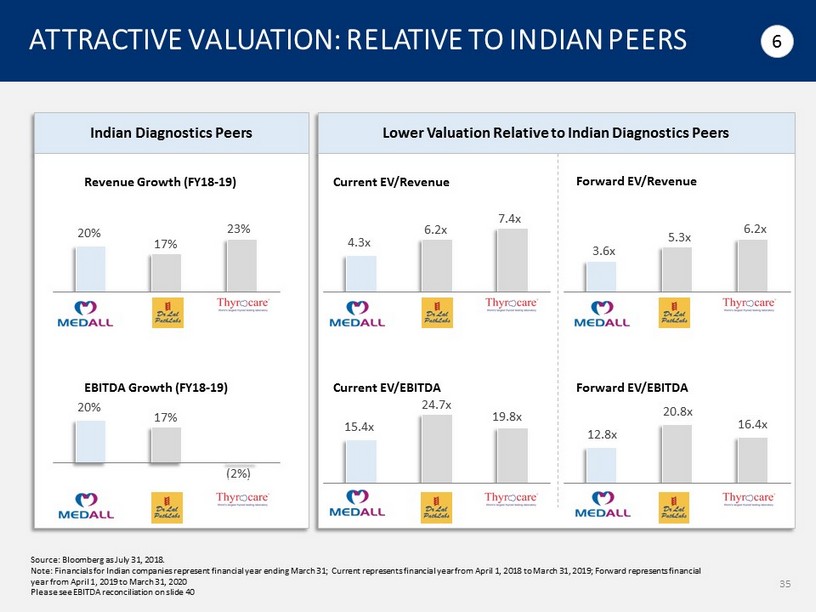
Indian Diagnostics Peers ATTRACTIVE VALUATION: RELATIVE TO INDIAN PEERS 35 6 20% 17% 23% Target Dr Lal Thyrocare Revenue Growth (FY18 - 19) Source: Bloomberg as July 31, 2018. Note: Financials for Indian companies represent financial year ending March 31; Current represents financial year from April 1, 2018 to March 31, 2019; Forward represents financial year from April 1, 2019 to March 31, 2020 Please see EBITDA reconciliation on slide 40 20% 17% (2%) Target Dr Lal Thyrocare EBITDA Growth (FY18 - 19) Lower Valuation Relative to Indian Diagnostics Peers 4.3x 6.2x 7.4x Target Dr Lal Thyrocare Current EV/Revenue 15.4x 24.7x 19.8x Target Dr Lal Thyrocare Current EV/EBITDA 3.6x 5.3x 6.2x Target Dr Lal Thyrocare 12.8x 20.8x 16.4x Target Dr Lal Thyrocare Forward EV/Revenue Forward EV/EBITDA

IPO PERFORMANCE OF INDIAN DIAGNOSTICS PEERS 36 6 Source: Bloomberg 1. Performance on listing measured as Day 1 Closing Price over IPO price Note: Medall Purchase EV is ~3x total size of Thyrocare IPO IPO Date Dec 23, 2015 May 09, 2016 EV/EBITDA at IPO 20.6x 24.7x Performance on listing 1 49.8% 38.6% IPO Size, INR M 6,319 4,792 Subscription 33.4x 73.6x

APPENDIX
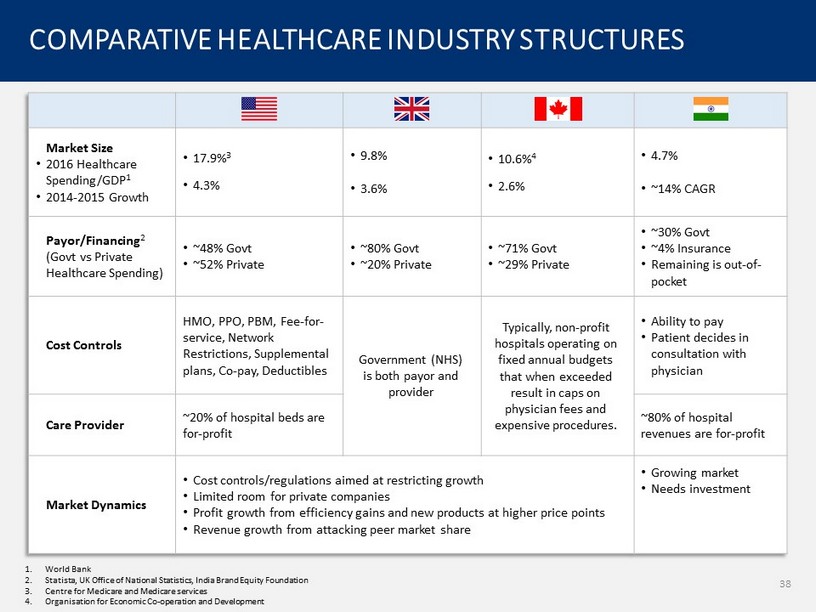
COMPARATIVE HEALTHCARE INDUSTRY STRUCTURES 1. World Bank 2. Statista, UK Office of National Statistics, India Brand Equity Foundation 3. Centre for Medicare and Medicare services 4. Organisation for Economic Co - operation and Development Market Size • 2016 Healthcare Spending/GDP 1 • 2014 - 2015 Growth • 17.9% 3 • 4.3% • 9.8% • 3.6% • 10.6% 4 • 2.6% • 4.7% • ~14% CAGR Payor/Financing 2 (Govt vs Private Healthcare Spending) • ~48% Govt • ~52% Private • ~80% Govt • ~20% Private • ~71% Govt • ~29% Private • ~30% Govt • ~4% Insurance • Remaining is out - of - pocket Cost Controls HMO, PPO, PBM, Fee - for - service, Network Restrictions, Supplemental plans, Co - pay, Deductibles Government (NHS) is both payor and provider Typically, non - profit hospitals operating on fixed annual budgets that when exceeded result in caps on physician fees and expensive procedures. • Ability to pay • Patient decides in consultation with physician Care Provider ~20% of hospital beds are for - profit ~80% of hospital revenues are for - profit Market Dynamics • Cost controls/regulations aimed at restricting growth • Limited room for private companies • Profit growth from efficiency gains and new products at higher price points • Revenue growth from attacking peer market share • Growing market • Needs investment 38

INDIAN DIAGNOSTICS OVERVIEW 39 $4.0 vs $5.6 billion Hospital vs Standalone Market $4 - $5 Cost Of Average Pathology Test 56% vs 44% Pathology vs Radiology Revenues $9.6 billion Total Diagnostics Market Size, 2018 25% Growth Rate of Preventative & Wellness Testing Source: Goldman Sachs, Diagnostics and Clinical Labs Sector Initiation Report, Jun 2018 Indian Diagnostic Costs Are Among the Lowest in The World US Insured Patients (uninsured pay more) Range Total Billed for Blood Test $312 – $1,200 (average $755) Covered by Insurance $29 – $525 Out - of - pocket $283 – $675 (average $432) India Range Complete Blood Count (CBC) $4 – $5 Medall SASH (Stay Aware Stay Healthy) – 57 tests ~$9 Source: http://health.costhelper.com/blood - test.html Source: Medall data

EBITDA RECONCILIATION 40 Source: Medall data Audited as per Indian Accounting Standard 1. Presented using exchange rate of $1 to INR 68.4 for the sake of illustration INR, Million USD, Million 1 FY16 - 17 FY17 - 18 FY16 - 17 FY17 - 18 Net Income (48) 273 (0.7) 4.0 Minority Income 1 3 0.0 0.0 Defined Benefit Plans & Fair Value of Equity Instruments (5) (2) (0.1) (0.0) Extraordinary Items 55 19 0.8 0.3 Current & Deferred Tax 84 136 1.2 2.0 Finance Expenses 365 186 5.3 2.7 Depreciation & Amortization 371 371 5.4 5.4 Adjusted EBITDA 823 986 12.0 14.4