Attached files
| file | filename |
|---|---|
| EX-99.1 - EXHIBIT 99.1 - STONERIDGE INC | tv499921_ex99-1.htm |
| 8-K - 8-K - STONERIDGE INC | tv499921_8k.htm |
Second - Quarter 2018 Results August 2, 2018 Exhibit 99.2
2 Forward - Looking Statements Statements in this presentation contain “forward - looking statements” under the Private Securities Litigation Reform Act of 1995. These statements appear in a number of places in this report and may include statements regarding the intent, belief or current expectations o f t he Company, with respect to, among other things, our (i) future product and facility expansion, (ii) acquisition strategy, (iii) investments a nd new product development, (iv) growth opportunities related to awarded business and (v) operational expectations. Forward - looking statements may be ident ified by the words “will,” “may,” “should,” “designed to,” “believes,” “plans,” “projects,” “intends,” “expects,” “estimates,” “anticipates,” “c ont inue,” and similar words and expressions. The forward - looking statements are subject to risks and uncertainties that could cause actual events or results to differ materially from those expressed in or implied by the statements. Important factors that could cause actual results to differ materially fro m those in the forward - looking statements include, among other factors: • the reduced purchases, loss or bankruptcy of a major customer or supplier; • the costs and timing of business realignment, facility closures or similar actions; • a significant change in automotive, commercial, off - highway, motorcycle or agricultural vehicle production; • competitive market conditions and resulting effects on sales and pricing; • the impact on changes in foreign currency exchange rates on sales, costs and results, particularly the Argentinian peso, Braz ili an real, Chinese renminbi, euro, Mexican peso and Swedish krona; • our ability to achieve cost reductions that offset or exceed customer - mandated selling price reductions; • customer acceptance of new products; • our ability to successfully launch/produce products for awarded business; • adverse changes in laws, government regulations or market conditions, including tariffs, affecting our products or our custom ers ’ products; • our ability to protect our intellectual property and successfully defend against assertions made against us; • liabilities arising from warranty claims, product recall or field actions, product liability and legal proceedings to which w e a re or may become a party, or the impact of product recall or field actions on our customers; • labor disruptions at our facilities or at any of our significant customers or suppliers; • the ability of our suppliers to supply us with parts and components at competitive prices on a timely basis, including the im pac t of potential tariffs and trade considerations on their operations and output; • the amount of our indebtedness and the restrictive covenants contained in the agreements governing our indebtedness, includin g o ur revolving credit facility; • capital availability or costs, including changes in interest rates or market perceptions; • the failure to achieve the successful integration of any acquired company or business; • risks related to a failure of our information technology systems and networks, and risks associated with current and emerging te chnology threats and damage from computer viruses, unauthorized access, cyber attack and other similar disruptions; and • the items described in Part I, Item IA (“Risk Factors”) of our 10 - K filed with the SEC. In addition, the forward - looking statements contained herein represent our estimates only as of the date of this release and sho uld not be relied upon as representing our estimates as of any subsequent date. While we may elect to update these forward - looking statements at some point in the future, we specifically disclaim any obligation to do so, whether to reflect actual results, changes in assumptions, chan ges in other factors affecting such forward - looking statements or otherwise. Rounding Disclosure: There may be slight immaterial differences between figures represented in our public filings compared t o w hat is shown in this presentation. The differences are the a result of rounding due to the representation of values in millions rather than tho usands in public filings.
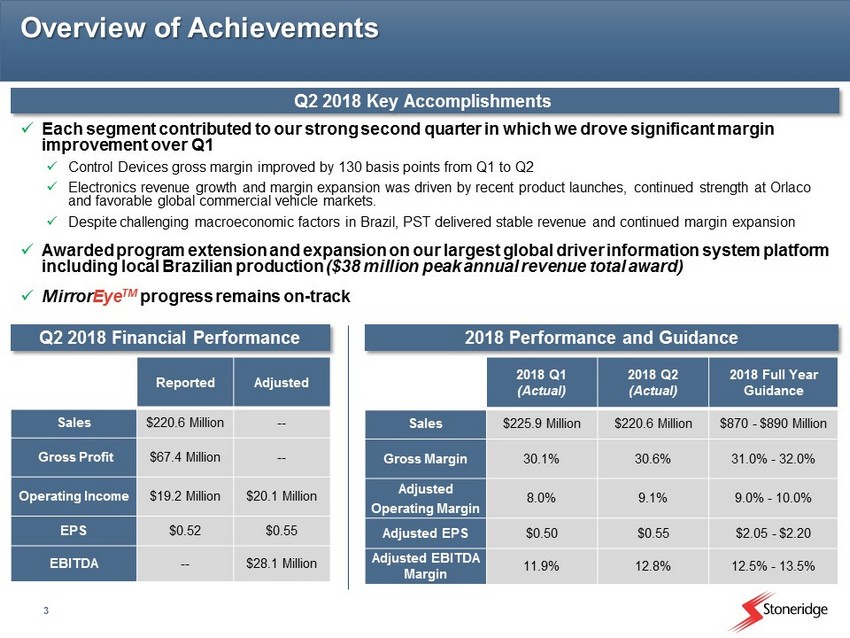
3 Overview of Achievements x Each segment contributed to our strong second quarter in which we drove significant margin improvement over Q1 x Control Devices gross margin improved by 130 basis points from Q1 to Q2 x Electronics revenue growth and margin expansion was driven by recent product launches, continued strength at Orlaco and favorable global commercial vehicle markets. x Despite challenging macroeconomic factors in Brazil, PST delivered stable revenue and continued margin expansion x Awarded program extension and expansion on our largest global driver information system platform including local Brazilian production ($38 million peak annual revenue total award) x Mirror Eye TM progress remains on - track Q 2 2018 Key Accomplishments Q 2 2018 Financial Performance 2018 Performance and Guidance 2018 Q1 (Actual) 2018 Q2 (Actual) 2018 Full Year Guidance Sales $225.9 Million $220.6 Million $870 - $890 Million Gross Margin 30.1% 30.6% 31.0% - 32.0% Adjusted Operating Margin 8.0% 9.1% 9.0% - 10.0% Adjusted EPS $0.50 $0.55 $2.05 - $2.20 Adjusted EBITDA Margin 11.9% 12.8% 12.5% - 13.5% Reported Adjusted Sales $220.6 Million -- Gross Profit $67.4 Million -- Operating Income $19.2 Million $20.1 Million EPS $0.52 $0.55 EBITDA -- $28.1 Million
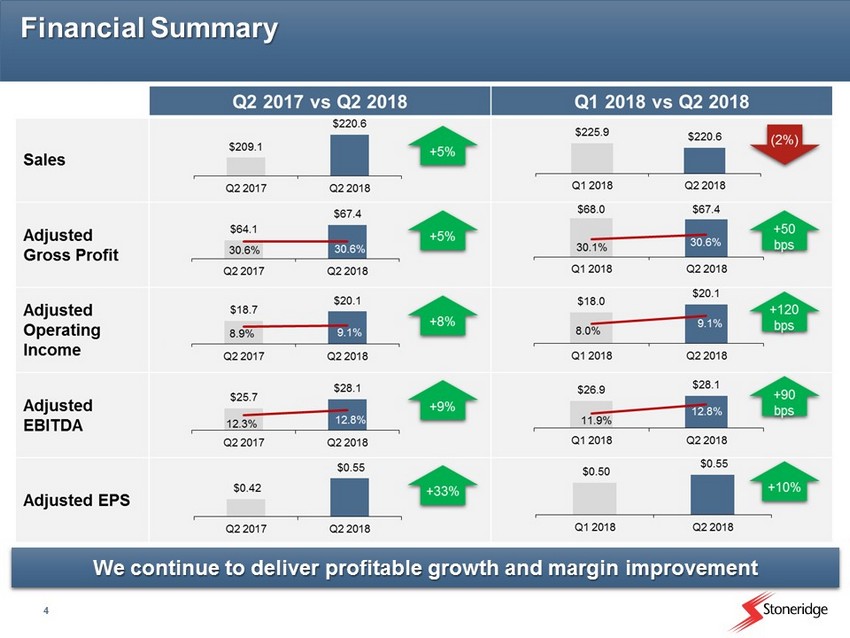
4 Financial Summary We continue to deliver profitable growth and margin improvement
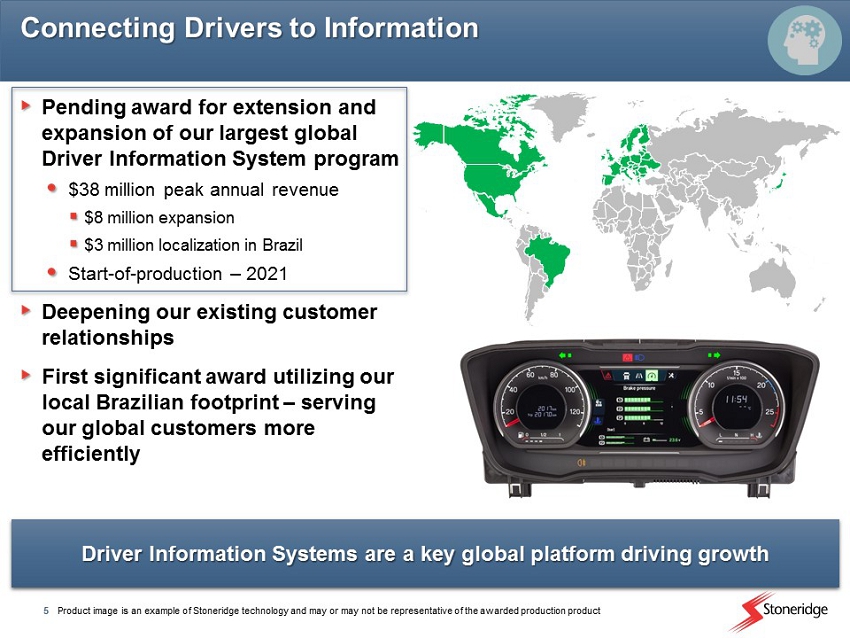
5 Connecting Drivers to Information Pending award for extension and expansion of our largest global Driver Information System program $38 million peak annual revenue $8 million expansion $3 million localization in Brazil Start - of - production – 2021 Deepening our existing customer relationships First significant award utilizing our local Brazilian footprint – serving our global customers more efficiently Driver Information Systems are a key global platform driving growth Product image is an example of Stoneridge technology and may or may not be representative of the awarded production product
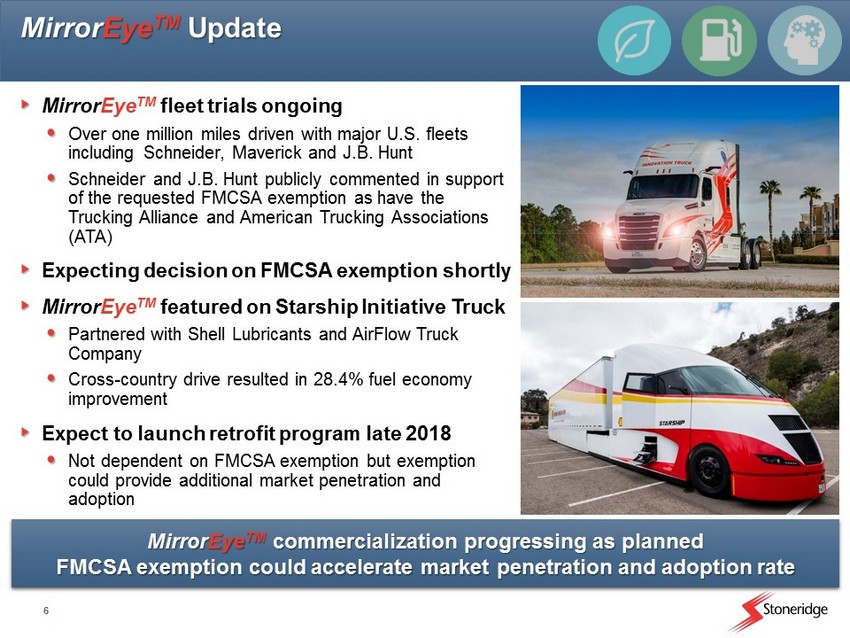
6 Mirror Eye TM Update Mirror Eye TM commercialization progressing as planned FMCSA exemption could accelerate market penetration and adoption rate Mirror Eye TM fleet trials ongoing Over one million miles driven with major U.S. fleets including Schneider, Maverick and J.B. Hunt Schneider and J.B. Hunt publicly commented in support of the requested FMCSA exemption as have the Trucking Alliance and American Trucking Associations (ATA) Expecting decision on FMCSA exemption shortly Mirror Eye TM featured on Starship Initiative Truck Partnered with Shell Lubricants and AirFlow Truck Company Cross - country drive resulted in 28.4% fuel economy improvement Expect to launch retrofit program late 2018 Not dependent on FMCSA exemption but exemption could provide additional market penetration and adoption
7 Each segment contributed to our strong 2 nd quarter Award pending for significant global Driver Information System extension and expansion $38 million peak annual revenue – 2021 Start - of - Production $8 million expansion $3 million localization in Brazil Mirror Eye TM progress remains on - track Support for FMCSA exemption from major trucking associations and leading fleets Expect to launch retrofit program late 2018 2 nd Quarter 2018 Overview Driving shareholder value through strong financial performance and a well defined long - term strategy
Financial Update
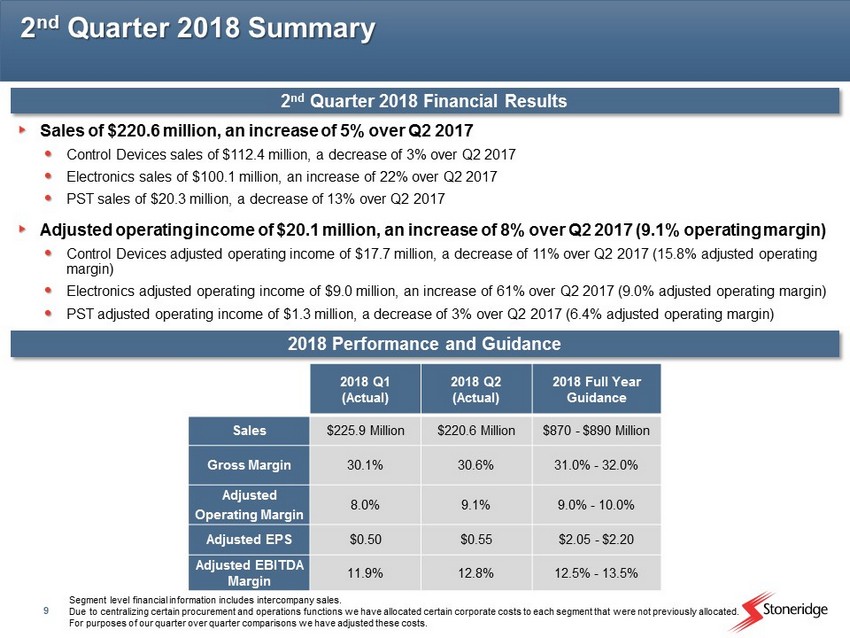
9 2 nd Quarter 2018 Summary 2 nd Quarter 2018 Financial Results 2018 Performance and Guidance Sales of $220.6 million, an increase of 5% over Q2 2017 Control Devices sales of $112.4 million, a decrease of 3% over Q2 2017 Electronics sales of $100.1 million, an increase of 22% over Q2 2017 PST sales of $20.3 million, a decrease of 13% over Q2 2017 Adjusted operating income of $20.1 million, an increase of 8% over Q2 2017 (9.1% operating margin) Control Devices adjusted operating income of $17.7 million, a decrease of 11% over Q2 2017 (15.8% adjusted operating margin) Electronics adjusted operating income of $9.0 million, an increase of 61% over Q2 2017 (9.0% adjusted operating margin) PST adjusted operating income of $1.3 million, a decrease of 3% over Q2 2017 (6.4% adjusted operating margin) Segment level financial information includes intercompany sales. Due to centralizing certain procurement and operations functions we have allocated certain corporate costs to each segment th at were not previously allocated. For purposes of our quarter over quarter comparisons we have adjusted these costs. 2018 Q1 (Actual) 2018 Q2 (Actual) 2018 Full Year Guidance Sales $225.9 Million $220.6 Million $870 - $890 Million Gross Margin 30.1% 30.6% 31.0% - 32.0% Adjusted Operating Margin 8.0% 9.1% 9.0% - 10.0% Adjusted EPS $0.50 $0.55 $2.05 - $2.20 Adjusted EBITDA Margin 11.9% 12.8% 12.5% - 13.5%
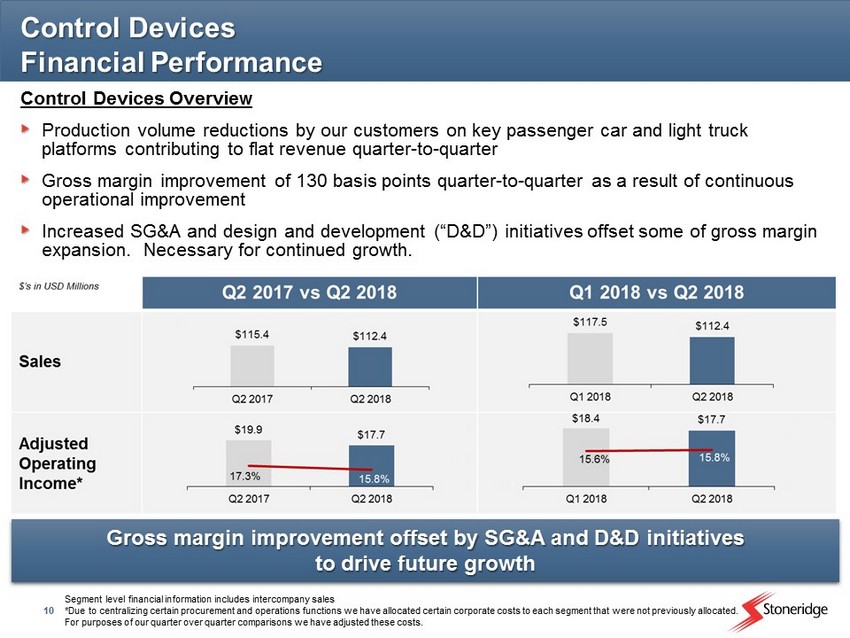
10 Control Devices Financial Performance Gross margin improvement offset by SG&A and D&D initiatives to drive future growth Control Devices Overview Production volume reductions by our customers on key passenger car and light truck platforms contributing to flat revenue quarter - to - quarter Gross margin improvement of 130 basis points quarter - to - quarter as a result of continuous operational improvement Increased SG&A and design and development (“D&D”) initiatives offset some of gross margin expansion. Necessary for continued growth. Segment level financial information includes intercompany sales *Due to centralizing certain procurement and operations functions we have allocated certain corporate costs to each segment t hat were not previously allocated. For purposes of our quarter over quarter comparisons we have adjusted these costs.
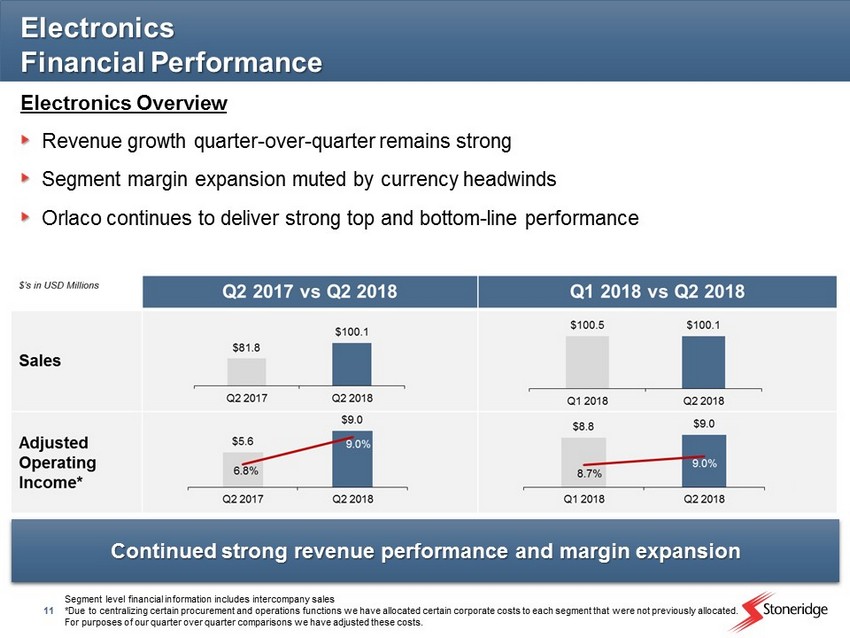
11 Electronics Financial Performance Continued strong revenue performance and margin expansion Segment level financial information includes intercompany sales *Due to centralizing certain procurement and operations functions we have allocated certain corporate costs to each segment t hat were not previously allocated. For purposes of our quarter over quarter comparisons we have adjusted these costs. Electronics Overview Revenue growth quarter - over - quarter remains strong Segment margin expansion muted by currency headwinds Orlaco continues to deliver strong top and bottom - line performance
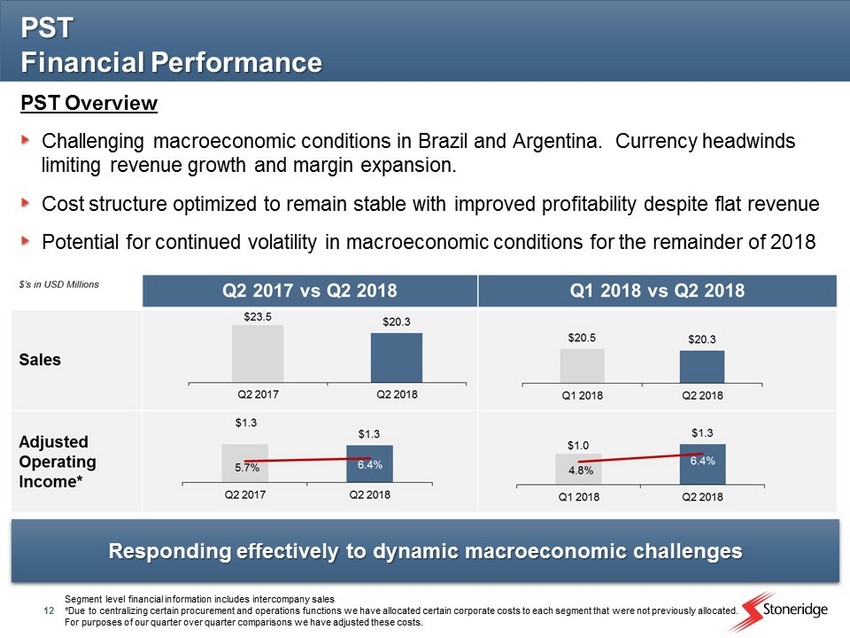
12 PST Financial Performance Responding effectively to dynamic macroeconomic challenges Segment level financial information includes intercompany sales *Due to centralizing certain procurement and operations functions we have allocated certain corporate costs to each segment t hat were not previously allocated. For purposes of our quarter over quarter comparisons we have adjusted these costs. PST Overview Challenging macroeconomic conditions in Brazil and Argentina. Currency headwinds limiting revenue growth and margin expansion. Cost structure optimized to remain stable with improved profitability despite flat revenue Potential for continued volatility in macroeconomic conditions for the remainder of 2018
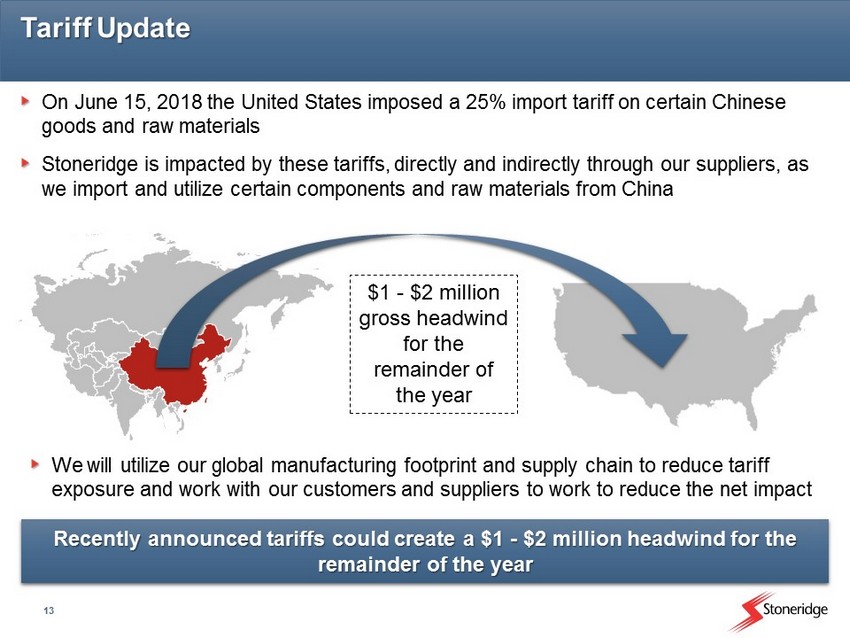
13 Tariff Update Recently announced tariffs could create a $1 - $2 million headwind for the remainder of the year $1 - $2 million gross headwind for the remainder of the year On June 15, 2018 the United States imposed a 25% import tariff on certain Chinese goods and raw materials Stoneridge is impacted by these tariffs, directly and indirectly through our suppliers, as we import and utilize certain components and raw materials from China We will utilize our global manufacturing footprint and supply chain to reduce tariff exposure and work with our customers and suppliers to work to reduce the net impact
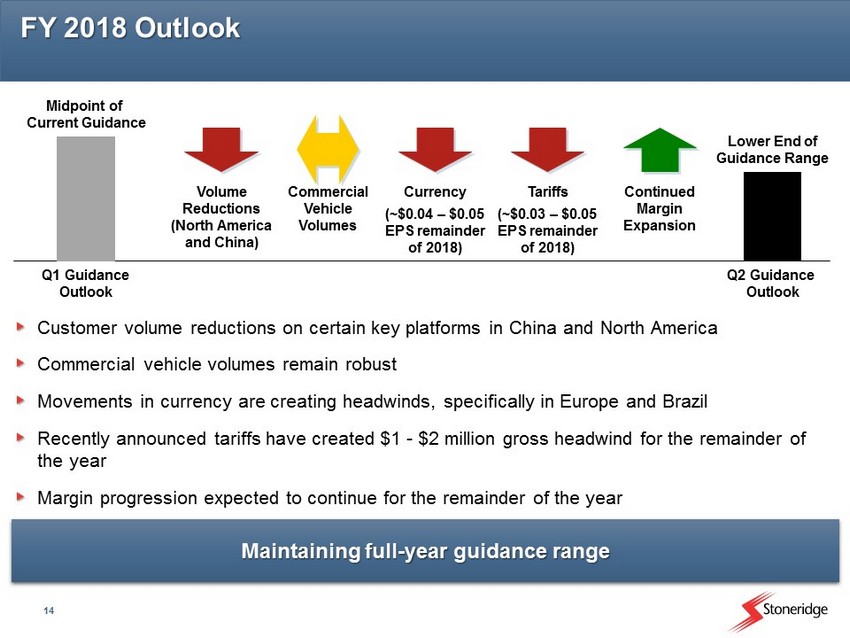
14 FY 2018 Outlook Customer volume reductions on certain key platforms in China and North America Commercial vehicle volumes remain robust Movements in currency are creating headwinds, specifically in Europe and Brazil Recently announced tariffs have created $1 - $2 million gross headwind for the remainder of the year Margin progression expected to continue for the remainder of the year Q1 Guidance Outlook Volume Reductions (North America and China) Q2 Guidance Outlook Midpoint of Current Guidance Currency (~$0.04 – $0.05 EPS remainder of 2018) Commercial Vehicle Volumes Lower End of Guidance Range Tariffs (~$0.03 – $0.05 EPS remainder of 2018) Maintaining full - year guidance range Continued Margin Expansion
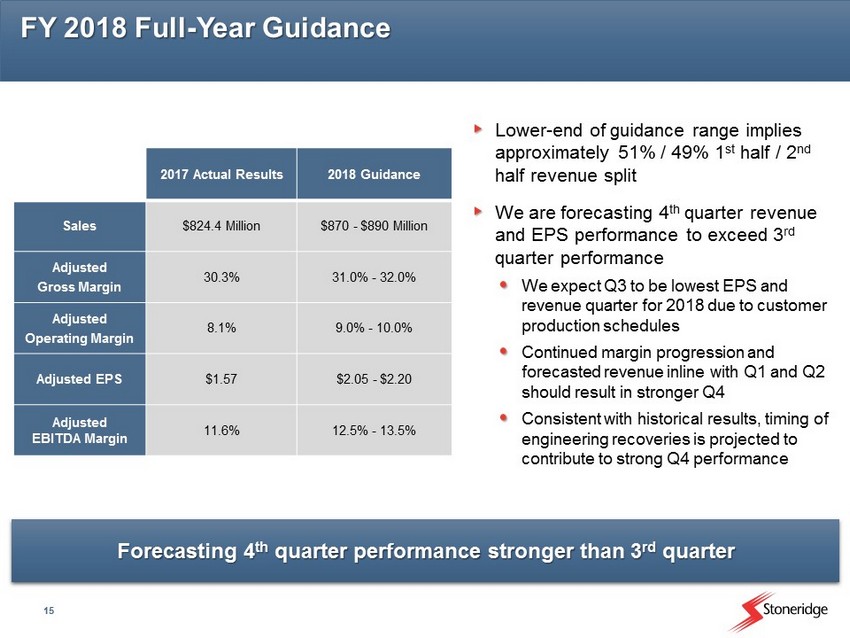
15 2017 Actual Results 2018 Guidance Sales $824.4 Million $870 - $890 Million Adjusted Gross Margin 30.3% 31.0% - 32.0% Adjusted Operating Margin 8.1% 9.0% - 10.0% Adjusted EPS $1.57 $2.05 - $2.20 Adjusted EBITDA Margin 11.6% 12.5% - 13.5% FY 2018 Full - Year Guidance Lower - end of guidance range implies approximately 51% / 49% 1 st half / 2 nd half revenue split We are forecasting 4 th quarter revenue and EPS performance to exceed 3 rd quarter performance We expect Q3 to be lowest EPS and revenue quarter for 2018 due to customer production schedules Continued m argin progression and forecasted revenue inline with Q1 and Q2 should result in stronger Q4 Consistent with historical results, timing of engineering recoveries is projected to contribute to strong Q4 performance Forecasting 4 th quarter performance stronger than 3 rd quarter
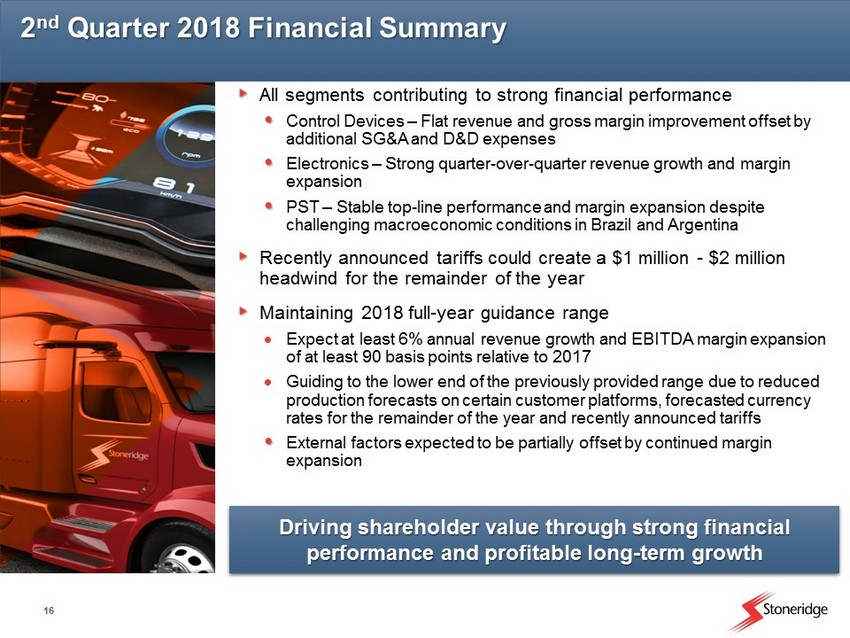
16 All segments contributing to strong financial performance Control Devices – Flat revenue and gross margin improvement offset by additional SG&A and D&D expenses Electronics – Strong quarter - over - quarter revenue growth and margin expansion PST – Stable top - line performance and margin expansion despite challenging macroeconomic conditions in Brazil and Argentina Recently announced tariffs could create a $1 million - $2 million headwind for the remainder of the year Maintaining 2018 full - year guidance range Expect at least 6% annual revenue growth and EBITDA margin expansion of at least 90 basis points relative to 2017 Guiding to the lower end of the previously provided range due to reduced production forecasts on certain customer platforms, forecasted currency rates for the remainder of the year and recently announced tariffs External factors expected to be partially offset by continued margin expansion 2 nd Quarter 2018 Financial Summary Driving shareholder value through strong financial performance and profitable long - term growth
Thank You
18 Appendix
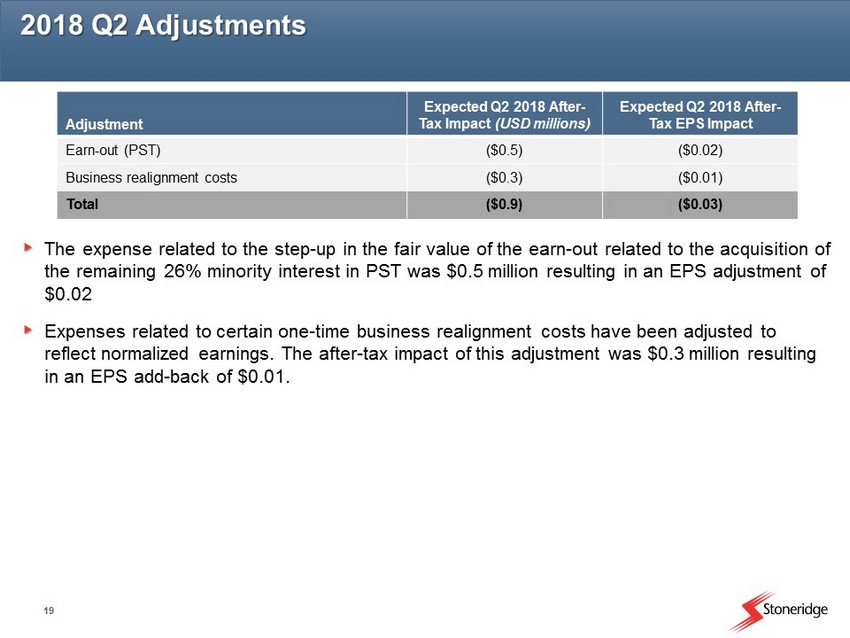
19 2018 Q2 Adjustments The expense related to the step - up in the fair value of the earn - out related to the acquisition of the remaining 26% minority interest in PST was $0.5 million resulting in an EPS adjustment of $0.02 Expenses related to certain one - time business realignment costs have been adjusted to reflect normalized earnings. The after - tax impact of this adjustment was $0.3 million resulting in an EPS add - back of $0.01. Adjustment Expected Q2 2018 After - Tax Impact (USD millions) Expected Q2 2018 After - Tax EPS Impact Earn - out (PST) ($0.5) ($0.02) Business realignment costs ($0.3) ($0.01) Total ($0.9) ($0.03)
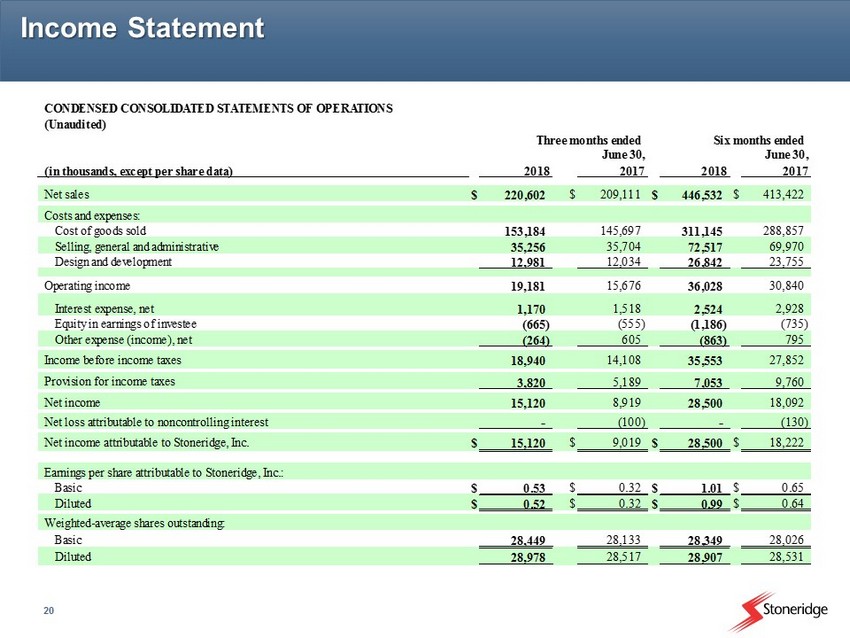
20 Income Statement (Unaudited) (in thousands, except per share data) 2018 2017 2018 2017 Net sales $ 220,602 $ 209,111 $ 446,532 $ 413,422 Costs and expenses: Cost of goods sold 153,184 145,697 311,145 288,857 Selling, general and administrative 35,256 35,704 72,517 69,970 Design and development 12,981 12,034 26,842 23,755 Operating income 19,181 15,676 36,028 30,840 Interest expense, net 1,170 1,518 2,524 2,928 Equity in earnings of investee (665) (555) (1,186) (735) Other expense (income), net (264) 605 (863) 795 18,940 14,108 35,553 27,852 3,820 5,189 7,053 9,760 Net income 15,120 8,919 28,500 18,092 Net loss attributable to noncontrolling interest - (100) - (130) Net income attributable to Stoneridge, Inc. $ 15,120 $ 9,019 $ 28,500 $ 18,222 Earnings per share attributable to Stoneridge, Inc.: Basic $ 0.53 $ 0.32 $ 1.01 $ 0.65 Diluted $ 0.52 $ 0.32 $ 0.99 $ 0.64 Weighted-average shares outstanding: Basic 28,449 28,133 28,349 28,026 Diluted 28,978 28,517 28,907 28,531 Income before income taxes Provision for income taxes Three months ended CONDENSED CONSOLIDATED STATEMENTS OF OPERATIONS June 30, Six months ended June 30,
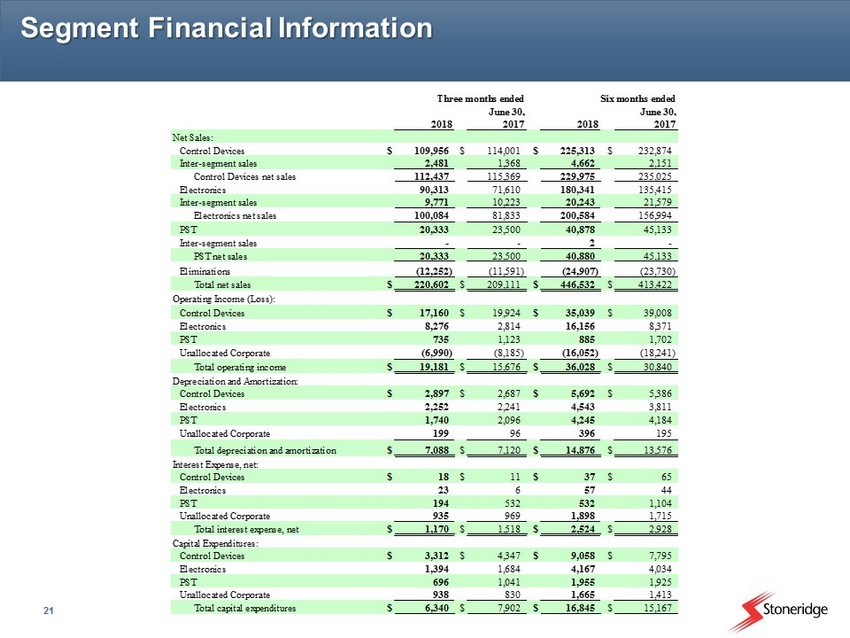
21 Segment Financial Information 2018 2017 2018 2017 Net Sales: Control Devices $ 109,956 $ 114,001 $ 225,313 $ 232,874 Inter-segment sales 2,481 1,368 4,662 2,151 Control Devices net sales 112,437 115,369 229,975 235,025 Electronics 90,313 71,610 180,341 135,415 Inter-segment sales 9,771 10,223 20,243 21,579 Electronics net sales 100,084 81,833 200,584 156,994 PST 20,333 23,500 40,878 45,133 Inter-segment sales - - 2 - PST net sales 20,333 23,500 40,880 45,133 Eliminations (12,252) (11,591) (24,907) (23,730) Total net sales $ 220,602 $ 209,111 $ 446,532 $ 413,422 Operating Income (Loss): Control Devices $ 17,160 $ 19,924 $ 35,039 $ 39,008 Electronics 8,276 2,814 16,156 8,371 PST 735 1,123 885 1,702 Unallocated Corporate (6,990) (8,185) (16,052) (18,241) Total operating income $ 19,181 $ 15,676 $ 36,028 $ 30,840 Depreciation and Amortization: Control Devices $ 2,897 $ 2,687 $ 5,692 $ 5,386 Electronics 2,252 2,241 4,543 3,811 PST 1,740 2,096 4,245 4,184 Unallocated Corporate 199 96 396 195 Total depreciation and amortization $ 7,088 $ 7,120 $ 14,876 $ 13,576 Interest Expense, net: Control Devices $ 18 $ 11 $ 37 $ 65 Electronics 23 6 57 44 PST 194 532 532 1,104 Unallocated Corporate 935 969 1,898 1,715 Total interest expense, net $ 1,170 $ 1,518 $ 2,524 $ 2,928 Capital Expenditures: Control Devices $ 3,312 $ 4,347 $ 9,058 $ 7,795 Electronics 1,394 1,684 4,167 4,034 PST 696 1,041 1,955 1,925 Unallocated Corporate 938 830 1,665 1,413 Total capital expenditures $ 6,340 $ 7,902 $ 16,845 $ 15,167 June 30, June 30, Three months ended Six months ended
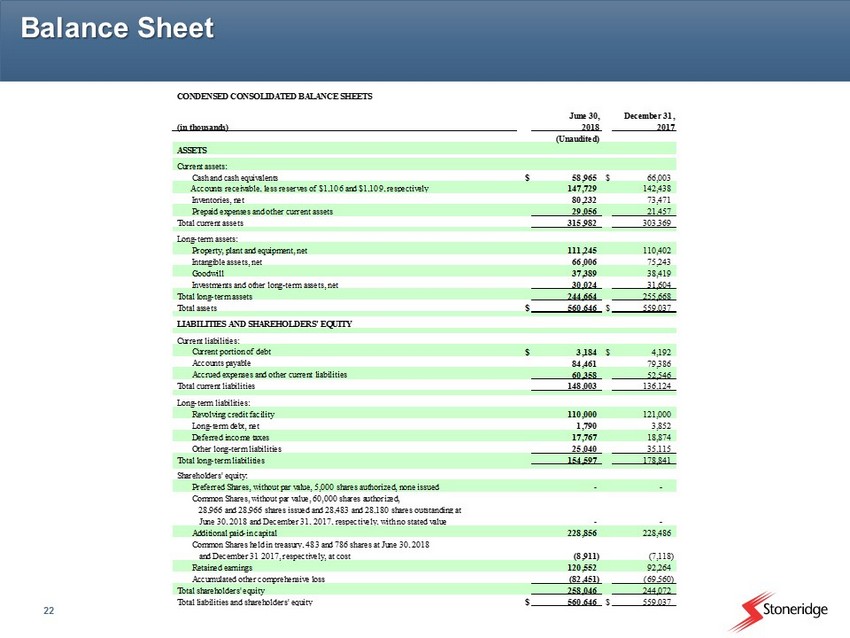
22 Balance Sheet CONDENSED CONSOLIDATED BALANCE SHEETS June 30, December 31, (in thousands) 2018 2017 (Unaudited) ASSETS Current assets: Cash and cash equivalents $ 58,965 $ 66,003 147,729 142,438 Inventories, net 80,232 73,471 Prepaid expenses and other current assets 29,056 21,457 Total current assets 315,982 303,369 Long-term assets: Property, plant and equipment, net 111,245 110,402 Intangible assets, net 66,006 75,243 Goodwill 37,389 38,419 Investments and other long-term assets, net 30,024 31,604 Total long-term assets 244,664 255,668 Total assets $ 560,646 $ 559,037 LIABILITIES AND SHAREHOLDERS' EQUITY Current liabilities: Current portion of debt $ 3,184 $ 4,192 Accounts payable 84,461 79,386 Accrued expenses and other current liabilities 60,358 52,546 Total current liabilities 148,003 136,124 Long-term liabilities: Revolving credit facility 110,000 121,000 Long-term debt, net 1,790 3,852 Deferred income taxes 17,767 18,874 Other long-term liabilities 25,040 35,115 Total long-term liabilities 154,597 178,841 Shareholders' equity: Preferred Shares, without par value, 5,000 shares authorized, none issued - - Common Shares, without par value, 60,000 shares authorized, - - Additional paid-in capital 228,856 228,486 and December 31 2017, respectively, at cost (8,911) (7,118) Retained earnings 120,552 92,264 Accumulated other comprehensive loss (82,451) (69,560) Total shareholders' equity 258,046 244,072 Total liabilities and shareholders' equity $ 560,646 $ 559,037 June 30, 2018 and December 31, 2017, respectively, with no stated value 28,966 and 28,966 shares issued and 28,483 and 28,180 shares outstanding at Common Shares held in treasury, 483 and 786 shares at June 30, 2018 Accounts receivable, less reserves of $1,106 and $1,109, respectively
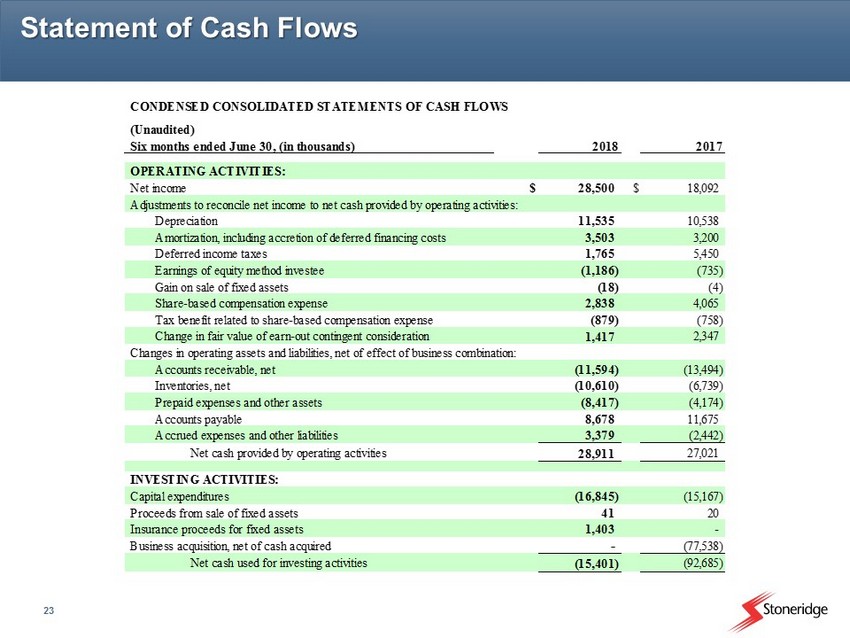
23 Statement of Cash Flows (Unaudited) Six months ended June 30, (in thousands) 2018 2017 OPERATING ACTIVITIES: Net income $ 28,500 $ 18,092 Adjustments to reconcile net income to net cash provided by operating activities: Depreciation 11,535 10,538 Amortization, including accretion of deferred financing costs 3,503 3,200 Deferred income taxes 1,765 5,450 Earnings of equity method investee (1,186) (735) Gain on sale of fixed assets (18) (4) Share-based compensation expense 2,838 4,065 Tax benefit related to share-based compensation expense (879) (758) Change in fair value of earn-out contingent consideration 1,417 2,347 Accounts receivable, net (11,594) (13,494) Inventories, net (10,610) (6,739) Prepaid expenses and other assets (8,417) (4,174) Accounts payable 8,678 11,675 Accrued expenses and other liabilities 3,379 (2,442) Net cash provided by operating activities 28,911 27,021 INVESTING ACTIVITIES: Capital expenditures (16,845) (15,167) Proceeds from sale of fixed assets 41 20 Insurance proceeds for fixed assets 1,403 - Business acquisition, net of cash acquired - (77,538) Net cash used for investing activities (15,401) (92,685) Changes in operating assets and liabilities, net of effect of business combination: CONDENSED CONSOLIDATED STATEMENTS OF CASH FLOWS
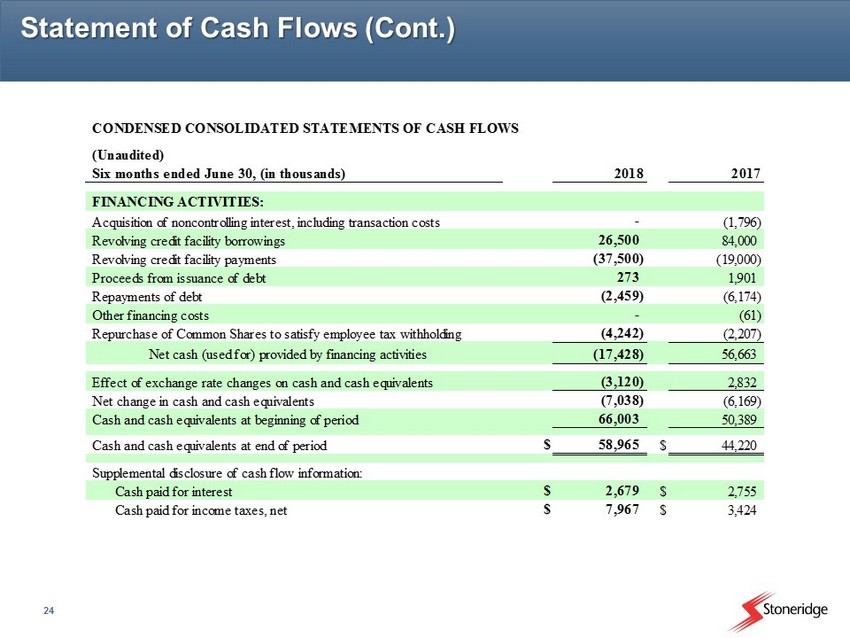
24 Statement of Cash Flows (Cont.) (Unaudited) Six months ended June 30, (in thousands) 2018 2017 FINANCING ACTIVITIES: Acquisition of noncontrolling interest, including transaction costs - (1,796) Revolving credit facility borrowings 26,500 84,000 Revolving credit facility payments (37,500) (19,000) Proceeds from issuance of debt 273 1,901 Repayments of debt (2,459) (6,174) Other financing costs - (61) Repurchase of Common Shares to satisfy employee tax withholding (4,242) (2,207) Net cash (used for) provided by financing activities (17,428) 56,663 Effect of exchange rate changes on cash and cash equivalents (3,120) 2,832 Net change in cash and cash equivalents (7,038) (6,169) Cash and cash equivalents at beginning of period 66,003 50,389 Cash and cash equivalents at end of period $ 58,965 $ 44,220 Supplemental disclosure of cash flow information: Cash paid for interest $ 2,679 $ 2,755 Cash paid for income taxes, net $ 7,967 $ 3,424 CONDENSED CONSOLIDATED STATEMENTS OF CASH FLOWS
25 Reconciliations to US GAAP
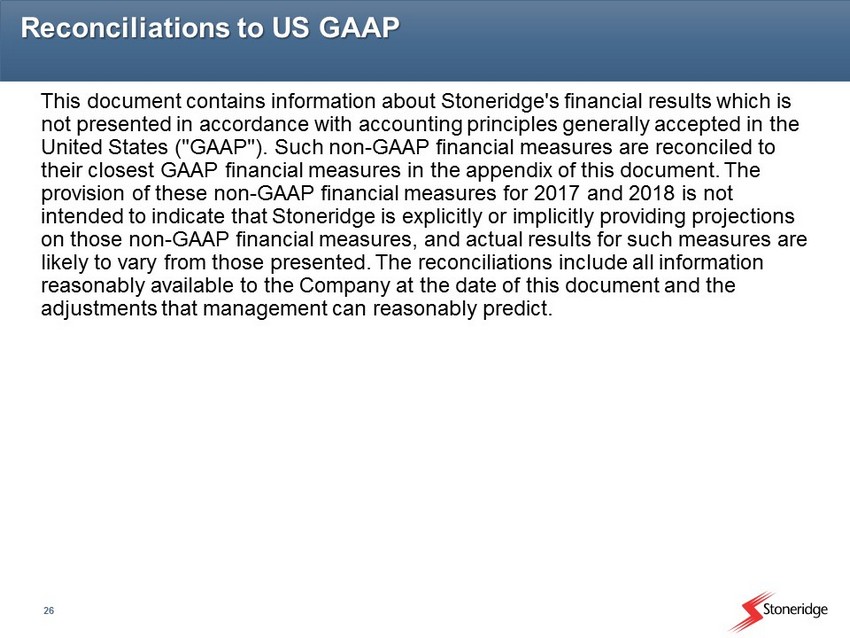
26 Reconciliations to US GAAP This document contains information about Stoneridge's financial results which is not presented in accordance with accounting principles generally accepted in the United States ("GAAP"). Such non - GAAP financial measures are reconciled to their closest GAAP financial measures in the appendix of this document. The provision of these non - GAAP financial measures for 2017 and 2018 is not intended to indicate that Stoneridge is explicitly or implicitly providing projections on those non - GAAP financial measures, and actual results for such measures are likely to vary from those presented. The reconciliations include all information reasonably available to the Company at the date of this document and the adjustments that management can reasonably predict.
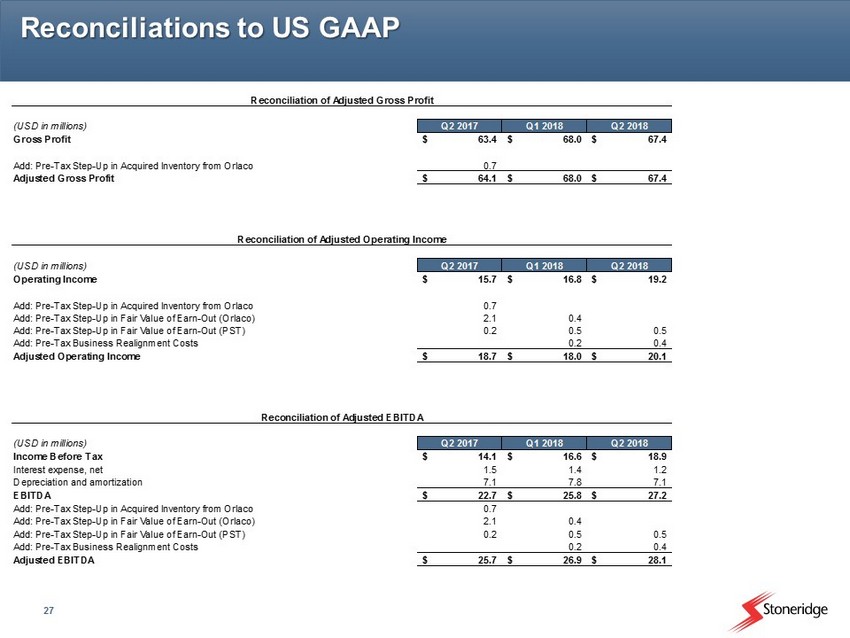
27 Reconciliations to US GAAP (USD in millions) Q2 2017 Q1 2018 Q2 2018 Income Before Tax 14.1$ 16.6$ 18.9$ Interest expense, net 1.5 1.4 1.2 Depreciation and amortization 7.1 7.8 7.1 EBITDA 22.7$ 25.8$ 27.2$ Add: Pre-Tax Step-Up in Acquired Inventory from Orlaco 0.7 Add: Pre-Tax Step-Up in Fair Value of Earn-Out (Orlaco) 2.1 0.4 Add: Pre-Tax Step-Up in Fair Value of Earn-Out (PST) 0.2 0.5 0.5 Add: Pre-Tax Business Realignment Costs 0.2 0.4 Adjusted EBITDA 25.7$ 26.9$ 28.1$ Reconciliation of Adjusted EBITDA (USD in millions) Q2 2017 Q1 2018 Q2 2018 Operating Income 15.7$ 16.8$ 19.2$ Add: Pre-Tax Step-Up in Acquired Inventory from Orlaco 0.7 Add: Pre-Tax Step-Up in Fair Value of Earn-Out (Orlaco) 2.1 0.4 Add: Pre-Tax Step-Up in Fair Value of Earn-Out (PST) 0.2 0.5 0.5 Add: Pre-Tax Business Realignment Costs 0.2 0.4 Adjusted Operating Income 18.7$ 18.0$ 20.1$ Reconciliation of Adjusted Operating Income (USD in millions) Q2 2017 Q1 2018 Q2 2018 Gross Profit 63.4$ 68.0$ 67.4$ Add: Pre-Tax Step-Up in Acquired Inventory from Orlaco 0.7 Adjusted Gross Profit 64.1$ 68.0$ 67.4$ Reconciliation of Adjusted Gross Profit
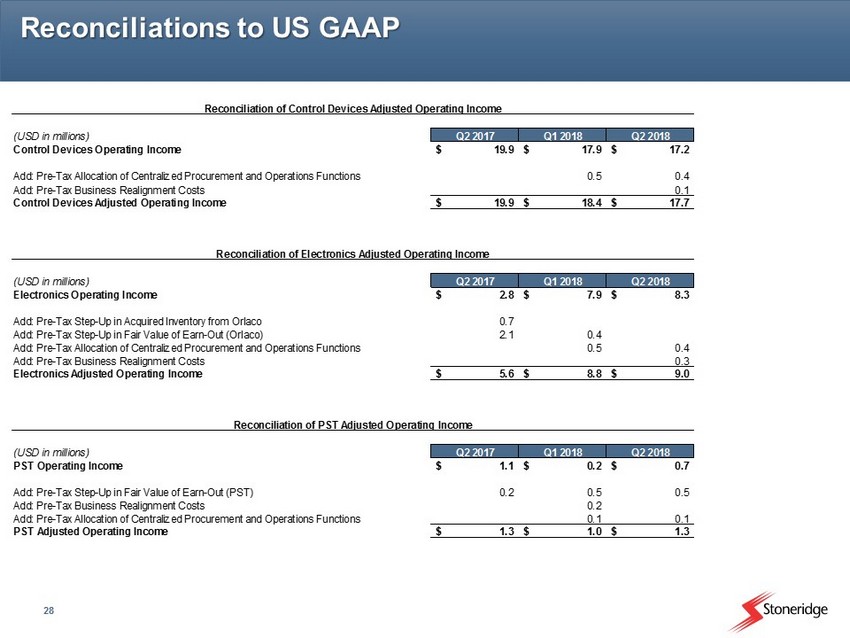
28 Reconciliations to US GAAP (USD in millions) Q2 2017 Q1 2018 Q2 2018 Electronics Operating Income 2.8$ 7.9$ 8.3$ Add: Pre-Tax Step-Up in Acquired Inventory from Orlaco 0.7 Add: Pre-Tax Step-Up in Fair Value of Earn-Out (Orlaco) 2.1 0.4 Add: Pre-Tax Allocation of Centralized Procurement and Operations Functions 0.5 0.4 Add: Pre-Tax Business Realignment Costs 0.3 Electronics Adjusted Operating Income 5.6$ 8.8$ 9.0$ Reconciliation of Electronics Adjusted Operating Income (USD in millions) Q2 2017 Q1 2018 Q2 2018 PST Operating Income 1.1$ 0.2$ 0.7$ Add: Pre-Tax Step-Up in Fair Value of Earn-Out (PST) 0.2 0.5 0.5 Add: Pre-Tax Business Realignment Costs 0.2 Add: Pre-Tax Allocation of Centralized Procurement and Operations Functions 0.1 0.1 PST Adjusted Operating Income 1.3$ 1.0$ 1.3$ Reconciliation of PST Adjusted Operating Income (USD in millions) Q2 2017 Q1 2018 Q2 2018 Control Devices Operating Income 19.9$ 17.9$ 17.2$ Add: Pre-Tax Allocation of Centralized Procurement and Operations Functions 0.5 0.4 Add: Pre-Tax Business Realignment Costs 0.1 Control Devices Adjusted Operating Income 19.9$ 18.4$ 17.7$ Reconciliation of Control Devices Adjusted Operating Income
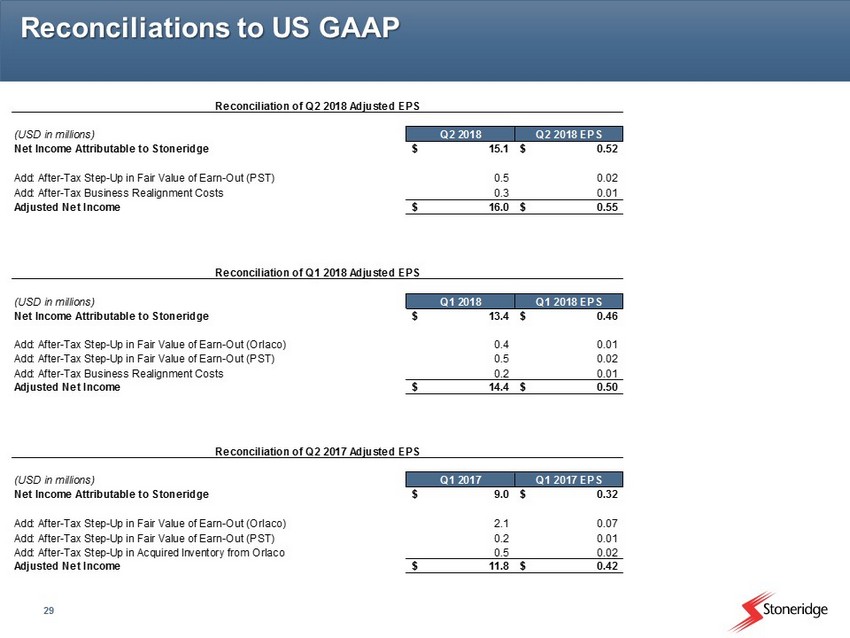
29 Reconciliations to US GAAP (USD in millions) Q1 2018 Q1 2018 EPS Net Income Attributable to Stoneridge 13.4$ 0.46$ Add: After-Tax Step-Up in Fair Value of Earn-Out (Orlaco) 0.4 0.01 Add: After-Tax Step-Up in Fair Value of Earn-Out (PST) 0.5 0.02 Add: After-Tax Business Realignment Costs 0.2 0.01 Adjusted Net Income 14.4$ 0.50$ Reconciliation of Q1 2018 Adjusted EPS (USD in millions) Q2 2018 Q2 2018 EPS Net Income Attributable to Stoneridge 15.1$ 0.52$ Add: After-Tax Step-Up in Fair Value of Earn-Out (PST) 0.5 0.02 Add: After-Tax Business Realignment Costs 0.3 0.01 Adjusted Net Income 16.0$ 0.55$ Reconciliation of Q2 2018 Adjusted EPS (USD in millions) Q1 2017 Q1 2017 EPS Net Income Attributable to Stoneridge 9.0$ 0.32$ Add: After-Tax Step-Up in Fair Value of Earn-Out (Orlaco) 2.1 0.07 Add: After-Tax Step-Up in Fair Value of Earn-Out (PST) 0.2 0.01 Add: After-Tax Step-Up in Acquired Inventory from Orlaco 0.5 0.02 Adjusted Net Income 11.8$ 0.42$ Reconciliation of Q2 2017 Adjusted EPS
