Attached files
| file | filename |
|---|---|
| 8-K - FORM 8-K - SPRINT Corp | sprintq1fy188-kearningsrel.htm |
| EX-99.2 - PRINT VERSION OF QUARTERLY INVESTOR UPDATE - SPRINT Corp | fiscal1q18sprintquarterlyinv.pdf |
| EX-99.2 - QUARTERLY INVESTOR UPDATE - SPRINT Corp | fiscal1q18sprintquarterl.htm |
News Release |  | |
SPRINT REPORTS INFLECTION IN WIRELESS SERVICE REVENUE WITH FISCAL YEAR 2018 FIRST QUARTER RESULTS
• | Wireless service revenue grew sequentially for the first time in more than four years, excluding the impact of the new revenue recognition standard |
◦ | Postpaid ARPU grew sequentially for the first time in nearly five years |
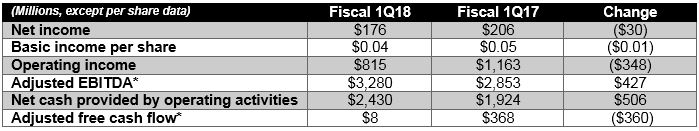
• | Net income of $176 million, operating income of $815 million, and adjusted EBITDA* of $3.3 billion |
◦ | Third consecutive quarter of net income |
◦ | 10th consecutive quarter of operating income |
◦ | Highest adjusted EBITDA* in more than 11 years |
• | Net cash provided by operating activities of $2.4 billion and adjusted free cash flow* of $8 million |
◦ | Positive adjusted free cash flow* in five of the last six quarters |
• | Retail phone net additions for the sixth consecutive quarter |
◦ | Postpaid phone net additions of 87,000 were the 12th consecutive quarter of postpaid phone net additions |
◦ | Seven consecutive quarters of postpaid phone net additions in the business market |
◦ | Prepaid net additions for the sixth consecutive quarter, including the lowest prepaid churn in more than three years |
OVERLAND PARK, Kan. - Aug 1, 2018 - Sprint Corporation (NYSE: S) today reported an inflection in wireless service revenue and the sixth consecutive quarter of retail phone net additions as part of results for the first quarter of fiscal year 2018.
“Sprint continued to deliver solid results this quarter while embarking on our transformative merger with T-Mobile,” said Sprint CEO Michel Combes, “By balancing growth and profitability, we were able to grow wireless service revenue sequentially, continue to add retail phone customers, generate net income for the third consecutive quarter, and improve the network.”
Wireless Service Revenue Returns to Sequential Growth
Sprint reported sequential growth in wireless service revenue for the first time in more than four years, when excluding the impact of the new revenue recognition standard, as postpaid and prepaid ARPU grew sequentially. The company continues to expect year-over-year growth in wireless service revenue to occur by the end of fiscal year 2018, excluding the impact of the new revenue recognition standard.
Several other revenue metrics showed improvement in the quarter, excluding the impact of the new revenue recognition standard.
• | Postpaid ARPU grew sequentially for the first time in nearly five years. |
• | Postpaid service revenue grew sequentially for first time in more than four years. |
• | Prepaid service revenue grew both sequentially and year-over-year. |
Continued Focus on Profitability
Sprint reported its third consecutive quarter of net income, its 10th consecutive quarter of operating income, and its highest adjusted EBITDA* in more than 11 years, all excluding the positive impact of the new revenue recognition standard. The new revenue recognition standard had a positive impact of $152 million on reported net income and $192 million on reported operating income and adjusted EBITDA* in the quarter.
News Release | | |
Operating income of $815 million would have been relatively flat year-over-year when adjusting for the new revenue recognition standard and $135 million of merger and other non-recurring costs this quarter and a net benefit of $364 million from non-recurring items in the year ago period. Similarly, net income of $176 million would also have been relatively flat year-over-year when adjusting for the aforementioned items on a tax-adjusted basis.
Sprint Continues to Add Retail Phone Customers and Launches New Unlimited Plans
Sprint’s focus on both its postpaid and prepaid businesses resulted in the sixth consecutive quarter of retail phone net additions.
• | Postpaid phone net additions of 87,000 marked the 12th consecutive quarter of net additions, including net additions in the business market for the seventh consecutive quarter. |
• | Prepaid net additions of 3,000 were the sixth consecutive quarter of net additions, as continued strength in Boost Mobile was partially offset by losses in other brands. Prepaid churn was the lowest in more than three years and Boost Mobile gross additions grew year-over-year for the fourth consecutive quarter. |
Sprint recently introduced several new plans that offer more choice and features for an incredible value. The new Unlimited Plus, Unlimited Basic, Unlimited Military, and Unlimited 55+ plans are available to new and existing customers and are just the beginning of “Unlimited for All,” the company’s initiative to tailor plans so customers can get the best choice for them.
Driving Growth in Digital
Sprint also plans to offer the best digital customer experience, including leveraging artificial intelligence to improve customer care interactions, utilizing deep dive analytics to identify customer issues, and boosting the mix of sales in digital channels. Postpaid phone gross additions in digital channels grew more than 50 percent year-over-year in the quarter and the mix of gross additions in digital channels was also up year-over-year.
Network Built for Unlimited Keeps Getting Better
With more than 200 MHz of sub-6 GHz spectrum, Sprint has the Network Built for Unlimited and made continued progress on executing its Next-Gen Network plan in the quarter.
• | Completed thousands of tri-band upgrades and now has 2.5 GHz spectrum deployed on nearly two-thirds of its macro sites. |
• | Added thousands of new outdoor small cells and currently has more than 15,000 deployed including both mini-macros and strand mounts. |
• | Distributed more than 65,000 Sprint Magic Boxes, bringing the total to more than 260,000 nationwide. |
These deployments are contributing to Sprint providing customers with a better network experience. In fact, Sprint is the most improved network according to Ookla as shown in Speedtest Intelligence data1, and PCMag’s 2018 Fastest Mobile Networks. In both, the company’s year-over-year increase in national average download speeds outpaced the competitors, including an 87 percent lift reported in PCMag’s annual tests.
Sprint’s deployment of Massive MIMO radios, a key technology for 5G, is underway and the company continues to expect to launch the first mobile 5G network in the U.S. in the first half of 2019.
_____________________________
1 http://www.speedtest.net/reports/united-states/
News Release | | |
Fiscal Year 2018 Outlook
• | The company is increasing adjusted EBITDA* expectations on a reported basis to a range of $12.0 billion to $12.5 billion, as impacts of the new revenue recognition standard were higher than preliminary estimates. The previous expectation was $11.6 billion to $12.1 billion. |
• | Excluding the impact of the new revenue recognition standard, the company continues to expect adjusted EBITDA* to be $11.3 billion to $11.8 billion. |
• | The company continues to expect cash capital expenditures excluding leased devices to be $5 billion to $6 billion. |
Conference Call and Webcast
• | Date/Time: 8:30 a.m. (ET) Wednesday, August 1, 2018 |
• | Call-in Information |
◦ | U.S./Canada: 866-360-1063 (ID: 9665377) |
◦ | International: 443-961-0242 (ID: 9665377) |
• | Webcast available at www.sprint.com/investors |
• | Additional information about results is available on our Investor Relations website |
Contact Information
• | Media contact: Dave Tovar, David.Tovar@sprint.com |
• | Investor contact: Jud Henry, Investor.Relations@sprint.com |
News Release | | |
Wireless Operating Statistics (Unaudited)
Quarter To Date | |||||||||
6/30/18 | 3/31/18 | 6/30/17 | |||||||
Net additions (losses) (in thousands) | |||||||||
Postpaid (a) | 123 | 39 | (39 | ) | |||||
Postpaid phone (a) | 87 | 55 | 88 | ||||||
Prepaid (b) | 3 | 170 | 35 | ||||||
Wholesale and affiliate (b) | (69 | ) | (165 | ) | 65 | ||||
Total wireless net additions | 57 | 44 | 61 | ||||||
End of period connections (in thousands) | |||||||||
Postpaid (a) (c) (d) | 32,187 | 32,119 | 31,518 | ||||||
Postpaid phone (a) (c) | 26,847 | 26,813 | 26,153 | ||||||
Prepaid (a) (b) (c) | 9,033 | 8,989 | 8,719 | ||||||
Wholesale and affiliate (b) (c) (e) | 13,347 | 13,517 | 13,461 | ||||||
Total end of period connections | 54,567 | 54,625 | 53,698 | ||||||
Churn | |||||||||
Postpaid | 1.63 | % | 1.78 | % | 1.65 | % | |||
Postpaid phone | 1.55 | % | 1.68 | % | 1.50 | % | |||
Prepaid | 4.17 | % | 4.30 | % | 4.57 | % | |||
Supplemental data - connected devices | |||||||||
End of period connections (in thousands) | |||||||||
Retail postpaid | 2,429 | 2,335 | 2,091 | ||||||
Wholesale and affiliate | 10,963 | 11,162 | 11,100 | ||||||
Total | 13,392 | 13,497 | 13,191 | ||||||
ARPU (f) | |||||||||
Postpaid | $ | 43.55 | $ | 44.40 | $ | 47.30 | |||
Postpaid phone | $ | 49.57 | $ | 50.44 | $ | 53.92 | |||
Prepaid | $ | 36.27 | $ | 37.15 | $ | 38.24 | |||
NON-GAAP RECONCILIATION - ABPA* AND ABPU* (Unaudited)
(Millions, except accounts, connections, ABPA*, and ABPU*)
Quarter To Date | |||||||||
6/30/18 | 3/31/18 | 6/30/17 | |||||||
ABPA* | |||||||||
Postpaid service revenue | $ | 4,188 | $ | 4,270 | $ | 4,466 | |||
Add: Installment plan and non-operating lease billings | 352 | 368 | 368 | ||||||
Add: Equipment rentals | 1,212 | 1,136 | 899 | ||||||
Total for postpaid connections | $ | 5,752 | $ | 5,774 | $ | 5,733 | |||
Average postpaid accounts (in thousands) | 11,176 | 11,259 | 11,312 | ||||||
Postpaid ABPA* (g) | $ | 171.57 | $ | 171.38 | $ | 168.95 | |||
Quarter To Date | |||||||||
6/30/18 | 3/31/18 | 6/30/17 | |||||||
Postpaid phone ABPU* | |||||||||
Postpaid phone service revenue | $ | 3,977 | $ | 4,048 | $ | 4,214 | |||
Add: Installment plan and non-operating lease billings | 307 | 324 | 332 | ||||||
Add: Equipment rentals | 1,204 | 1,126 | 887 | ||||||
Total for postpaid phone connections | $ | 5,488 | $ | 5,498 | $ | 5,433 | |||
Postpaid average phone connections (in thousands) | 26,745 | 26,754 | 26,052 | ||||||
Postpaid phone ABPU* (h) | $ | 68.41 | $ | 68.51 | $ | 69.51 | |||
(a) During the three-month period ended March 31, 2018, a non-Sprint branded postpaid offering was introduced allowing prepaid customers to purchase a device under our installment billing program. As a result of the extension of credit, approximately 167,000 prepaid subscribers were migrated from the prepaid subscriber base into the postpaid subscriber base. During the three-month period ended June 30, 2018, we ceased selling devices in our installment billing program under one of our brands and as a result, 45,000 subscribers were migrated back to prepaid.
(b) Sprint is no longer reporting Lifeline subscribers due to regulatory changes resulting in tighter program restrictions. We have excluded them from our customer base for all periods presented, including our Assurance Wireless prepaid brand and subscribers through our wholesale Lifeline MVNOs.
(c) As a result of our affiliate agreement with Shentel, certain subscribers have been transferred from postpaid and prepaid to affiliates. During the three-month period ended June 30, 2018, 10,000 and 4,000 subscribers were transferred from postpaid and prepaid, respectively, to affiliates. During the three-month period ended March 31, 2018, 29,000 and 11,000 subscribers were transferred from postpaid and prepaid, respectively, to affiliates. During the three-month period ended June 30, 2017, 17,000 and 4,000 subscribers were transferred from postpaid and prepaid, respectively, to affiliates.
(d) During the three-month period ended June 30, 2017, 2,000 Wi-Fi connections were adjusted from the postpaid subscriber base.
(e) On April 1, 2018, approximately 115,000 wholesale subscribers were removed from the subscriber base with no impact to revenue.
(f) ARPU is calculated by dividing service revenue by the sum of the monthly average number of connections in the applicable service category. Changes in average monthly service revenue reflect connections for either the postpaid or prepaid service category who change rate plans, the level of voice and data usage, the amount of service credits which are offered to connections, plus the net effect of average monthly revenue generated by new connections and deactivating connections. Postpaid phone ARPU represents revenues related to our postpaid phone connections.
(g) Postpaid ABPA* is calculated by dividing postpaid service revenue earned from postpaid customers plus billings from installment plans and non-operating leases, as well as equipment rentals, by the sum of the monthly average number of postpaid accounts during the period. Installment plan billings represent the substantial majority of the total billings in the table above for all periods presented.
(h) Postpaid phone ABPU* is calculated by dividing service revenue earned from postpaid phone customers plus billings from installment plans and non-operating leases, as well as equipment rentals, by the sum of the monthly average number of postpaid phone connections during the period. Installment plan billings represent the substantial majority of the total billings in the table above for all periods presented.
News Release | | |
Wireless Device Financing Summary (Unaudited)
(Millions, except sales, connections, and leased devices in property, plant and equipment)
Quarter To Date | |||||||||
6/30/18 | 3/31/18 | 6/30/17 | |||||||
Postpaid activations (in thousands) | 3,473 | 3,737 | 3,668 | ||||||
Postpaid activations financed | 83 | % | 84 | % | 85 | % | |||
Postpaid activations - operating leases | 70 | % | 70 | % | 55 | % | |||
Installment plans | |||||||||
Installment sales financed | $ | 213 | $ | 214 | $ | 553 | |||
Installment billings | $ | 325 | $ | 342 | $ | 368 | |||
Installment receivables, net | $ | 983 | $ | 1,149 | $ | 1,792 | |||
Equipment rentals and depreciation - equipment rentals | |||||||||
Equipment rentals | $ | 1,212 | $ | 1,136 | $ | 899 | |||
Depreciation - equipment rentals | $ | 1,136 | $ | 1,060 | $ | 854 | |||
Leased device additions | |||||||||
Cash paid for capital expenditures - leased devices | $ | 1,817 | $ | 1,928 | $ | 1,359 | |||
Leased devices | |||||||||
Leased devices in property, plant and equipment, net | $ | 6,213 | $ | 6,012 | $ | 4,336 | |||
Leased device units | |||||||||
Leased devices in property, plant and equipment (units in thousands) | 15,169 | 14,543 | 12,223 | ||||||
Leased device and receivables financings net proceeds | |||||||||
Proceeds | $ | 1,356 | $ | — | $ | 765 | |||
Repayments | (1,070 | ) | (555 | ) | (273 | ) | |||
Net proceeds (repayments) of financings related to devices and receivables | $ | 286 | $ | (555 | ) | $ | 492 | ||
News Release | | |
CONDENSED CONSOLIDATED STATEMENTS OF OPERATIONS (Unaudited)
(Millions, except per share data)
Quarter To Date | |||||||||
6/30/18 | 3/31/18 | 6/30/17 | |||||||
Net operating revenues | |||||||||
Service revenue | $ | 5,740 | $ | 5,866 | $ | 6,071 | |||
Equipment sales | 1,173 | 1,081 | 1,187 | ||||||
Equipment rentals | 1,212 | 1,136 | 899 | ||||||
Total net operating revenues | 8,125 | 8,083 | 8,157 | ||||||
Net operating expenses | |||||||||
Cost of services (exclusive of depreciation and amortization below) | 1,677 | 1,661 | 1,709 | ||||||
Cost of equipment sales | 1,270 | 1,487 | 1,545 | ||||||
Cost of equipment rentals (exclusive of depreciation below) | 124 | 146 | 112 | ||||||
Selling, general and administrative | 1,867 | 2,028 | 1,938 | ||||||
Depreciation - network and other | 1,023 | 1,015 | 977 | ||||||
Depreciation - equipment rentals | 1,136 | 1,060 | 854 | ||||||
Amortization | 171 | 184 | 223 | ||||||
Other, net | 42 | 266 | (364 | ) | |||||
Total net operating expenses | 7,310 | 7,847 | 6,994 | ||||||
Operating income | 815 | 236 | 1,163 | ||||||
Interest expense | (637 | ) | (576 | ) | (613 | ) | |||
Other income (expense), net | 42 | (9 | ) | (52 | ) | ||||
Income (loss) before income taxes | 220 | (349 | ) | 498 | |||||
Income tax (expense) benefit | (47 | ) | 412 | (292 | ) | ||||
Net income | 173 | 63 | 206 | ||||||
Less: Net loss attributable to noncontrolling interests | 3 | 6 | — | ||||||
Net income attributable to Sprint Corporation | $ | 176 | $ | 69 | $ | 206 | |||
Basic net income per common share | $ | 0.04 | $ | 0.02 | $ | 0.05 | |||
Diluted net income per common share | $ | 0.04 | $ | 0.02 | $ | 0.05 | |||
Weighted average common shares outstanding | 4,010 | 4,004 | 3,993 | ||||||
Diluted weighted average common shares outstanding | 4,061 | 4,055 | 4,076 | ||||||
Effective tax rate | 21.4 | % | 118.1 | % | 58.6 | % | |||
NON-GAAP RECONCILIATION - NET INCOME TO ADJUSTED EBITDA* (Unaudited)
(Millions)
Quarter To Date | |||||||||
6/30/18 | 3/31/18 | 6/30/17 | |||||||
Net income | $ | 173 | $ | 63 | $ | 206 | |||
Income tax expense (benefit) | 47 | (412 | ) | 292 | |||||
Income (loss) before income taxes | 220 | (349 | ) | 498 | |||||
Other (income) expense, net | (42 | ) | 9 | 52 | |||||
Interest expense | 637 | 576 | 613 | ||||||
Operating income | 815 | 236 | 1,163 | ||||||
Depreciation - network and other | 1,023 | 1,015 | 977 | ||||||
Depreciation - equipment rentals | 1,136 | 1,060 | 854 | ||||||
Amortization | 171 | 184 | 223 | ||||||
EBITDA* (1) | 3,145 | 2,495 | 3,217 | ||||||
Loss (gain) from asset dispositions, exchanges, and other, net (2) | — | 189 | (304 | ) | |||||
Severance and exit costs (3) | 8 | 67 | — | ||||||
Contract terminations (4) | 34 | — | (5 | ) | |||||
Merger costs (5) | 93 | — | — | ||||||
Litigation and other contingencies (6) | — | 10 | (55 | ) | |||||
Hurricanes (7) | — | 7 | — | ||||||
Adjusted EBITDA* (1) | $ | 3,280 | $ | 2,768 | $ | 2,853 | |||
Adjusted EBITDA margin* | 57.1 | % | 47.2 | % | 47.0 | % | |||
Selected items: | |||||||||
Cash paid for capital expenditures - network and other | $ | 1,132 | $ | 780 | $ | 1,151 | |||
Cash paid for capital expenditures - leased devices | $ | 1,817 | $ | 1,928 | $ | 1,359 | |||
News Release | | |
WIRELESS STATEMENTS OF OPERATIONS (Unaudited)
(Millions)
Quarter To Date | |||||||||
6/30/18 | 3/31/18 | 6/30/17 | |||||||
Net operating revenues | |||||||||
Service revenue | |||||||||
Postpaid | $ | 4,188 | $ | 4,270 | $ | 4,466 | |||
Prepaid | 982 | 989 | 999 | ||||||
Wholesale, affiliate and other | 290 | 314 | 259 | ||||||
Total service revenue | 5,460 | 5,573 | 5,724 | ||||||
Equipment sales | 1,173 | 1,081 | 1,187 | ||||||
Equipment rentals | 1,212 | 1,136 | 899 | ||||||
Total net operating revenues | 7,845 | 7,790 | 7,810 | ||||||
Net operating expenses | |||||||||
Cost of services (exclusive of depreciation and amortization below) | 1,429 | 1,401 | 1,412 | ||||||
Cost of equipment sales | 1,270 | 1,487 | 1,545 | ||||||
Cost of equipment rentals (exclusive of depreciation below) | 124 | 146 | 112 | ||||||
Selling, general and administrative | 1,704 | 1,947 | 1,875 | ||||||
Depreciation - network and other | 972 | 968 | 925 | ||||||
Depreciation - equipment rentals | 1,136 | 1,060 | 854 | ||||||
Amortization | 171 | 184 | 223 | ||||||
Other, net | 37 | 258 | (314 | ) | |||||
Total net operating expenses | 6,843 | 7,451 | 6,632 | ||||||
Operating income | $ | 1,002 | $ | 339 | $ | 1,178 | |||
WIRELESS NON-GAAP RECONCILIATION (Unaudited)
(Millions)
Quarter To Date | |||||||||
6/30/18 | 3/31/18 | 6/30/17 | |||||||
Operating income | $ | 1,002 | $ | 339 | $ | 1,178 | |||
Loss (gain) from asset dispositions, exchanges, and other, net (2) | — | 189 | (304 | ) | |||||
Severance and exit costs (3) | 3 | 59 | (5 | ) | |||||
Contract terminations (4) | 34 | — | (5 | ) | |||||
Litigation and other contingencies (6) | — | 10 | — | ||||||
Hurricanes (7) | — | 7 | — | ||||||
Depreciation - network and other | 972 | 968 | 925 | ||||||
Depreciation - equipment rentals | 1,136 | 1,060 | 854 | ||||||
Amortization | 171 | 184 | 223 | ||||||
Adjusted EBITDA* (1) | $ | 3,318 | $ | 2,816 | $ | 2,866 | |||
Adjusted EBITDA margin* | 60.8 | % | 50.5 | % | 50.1 | % | |||
Selected items: | |||||||||
Cash paid for capital expenditures - network and other | $ | 1,019 | $ | 681 | $ | 965 | |||
Cash paid for capital expenditures - leased devices | $ | 1,817 | $ | 1,928 | $ | 1,359 | |||
News Release | | |
WIRELINE STATEMENTS OF OPERATIONS (Unaudited)
(Millions)
Quarter To Date | |||||||||
6/30/18 | 3/31/18 | 6/30/17 | |||||||
Net operating revenues | $ | 338 | $ | 344 | $ | 433 | |||
Net operating expenses | |||||||||
Cost of services (exclusive of depreciation and amortization below) | 311 | 316 | 387 | ||||||
Selling, general and administrative | 69 | 76 | 57 | ||||||
Depreciation and amortization | 49 | 50 | 51 | ||||||
Other, net | 5 | 9 | 5 | ||||||
Total net operating expenses | 434 | 451 | 500 | ||||||
Operating loss | $ | (96 | ) | $ | (107 | ) | $ | (67 | ) |
WIRELINE NON-GAAP RECONCILIATION (Unaudited)
(Millions)
Quarter To Date | |||||||||
6/30/18 | 3/31/18 | 6/30/17 | |||||||
Operating loss | $ | (96 | ) | $ | (107 | ) | $ | (67 | ) |
Loss from asset dispositions, exchanges, and other, net (2) | — | 1 | — | ||||||
Severance and exit costs (3) | 5 | 8 | 5 | ||||||
Depreciation and amortization | 49 | 50 | 51 | ||||||
Adjusted EBITDA* | $ | (42 | ) | $ | (48 | ) | $ | (11 | ) |
Adjusted EBITDA margin* | -12.4 | % | -14.0 | % | -2.5 | % | |||
Selected items: | |||||||||
Cash paid for capital expenditures - network and other | $ | 51 | $ | 34 | $ | 62 | |||
News Release | | |
CONDENSED CONSOLIDATED CASH FLOW INFORMATION (Unaudited)
(Millions)
Quarter To Date | |||||||||
6/30/18 | 3/31/18 | 6/30/17 | |||||||
Operating activities | |||||||||
Net income | $ | 173 | $ | 63 | $ | 206 | |||
Depreciation and amortization | 2,330 | 2,259 | 2,054 | ||||||
Provision for losses on accounts receivable | 57 | 50 | 102 | ||||||
Share-based and long-term incentive compensation expense | 40 | 45 | 41 | ||||||
Deferred income tax expense (benefit) | 39 | (412 | ) | 282 | |||||
Gains from asset dispositions and exchanges | — | — | (479 | ) | |||||
Loss on early extinguishment of debt | — | — | 66 | ||||||
Amortization of long-term debt premiums, net | (33 | ) | (33 | ) | (51 | ) | |||
Loss on disposal of property, plant and equipment | 124 | 335 | 293 | ||||||
Deferred purchase price from sale of receivables | (170 | ) | (231 | ) | (375 | ) | |||
Other changes in assets and liabilities: | |||||||||
Accounts and notes receivable | 273 | 157 | (53 | ) | |||||
Inventories and other current assets | 421 | 175 | 181 | ||||||
Accounts payable and other current liabilities | (766 | ) | 121 | (474 | ) | ||||
Non-current assets and liabilities, net | (197 | ) | 11 | 73 | |||||
Other, net | 139 | 113 | 58 | ||||||
Net cash provided by operating activities | 2,430 | 2,653 | 1,924 | ||||||
Investing activities | |||||||||
Capital expenditures - network and other | (1,132 | ) | (780 | ) | (1,151 | ) | |||
Capital expenditures - leased devices | (1,817 | ) | (1,928 | ) | (1,359 | ) | |||
Expenditures relating to FCC licenses | (59 | ) | (23 | ) | (13 | ) | |||
Change in short-term investments, net | (1,654 | ) | (2,181 | ) | 1,095 | ||||
Proceeds from sales of assets and FCC licenses | 133 | 160 | 101 | ||||||
Proceeds from deferred purchase price from sale of receivables | 170 | 231 | 375 | ||||||
Other, net | (10 | ) | 2 | (1 | ) | ||||
Net cash used in investing activities | (4,369 | ) | (4,519 | ) | (953 | ) | |||
Financing activities | |||||||||
Proceeds from debt and financings | 1,370 | 5,456 | 902 | ||||||
Repayments of debt, financing and capital lease obligations | (1,415 | ) | (1,359 | ) | (2,121 | ) | |||
Debt financing costs | (248 | ) | (74 | ) | — | ||||
Call premiums paid on debt redemptions | — | (2 | ) | (129 | ) | ||||
Other, net | (2 | ) | 9 | (15 | ) | ||||
Net cash (used in) provided by financing activities | (295 | ) | 4,030 | (1,363 | ) | ||||
Net (decrease) increase in cash, cash equivalents and restricted cash | (2,234 | ) | 2,164 | (392 | ) | ||||
Cash, cash equivalents and restricted cash, beginning of period | 6,659 | 4,495 | 2,942 | ||||||
Cash, cash equivalents and restricted cash, end of period | $ | 4,425 | $ | 6,659 | $ | 2,550 | |||
RECONCILIATION TO CONSOLIDATED FREE CASH FLOW* (NON-GAAP) (Unaudited)
(Millions)
Quarter To Date | |||||||||
6/30/18 | 3/31/18 | 6/30/17 | |||||||
Net cash provided by operating activities | $ | 2,430 | $ | 2,653 | $ | 1,924 | |||
Capital expenditures - network and other | (1,132 | ) | (780 | ) | (1,151 | ) | |||
Capital expenditures - leased devices | (1,817 | ) | (1,928 | ) | (1,359 | ) | |||
Expenditures relating to FCC licenses, net | (59 | ) | (23 | ) | (13 | ) | |||
Proceeds from sales of assets and FCC licenses | 133 | 160 | 101 | ||||||
Proceeds from deferred purchase price from sale of receivables | 170 | 231 | 375 | ||||||
Other investing activities, net | (3 | ) | 2 | (1 | ) | ||||
Free cash flow* | $ | (278 | ) | $ | 315 | $ | (124 | ) | |
Net proceeds (repayments) of financings related to devices and receivables | 286 | (555 | ) | 492 | |||||
Adjusted free cash flow* | $ | 8 | $ | (240 | ) | $ | 368 | ||
News Release | | |
CONDENSED CONSOLIDATED BALANCE SHEETS (Unaudited)
(Millions)
6/30/18 | 3/31/18 | |||||
ASSETS | ||||||
Current assets | ||||||
Cash and cash equivalents | $ | 4,378 | $ | 6,610 | ||
Short-term investments | 4,008 | 2,354 | ||||
Accounts and notes receivable, net | 3,492 | 3,711 | ||||
Device and accessory inventory | 622 | 1,003 | ||||
Prepaid expenses and other current assets | 895 | 575 | ||||
Total current assets | 13,395 | 14,253 | ||||
Property, plant and equipment, net | 20,538 | 19,925 | ||||
Costs to acquire a customer contract | 1,294 | — | ||||
Goodwill | 6,586 | 6,586 | ||||
FCC licenses and other | 41,368 | 41,309 | ||||
Definite-lived intangible assets, net | 2,245 | 2,465 | ||||
Other assets | 1,023 | 921 | ||||
Total assets | $ | 86,449 | $ | 85,459 | ||
LIABILITIES AND EQUITY | ||||||
Current liabilities | ||||||
Accounts payable | $ | 3,143 | $ | 3,409 | ||
Accrued expenses and other current liabilities | 3,658 | 3,962 | ||||
Current portion of long-term debt, financing and capital lease obligations | 4,846 | 3,429 | ||||
Total current liabilities | 11,647 | 10,800 | ||||
Long-term debt, financing and capital lease obligations | 35,771 | 37,463 | ||||
Deferred tax liabilities | 7,704 | 7,294 | ||||
Other liabilities | 3,382 | 3,483 | ||||
Total liabilities | 58,504 | 59,040 | ||||
Stockholders' equity | ||||||
Common stock | 40 | 40 | ||||
Treasury shares, at cost | (4 | ) | — | |||
Paid-in capital | 27,938 | 27,884 | ||||
Retained earnings (accumulated deficit) | 236 | (1,255 | ) | |||
Accumulated other comprehensive loss | (317 | ) | (313 | ) | ||
Total stockholders' equity | 27,893 | 26,356 | ||||
Noncontrolling interests | 52 | 63 | ||||
Total equity | 27,945 | 26,419 | ||||
Total liabilities and equity | $ | 86,449 | $ | 85,459 | ||
NET DEBT* (NON-GAAP) (Unaudited)
(Millions)
6/30/18 | 3/31/18 | |||||
Total debt | $ | 40,617 | $ | 40,892 | ||
Less: Cash and cash equivalents | (4,378 | ) | (6,610 | ) | ||
Less: Short-term investments | (4,008 | ) | (2,354 | ) | ||
Net debt* | $ | 32,231 | $ | 31,928 | ||
News Release | | |
SCHEDULE OF DEBT (Unaudited)
(Millions)
6/30/18 | ||||
ISSUER | MATURITY | PRINCIPAL | ||
Sprint Corporation | ||||
7.25% Senior notes due 2021 | 09/15/2021 | $ | 2,250 | |
7.875% Senior notes due 2023 | 09/15/2023 | 4,250 | ||
7.125% Senior notes due 2024 | 06/15/2024 | 2,500 | ||
7.625% Senior notes due 2025 | 02/15/2025 | 1,500 | ||
7.625% Senior notes due 2026 | 03/01/2026 | 1,500 | ||
Sprint Corporation | 12,000 | |||
Sprint Spectrum Co LLC, Sprint Spectrum Co II LLC, and Sprint Spectrum Co III LLC | ||||
3.36% Senior secured notes due 2021 | 09/20/2021 | 2,843 | ||
4.738% Senior secured notes due 2025 | 03/20/2025 | 2,100 | ||
5.152% Senior secured notes due 2028 | 03/20/2028 | 1,838 | ||
Sprint Spectrum Co LLC, Sprint Spectrum Co II LLC, and Sprint Spectrum Co III LLC | 6,781 | |||
Sprint Communications, Inc. | ||||
Export Development Canada secured loan | 12/12/2019 | 300 | ||
9% Guaranteed notes due 2018 | 11/15/2018 | 1,753 | ||
7% Guaranteed notes due 2020 | 03/01/2020 | 1,000 | ||
7% Senior notes due 2020 | 08/15/2020 | 1,500 | ||
11.5% Senior notes due 2021 | 11/15/2021 | 1,000 | ||
9.25% Debentures due 2022 | 04/15/2022 | 200 | ||
6% Senior notes due 2022 | 11/15/2022 | 2,280 | ||
Sprint Communications, Inc. | 8,033 | |||
Sprint Capital Corporation | ||||
6.9% Senior notes due 2019 | 05/01/2019 | 1,729 | ||
6.875% Senior notes due 2028 | 11/15/2028 | 2,475 | ||
8.75% Senior notes due 2032 | 03/15/2032 | 2,000 | ||
Sprint Capital Corporation | 6,204 | |||
Credit facilities | ||||
PRWireless secured term loan | 06/28/2020 | 182 | ||
Secured equipment credit facilities | 2020 - 2021 | 462 | ||
Secured term loan | 02/03/2024 | 3,950 | ||
Credit facilities | 4,594 | |||
Accounts receivable facility | 2020 | 2,697 | ||
Financing obligations | 2021 | 139 | ||
Capital leases and other obligations | 2018 - 2026 | 507 | ||
Total principal | 40,955 | |||
Net premiums and debt financing costs | (338 | ) | ||
Total debt | $ | 40,617 | ||
News Release | | |
RECONCILIATION OF ADJUSTMENTS FROM THE ADOPTION OF TOPIC 606 RELATIVE TO TOPIC 605 ON CONSOLIDATED STATEMENTS OF OPERATIONS (Unaudited)
(Millions, except per share data)
Three Months Ended June 30, 2018 | |||||||||
As reported | Balances without adoption of Topic 606 | Change | |||||||
Net operating revenues | |||||||||
Service revenue | $ | 5,740 | $ | 5,883 | $ | (143 | ) | ||
Equipment sales | 1,173 | 892 | 281 | ||||||
Equipment rentals | 1,212 | 1,228 | (16 | ) | |||||
Total net operating revenues | 8,125 | 8,003 | 122 | ||||||
Net operating expenses | |||||||||
Cost of services (exclusive of depreciation and amortization below) | 1,677 | 1,688 | (11 | ) | |||||
Cost of equipment sales | 1,270 | 1,248 | 22 | ||||||
Cost of equipment rentals (exclusive of depreciation below) | 124 | 124 | — | ||||||
Selling, general and administrative | 1,867 | 1,948 | (81 | ) | |||||
Depreciation - network and other | 1,023 | 1,023 | — | ||||||
Depreciation - equipment rentals | 1,136 | 1,136 | — | ||||||
Amortization | 171 | 171 | — | ||||||
Other, net | 42 | 42 | — | ||||||
Total net operating expenses | 7,310 | 7,380 | (70 | ) | |||||
Operating income | 815 | 623 | 192 | ||||||
Total other expense | (595 | ) | (595 | ) | — | ||||
Income before income taxes | 220 | 28 | 192 | ||||||
Income tax expense | (47 | ) | (7 | ) | (40 | ) | |||
Net income | 173 | 21 | 152 | ||||||
Less: Net loss attributable to noncontrolling interests | 3 | 3 | — | ||||||
Net income attributable to Sprint Corporation | $ | 176 | $ | 24 | $ | 152 | |||
Basic net income per common share | $ | 0.04 | $ | 0.01 | $ | 0.03 | |||
Diluted net income per common share | $ | 0.04 | $ | 0.01 | $ | 0.03 | |||
Weighted average common shares outstanding | 4,010 | 4,010 | — | ||||||
Diluted weighted average common shares outstanding | 4,061 | 4,061 | — | ||||||
News Release | | |
RECONCILIATION OF ADJUSTMENTS FROM THE ADOPTION OF TOPIC 606 RELATIVE TO TOPIC 605 ON CONDENSED CONSOLIDATED BALANCE SHEETS (Unaudited)
(Millions)
June 30, 2018 | |||||||||
As reported | Balances without adoption of Topic 606 | Change | |||||||
ASSETS | |||||||||
Current assets | $ | 3,492 | $ | 3,404 | $ | 88 | |||
Accounts and notes receivable, net | 622 | 644 | (22 | ) | |||||
Device and accessory inventory | 895 | 557 | 338 | ||||||
Prepaid expenses and other current assets | 1,294 | — | 1,294 | ||||||
Costs to acquire a customer contract | 1,023 | 919 | 104 | ||||||
Other assets | |||||||||
LIABILITIES AND STOCKHOLDERS' EQUITY | |||||||||
Current liabilities | |||||||||
Accrued expenses and other current liabilities | $ | 3,658 | $ | 3,690 | $ | (32 | ) | ||
Deferred tax liabilities | 7,704 | 7,298 | 406 | ||||||
Other liabilities | 3,382 | 3,413 | (31 | ) | |||||
Stockholders' equity | |||||||||
Retained earnings (accumulated deficit) | 236 | (1,223 | ) | 1,459 | |||||
News Release | | |
NOTES TO THE FINANCIAL INFORMATION (Unaudited)
(1) | As more of our customers elect to lease a device rather than purchasing one under our subsidized program, there is a significant positive impact to EBITDA* and Adjusted EBITDA* from direct channel sales primarily due to the fact the cost of the device is not recorded as cost of equipment sales but rather is depreciated over the customer lease term. Under our device leasing program for the direct channel, devices are transferred from inventory to property and equipment and the cost of the leased device is recognized as depreciation expense over the customer lease term to an estimated residual value. The customer payments are recognized as revenue over the term of the lease. Under our subsidized program, the cash received from the customer for the device is recognized as revenue from equipment sales at the point of sale and the cost of the device is recognized as cost of equipment sales. During the three-month period ended June 30, 2018, we leased devices through our Sprint direct channels totaling approximately $1,163 million, which would have increased cost of equipment sales and reduced EBITDA* if they had been purchased under our subsidized program. |
The impact to EBITDA* and Adjusted EBITDA* resulting from the sale of devices under our installment billing program is generally neutral except for the impact in our indirect channels from the time value of money element related to the imputed interest on the installment receivable.
(2) | During the fourth and first quarters of fiscal year 2017, the company recorded losses on dispositions of assets primarily related to cell site construction and network development costs that are no longer relevant as a result of changes in the company's network plans. Additionally, the company recorded a pre-tax non-cash gain related to spectrum swaps with other carriers. |
(3) | During the first quarter of fiscal year 2018 and fourth quarter of fiscal year 2017, severance and exit costs consist of lease exit costs primarily associated with tower and cell sites, access exit costs related to payments that will continue to be made under the company's backhaul access contracts for which the company will no longer be receiving any economic benefit, and severance costs associated with reduction in its work force. |
(4) | During the first quarter of fiscal year 2018, contract termination costs are primarily due to the purchase of certain leased spectrum assets, which upon termination of the spectrum leases resulted in the accelerated recognition of the unamortized favorable lease balances. During the first quarter of fiscal year 2017, we recorded a $5 million gain due to reversal of a liability recorded in relation to the termination of our relationship with General Wireless Operations, Inc. (Radio Shack). |
(5) | During the first quarter of fiscal year 2018, we recorded $93 million of merger costs due to the proposed Business Combination Agreement with T-Mobile. |
(6) | During the fourth and first quarters of fiscal year 2017, litigation and other contingencies consist of reductions associated with legal settlements or favorable developments in pending legal proceedings. In addition, the first quarter of fiscal year 2017 includes non-recurring charges of $51 million related to a regulatory fee matter. |
(7) | During the fourth quarter of fiscal year 2017 we recorded estimated hurricane-related charges of $7 million, consisting of incremental roaming costs, network repairs and replacements. |
News Release | | |
*FINANCIAL MEASURES
Sprint provides financial measures determined in accordance with GAAP and adjusted GAAP (non-GAAP). The non-GAAP financial measures reflect industry conventions, or standard measures of liquidity, profitability or performance commonly used by the investment community for comparability purposes. These measurements should be considered in addition to, but not as a substitute for, financial information prepared in accordance with GAAP. We have defined below each of the non-GAAP measures we use, but these measures may not be synonymous to similar measurement terms used by other companies.
Sprint provides reconciliations of these non-GAAP measures in its financial reporting. Because Sprint does not predict special items that might occur in the future, and our forecasts are developed at a level of detail different than that used to prepare GAAP-based financial measures, Sprint does not provide reconciliations to GAAP of its forward-looking financial measures.
The measures used in this release include the following:
EBITDA is operating income/(loss) before depreciation and amortization. Adjusted EBITDA is EBITDA excluding severance, exit costs, and other special items. Adjusted EBITDA Margin represents Adjusted EBITDA divided by non-equipment net operating revenues for Wireless and Adjusted EBITDA divided by net operating revenues for Wireline. We believe that Adjusted EBITDA and Adjusted EBITDA Margin provide useful information to investors because they are an indicator of the strength and performance of our ongoing business operations. While depreciation and amortization are considered operating costs under GAAP, these expenses primarily represent non-cash current period costs associated with the use of long-lived tangible and definite-lived intangible assets. Adjusted EBITDA and Adjusted EBITDA Margin are calculations commonly used as a basis for investors, analysts and credit rating agencies to evaluate and compare the periodic and future operating performance and value of companies within the telecommunications industry.
Postpaid ABPA is average billings per account and calculated by dividing postpaid service revenue earned from postpaid customers plus billings from installment plans and non-operating leases, as well as equipment rentals, by the sum of the monthly average number of postpaid accounts during the period. We believe that ABPA provides useful information to investors, analysts and our management to evaluate average postpaid customer billings per account as it approximates the expected cash collections, including billings from installment plans and non-operating leases, as well as equipment rentals, per postpaid account each month.
Postpaid Phone ABPU is average billings per postpaid phone user and calculated by dividing service revenue earned from postpaid phone customers plus billings from installment plans and non-operating leases, as well as equipment rentals by the sum of the monthly average number of postpaid phone connections during the period. We believe that ABPU provides useful information to investors, analysts and our management to evaluate average postpaid phone customer billings as it approximates the expected cash collections, including billings from installment plans and non-operating leases, as well as equipment rentals, per postpaid phone user each month.
Free Cash Flow is the cash provided by operating activities less the cash used in investing activities other than short-term investments and equity method investments. Adjusted Free Cash Flow is Free Cash Flow plus the proceeds from device financings and sales of receivables, net of repayments. We believe that Free Cash Flow and Adjusted Free Cash Flow provide useful information to investors, analysts and our management about the cash generated by our core operations and net proceeds obtained to fund certain leased devices, respectively, after interest and dividends, if any, and our ability to fund scheduled debt maturities and other financing activities, including discretionary refinancing and retirement of debt and purchase or sale of investments.
Net Debt is consolidated debt, including current maturities, less cash and cash equivalents and short-term investments. We believe that Net Debt provides useful information to investors, analysts and credit rating agencies about the capacity of the company to reduce the debt load and improve its capital structure.
News Release | | |
SAFE HARBOR
This release includes “forward-looking statements” within the meaning of the securities laws. The words “may,” “could,” “should,” “estimate,” “project,” “forecast,” “intend,” “expect,” “anticipate,” “believe,” “target,” “plan”, “outlook,” “providing guidance,” and similar expressions are intended to identify information that is not historical in nature. All statements that address operating performance, events or developments that we expect or anticipate will occur in the future - including statements relating to our network, cost reductions, connections growth, and liquidity; and statements expressing general views about future operating results - are forward-looking statements. Forward-looking statements are estimates and projections reflecting management’s judgment based on currently available information and involve a number of risks and uncertainties that could cause actual results to differ materially from those suggested by the forward-looking statements. With respect to these forward-looking statements, management has made assumptions regarding, among other things, the development and deployment of new technologies and services; efficiencies and cost savings of new technologies and services; customer and network usage; connection growth and retention; service, speed, coverage and quality; availability of devices; availability of various financings, including any leasing transactions; the timing of various events and the economic environment. Sprint believes these forward-looking statements are reasonable; however, you should not place undue reliance on forward-looking statements, which are based on current expectations and speak only as of the date when made. Sprint undertakes no obligation to publicly update or revise any forward-looking statements, whether as a result of new information, future events or otherwise, except as required by law. In addition, forward-looking statements are subject to certain risks and uncertainties that could cause actual results to differ materially from our company's historical experience and our present expectations or projections. Factors that might cause such differences include, but are not limited to, those discussed in Sprint Corporation’s Annual Report on Form 10-K for the fiscal year ended March 31, 2018. You should understand that it is not possible to predict or identify all such factors. Consequently, you should not consider any such list to be a complete set of all potential risks or uncertainties.
About Sprint:
Sprint (NYSE: S) is a communications services company that creates more and better ways to connect its customers to the things they care about most. Sprint served 54.6 million connections as of June 30, 2018 and is widely recognized for developing, engineering and deploying innovative technologies, including the first wireless 4G service from a national carrier in the United States; leading no-contract brands including Virgin Mobile USA, Boost Mobile, and Assurance Wireless; instant national and international push-to-talk capabilities; and a global Tier 1 Internet backbone. Today, Sprint’s legacy of innovation and service continues with an increased investment to dramatically improve coverage, reliability, and speed across its nationwide network and commitment to launching the first 5G mobile network in the U.S. You can learn more and visit Sprint at www.sprint.com or www.facebook.com/sprint and www.twitter.com/sprint.
###