Attached files
| file | filename |
|---|---|
| 8-K - KIMBALL ELECTRONICS, INC. FORM 8-K - Kimball Electronics, Inc. | keform8-kearningsrelease06.htm |
| EX-99.1 - KIMBALL ELECTRONICS, INC. EXHIBIT 99.1 - Kimball Electronics, Inc. | a8kexhibit99106302018q410k.htm |
| EX-10.1 - KIMBALL ELECTRONICS, INC. EXHIBIT 10.1 - Kimball Electronics, Inc. | exhibit101keiamendedandres.htm |

Exhibit 99.2 Financial Results Fourth Quarter Fiscal Year 2018 Quarter Ended June 30, 2018 Supplementary Information to August 2, 2018 Earnings Conference Call LastingLasting relationships. relationships. Global Global success. success.

Safe Harbor Statement Certain statements contained within this supplementary information and any statements made during our earnings conference call today may be considered forward-looking under the Private Securities Litigation Reform Act of 1995 and are subject to risks and uncertainties including, but not limited to, successful integration of acquisitions and new operations, global economic conditions, geopolitical environment, significant reductions in volumes and order patterns from key contract customers, loss of key customers or suppliers, financial stability of key customers and suppliers, availability or cost of raw materials, impact related to tariffs and other trade barriers, and increased competitive pricing pressures reflecting excess industry capacities. Additional cautionary statements regarding other risk factors that could have an effect on the future performance of Kimball Electronics, Inc. (the “Company”) are contained in the Company’s Annual Report on Form 10-K for the fiscal year ended June 30, 2017, our earnings release, and other filings with the Securities and Exchange Commission (the “SEC”). This supplementary information contains non-GAAP financial measures. A non-GAAP financial measure is a numerical measure of a company’s financial performance that excludes or includes amounts so as to be different than the most directly comparable measure calculated and presented in accordance with Generally Accepted Accounting Principles (GAAP) in the United States in the statement of income, statement of comprehensive income, balance sheet, statement of cash flows, or statement of equity of the company. The non-GAAP financial measures contained herein include Adjusted Operating Income, Adjusted Net Income, Adjusted EBITDA, and Return on Invested Capital (ROIC), which have been adjusted for proceeds from a lawsuit settlement, a bargain purchase gain, and provisional tax items related to the U.S. Tax Cuts and Jobs Act (“Tax Reform”) enacted in December 2017. Management believes it is useful for investors to understand how its core operations performed without the effects of incremental costs related to the lawsuit proceeds, the bargain purchase gain, and provisional tax items related to Tax Reform. Excluding these amounts allows investors to meaningfully trend, analyze, and benchmark the performance of the Company’s core operations. Many of the Company’s internal performance measures that management uses to make certain operating decisions use these and other non-GAAP measures to enable meaningful trending of core operating metrics. 2 LastingLasting relationships. relationships. Global Global success. success.

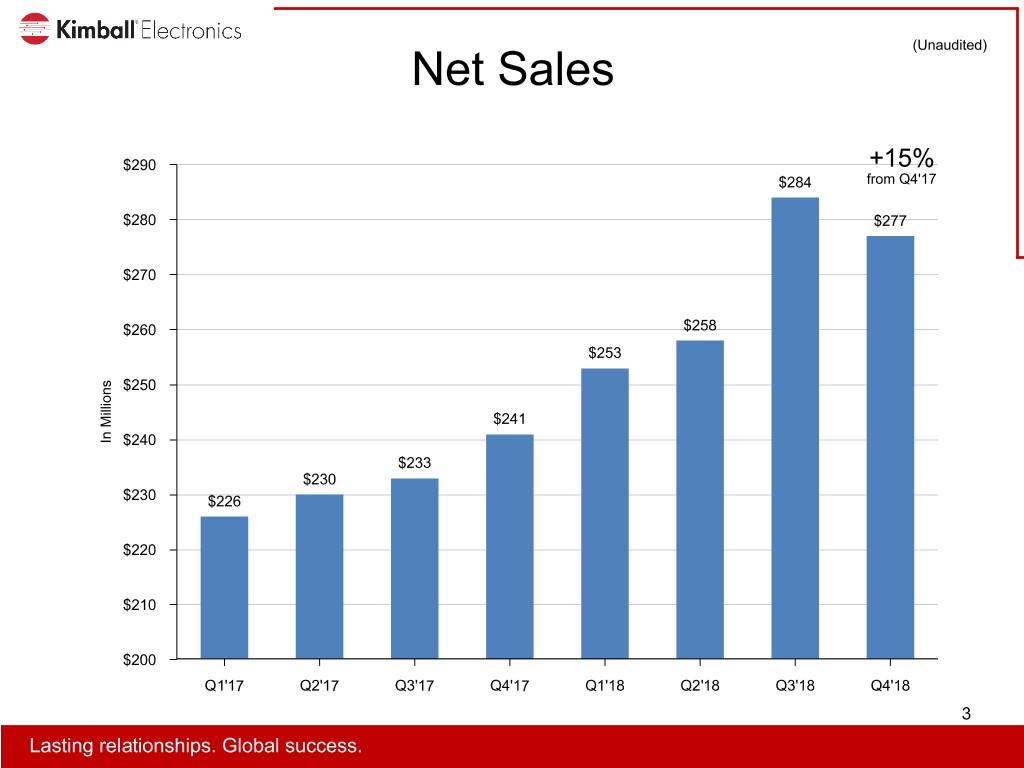
(Unaudited) Net Sales $290 +15% $284 from Q4'17 $280 $277 $270 $260 $258 $253 s $250 n o i l l i $241 M n I $240 $233 $230 $230 $226 $220 $210 $200 Q1'17 Q2'17 Q3'17 Q4'17 Q1'18 Q2'18 Q3'18 Q4'18 3 LastingLasting relationships. relationships. Global Global success. success.

(Unaudited) Net Sales Mix by Vertical Market 100% 2% 2% 2% 2% 1% 1% 1% 1% 7% 6% 5% 6% 6% 7% 9% 8% 90% 19% 20% 21% 80% 23% 21% 22% 23% 22% 70% 27% 60% 28% s 31% e 28% l 28% 28% 30% a 26% S 50% f o % 40% 30% 45% 48% 20% 41% 42% 40% 40% 40% 41% 10% 0% Q1'17 Q2'17 Q3'17 Q4'17 Q1'18 Q2'18 Q3'18 Q4'18 Automotive Medical Industrial Public Safety Other 4 LastingLasting relationships. relationships. Global Global success. success.

(Unaudited) Gross Margin % 10.0% 8.9% 9.0% 8.2% 8.1% 8.0% 8.1% 8.1% 8.0% 7.7% 7.5% 7.0% 6.0% s e l a S 5.0% f o % 4.0% 3.0% 2.0% 1.0% 0.0% Q1'17 Q2'17 Q3'17 Q4'17 Q1'18 Q2'18 Q3'18 Q4'18 5 LastingLasting relationships. relationships. Global Global success. success.

(Unaudited) Selling & Administrative Expense (%) 5.0% 4.5% 4.2% 4.2% 4.2% 4.1% s e l a 4.0% S 4.0% f 3.9% 3.9% o % 3.6% 3.5% 3.0% Q1'17 Q2'17 Q3'17 Q4'17 Q1'18 Q2'18 Q3'18 Q4'18 6 LastingLasting relationships. relationships. Global Global success. success.

(Unaudited) Adjusted Operating Income (Excludes lawsuit settlement proceeds) $14.0 6.0% $12.2 5.5% $12.0 $11.2 $11.4 5.3% $10.2 5.0% $10.0 $9.5 $9.6 $8.8 $8.5 4.5% s s $8.0 e n l o a i l l S i 4.0% 4.1% 4.1% f M o n I 3.9% 3.9% 3.9% % $6.0 3.8% 3.5% 3.5% $4.0 3.0% $2.0 2.5% $0.0 2.0% Q1'17 Q2'17 Q3'17 Q4'17 Q1'18 Q2'18 Q3'18 Q4'18 Adj Op Income % of Net Sales Note: Adjusted Operating Income is a Non-GAAP measure – refer to Reconciliation of Non-GAAP Results on the final slide of this supplementary information 7 LastingLasting relationships. relationships. Global Global success. success.

Adjusted Net Income (Unaudited) (Excludes lawsuit settlement proceeds, bargain purchase gain, and provisional tax items due to Tax Reform) $11.0 $10.7 $10.0 $9.0 $8.5 $8.1 $8.1 $8.2 $7.8 $8.0 $7.2 $7.0 $6.7 s n $6.0 o i l l i M n $5.0 I $4.0 $3.0 $2.0 $1.0 $0.0 Q1'17 Q2'17 Q3'17 Q4'17 Q1'18 Q2'18 Q3'18 Q4'18 Note: Adjusted Net Income is a Non-GAAP measure – refer to Reconciliation of Non-GAAP Results on the final slide of this supplementary information 8 LastingLasting relationships. relationships. Global Global success. success.

(Unaudited) Adjusted EBITDA (Excludes lawsuit settlement proceeds and bargain purchase gain) $22.0 10.0% $20.1 $20.0 $17.3 $17.2 $18.0 $17.0 $17.1 8.0% $15.9 $16.0 $16.1 $16.0 7.4% 7.0% 7.1% 6.9% 6.8% $14.0 6.7% 6.6% 6.0% s s 6.2% e n $12.0 l o a i l l S i f M $10.0 o n I % 4.0% $8.0 $6.0 $4.0 2.0% $2.0 $0.0 0.0% Q1'17 Q2'17 Q3'17 Q4'17 Q1'18 Q2'18 Q3'18 Q4'18 Adjusted EBITDA Adjusted EBITDA % of Sales Note: Adjusted EBITDA is a Non-GAAP measure - refer to Reconciliation of Non-GAAP Results on the final slide of this supplementary information 9 LastingLasting relationships. relationships. Global Global success. success.

(Unaudited) Return on Invested Capital (Excludes lawsuit settlement proceeds) 14.0% 12.0% 10.7% 10.7% 10.4% 10.2% 10.3% 10.0% 9.6% 9.6% 9.0% 8.0% % C I O R 6.0% 4.0% 2.0% 0.0% Q1'17 Q2'17 Q3'17 Q4'17 Q1'18 Q2'18 Q3'18 Q4'18 Notes: We define ROIC as after tax annualized adjusted operating income divided by average invested capital; ROIC is a Non-GAAP measure - refer to Reconciliation of Non-GAAP Results on the final slide of this supplementary information 10 LastingLasting relationships. relationships. Global Global success. success.

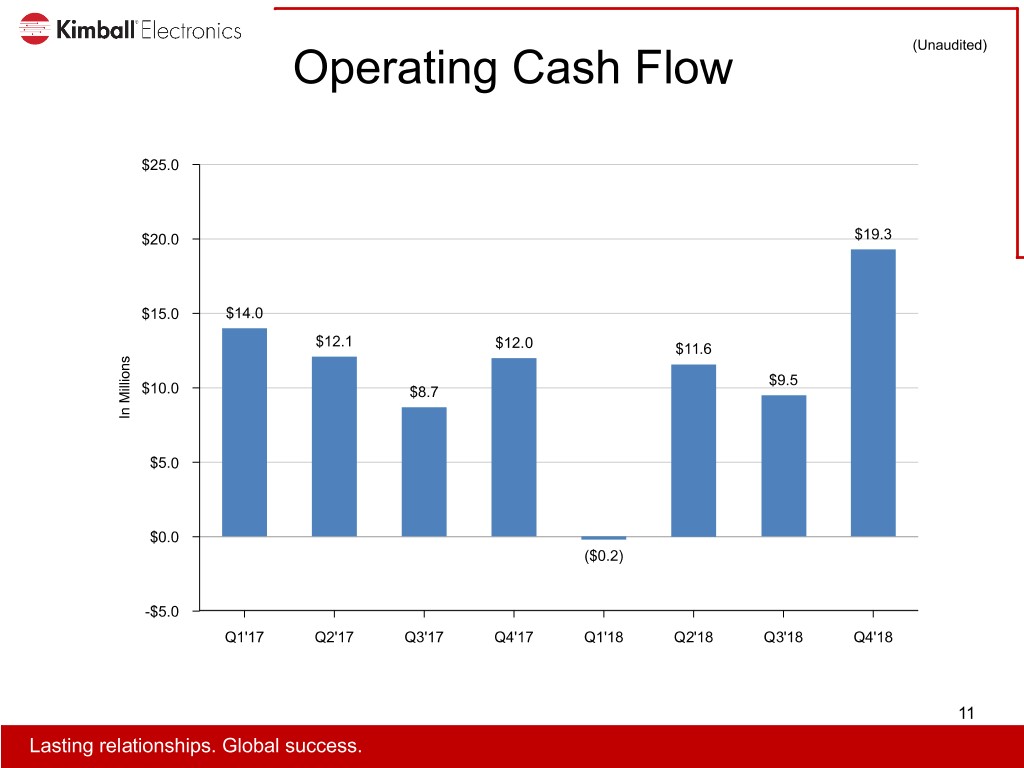
(Unaudited) Operating Cash Flow $25.0 $20.0 $19.3 $15.0 $14.0 $12.1 $12.0 $11.6 s n o i l $9.5 l i $10.0 $8.7 M n I $5.0 $0.0 ($0.2) -$5.0 Q1'17 Q2'17 Q3'17 Q4'17 Q1'18 Q2'18 Q3'18 Q4'18 11 LastingLasting relationships. relationships. Global Global success. success.

Capital Expenditures and (Unaudited) Depreciation & Amortization $15.0 $13.0 $11.0 $10.3 s $9.4 n o i l l $8.7 i $9.0 M $8.3 n I $7.2 $7.0 $6.3 $6.1 $6.8 $6.8 $6.4 $6.4 $6.4 $6.1 $5.7 $5.7 $5.0 $4.4 $3.0 Q1'17 Q2'17 Q3'17 Q4'17 Q1'18 Q2'18 Q3'18 Q4'18 Cap Ex Depr & Amort Note: Capital Expenditures include purchases of capitalized software. 12 LastingLasting relationships. relationships. Global Global success. success.

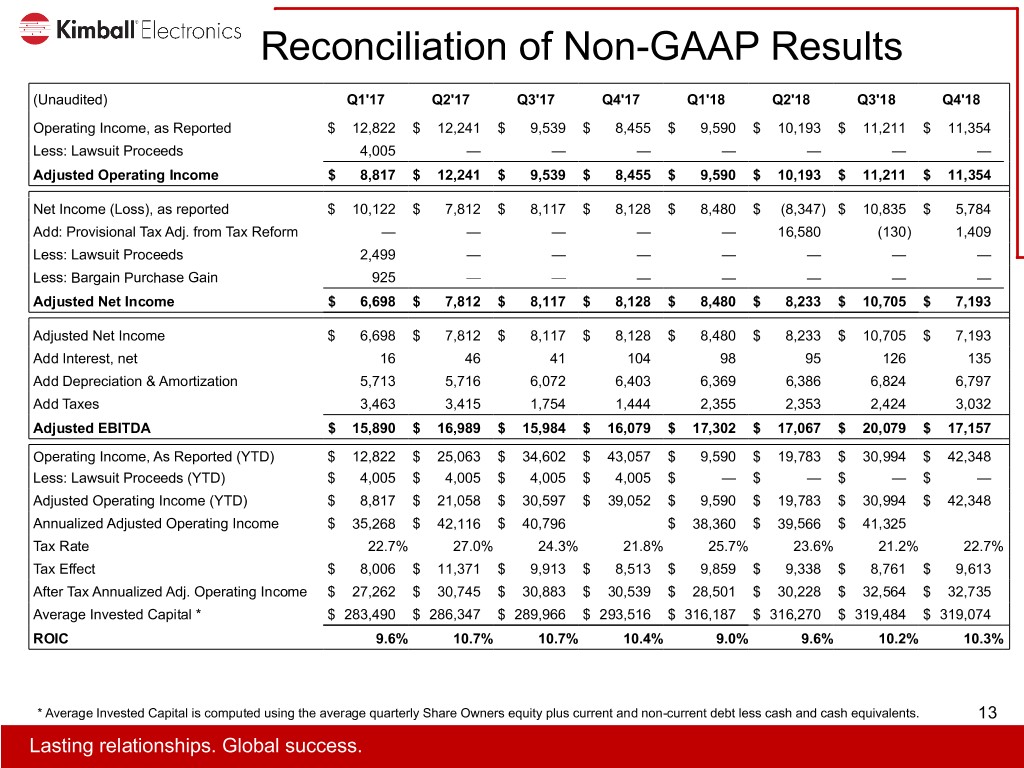
Reconciliation of Non-GAAP Results (Unaudited) Q1'17 Q2'17 Q3'17 Q4'17 Q1'18 Q2'18 Q3'18 Q4'18 Operating Income, as Reported $ 12,822 $ 12,241 $ 9,539 $ 8,455 $ 9,590 $ 10,193 $ 11,211 $ 11,354 Less: Lawsuit Proceeds 4,005 — — — — — — — Adjusted Operating Income $ 8,817 $ 12,241 $ 9,539 $ 8,455 $ 9,590 $ 10,193 $ 11,211 $ 11,354 Net Income (Loss), as reported $ 10,122 $ 7,812 $ 8,117 $ 8,128 $ 8,480 $ (8,347) $ 10,835 $ 5,784 Add: Provisional Tax Adj. from Tax Reform — — — — — 16,580 (130) 1,409 Less: Lawsuit Proceeds 2,499 — — — — — — — Less: Bargain Purchase Gain 925 — — — — — — — Adjusted Net Income $ 6,698 $ 7,812 $ 8,117 $ 8,128 $ 8,480 $ 8,233 $ 10,705 $ 7,193 Adjusted Net Income $ 6,698 $ 7,812 $ 8,117 $ 8,128 $ 8,480 $ 8,233 $ 10,705 $ 7,193 Add Interest, net 16 46 41 104 98 95 126 135 Add Depreciation & Amortization 5,713 5,716 6,072 6,403 6,369 6,386 6,824 6,797 Add Taxes 3,463 3,415 1,754 1,444 2,355 2,353 2,424 3,032 Adjusted EBITDA $ 15,890 $ 16,989 $ 15,984 $ 16,079 $ 17,302 $ 17,067 $ 20,079 $ 17,157 Operating Income, As Reported (YTD) $ 12,822 $ 25,063 $ 34,602 $ 43,057 $ 9,590 $ 19,783 $ 30,994 $ 42,348 Less: Lawsuit Proceeds (YTD) $ 4,005 $ 4,005 $ 4,005 $ 4,005 $ — $ — $ — $ — Adjusted Operating Income (YTD) $ 8,817 $ 21,058 $ 30,597 $ 39,052 $ 9,590 $ 19,783 $ 30,994 $ 42,348 Annualized Adjusted Operating Income $ 35,268 $ 42,116 $ 40,796 $ 38,360 $ 39,566 $ 41,325 Tax Rate 22.7% 27.0% 24.3% 21.8% 25.7% 23.6% 21.2% 22.7% Tax Effect $ 8,006 $ 11,371 $ 9,913 $ 8,513 $ 9,859 $ 9,338 $ 8,761 $ 9,613 After Tax Annualized Adj. Operating Income $ 27,262 $ 30,745 $ 30,883 $ 30,539 $ 28,501 $ 30,228 $ 32,564 $ 32,735 Average Invested Capital * $ 283,490 $ 286,347 $ 289,966 $ 293,516 $ 316,187 $ 316,270 $ 319,484 $ 319,074 ROIC 9.6% 10.7% 10.7% 10.4% 9.0% 9.6% 10.2% 10.3% * Average Invested Capital is computed using the average quarterly Share Owners equity plus current and non-current debt less cash and cash equivalents. 13 LastingLasting relationships. relationships. Global Global success. success.
