Attached files
| file | filename |
|---|---|
| EX-99.1 - EXHIBIT 99.1 - CIRRUS LOGIC, INC. | a51846138ex99_1.htm |
| 8-K - CIRRUS LOGIC, INC. 8-K - CIRRUS LOGIC, INC. | a51846138.htm |
Exhibit 99.2

Q1 FY19 Letter to Shareholders August 1, 2018

2 August 1, 2018 Dear Shareholders, Cirrus Logic’s Q1 FY19 revenue was $254.5 million, above the high end of guidance. GAAP loss per share was $0.07 and non-GAAP earnings per share was $0.28. During the quarter, the company continued to gain momentum in Android devices as several OEMs launched new smartphones and wireless headset products that utilize our technology. In FY19, we are laser focused on introducing new innovative products, broadening our customer base and executing on the strategic initiatives that we believe will fuel future growth opportunities. With a solid product roadmap and meaningful customer engagements, including expectations for content gains and new design wins, we continue to anticipate a return to year-over-year revenue growth in FY20. Figure A: Cirrus Logic Q1 FY19 GAAP Other Non-GAAP Revenue $254.5 $254.5 Gross Profit $124.5 $0.2 $124.7 Gross Margin 48.9% 49.0% Operating Expense $130.7 ($25.9) $104.8 Operating Income / (Loss) ($6.2) $26.1 $19.9 Operating Profit / (Loss) -2% 8% Other Income / (Expense) $1.7 $1.7 Income Tax Expense / (Benefit) ($0.2) $3.9 $3.7 Net Income / (Loss) ($4.3) $22.2 $17.9 Diluted EPS ($0.07) $0.35 $0.28 *Complete GAAP to Non-GAAP reconciliations available on page 13 $ millions, except EPS

3 Revenue and Gross Margins Cirrus Logic reported revenue of $254.5 million in Q1 FY19, down 16 percent sequentially and 21 percent year over year. While results exceeded guidance, the sequential decline in revenue reflects a reduction in sales of portable audio components and normal seasonal trends ahead of new product launches in the back half of the year. The year-over-year decline was driven by continued weakness in demand for portable audio products targeting the smartphone market and, to a lesser extent, the previously disclosed sale of certain lower ASP components. One customer contributed 76 percent of sales for the quarter. Our relationship with our largest customer remains outstanding with design activity continuing on various products. While we understand there is intense interest in this customer, in accordance with our policy, we do not discuss specifics about our business relationship. In the September quarter we expect revenue to range from $310 million to $350 million, up 30 percent sequentially and down 23 percent year over year at the midpoint. In addition to typical product cycle demand in the second half of the year, guidance for the quarter reflects headwinds as we expect volumes on some of our older headset solutions to decrease this year. We note, however, as highlighted elsewhere in the company’s discussion of risk factors, our customers can and frequently do change individual orders on short notice. While this generally has little to do with the health of our business, it does make predicting the Q2 and Q3 revenue split particularly challenging as we expect to be ramping heavily at this quarter boundary, and as a result small changes in timing could cause large swings in our revenue for each quarter. Figure B: Cirrus Logic Revenue Q1 FY17 to Q2 FY19 (M) *Midpoint of guidance as of August 1, 2018 $259 $429 $523 $328 $321 $426 $483 $303 $254 $330* $- $100 $200 $300 $400 $500 $600 Q1/FY17 Q2/FY17 Q3/FY17 Q4/FY17 Q1/FY18 Q2/FY18 Q3/FY18 Q4/FY18 Q1/FY19 Q2/FY19

4 GAAP gross margins in the June quarter were 48.9 percent, compared to 50.3 percent in Q4 FY18. Non-GAAP gross margins in Q1 FY19 were 49 percent, versus 50.5 percent in the prior quarter. The sequential decline in gross margin reflects higher allocated supply chain costs due to lower unit volumes than the prior quarter and, to a lesser extent, typical pricing reductions on certain products. In the September quarter, gross margin is expected to range from 48 percent to 50 percent. Operating Profit, Earnings and Cash Operating loss for the first quarter was approximately 2 percent on a GAAP basis and operating profit was 8 percent on a non-GAAP basis. GAAP operating expense was $130.7 million, down $1.2 million sequentially and up $16.3 million year over year. GAAP operating expense included $12.6 million in share-based compensation and $13.3 million in amortization of acquired intangibles. Non-GAAP operating expense was $104.8 million, down $2 million sequentially and up $9 million year over year. Cirrus Logic’s primary focus is investing in our long-term strategy, which we believe will drive future growth. In FY19, we are focused on reducing discretionary spending, deferring expenses when possible and minimizing the hiring of non-critical functions while continuing to maximize our product development activities. As a result of these efforts, operating expense for the June quarter was lower than previously anticipated. The primary drivers of the quarterly GAAP and non-GAAP operating expense are detailed in Figure C. Figure C: Primary Drivers of Q1 FY19 Operating Expense Q/Q Y/Y Variable compensation Headcount and other employee related expenses Other reductions in discretionary spending Q1 FY18 credit related to adjustment in fair value of a previously recorded liability* R&D expenditure credit lower than prior quarter Facilities-related expenses associated with increased headcount Product Development Amortization of acquisition intangibles* Share-based compensation* Variable compensation *Excluded from non-GAAP operating expense

5 In the September quarter, GAAP R&D and SG&A expenses are expected to range from $132 million to $138 million, including roughly $15 million in share-based compensation and $13 million in amortization of acquired intangibles. For the remainder of FY19, we anticipate our quarterly GAAP operating expenses to be down from the midpoint of our Q2 guidance, due to a decline in amortization of acquired intangibles from $13 million to $7 million and a slight reduction in share-based compensation. As a result, excluding the effects of share-based compensation and amortization of acquired intangibles, we expect our operating expenses for the remainder of FY19 to remain relatively flat on a quarterly basis to our Q2 guidance. We expect to continue to manage expenses prudently as we balance our long-term profitability goals with the increased investment in important R&D projects that we expect to drive future growth. Longer term, we remain committed to our target operating profit margin model in the mid-20’s. Our total headcount exiting Q1 was 1,609. GAAP loss per share for the June quarter was $0.07, compared to earnings per share of $0.19 the prior quarter and $0.64 in Q1 FY18. Non-GAAP earnings per share for the quarter were $0.28, versus $0.51 in Q4 FY18 and $0.81 in Q1 FY18. Our ending cash balance in the June quarter was approximately $386 million, down from $435 million the prior quarter. Cash from operations was approximately $4.7 million for the quarter. In the June quarter, we used $40 million to repurchase roughly one million shares at an average price of $38.87. The company has $160 million remaining in the January 2018 share repurchase authorization. We will continue to evaluate potential uses of cash, including Figure D: Cirrus Logic GAAP R&D and SG&A Expenses/Headcount Q1 FY17 to Q2 FY19 *Reflects midpoint of combined R&D and SG&A guidance as of August 1, 2018 1,336 1,379 1,406 1,444 1,467 1,529 1,568 1,596 1,609 0 10 20 30 40 50 60 70 80 90 100 110 120 130 140 Q1/FY17 Q2/FY17 Q3/FY17 Q4/FY17 Q1/FY18 Q2/FY18 Q3/FY18 Q4/FY18 Q1/FY19 Q2/FY19 Expense* SG&A R&D Headcount $M

6 acquisitions and the repurchase of shares. Net interest income is currently expected to be slightly above $1.5 million in Q2 FY19. Taxes and Inventory We realized a GAAP tax benefit for the June quarter of approximately $0.2 million on a GAAP pre-tax loss of approximately $4.5 million, resulting in an effective tax rate of 5 percent. The lower GAAP tax rate includes the tax effect of stock compensation and other discrete items that were recorded in the quarter. Non-GAAP tax expense for the quarter was approximately $3.7 million on non-GAAP pre-tax income of approximately $21.6 million, resulting in an effective tax rate of 17 percent. Non-GAAP tax expense includes approximately $3.9 million related to the tax effect of higher non-GAAP income in various jurisdictions. We currently estimate that our worldwide non-GAAP effective tax rate in FY19 will range from 16 percent to 18 percent. Q1 inventory was $173.1 million, down from $205.8 million the prior quarter. Overall, inventory is expected to decrease in the September quarter as our normal Q2 ramp is being offset by the sell-through of products built early in the calendar year. Company Strategy We are pleased with our Q1 progress as design-in activity across our portfolio was robust and we continued to execute on the strategic initiatives that we believe will position the company for future growth. During the quarter, we gained traction in Android as several OEMs launched new smartphones and digital headsets that use our boosted amplifiers, hi-fi DACs and smart codecs. We expect more end products to come to market over the next 12 months, expanding our business with existing mobile customers as well as adding new leading OEMs. We are encouraged to see accelerating OEM demand for user-experience driven features across our target markets, including flagship and mid-tier smartphones, advanced mobile accessories and connected devices in the home. As these devices have become an integral part of our daily lives consumers expect continuous improvement with regard to performance, security and
7 battery life. This is pushing OEMs to continue to add new features, more intelligence and make devices aware of the user’s environment and intent, all of which play extremely well into Cirrus Logic’s core competencies of complex analog/mixed-signal and low power signal processing. The company has traditionally provided complete solutions across the audio and voice signal chain from capture to playback. In many cases, huge growth in cloud computing has increased the need for low-latency, low-power signal processing to be done locally on the device. This local processing, or intelligent edge processing, is driving a better user experience for playback across a variety of voice processing, audio and sensing applications. On the input side, Cirrus Logic’s voice processing technologies include voice activation, capture and biometrics, which deliver, in real-time, a more secure, lower latency, high performance experience for the consumer. On the output side, our audio boosted amplifiers, haptic drivers, hi-fi DACs and smart codecs, including codecs with active noise canceling, are instrumental in delivering a best in class user experience. These growing trends and demand for intelligent edge processing in both our established audio and voice markets, as well as adjacent applications, position the company for success in the coming years. We are delighted with the success of our audio boosted amplifiers as we continue to increase penetration in a variety of smartphones. With a strong funnel of design commitments and wins at both existing and new Android customers, we expect numerous flagship and mid-tier smartphones utilizing our technology to be introduced over the next year. During the quarter, we began shipments of our 55-nanometer audio boosted amplifiers at two of the largest Android OEMs. We expanded our share with one of these OEMs as they recently launched another highvolume mid-tier smartphone. This device is using our 55-nanometer amplifier to drive higher quality, louder sound in a mono speaker. As we move into the September and December quarters, we expect to see several customers announce new flagship smartphones that use our audio boosted amplifiers, including several stereo models. We continue to invest heavily in new products, optimizing around audio quality and loudness, solution size and system power consumption. We believe this pipeline of new technology and products will enable us to continue growing our audio amplifier revenue and market share.

8 As OEMs continue to expand the usable screen area on the latest smartphones, the opportunity to innovate around new, alternative technologies that enable more space for the display is fueling the expansion of Cirrus Logic’s serviceable market. One of the key drivers of this is the elimination of buttons, which not only increases the usable screen area, but also helps improve long-term reliability and resistance to moisture by removing the mechanical switches on the smartphone. To deliver a premium user experience and truly replicate the feel of a physical button, OEMs are turning to Cirrus Logic to deliver low-latency boosted haptic drivers. These types of solutions can also be leveraged to enhance the manner in which consumers interact with their devices by enabling a force sensing interface with high-definition tactile feedback for a range of functions such as vertical scrolling, sensor effects, camera and keyboard clicks and navigation. Our engineering and marketing teams are targeting opportunities with both existing and next generation products that we believe will continue to drive growth in this product line. We are very pleased with the progress our haptic team has made and believe it is a great example of our growing opportunity to leverage existing technologies into adjacent applications. The digital headset market represents a meaningful opportunity for Cirrus Logic over the next few years. While broad-based adoption in the Android market has taken longer than anticipated, we are starting to see a considerable increase in design wins with hi-fi digital headsets, continuously adaptive ANC headsets and USB-C to 3.5-milimeter analog headset adaptors. With the scale and the necessary infrastructure in place, including tools and acoustic tuning, the company is able to support a wider range of customers in the fragmented accessory market. This past quarter, several new wireless headsets utilizing our products launched, and we expect more wired and wireless headsets and adaptors to be introduced this year. We have ongoing customer engagements with our digital, hi-fi USB-C and continuously adaptive ANC products. We are also gaining traction in wireless where we have several design wins in accessory headsets as well as multiple reference designs that deploy advanced audio and voice features. We expect this market to continue to expand as more Android OEMs transition to the USB-C interface and remove the 3.5-milimeter jack. We believe the desire to deliver a more compelling user experience will help to accelerate this transition going forward, as OEMs need more board space for other components such as haptics, additional cameras and multiple speakers and next generation wireless antennas that also introduce system design challenges.

9 We are encouraged by the progress we are experiencing across our product portfolio and remain confident in our ability to return to growth in FY20. In addition, we have a number of other core audio and voice technologies in development that have the potential to drive longerterm growth, including voice biometrics for secure voice user authentication and advanced MEMS microphones. While still in the early stages, interest in voice biometrics remains strong and we are actively engaged with a key Android customer as we continue to optimize our 28- nanometer component to enhance noise robustness, security and power consumption. During the quarter, our MEMS microphone engineering team remained focused on technology enhancements while our supply chain team continued to work with our partners to build out our wafer foundry, assembly and test capabilities. As demand for compelling audio and voice solutions continues to increase, we are also investing in numerous adjacent applications with our core mixed-signal intellectual property and expertise in low power signal processing that we believe will drive expansion of our serviceable market and position the company for long term revenue growth. Summary and Guidance For the September quarter we expect the following results: • Revenue to range between $310 million and $350 million; • GAAP gross margin to be between 48 percent and 50 percent; and • Combined GAAP R&D and SG&A expenses to range between $132 million and $138 million, including approximately $15 million in share-based compensation expense and $13 million in amortization of acquired intangibles; In summary, the company is pleased with our design-win momentum this past quarter and we remain focused on the execution of our product roadmap, expanding our customer base and capitalizing on increasing demand for compelling audio and voice components. In addition, the company is dedicated to developing a broader portfolio of products that address new

10 requirements which we believe will add incremental content opportunity over the coming years and contribute to our continued success. Sincerely, Jason Rhode Thurman Case President and Chief Executive Officer Chief Financial Officer Conference Call Q&A Session Cirrus Logic will host a live Q&A session at 5 p.m. EDT today to answer questions related to its financial results and business outlook. Participants may listen to the conference call on the Cirrus Logic website. Participants who would like to submit a question to be addressed during the call are requested to email investor.relations@cirrus.com. A replay of the webcast can be accessed on the Cirrus Logic website approximately two hours following its completion, or by calling (416) 621-4642 or toll free at (800) 585-8367 (Access Code: 9589402). Use of Non-GAAP Financial Information To supplement Cirrus Logic's financial statements presented on a GAAP basis, Cirrus has provided non- GAAP financial information, including non-GAAP net income, diluted earnings per share, diluted share count, operating profit, operating expenses, gross margins, tax expenses and tax expense impact on earnings per share. A reconciliation of the adjustments to GAAP results is included in the tables below. We are also providing guidance on our non-GAAP expected effective tax rate. We are not able to provide guidance on our GAAP tax rate or a related reconciliation without unreasonable efforts since our future GAAP tax rate depends on our future stock price and related share-based compensation information that is not currently available.

11 Non-GAAP financial information is not meant as a substitute for GAAP results, but is included because management believes such information is useful to our investors for informational and comparative purposes. In addition, certain non-GAAP financial information is used internally by management to evaluate and manage the company. The non-GAAP financial information used by Cirrus Logic may differ from that used by other companies. These non-GAAP measures should be considered in addition to, and not as a substitute for, the results prepared in accordance with GAAP. Safe Harbor Statement Except for historical information contained herein, the matters set forth in this shareholder letter contain forward-looking statements, including statements about future revenue growth and market opportunities, including growth in our boosted haptic driver product line; future new product introductions and expected customer product introductions and ramps over the coming quarters; our expectations for future content gains and new design wins at existing and new customers; our ability to manage our operating expenses for the remainder of fiscal year 2019; our forecasts for revenue and operating expenses in fiscal year 2019; our forecasts for a return to year-over-year revenue growth during fiscal year 2020; effective tax rates for fiscal year 2019 and future years; our ability to achieve mid-20 percent operating profit in the longer term; and our forecasts for the second quarter of fiscal year 2019 revenue, profit, net interest income, gross margin, combined research and development and selling, general and administrative expense levels, share-based compensation expense, amortization of acquired intangibles and inventory levels. In some cases, forward-looking statements are identified by words such as “emerge,” “expect,” “anticipate,” “foresee,” “target,” “project,” “believe,” “goals,” “opportunity,” “estimates,” “intend,” “will,” and variations of these types of words and similar expressions. In addition, any statements that refer to our plans, expectations, strategies or other characterizations of future events or circumstances are forward-looking statements. These forward-looking statements are based on our current expectations, estimates and assumptions and are subject to certain risks and uncertainties that could cause actual results to differ materially. These risks and uncertainties include, but are not limited to, the following: the level and timing of orders and shipments during the second quarter of fiscal year 2019 and fiscal year 2019, customer cancellations of orders, or the failure to place orders consistent with forecasts; changes with respect to our current expectations of future smartphone unit volumes; any delays in the timing and/or success of customers’ new product ramps; failure to win new designs or additional content as expected at Android customers; any changes in U.S. trade policy, including potential adoption and expansion of trade restrictions, higher tariffs, or cross border taxation by the U.S. government involving other countries, particularly China, that might impact overall customer demand for our products or affect our ability to manufacture and/or sell our products overseas; and the risk factors listed in our Form 10-K for the year ended March 31, 2018 and in our other filings with the Securities and Exchange Commission, which are available at www.sec.gov. The foregoing information concerning our business outlook represents our outlook as of the date of this news release, and we undertake no obligation to update or revise any forward-looking statements, whether as a result of new developments or otherwise. Cirrus Logic and Cirrus are registered trademarks of Cirrus Logic, Inc. All other company or product names noted herein may be trademarks of their respective holders. Summary financial data follows:

12 Jun. 30, Mar. 31, Jun. 24, 2018 2018 2017 Q1'19 Q4'18 Q1'18 Portable audio products $ 212,260 $ 262,777 $ 280,688 Non-portable audio and other products 42,223 40,396 40,047 Net sales 254,483 303,173 320,735 Cost of sales 129,924 150,543 159,019 Gross profit 124,559 152,630 161,716 Gross margin 48.9% 50.3% 50.4% Research and development 97,932 95,556 83,557 Selling, general and administrative 32,784 36,307 30,859 Total operating expenses 130,716 131,863 114,416 Income (loss) from operations (6,157) 20,767 47,300 Interest income (expense), net 1,447 1,378 594 Other income (expense), net 210 (158) (19) Income (loss) before income taxes (4,500) 21,987 47,875 Provision (benefit) for income taxes (228) 9,983 4,963 Net income (loss) $ (4,272) $ 12,004 $ 42,912 Basic earnings (loss) per share: $ (0.07) $ 0.19 $ 0.67 Diluted earnings (loss) per share: $ (0.07) $ 0.19 $ 0.64 Weighted average number of shares: Basic 61,462 62,654 64,097 Diluted 61,462 64,572 67,160 CONSOLIDATED CONDENSED STATEMENT OF OPERATIONS (unaudited) (in thousands, except per share data) Three Months Ended Prepared in accordance with Generally Accepted Accounting Principles
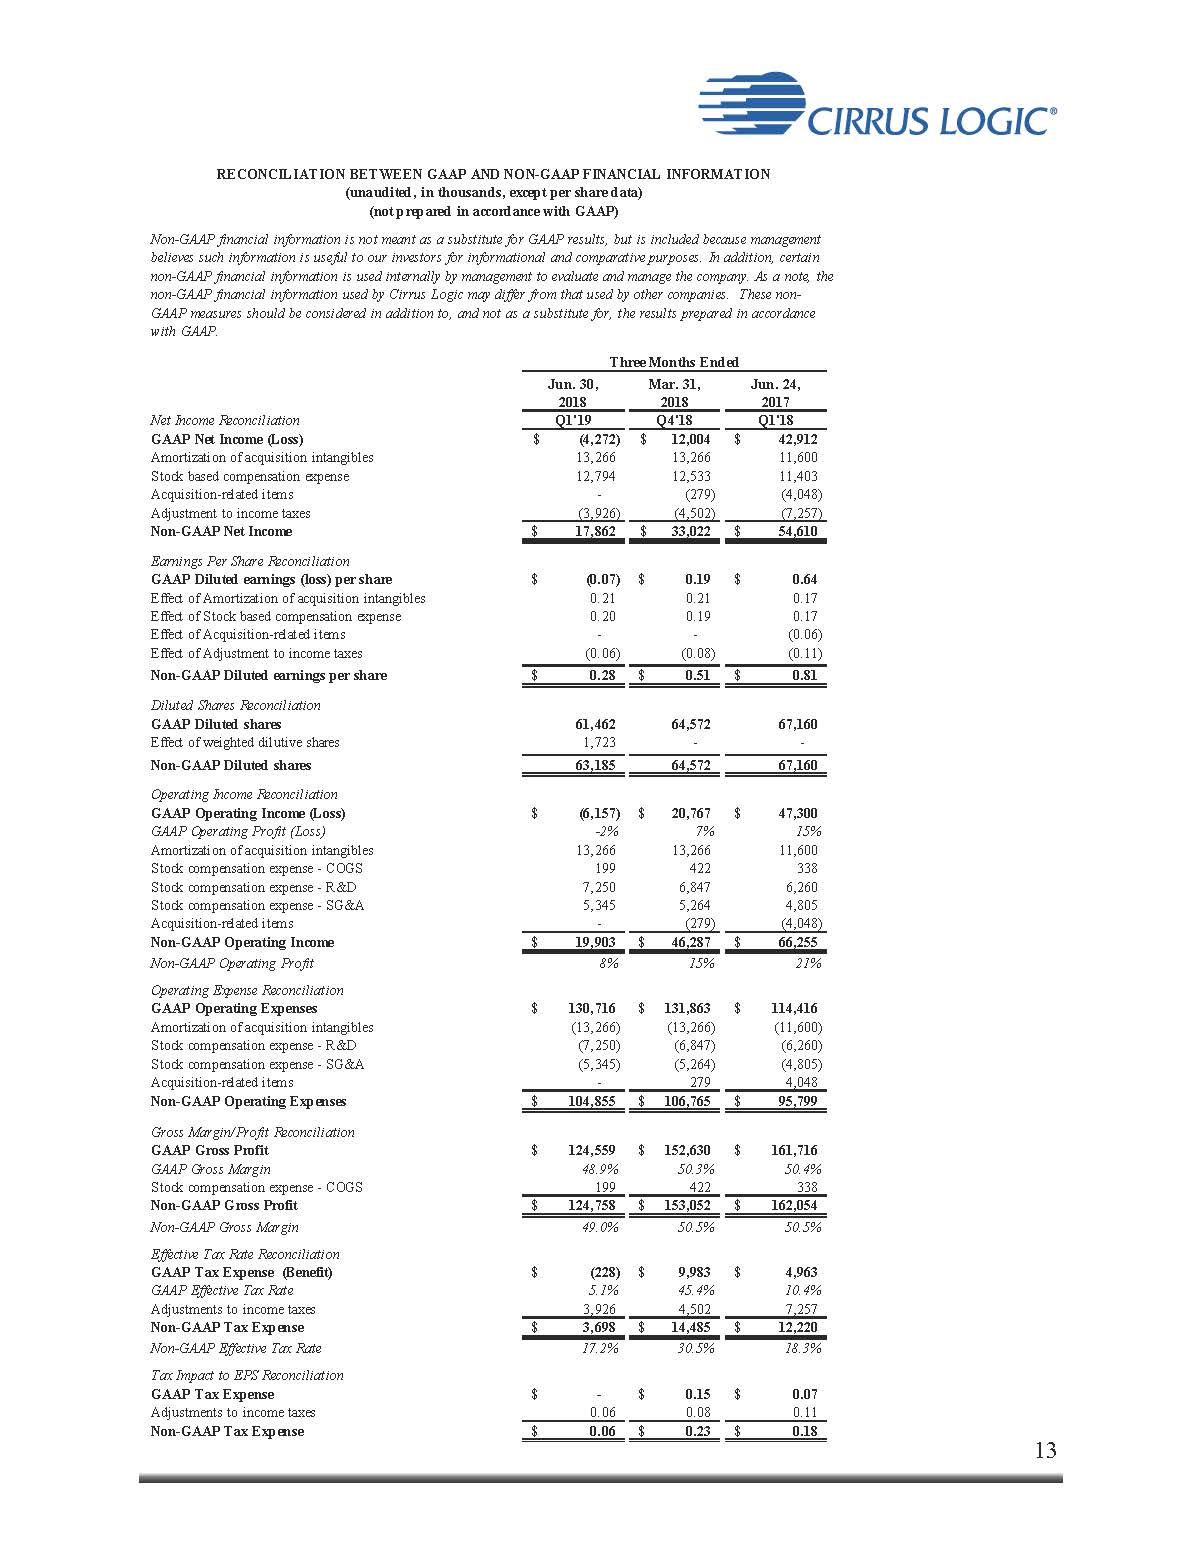
13 Jun. 30, Mar. 31, Jun. 24, 2018 2018 2017 Net Income Reconciliation Q1'19 Q4'18 Q1'18 GAAP Net Income (Loss) $ (4,272) $ 12,004 $ 42,912 Amortization of acquisition intangibles 13,266 13,266 11,600 Stock based compensation expense 12,794 12,533 11,403 Acquisition-related items - (279) (4,048) Adjustment to income taxes (3,926) (4,502) (7,257) Non-GAAP Net Income $ 17,862 $ 33,022 $ 54,610 Earnings Per Share Reconciliation GAAP Diluted earnings (loss) per share $ (0.07) $ 0.19 $ 0.64 Effect of Amortization of acquisition intangibles 0.21 0.21 0.17 Effect of Stock based compensation expense 0.20 0.19 0.17 Effect of Acquisition-related items - - (0.06) Effect of Adjustment to income taxes (0.06) (0.08) (0.11) Non-GAAP Diluted earnings per share $ 0.28 $ 0.51 $ 0.81 Diluted Shares Reconciliation GAAP Diluted shares 61,462 64,572 67,160 Effect of weighted dilutive shares 1,723 - - Non-GAAP Diluted shares 63,185 64,572 67,160 Operating Income Reconciliation GAAP Operating Income (Loss) $ (6,157) $ 20,767 $ 47,300 GAAP Operating Profit (Loss) -2% 7% 15% Amortization of acquisition intangibles 13,266 13,266 11,600 Stock compensation expense - COGS 199 422 338 Stock compensation expense - R&D 7,250 6,847 6,260 Stock compensation expense - SG&A 5,345 5,264 4,805 Acquisition-related items - (279) (4,048) Non-GAAP Operating Income $ 19,903 $ 46,287 $ 66,255 Non-GAAP Operating Profit 8% 15% 21% Operating Expense Reconciliation GAAP Operating Expenses $ 130,716 $ 131,863 $ 114,416 Amortization of acquisition intangibles (13,266) (13,266) (11,600) Stock compensation expense - R&D (7,250) (6,847) (6,260) Stock compensation expense - SG&A (5,345) (5,264) (4,805) Acquisition-related items - 279 4,048 Non-GAAP Operating Expenses $ 104,855 $ 106,765 $ 95,799 Gross Margin/Profit Reconciliation GAAP Gross Profit $ 124,559 $ 152,630 $ 161,716 GAAP Gross Margin 48.9% 50.3% 50.4% Stock compensation expense - COGS 199 422 338 Non-GAAP Gross Profit $ 124,758 $ 153,052 $ 162,054 Non-GAAP Gross Margin 49.0% 50.5% 50.5% Effective Tax Rate Reconciliation GAAP Tax Expense (Benefit) $ (228) $ 9,983 $ 4,963 GAAP Effective Tax Rate 5.1% 45.4% 10.4% Adjustments to income taxes 3,926 4,502 7,257 Non-GAAP Tax Expense $ 3,698 $ 14,485 $ 12,220 Non-GAAP Effective Tax Rate 17.2% 30.5% 18.3% Tax Impact to EPS Reconciliation GAAP Tax Expense $ - $ 0.15 $ 0.07 Adjustments to income taxes 0.06 0.08 0.11 Non-GAAP Tax Expense $ 0.06 $ 0.23 $ 0.18 (not prepared in accordance with GAAP) RECONCILIATION BETWEEN GAAP AND NON-GAAP FINANCIAL INFORMATION (unaudited, in thousands, except per share data) Non-GAAP financial information is not meant as a substitute for GAAP results, but is included because management believes such information is useful to our investors for informational and comparative purposes. In addition, certain non-GAAP financial information is used internally by management to evaluate and manage the company. As a note, the non-GAAP financial information used by Cirrus Logic may differ from that used by other companies. These non- GAAP measures should be considered in addition to, and not as a substitute for, the results prepared in accordance with GAAP. Three Months Ended

14 Jun. 30, Mar. 31, Jun. 24, 2018 2018 2017 ASSETS Current assets